
Abstract
Background:
Computer-aided data validation enhanced by centralized monitoring algorithms is a more powerful tool for data cleaning compared to manual source document verification (SDV). This fact led to the growing popularity of risk-based monitoring (RBM) coupled with reduced SDV and centralized statistical surveillance. Since RBM models are new and immature, there is a lack of consensus on practical implementation. Existing RBM models’ weaknesses include (1) mixing data monitoring and site process monitoring (ie, micro vs macro level), making it more complex, obscure, and less practical; and (2) artificial separation of RBM from data cleaning leading to resource overutilization. The authors view SDV as an essential part (and extension) of the data-validation process.
Methods:
This report offers an efficient and scientifically grounded model for SDV. The innovative component of this model is in making SDV ultimately a part of the query management process. Cost savings from reduced SDV are estimated using a proprietary budget simulation tool with percent cost reductions presented for four study sizes in four therapeutic areas.
Results:
It has been shown that an “on-demand” (query-driven) SDV model implemented in clinical trial monitoring could result in cost savings from 3% to 14% for smaller studies to 25% to 35% or more for large studies.
Conclusions:
(1) High-risk sites (identified via analytics) do not necessarily require a higher percent SDV. While high-risk sites require additional resources to assess and mitigate risks, in many cases these resources are likely to be allocated to non-SDV activities such as GCP, training, etc. (2) It is not necessary to combine SDV with the GCP compliance monitoring. Data validation and query management must be at the heart of SDV as it makes the RBM system more effective and efficient. Thus, focusing SDV effort on queries is a promising strategy. (3) Study size effect must be considered in designing the monitoring plan since the law of diminishing returns dictates focusing SDV on “high-value” data points. Relatively lower impact of individual errors on the study results leads to realization that larger studies require less data cleaning, and most data (including most critical data points) do not require SDV. Subsequently, the most significant economy is expected in larger studies.
Keywords
Background: Current RBM Process and Its Main Flaws
According to TransCelerate, the current RBM (Figure 1) “approach includes early and recurrent risk assessment, identification of Critical Data to be monitored for risk mitigation, Off-site and Central Monitoring as the foundation, and targeting of On-site Monitoring visits.” 1

Traditional risk-based monitoring (RBM) model.
Suspicious (“high risk”) subjects or sites are determined by statistical algorithms as a part of the central monitoring process, based on the FDA-recommended approach to focus on “sites with data anomalies or a higher frequency of errors, protocol violations, or dropouts relative to other sites.” 2 Grimes, 3 Burgess, 4 Landray, 5 and Dudley 6 provided examples of data visualization tools facilitating the search for high-risk sites and subjects. Lindblad et al 7 also provided a list of criteria for high-risk sites. Ning Li 8 reported details of statistical data processing in a typical case that involves central monitoring.
Methods underlying current RBM discussion require additional implementation details to support consistency and optimization of the SDV processes. The weaknesses of the current methodology are as follows: Separation of RBM from data cleaning. In actuality, the monitoring process is part of data-cleaning efforts and should be examined as such. Mixing data monitoring and site process monitoring (ie, micro vs macro level) makes it more complex, obscure, and less practical. “For example, if the Monitor identifies a potential issue with lack of Investigator involvement, there is no need to escalate the amount of SDV since it is not a transcription issue” (TransCelerate
1
). Too many risk and quality factors make it difficult to implement. Furthermore, analytical tools for site-specific risk identification generate “lots of false positives,” which is an additional source of inefficiency (Torche
9
). Perfection and complexity are enemies of good and practicality in this case. “Risk scores” are often calculated as continuous variables when dichotomous or categorical assessment is more practical. Continuous variables create a focus on outliers and cause subjective categorization into “high concern,” “moderate concern,” “mild concern,” and “no concern” data, and these probabilistic “risk” models are not cross-validated (Lindblad et al
7
). Current probabilistic models focus on site-level risks. However, to eliminate waste, a more granular-level discussion around data point–level risks is necessary. The majority of current central monitoring algorithms are heavily dependent on sample size, thus making them insensitive for smaller trials to be practical,
i
especially at the beginning of a trial, when the data quality (DQ) assessment is expected to occur (even for studies with hundreds of subjects) (Torche
9
). (Even statistics has its limits, when the amount of data are limited!) This inherent limitation of risk identification algorithms will limit their usefulness and impede their “market penetration.” These algorithms are used primarily because (1) no better alternative is available, (2) clinical research operations are not trained to detect these fundamental deficiencies (Alsumidaie
10
), and (3) clinical operations’ resistance to rely on statisticians (Eric
11
). Prospective knowledge of “what is /what is not subject of SDV” leads to reduced effort by the study site personnel, and lowers data quality.
Extended RBM Model
With the advent of the RBM paradigm, it was no longer necessary to combine SDV with the GCP compliance monitoring. The TransCelerate white paper was an important step in this direction and welcomed separation of “critical data” and “processes”—the main building blocks of site monitoring. 1 We agree with TransCelerate’s argument that such division “enables companies to prioritize the high-value task of compliance checks and de-prioritize the low-value task of checking for transcription errors.” However, this division on data and process level is not trivial and adds complexity.
In a similar fashion, the Extended RBM model (Figure 2) differentiates between data point (micro level) and site/process level (macro level) of monitoring. At the data point level (illustrated by the feedback loop at the top of Figure 2), data monitoring is driven by queries and frequently results in data point level changes. On the other hand, at the site level (illustrated by the feedback loop at the bottom of Figure 2), monitoring is substantially different. It results in (1) identifying “high-risk” sites and (2) mitigating such risks via additional site personnel training or process modification.
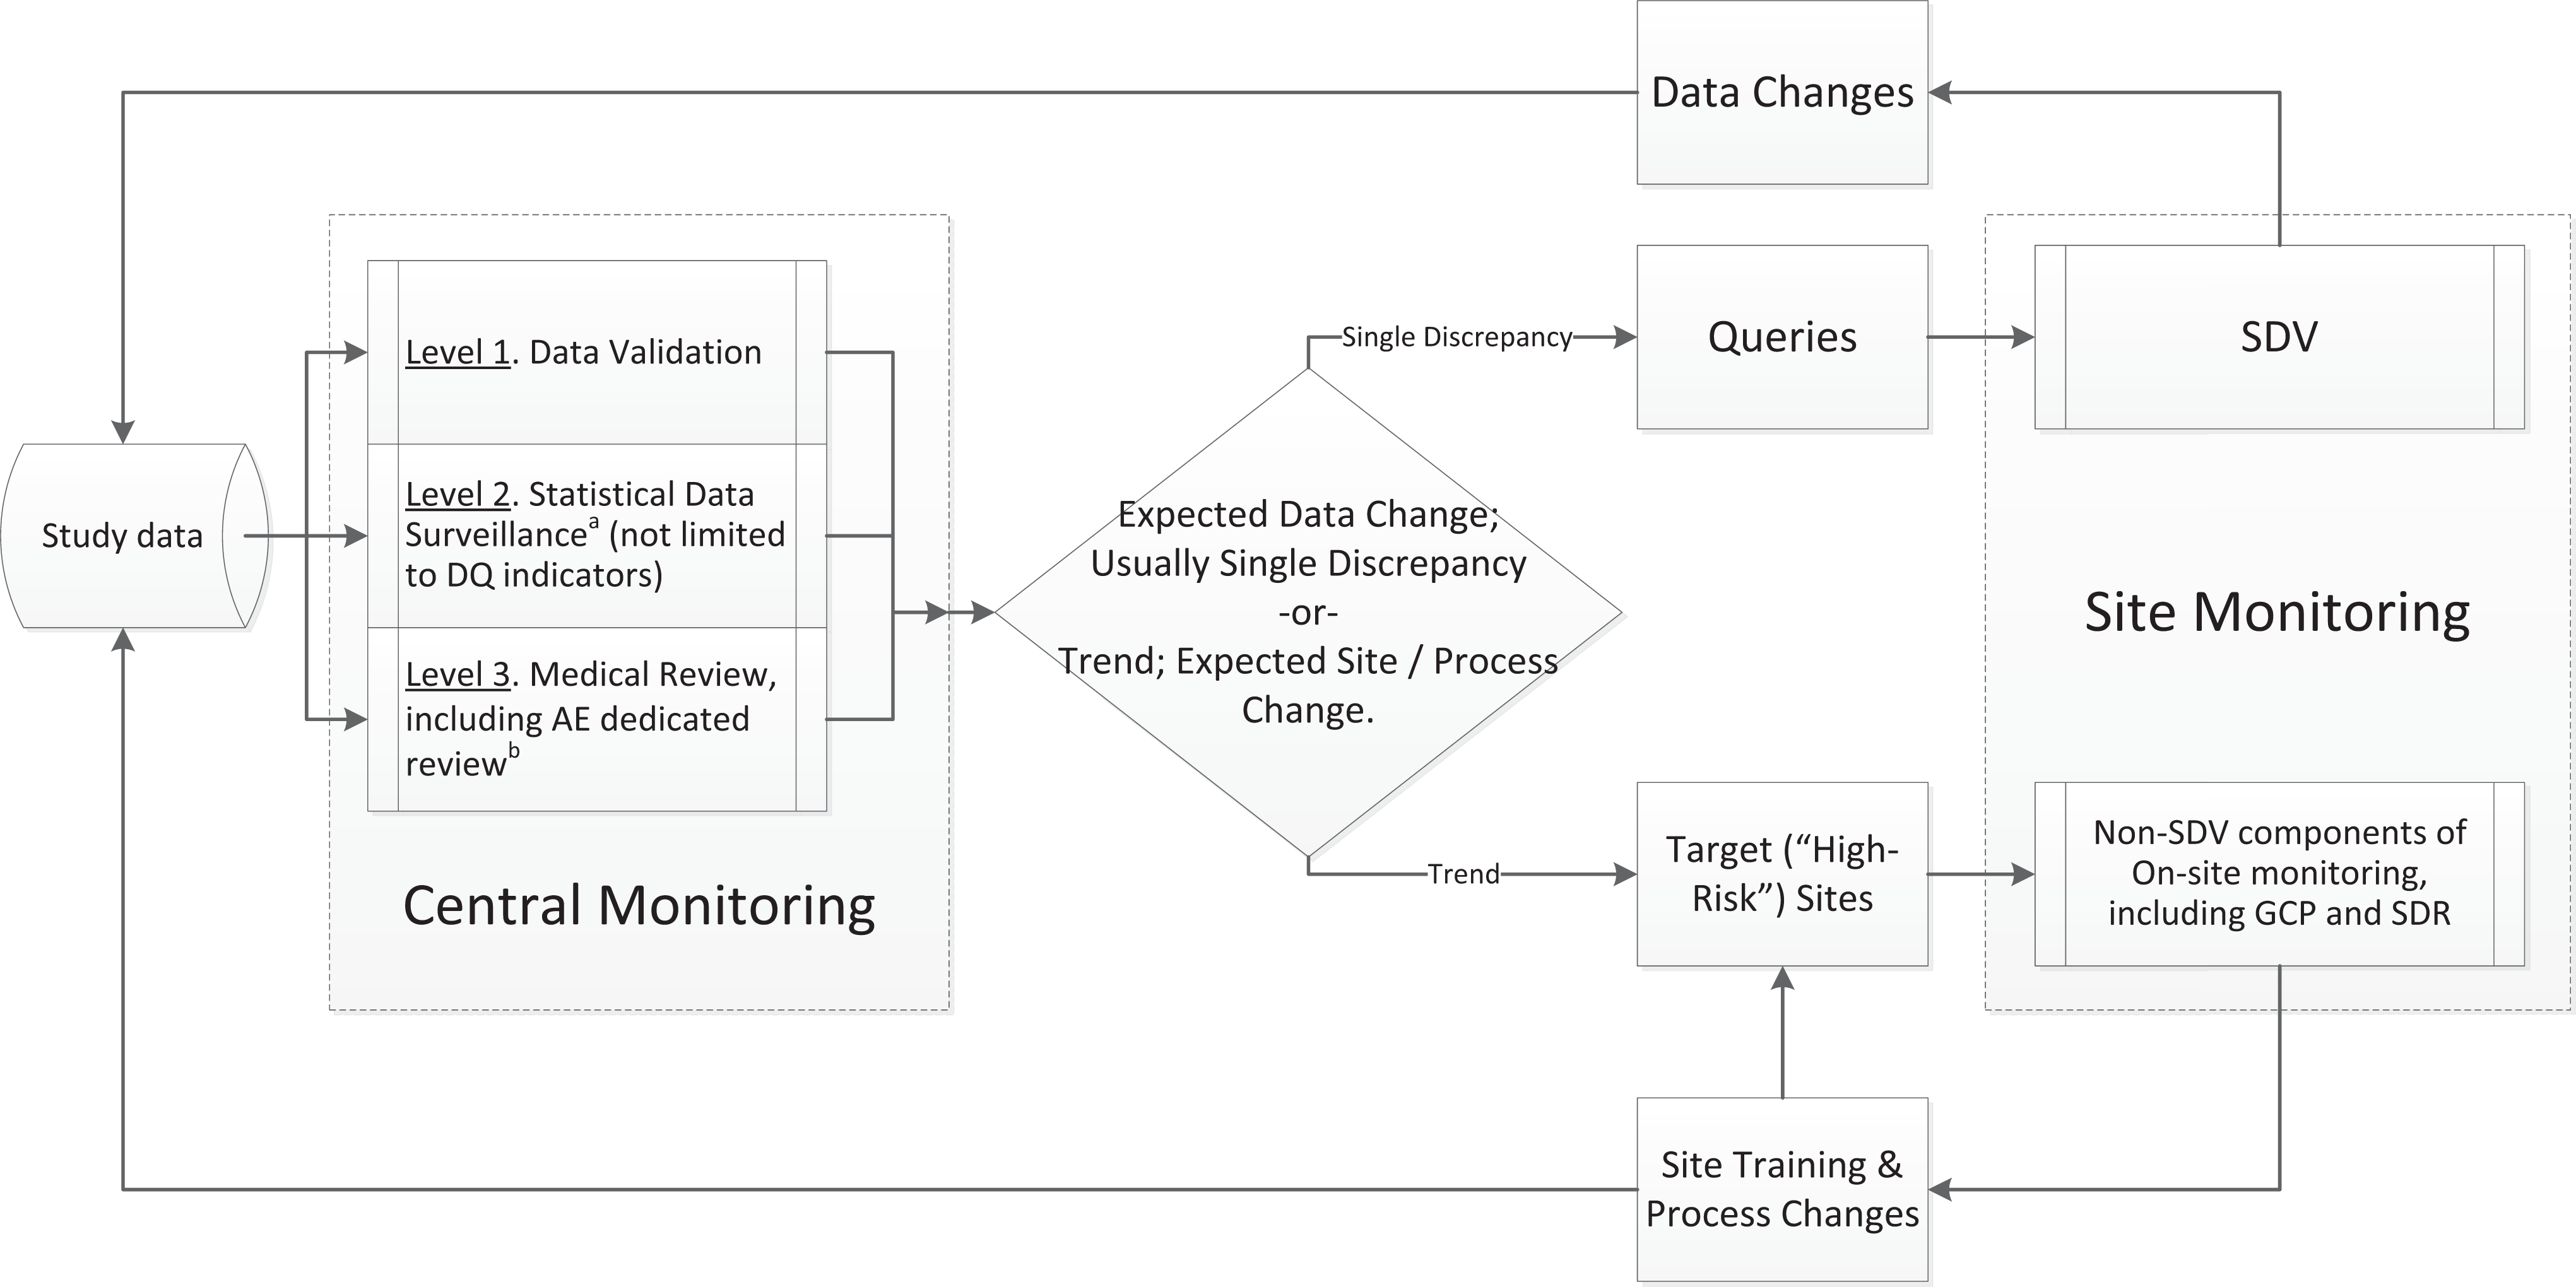
Data cleaning and monitoring flow: Extended risk-based monitoring (RBM) model.
As Figure 2 illustrates, the process flow includes three major steps and three sub-steps, the first three constitute central monitoring. (For a detailed discussion on the relevant terminology, see Appendix A.) Central monitoring (team effort), including: data validation/edit checks (by data managers [DMs]), statistical data surveillance (by statistics and DMs), medical review (by qualified medical personnel) Query management (by DMs, CRAs, site staff), and On-site monitoring (by CRAs).
This model demonstrates the role and power of data validation, statistical data surveillance, clinical/medical review, query resolution, and on-site monitoring leading to optimal resource allocation for data error correction. By incorporating data validation into the data quality assessment at the earliest stages of review and SDV, this model helps to uncover unnecessary redundancies and provides justification for scaling down the SDV efforts toward optimal level. 12 The three central monitoring levels depicted in Figure 2 aim not only to reduce data errors but also to identify protocol deviations, scientific misconduct, and GCP noncompliance and ensure that the protocol is being followed and the collected data are in accordance with protocol objectives. The distinction between these central monitoring levels is not in their objectives, but in utilization of different tools and skill sets to accomplish goals.
Finally, the Extended RBM model reflects on the more complex and intelligent nature of RBM. It demonstrates the increasing role of those who are trained in interpreting “errors that matter” (data experts) in planning and executing monitoring activities. Thus, to take full advantage of RBM, some job roles need to be redefined and training required. Furthermore, this model prompts the change in quality metrics utilization. Query rate will likely lose its appeal as less informative relative to such metrics as query effectiveness rates and the rates of data modifications (for multiple categories: [1] overall data modification rate, [2] SDV-induced data modifications, and [3] changes in key variable of analysis). Most importantly, the Extended RBM model also demonstrates the importance of “query” in the data cleaning and monitoring process and suggests limiting SDV to the data points that are subject to query.
The subsequent discussion focuses primarily on the SDV and other data point–level error identification/correction components of the monitoring activities illustrated by Extended RBM model while leaving other (process/site-level) components out of scope.
New/Simplified Risk-Based SDV Method: Laser Precision/Minimum Invasion
Our earlier paper (Tantsyura et al 12 ) and the evidence above suggest that data validation and query management must be at the heart of SDV, as it makes the RBM system effective and efficient. Computer-aided data validation (enhanced by centralized monitoring algorithms) is an inherently and appreciably more powerful tool for data cleaning relative to manual SDV (Tantsyura et al, 12 Scheetz et al 13 ). Furthermore, since data point–level issue identification by the CRA is not critical (TransCelerate, 1 FDA, 2 Mitchel 2011, 14 Bakobaki, 15 Mitchel 2014 16 ), we advocate for a model in which SDV serves as the QC step for the “highly suspicious” data points that are identified during previous (centralized monitoring) steps, such as data validation, statistical data review, and surveillance and medical review. Finally, since queries typically involve 7% to 8% of data points (TransCelerate 1 ), focusing SDV efforts on queries has the potential to drop SDV effort by 92% to 93% without a noticeable risk increase.
The proposed process and implementation approach is presented in Tables 1 and 2 and Appendix B. The first step in the proposed approach is “planning” that includes documenting the key data points. The next step is examination of these data points from the potential data discrepancy perspective and dividing them into 3 categories: (a) those that can and will be “cleaned” exclusively via edit checks and other statistical computer-aided methods, (b) those that will require manual review and manual queries, and (c) those that cannot be cleaned using methods a and b but are important enough and will require SDV to identify the potential discrepancies (some study eligibility criteria, for example). In cases where errors are easily detectable by computer algorithms (edit checks, method a), there is no need for SDV other than of queried data points. Subsequently, if the “medical review” (method b) is perceived as being the most effective in identifying data discrepancies for particular data points, then these data points should be crossed off the SDV list and performed only for queried data. In case error detection is noncomputerizable or cannot be identified via remote medical review (various types of protocol violations, for example; method c), the study team should develop (prospectively) a list of data points that require thorough investigation (including manual SDV). Finally, the impact of the study size must be assessed.
Categories of data by risk of nonidentifying discrepancies without SDV.
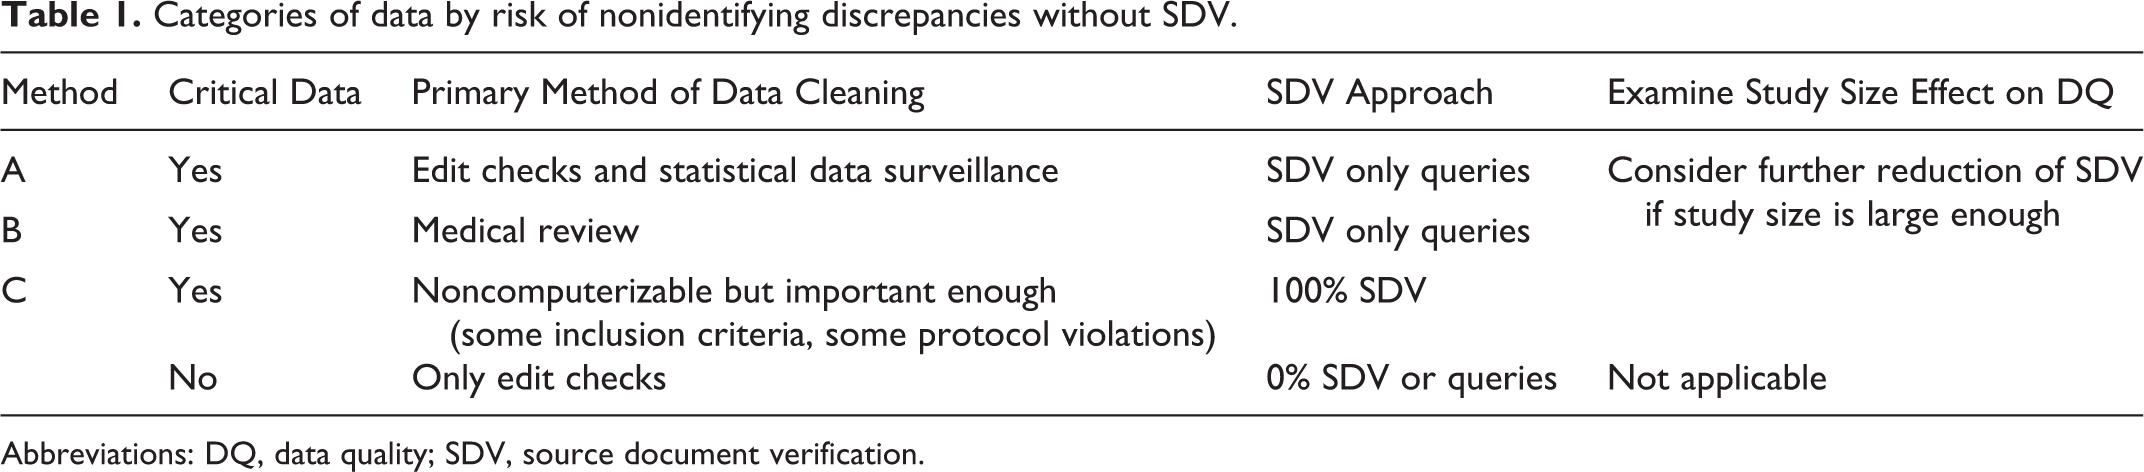
Abbreviations: DQ, data quality; SDV, source document verification.
Proposed SDV approach.
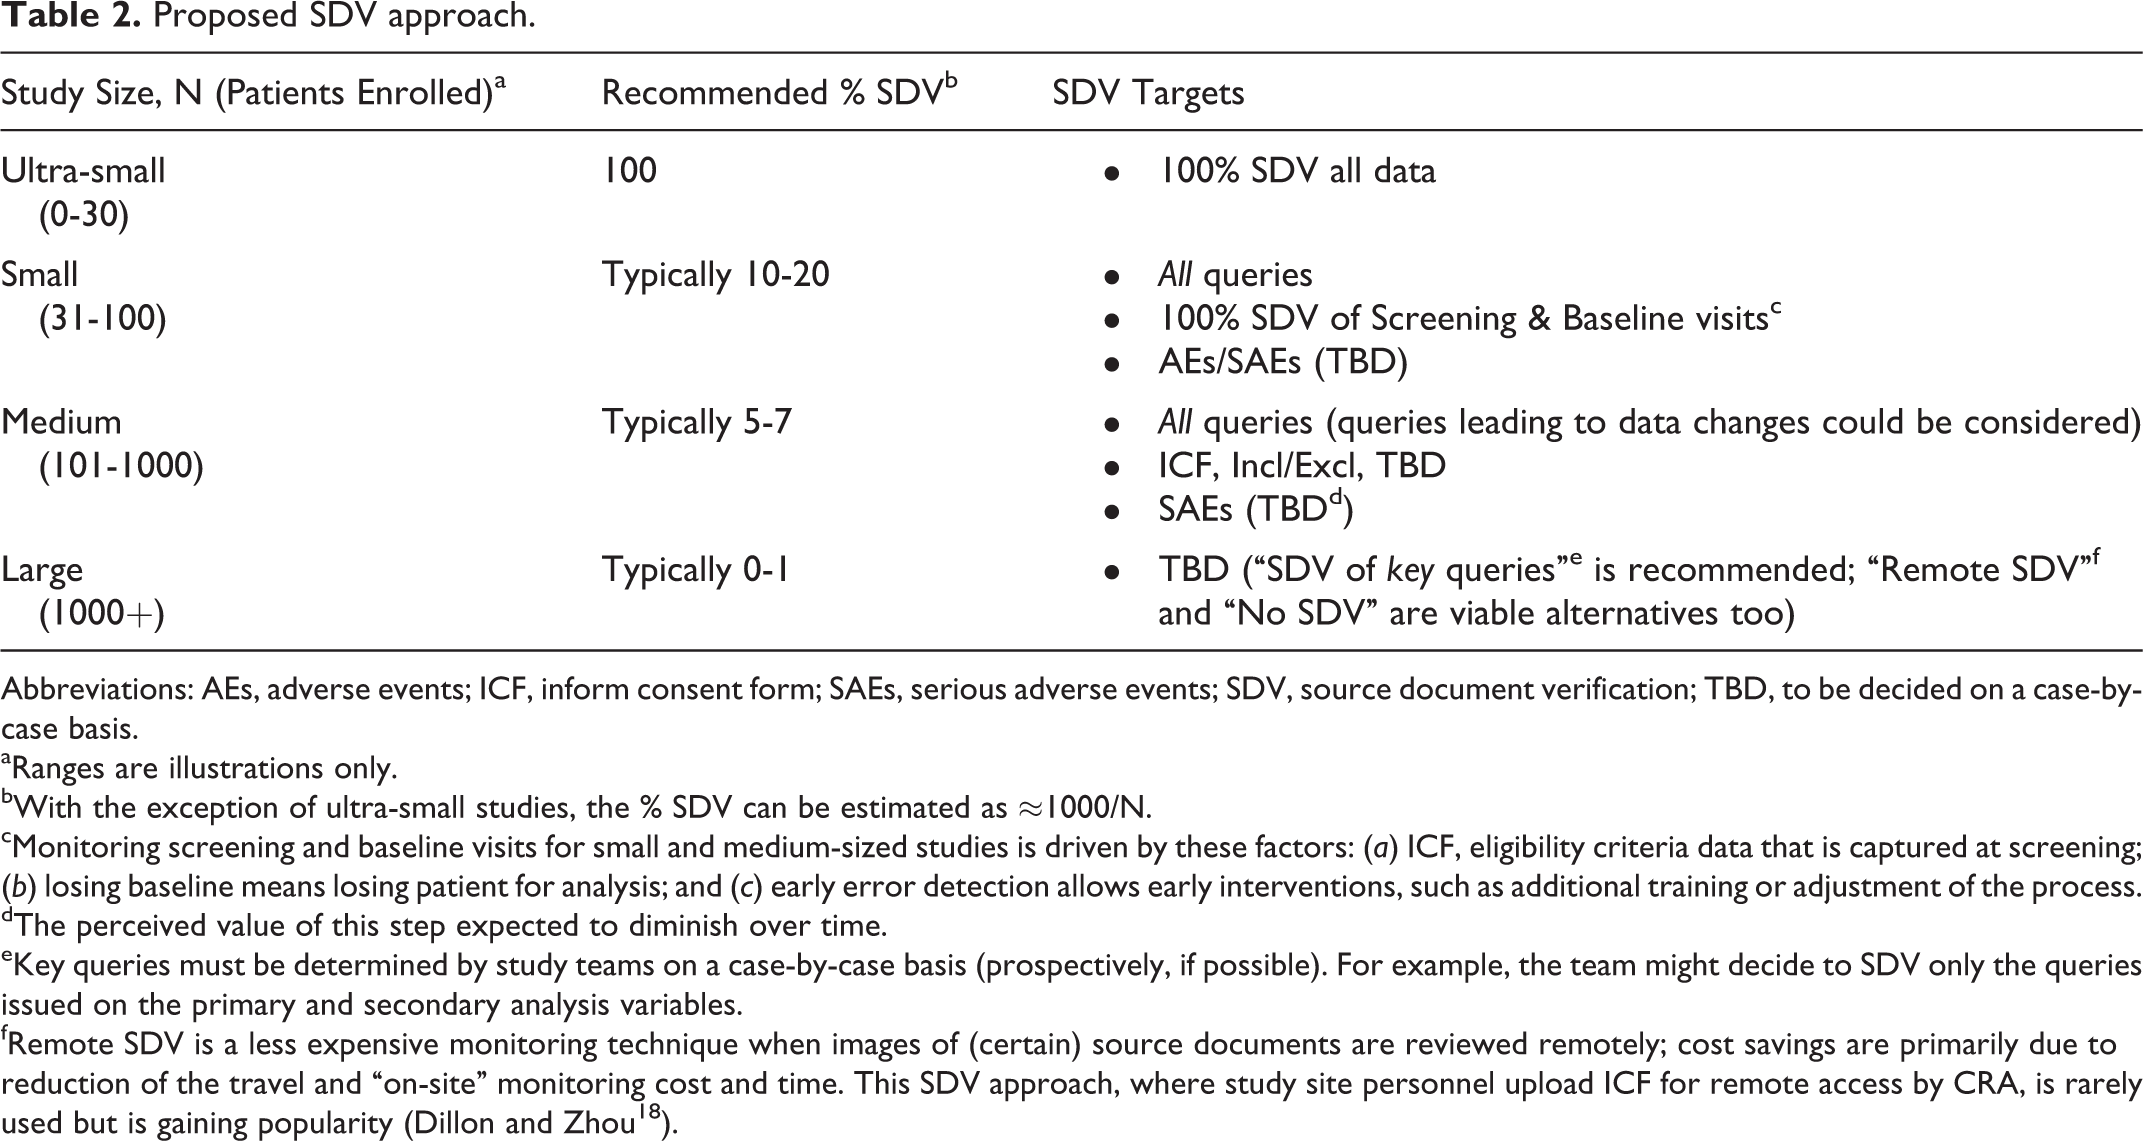
Abbreviations: AEs, adverse events; ICF, inform consent form; SAEs, serious adverse events; SDV, source document verification; TBD, to be decided on a case-by-case basis.
aRanges are illustrations only.
bWith the exception of ultra-small studies, the % SDV can be estimated as ≈1000/N.
cMonitoring screening and baseline visits for small and medium-sized studies is driven by these factors: (a) ICF, eligibility criteria data that is captured at screening; (b) losing baseline means losing patient for analysis; and (c) early error detection allows early interventions, such as additional training or adjustment of the process.
dThe perceived value of this step expected to diminish over time.
eKey queries must be determined by study teams on a case-by-case basis (prospectively, if possible). For example, the team might decide to SDV only the queries issued on the primary and secondary analysis variables.
fRemote SDV is a less expensive monitoring technique when images of (certain) source documents are reviewed remotely; cost savings are primarily due to reduction of the travel and “on-site” monitoring cost and time. This SDV approach, where study site personnel upload ICF for remote access by CRA, is rarely used but is gaining popularity (Dillon and Zhou 18 ).
Contrary to the historical monitoring approach, when SDV preceded data validation, in the Extended RBM model, SDV serves primarily as a logical extension or a sub-step of the query management process. At the same time, this proposal does not contradict GCDMP recommendation that “source data verification (SDV) may be used to identify errors that are difficult to catch with programmatic checks” (GCDMP 17 ). It just reduces the importance of this step according to its real value. Table 2 provides the implementation details for the proposed on-demand query-driven approach to SDV.
First, this model allows reducing SDV (dictated by law of diminishing returns driving the process) from 100% for ultra-small studies to virtually 0% for large studies allowing for the ability to intelligently eliminate waste. (For a detailed discussion on study size effect, see Tantsyura et al. 12 ) Second, this model overcomes monitors’ concern that reduced SDV models (especially when the SDV model is prospectively known to the site staff) might lead to reduced data quality. Queries (which drive the SDV process) are fairly random, so site staff will not know which data points will be monitored, and this model will not lower their data collection quality. A limitation inherent in any system is the element of human error, and SDV reduction leads to less reliance on human review, lower variability, and higher data quality. Third, reduced SDV creates an opportunity for “remote data review” for medium to large studies, leading to reduced travel time and cost. Fourth, this model provides the flexibility to adopt recommendations by TranCelerate’s position paper: “use of Risk Indicators and Thresholds—identification of key performance indicators in a process control system (PCS) environment to track site and study performance; and adjustment of monitoring activities based on the issues and risks identified throughout the study—adaptive, real-time modification of SDV and other monitoring tools.” 1
Finally, a tailored prospective monitoring plan, which constitutes a significant change relative to the existing processes and organizational habits, is the most crucial component of the successful RBM implementation. Cross-functional collaboration, education, and formal change management are essential in order to overcome the organizational resistance and accelerate the RBM adoption.
Economic Impact
Figure 3 lays out the overall monitoring effort reduction associated with the proposed SDV method relative to 100% SDV. Monitoring effort is displayed as a combination of (1) GCP compliance/process monitoring, (2) source document review (SDR), (3) SDV, and (4) nominal increase in central monitoring planning efforts and training, including assurance that the site personnel are trained and following the protocol. The SDV category reduction is the most dramatic one. In addition to travel expense, the savings include CRA travel time and CRA time on-site that is saved because fewer visits are required to SDV the reduced data percent (less than 8% on average).
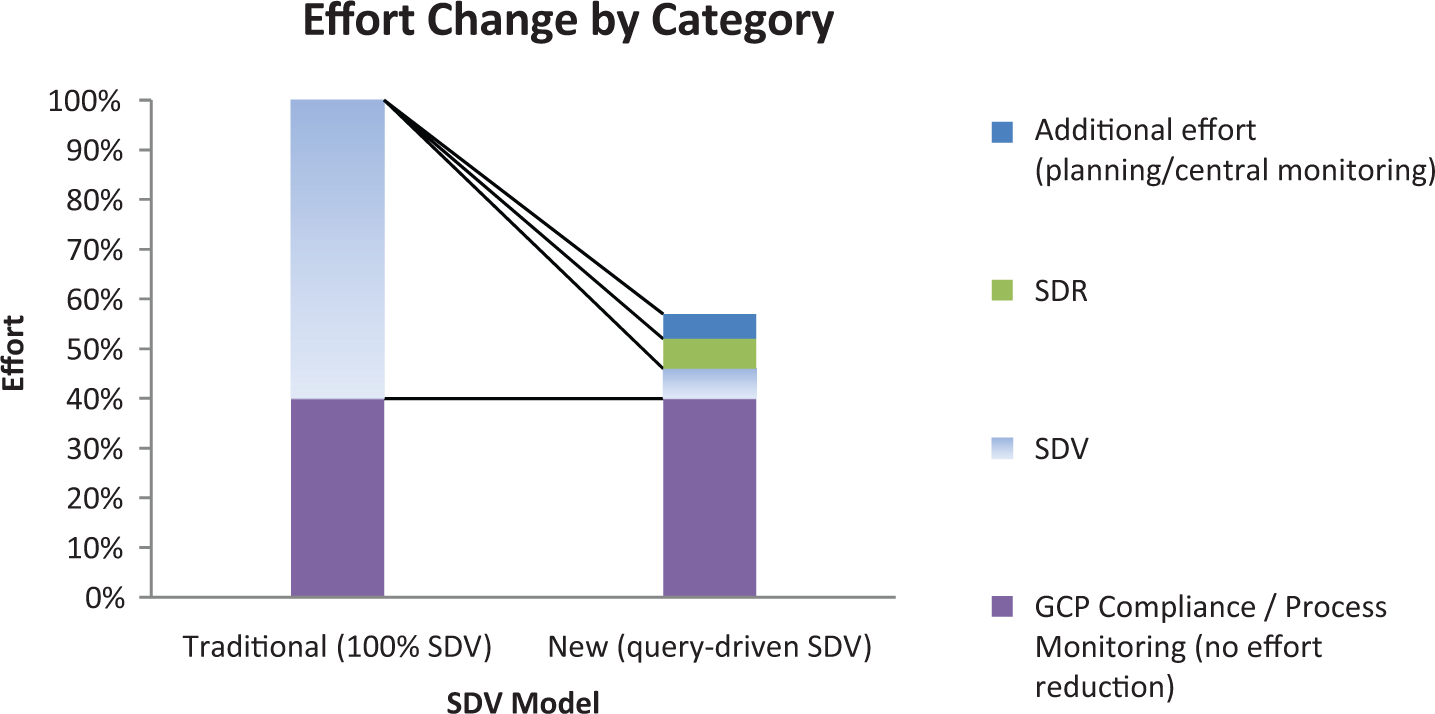
Monitoring effort reduction (large hypothetical study).
Table 3 presents project cost savings estimates that were modeled using a leading contract research organization’s (CRO’s) proprietary price estimation tool. Cost savings relative to 100% SDV were modeled for the lower and upper limits of 3 study subject sample size ranges in 4 therapeutic areas (oncology, cardiovascular, neurology, and endocrine). Study variables for the 48 scenarios included the following: screening factor, enrollment rate, CRF pages per subject, SDV time per CRF page, study subjects per site, study timeline periods (eg, treatment period), etc. Only percentage reductions are reported. For more details, please contact the authors.
Estimated cost savings.
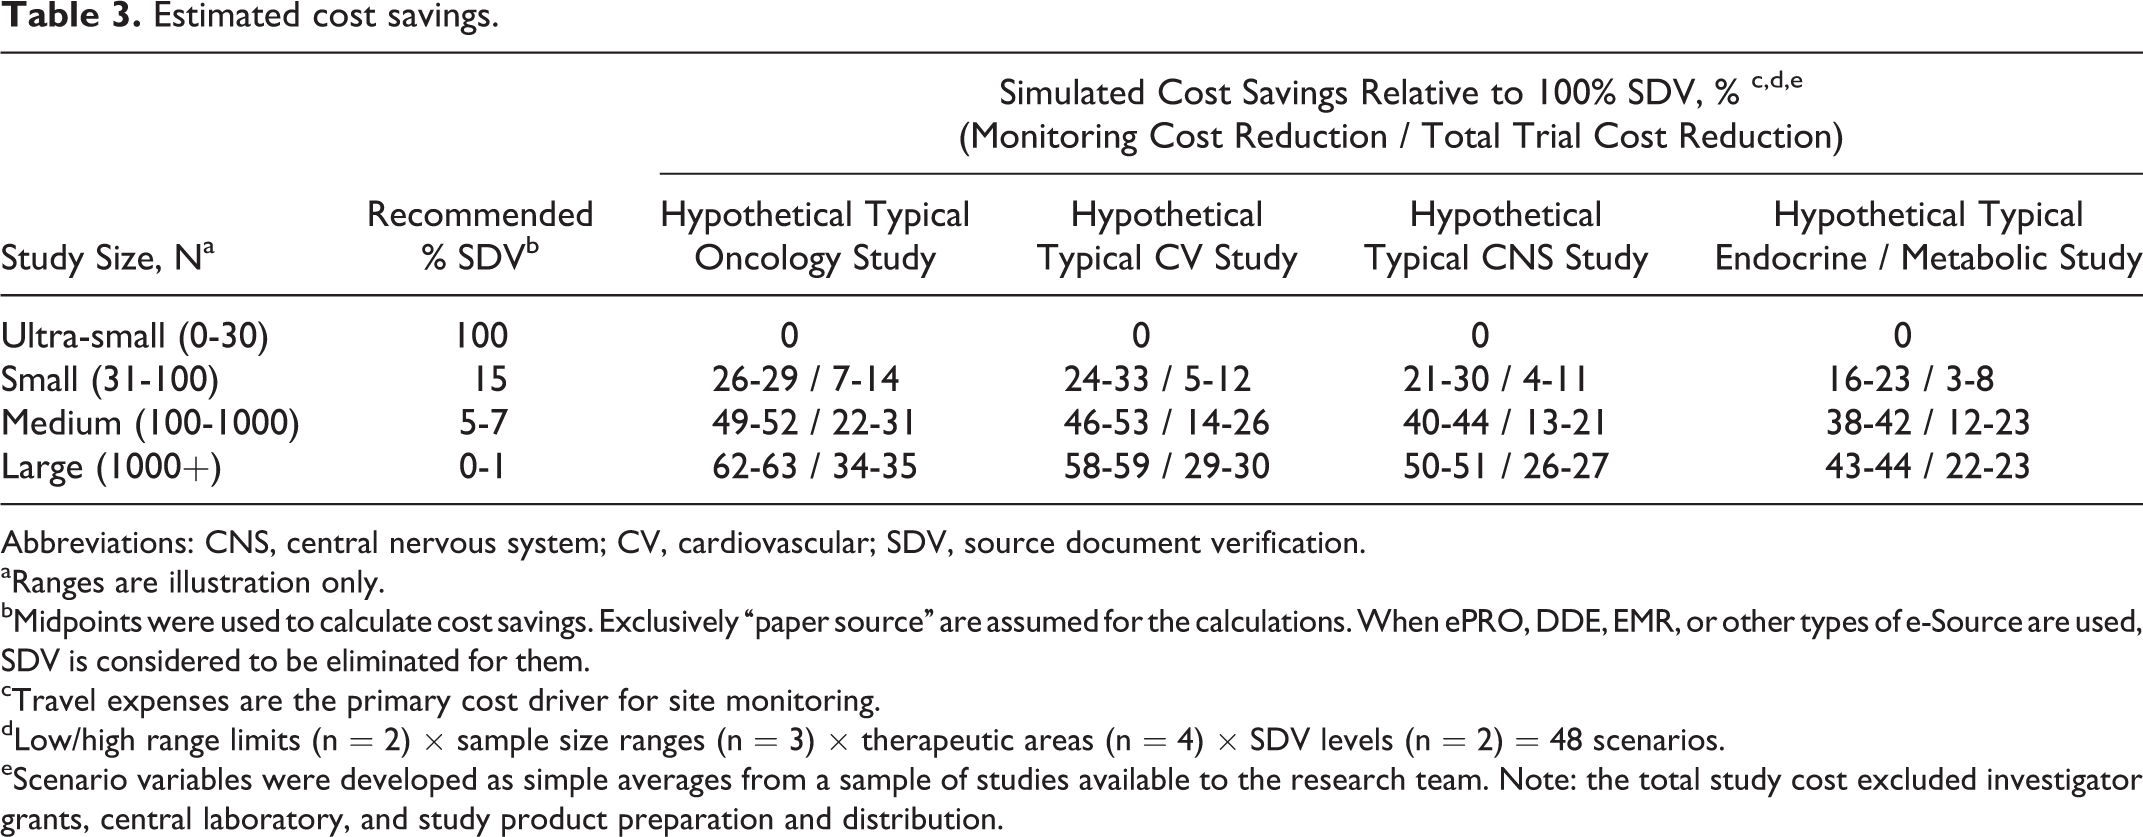
Abbreviations: CNS, central nervous system; CV, cardiovascular; SDV, source document verification.
aRanges are illustration only.
bMidpoints were used to calculate cost savings. Exclusively “paper source” are assumed for the calculations. When ePRO, DDE, EMR, or other types of e-Source are used, SDV is considered to be eliminated for them.
cTravel expenses are the primary cost driver for site monitoring.
dLow/high range limits (n = 2) × sample size ranges (n = 3) × therapeutic areas (n = 4) × SDV levels (n = 2) = 48 scenarios.
eScenario variables were developed as simple averages from a sample of studies available to the research team. Note: the total study cost excluded investigator grants, central laboratory, and study product preparation and distribution.
The cost simulations presented in Table 3 (and also using data presented by DiMasi, 19 Adams, 20 and Katin 21 ) allow estimating the total industry savings in excess of 18% of total US pharmaceutical clinical research spending (US$9 billion per year). Contact the lead author for calculation details.
Conclusion
The proposed model differs from traditional RBM in that it merges data validation and centralized monitoring as a 3-level process of data validation, statistical data surveillance, and clinical/medical review to ensure high data quality, identify protocol deviations and signs of scientific misconduct or Good Clinical Practice (GCP) noncompliance, and ensure the data are in accordance with protocol objectives. These three levels utilize different tools and skill-sets to accomplish these goals.
It is important to realize that “high-risk” sites (identified via analytics) do not necessarily require higher percent SDV. High-risk sites will require additional resources to assess and mitigate risks; however, in many cases these resources are likely to be allocated to non-SDV activities (such as GCP, SDR, training, etc).
Utilizing a “hierarchy of errors” as well as an “absence of errors that matter” data quality definition, data points identified as potentially discrepant (ie, subject to queries) carry the highest (data point level) value. Focusing SDV effort on queries is a promising strategy, and further optimization is possible via reduction of the number of “noncritical” queries when DMs and clinical operations are sufficiently trained and understand the query source and content.
The prevailing belief that all critical data require SDV is unfounded. Study size effect must be considered in designing a monitoring plan since the law of diminishing returns dictates focusing SDV on “high-value” data points.
Similar to the variability in SDV percentage, most significant economy is expected in large studies. Expected savings from the proposed method is up to 43% to 63% of monitoring cost (22%-35% of total study budget). For the small studies (<100 subjects), the expected savings are smaller, 16% to 33% (or 3%-14% of total study budget).
There is plenty of important work left for monitors. The new paradigm offers less travel and more focus on science and the site while keeping CRA accountability for the site’s overall quality and productivity. In addition to queries, focusing monitoring effort on training and protocol adherence, identification of protocol violations, identification of missing data and un-reported events, and other data not easy to review via computer (eg, ICF and some eligibility criteria) is a better use of a CRA’s time. This proposal is consistent with the FDA RBM guidance 2 and will ultimately lead to overall higher data quality.
Footnotes
Declaration of Conflicting Interests
The author(s) declared no potential conflicts of interest with respect to the research, authorship, and/or publication of this article.
Funding
The author(s) received no financial support for the research, authorship, and/or publication of this article.
Note
Appendix A. Terminology
Data Validation utilizes real-time on-line edit checks (approximately 90%) and off-line post hoc edit checks (approximately 10%) programmed in SAS or other reporting or visualization tools. The process is owned by DM from specifications through execution with some help from other functions. It is the most traditional and standard part of the process.
Statistical Data Surveillance is scientifically based and can be viewed as data validation on steroids. Complex data mining algorithms are identified and programmed under leadership of statisticians. Interpretation of results might require statistical and clinical expertise prior to issuing a query (by the DM) or otherwise recommended actions.
Medical Review is used to address the specific areas where even complex algorithms fall short. Those are areas of highly specialized medical knowledge, where modern programming capabilities are insufficient and the task requires medical review of data by an expert. The most common example of such review would be review of Suspected Adverse Drug Reaction Reports (also called CIOM forms) or review of listings of adverse events (AEs) versus Concomitant Medications versus Medical History in order to identify underreported AEs.
Query management is defined (in CDISC Clinical Research Glossary, version 6) as “ongoing process of data review, discrepancy generation, and resolving errors and inconsistencies that arise in the entry and transcription of clinical trial data.” Query itself is defined by CDISC Clinical Research Glossary (version 6) as “a request for clarification on a data item collected for a clinical trial; specifically a request from a sponsor or sponsor’s representative to an investigator to resolve an error or inconsistency discovered during data review.” For the purpose of this discussion, it is important to realize that not all queries are created equal—some of them lead to change from “erroneous” to a “true” value and some lead to no change. Some of them involve critical data points that might impact the study results and some have no impact on the study results. Regardless this distinction, here are four reasons for query being the most critical instrument of the modern data cleaning process. First, query is a focal point of the detective work by DMs and CRAs. If a data point is “leading to query,” it is 30 to 100 times (our estimate) more likely to be erroneous (aka “risky”) than non–“leading-to-query” data points. Second, query is a very effective data correction tool. If implemented properly, it leads to data corrections in 40%-80% of cases. Third, it is an efficient mechanism, and the cost of query in EDC is low (relative to other clinical trial operational costs). Also, on average, only a tiny portion of key data (TransCelerate, 1 Mitchel 2014 16 ) are queried. Finally, documentation of data changes (what was changed, when, who and why, as well as the preservation of the original entry and sign-off by investigator) is required by regulations (21 CFR 11.10(e)). EDC-enabled query management systems provide efficient means for such documentation. All 4 reasons above make such a small part of the clinical trial process as query, a crown jewel of the data cleaning and monitoring process. In this context, one may borrow a phrase from Sherlock Holmes: “the little things are infinitely the most important!”
On-site monitoring is the last step of the process, which at a minimum includes “targeted on-site visits to higher risk clinical investigators (eg, where centralized monitoring suggests problems at a site)” (FDA
2
). The following are typically tracked during on-site monitoring: Compliance with GCP Compliance with Protocol requirements and identify reasons for protocol violations (including proper equipment) Reasons for high or low drop outs Training and quality of staff, staff turnover Systematic deficiencies and provide solutions to resolve them
Fraud
Data quality
The first 5 items cannot be performed by computer and thus will stay largely unchanged over the near future. On the other hand, the last 2 (italicized) items, fraud identification and checking for data quality, if facilitated by computers leveraging power of statistical algorithms, produce appreciably better results for a tiny fraction of cost.
On-site monitoring could be viewed as a combination of 3 discrete activities: Source Data Verification (SDV), Source Data Review (SDR), and GCP Compliance/(Site) Process Monitoring. The TransCelerate position paper 1 helps to show the distinction between SDV and SDR. “SDV is the process by which data within the CRF or other data collection systems are compared to the original source of information (and vice versa) to confirm that the data were transcribed accurately (ie, data from source matches data in the CRF or other system and vice versa). SDR involves review of source documentation to check quality of source, review protocol compliance, ensure the critical processes and source documentation (eg, accurate, legible, complete, timely, dated) are adequate, ascertain investigator involvement and appropriate delegation, and assess compliance to other areas (eg, SOPs, ICH GCPs). SDR is not a comparison of source data against CRF data. SDR is necessary to evaluate areas that do not have an associated data field in the CRF or system available for more timely remote review” (TransCelerate 1 ).
Finally, one might reasonably ask: what is the role of the “blind review” 22 and the “centralized monitoring” (FDA 1 ) in this model. Here is our response.
“Centralized monitoring is a remote evaluation carried out by sponsor personnel or representatives (eg, clinical monitors, data management personnel, or statisticians) at a location other than the sites at which the clinical investigation is being conducted. Centralized monitoring processes can provide many of the capabilities of on-site monitoring as well as additional capabilities” (FDA 2 ). In all the proposed RBM methods, a statistical/aggregate look at the inconsistencies is the most critical step of the process (very much as long advocated by ICH E9 [1998] 22 “blind review”). Thus, in our “extended RBM model,” centralized monitoring is a combination of Level 2 “Statistical Data Surveillance” and Level 3 “Clinical Review.”
Blind review is defined in ICH E9 as “The checking and assessment of data during the period of time between trial completion (the last observation on the last subject) and the breaking of the blind, for the purpose of finalizing the planned analysis.” 22 Based on this definition, centralized monitoring could be viewed as ongoing “blind review” process that starts long before trial completion.