
Abstract
Background:
Traditionally, sample size considerations for Phase 2 (Ph2) trials are based on the desired properties of the design and response information from the trials.
Methods:
This work extends that of Patel et al (2012) to design Ph2 trials based on program-level optimization (ie, optimizing the entire Ph2/3 trial design strategy). It describes a framework to evaluate the impact that several Ph2 design features have on the probability of Phase 3 (Ph3) success and the expected net present value (eNPV) of the product. These factors include the Ph2 sample size, decision rules to select Ph3 dose(s) and sample sizes, as well as number of Ph3 trials. Using neuropathic pain as an example, simulations illustrate the framework and show the benefit of including these factors in the overall decision process. Patel et al considered one dose of test drug in each of exactly two Ph3 trials. This work extends that to consider 1 or 2 doses in each of 2 Ph3 trials and, if needed, 1 or 2 additional Ph3 trials to substantiate the usefulness of the second dose.
Results:
We found that employing a quantitative algorithmic strategy to choose 1 or 2 doses for Ph3 based on trial results does not substantially alter the eNPV compared to a strategy of always taking 2 doses to Ph3, if appropriate. Similar to the findings by Patel et al, for 1 Ph3 dose, we found that Ph2 sample size can be optimized at small to modest sizes when allowing for the possibility of taking 2 doses to Ph3. We found that choice of number of Ph2 doses depends on the magnitudes and shapes of the true underlying efficacy and safety dose-response curves.
Conclusion:
Simulating a sequence of clinical trials can inform trial design and drug development strategy.
Introduction
Adaptive design necessitates heavy reliance on simulation to evaluate and compare the performance characteristics of adaptive design options in order that an appropriate design can be chosen to address the objectives for a given clinical trial. The DIA Adaptive Program Work Stream 1 has expanded the use of simulation to optimize sequences of clinical trials for individual drug development programs. That group published 3 case studies aimed at optimizing clinical development programs in neuropathic pain, 2 diabetes, 3 and oncology. 4
Reference is made to Patel et al, 2 in which a sequence of 3 clinical trials (a Phase 2b [Ph2b] dose-finding trial followed by two Ph3 trials) was simulated to optimize sample sizes to maximize expected NPV based on clinical utility. In that case study using a neuropathic pain drug development program as example, only 1 dose was selected from the simulated Ph2 trial results and used to simulate the 2 Ph3 trials. In this extension to that work, an option to take 2 doses to Ph3 was added. For the 2-dose-to-Ph3 option, the second dose was defined to be the next higher dose from the one selected via the minimum effective dose (MED) criteria as in Patel et al 2 contingent upon the nuisance adverse event (AE) rate < 0.3, as a safety criterion. Note that the particular types of AEs are unspecified since only the numeric incidence rates are of importance in this case study.
Two other enhancements were added for this extension: (1) potential to market 1 or 2 of the Ph3 doses if certain criteria based on adequate safety and incremental efficacy gain between the two doses were achieved; and (2) an option for an additional 1 or 2 Ph3 trials in case the criteria to market a second dose was not met by the first 2 Ph3 trials, but results suggested ability to meet that criteria was promising. The impact on increasing NPV of marketing the second dose was assumed substantial, and potentially worth the extra development time to conduct 1 or 2 additional Ph3 trials. This paper summarizes the methods for those simulations and summarizes the findings from them. For simplicity, the ICH E1 requirement on minimum total sample size across trials for safety data and the sponsor option to seek regulatory approval of the lower dose based on the first two Ph3 trials while conducting the additional trial(s) to substantiate the regulatory filing for the higher dose at a later time are not considered in this paper.
Methods
We employed the neuropathic pain drug development paradigm, as previously reported. 2 The primary efficacy endpoint is change from baseline in pain intensity as measured by the 0 to 10 numeric rating scale (NRS). The tolerability endpoint is the proportion of subjects with nuisance AEs. These two endpoints are combined via the same utility function previously reported. 2 Because we found two distinct sets of results among the set of efficacy dose-response curves they studied, we studied one representative dose-response curve for each set. These two are the sigmoid Emax (Figure 1A) and the exponential dose-response curve (Figure 1B). We varied each to 3 levels of difference from placebo. Overall, we used 3 levels of AE curves (Figure 1C). The efficacy and tolerability dose-response curves are the same as those in a previous work. 2
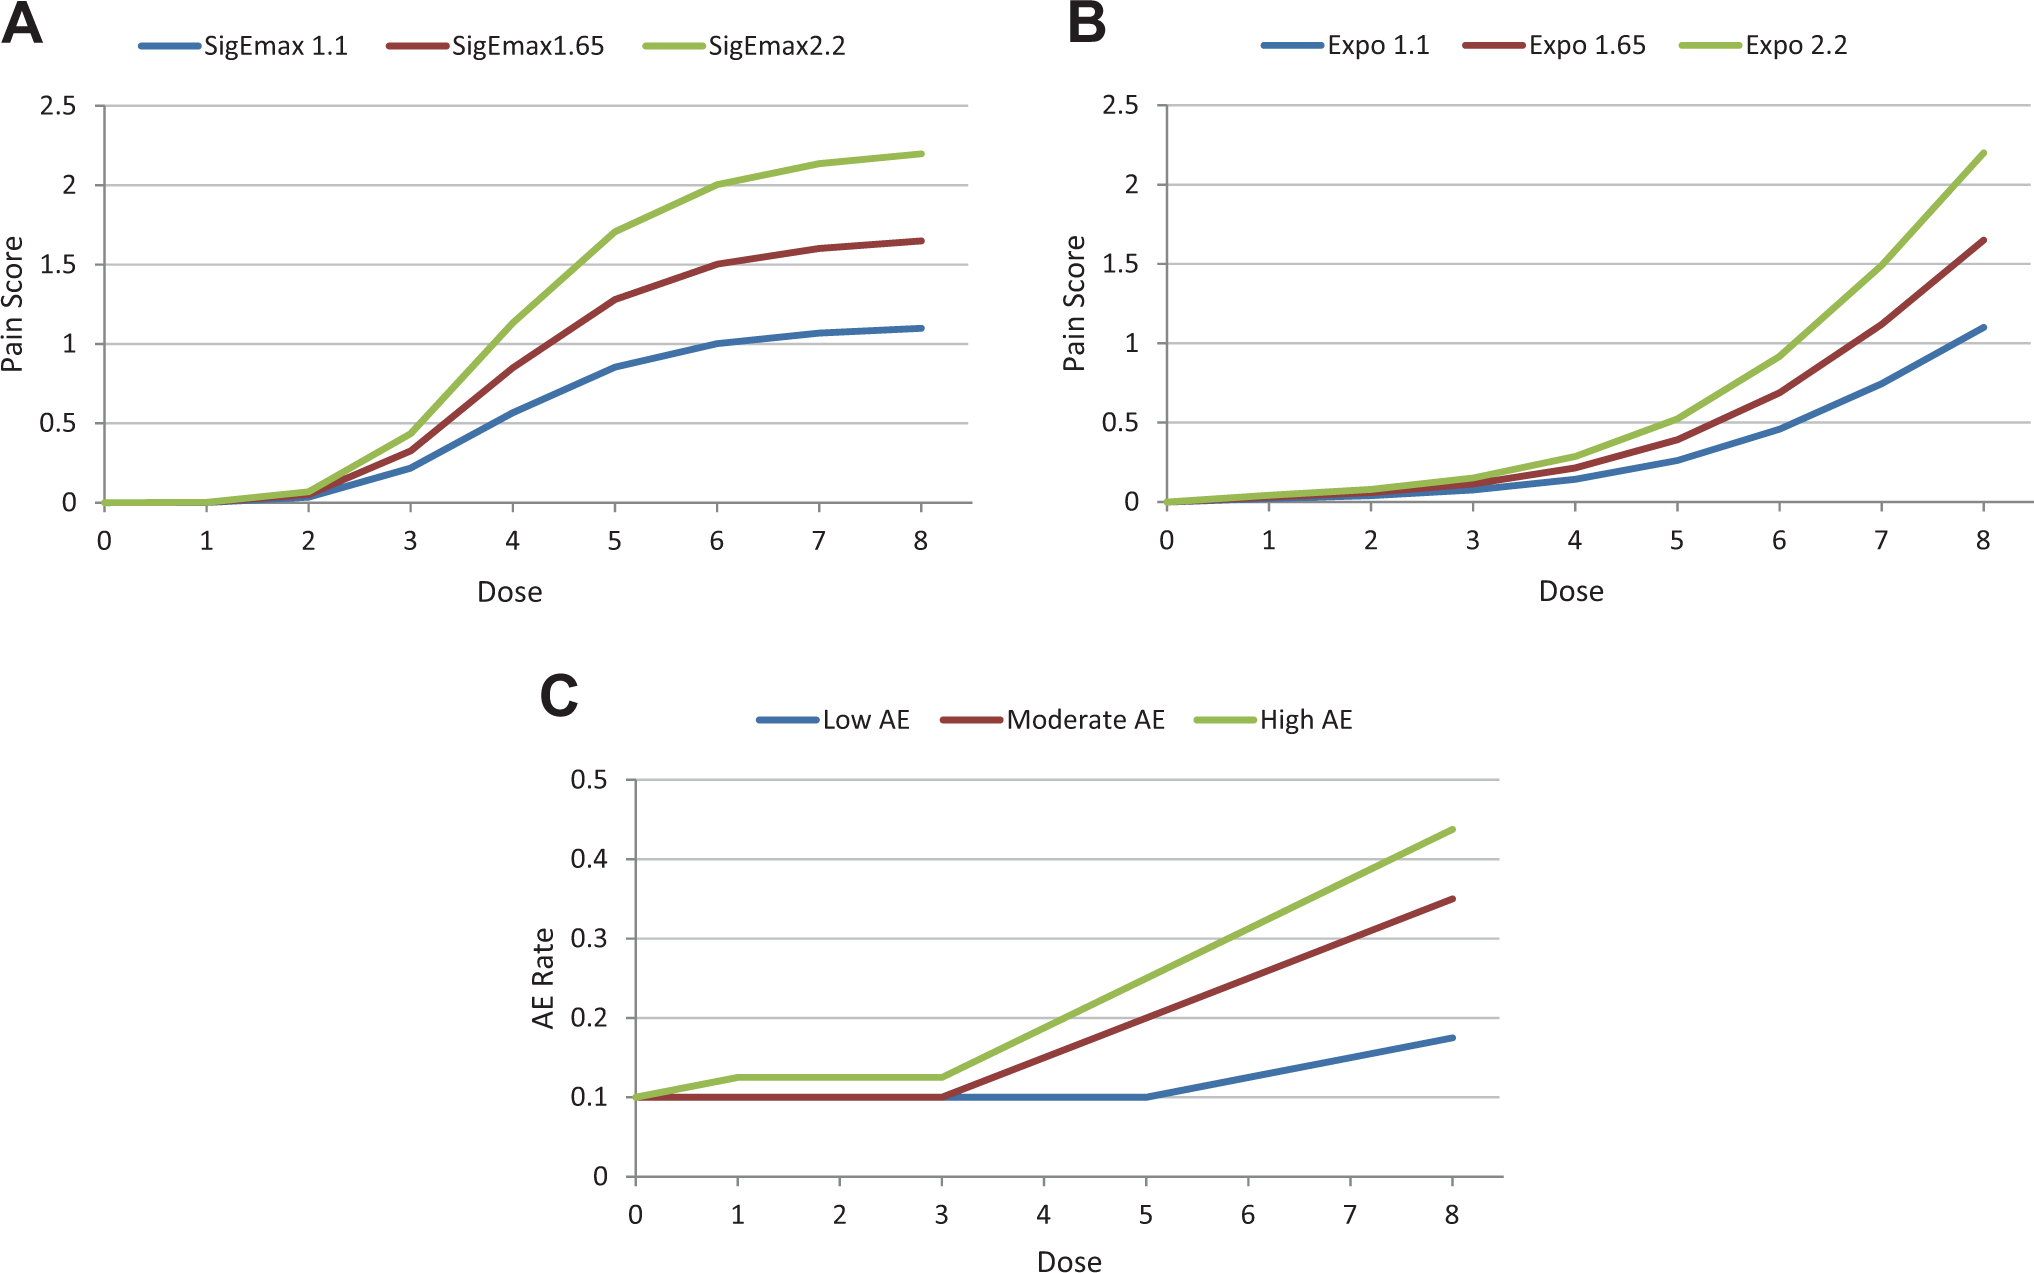
(A). Sigmoid Emax model TRUE underlying efficacy dose-response curves employed (3 curves with maximum values 1.1, 1.65, 2.2). (B) Exponential TRUE underlying efficacy dose-response curves employed (3 curves with maximum values 1.1, 1.65, 2.2). (C) TRUE underlying tolerability (AE rate, which is the probability that an individual patient will experience at least 1 adverse event) dose-response curves employed.
We used the same revenue model as previously reported, 2 where e(Di) denotes the true treatment effect (difference in efficacy from placebo in terms of mean change from baseline in the NRS) and s(Di), the true nuisance AE rate for dose Di. Table 1 shows the estimated 5th-year net revenue in billions of US dollars (US$) from marketing a single dose Di that reflects the trade-off between efficacy e(Di) and tolerability s(Di). The smoothed and interpolated values (billions of US$) are displayed in Figure 2. Figure 3 shows the revenue model, which is identical to that used previously. 2
Estimates of 5th-Year Net Revenue (in Billions of US$) for a Marketed Dose (Di) With Safety and Efficacy Profiles Given by the Column and Row Profiles.
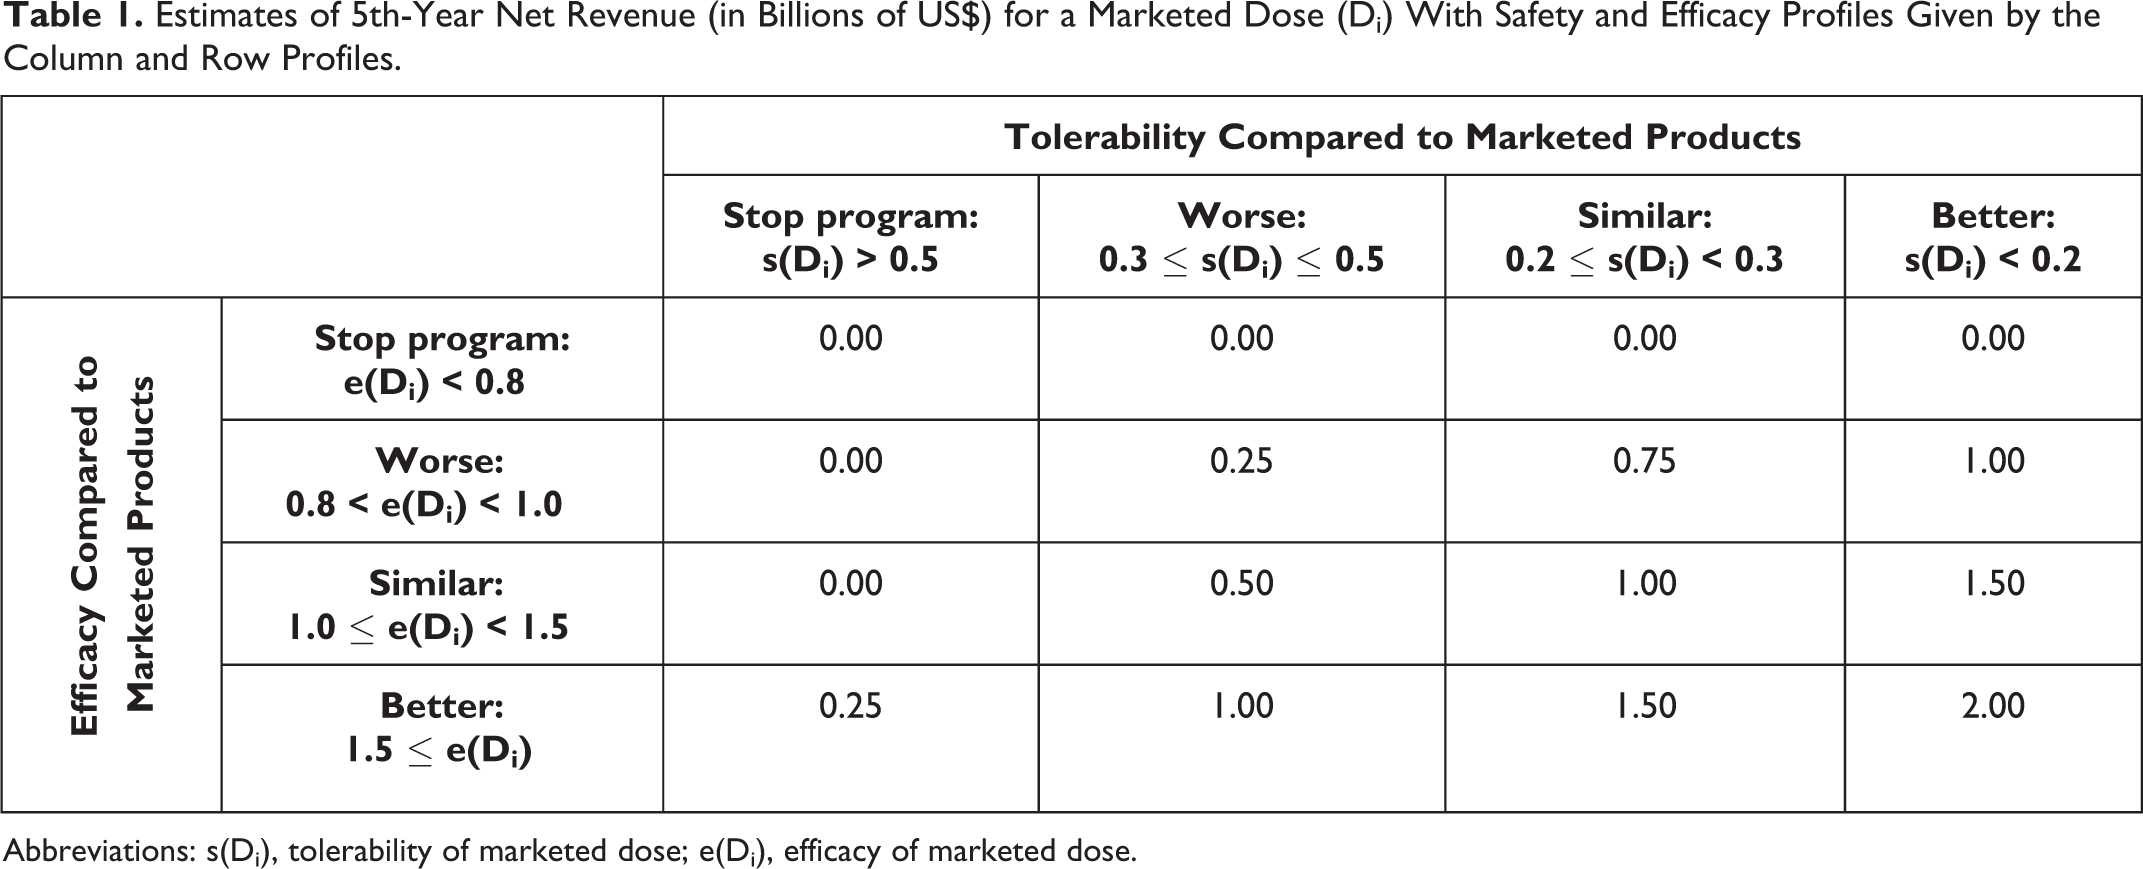
Abbreviations: s(Di), tolerability of marketed dose; e(Di), efficacy of marketed dose.
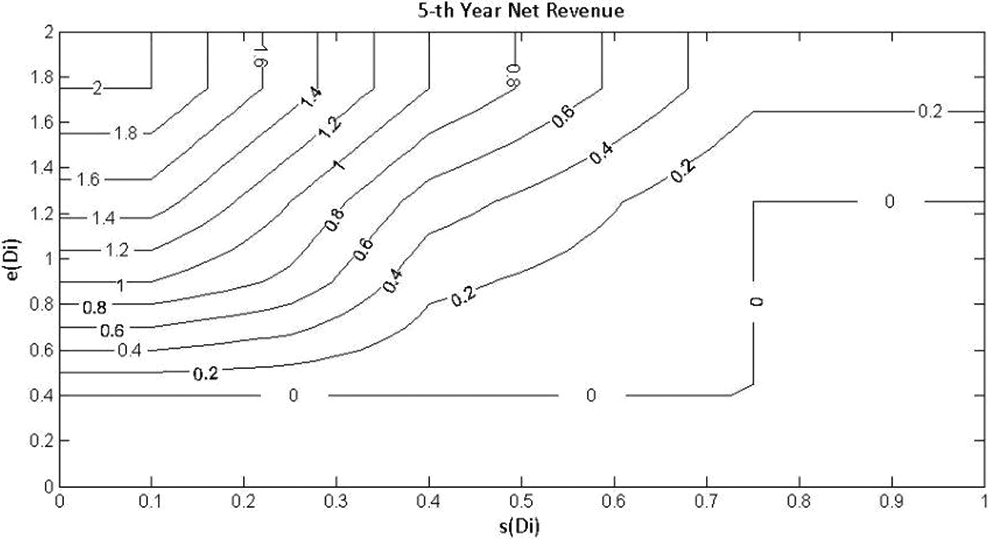
Expected 5th-year net revenue (billions of US$) as a function of the safety and efficacy profile of the product at the dose marketed.
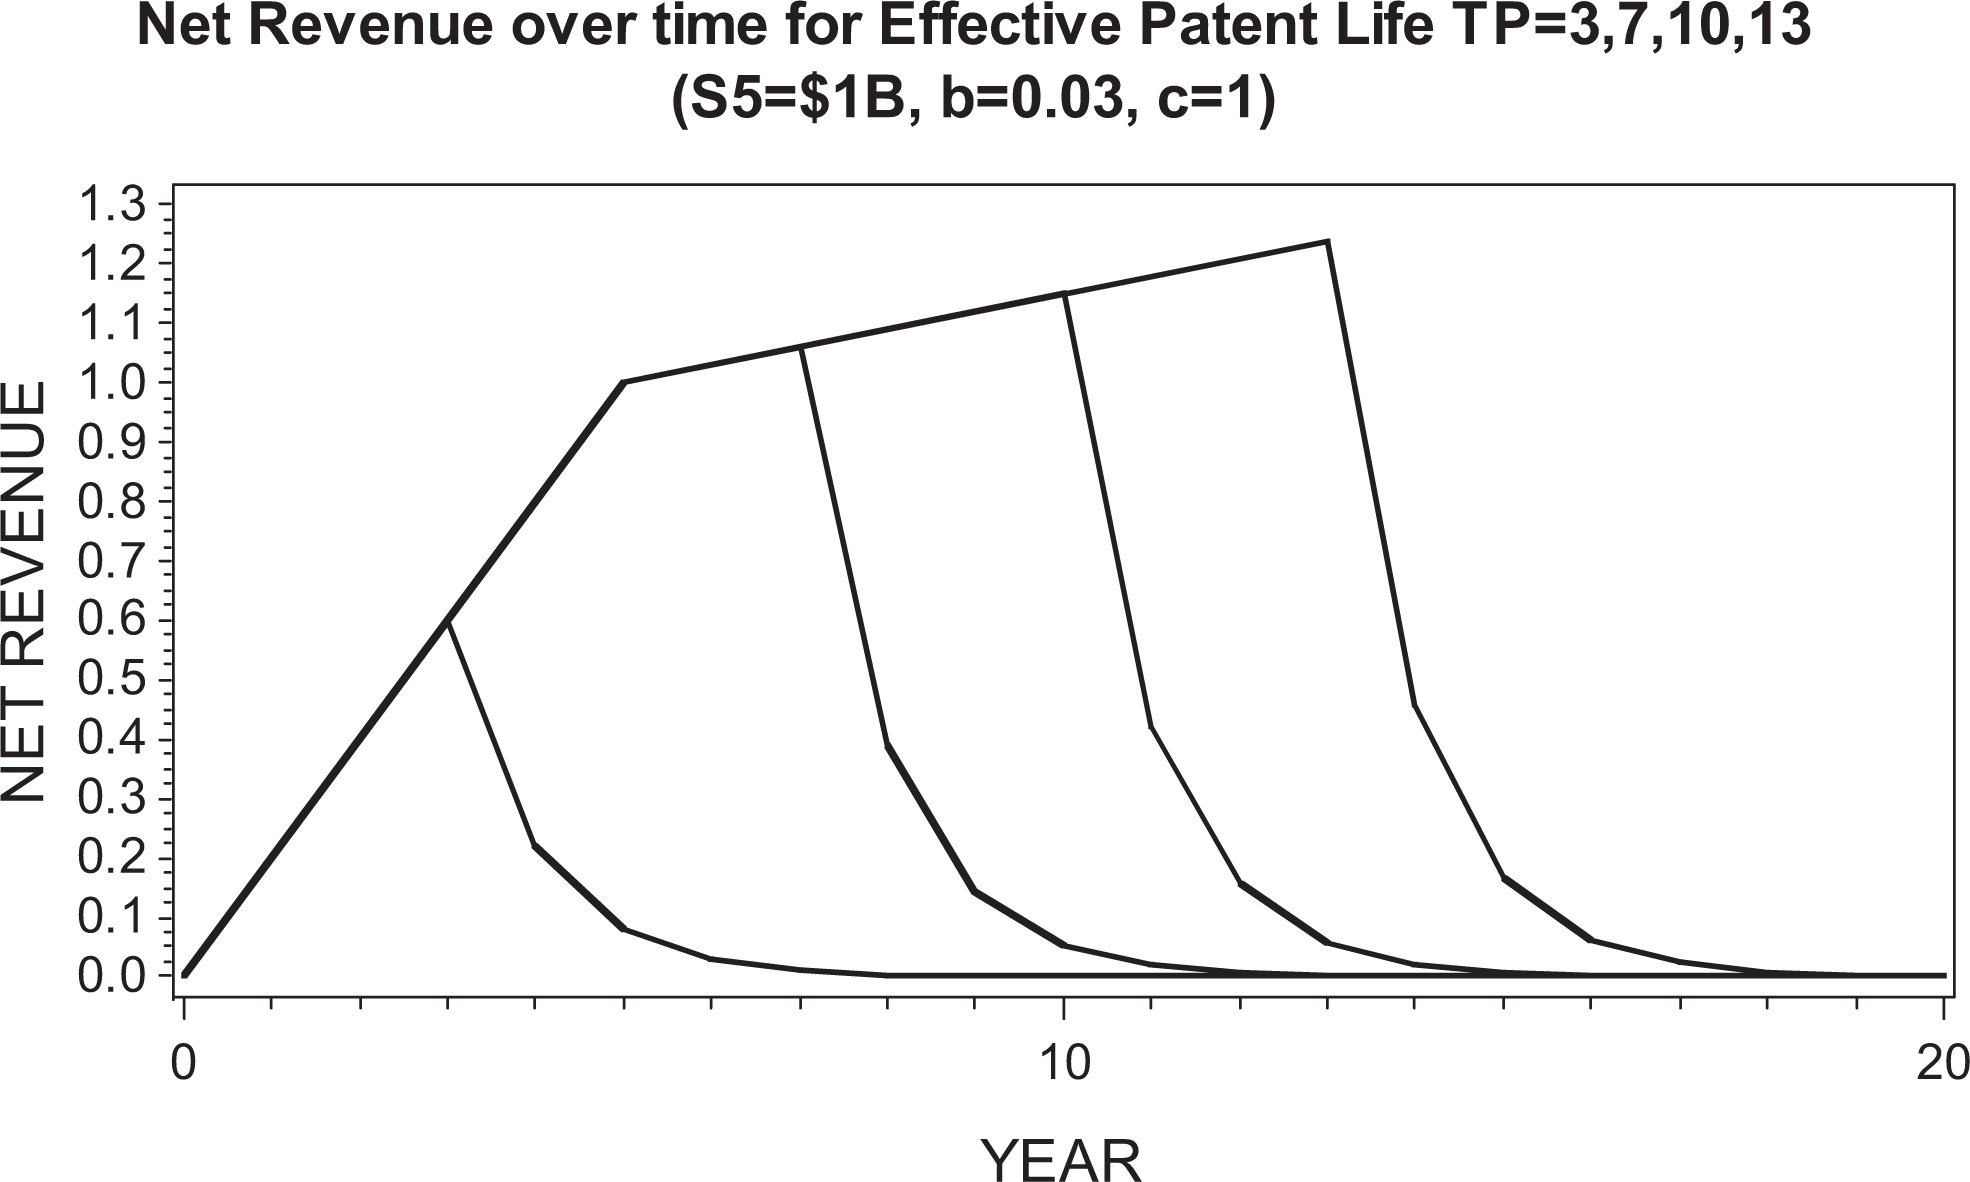
Revenue model, which is identical to that used in previous study. 2
The sample sizes for the Ph2 trial were 30 subjects per dose and placebo for the design including 8 active doses and 54 subjects per dose and placebo for the 4 active dose case. This yields a total sample size of 270 for the Ph2 trial as the base case. In addition to the base case, we simulated total sample sizes of 135, 225, 405, 540, 675, and 810; these correspond to 15, 25, 45, 60, 75, and 90 subjects per dose group for the 8-dose design, respectively, and 27, 45, 81, 108, 135, and 162, respectively, for the 4-dose design. These sample sizes are the same as in our previously published work, 2 in order to be consistent and comparable with it.
Thus, in summary, we have simulated each of the 3 designs (Design1, Design2, Design12) for all combinations of these factors: 2 efficacy dose response curves (sigmoid Emax and exponential); 3 maximum efficacy levels (1.1, 1.65, 2.2); 3 AE rate dose-response curves (low, moderate, high); 2 numbers of doses (4 and 8); 7 Ph2 sample sizes (135, 225, 270, 405, 540, 675, and 810). This represents 2 × 3 × 3 × 2 × 7 = 252 simulations for each of the 3 designs.
Outline of Simulations
The simulation process was the same as that for previous work.
2
For comparison purposes to that previous work, we included the Ph3 trial design in which one dose was compared to placebo in each of 2 Ph3 trials. This strategy is referred to as “Design1” (the 1-dose-to-Ph3 option). Step 1: Simulate the Ph2 trial under a set of assumptions on number of doses, sample size, and dose-response relationships for both efficacy and safety using the models above. Step 2: Based on the results of each simulated Ph2 trial, one dose is chosen to proceed to 2 Ph3 trials using the MED and to meet the safety criteria (ie, observed AE rate < 0.3). If no dose satisfies these prespecified criteria, the development program is terminated under that method. Step 3: If the development proceeds to Ph3, the sample size for the two (identical) Ph3 studies is determined similarly as in the previous work. Ph3 data are assumed to follow the same true underlying response distributions as in Ph2, except that SD for efficacy was 2.0 for Ph2, which is typical for Ph2 neuropathic pain trials,
5
and inflated to 2.5 for Ph3, since populations are usually more diverse in Ph3.
There are 3 possible outcomes related to the null hypothesis H0 of no efficacy, based on Ph3 data: H0 is not rejected in either Ph3 trial. H0 is rejected in only one trial. H0 is rejected in both trials.
The probability of each of these outcomes is computed analytically using Bayesian conjugate theory and assumed normal distribution. Step 4: The expected net present value (eNPV) is calculated for each simulated run of the sequence of trials. Many factors affect time and cost estimates, and ultimately, the eNPV calculation. Factors other than those described in this paper remained constant across all simulations and equal to those used previously.
2
Step 5: Repeat steps 1 to 4 1000 times and calculate the following metrics for each scenario of assumptions and specifications. Proportion of times when the decision is to move forward to Ph3 development Proportion of times when Ph3 development is successful Average total development time in years eNPV averaged over the simulations Proportion of simulations in which a safe and efficacious dose as close as possible to best dose is selected for Ph3 (If all doses have estimated efficacy < target, then no dose is selected in the target method of dose selection)
“Design2” refers to the strategy that always takes 2 doses to Ph3, whenever possible: the dose chosen by Design1 method (denoted as “Di”) and the next higher dose (denoted as “Di+1”). We also studied an option to take 1 or 2 doses to Ph3, depending on which of those choices yielded higher eNPV based on Ph2 results; this strategy is denoted as “Design12,” that is, an algorithmic choice between Design1 and Design2. The schematic for the options of the Design12 strategy is found in supplemental information available online (Supplemental Figure S1). In all 3 designs, after Ph2, the 2 Ph3 trials are assumed to be run in parallel; however, the time to complete Ph3 is dependent on the total Ph3 sample size. Similarly, for Design2 and Design12, if 2 additional Ph3 trials are conducted, they are run in parallel after the first 2 Ph3 trials have completed. A summary of the decision algorithm is in Tables 2 to 4, and detailed description follows.
Decision Table for Going to Phase 3.
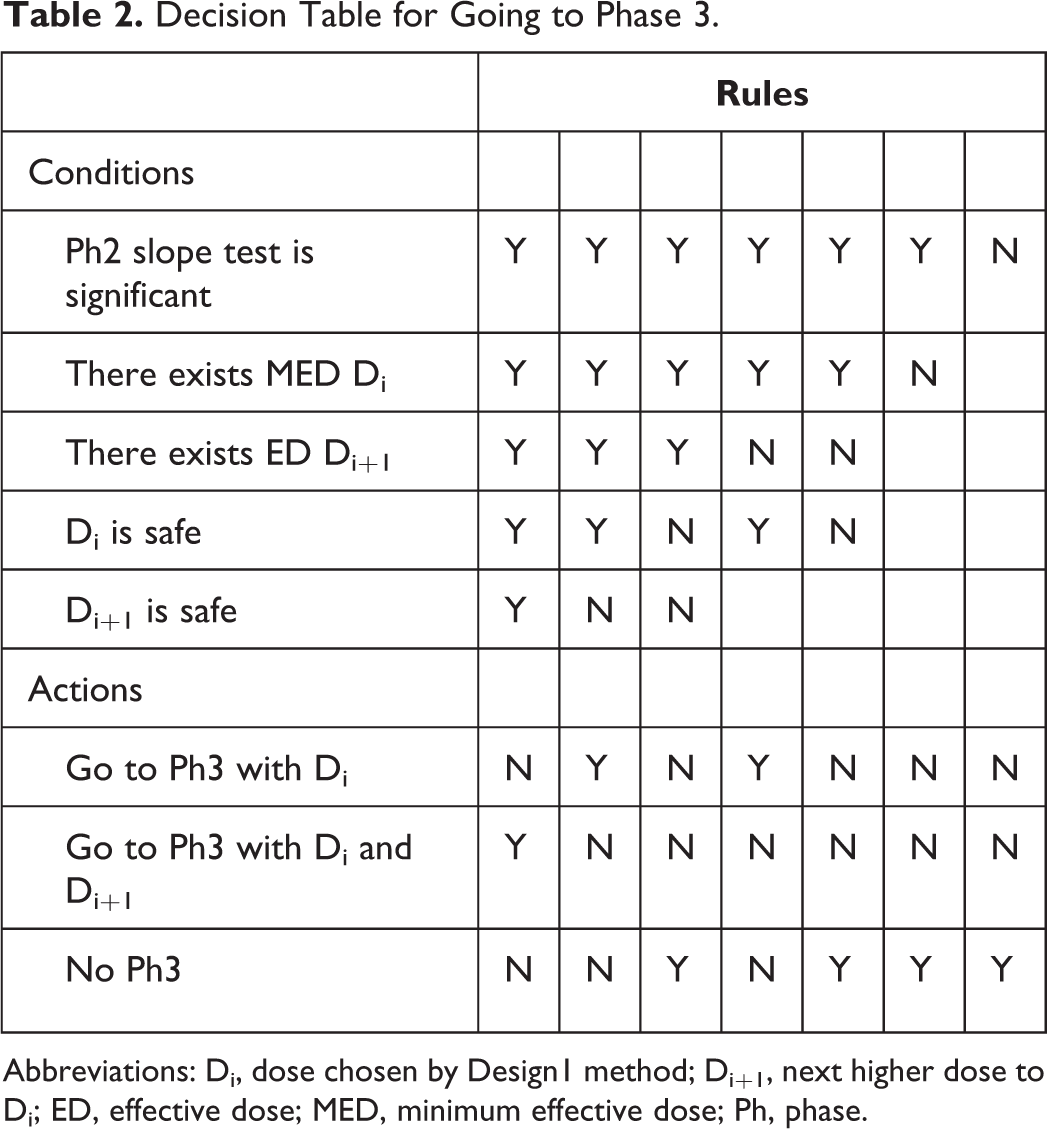
Abbreviations: Di, dose chosen by Design1 method; Di+1, next higher dose to Di; ED, effective dose; MED, minimum effective dose; Ph, phase.
Decision Table for Extra Phase 3 Trials.
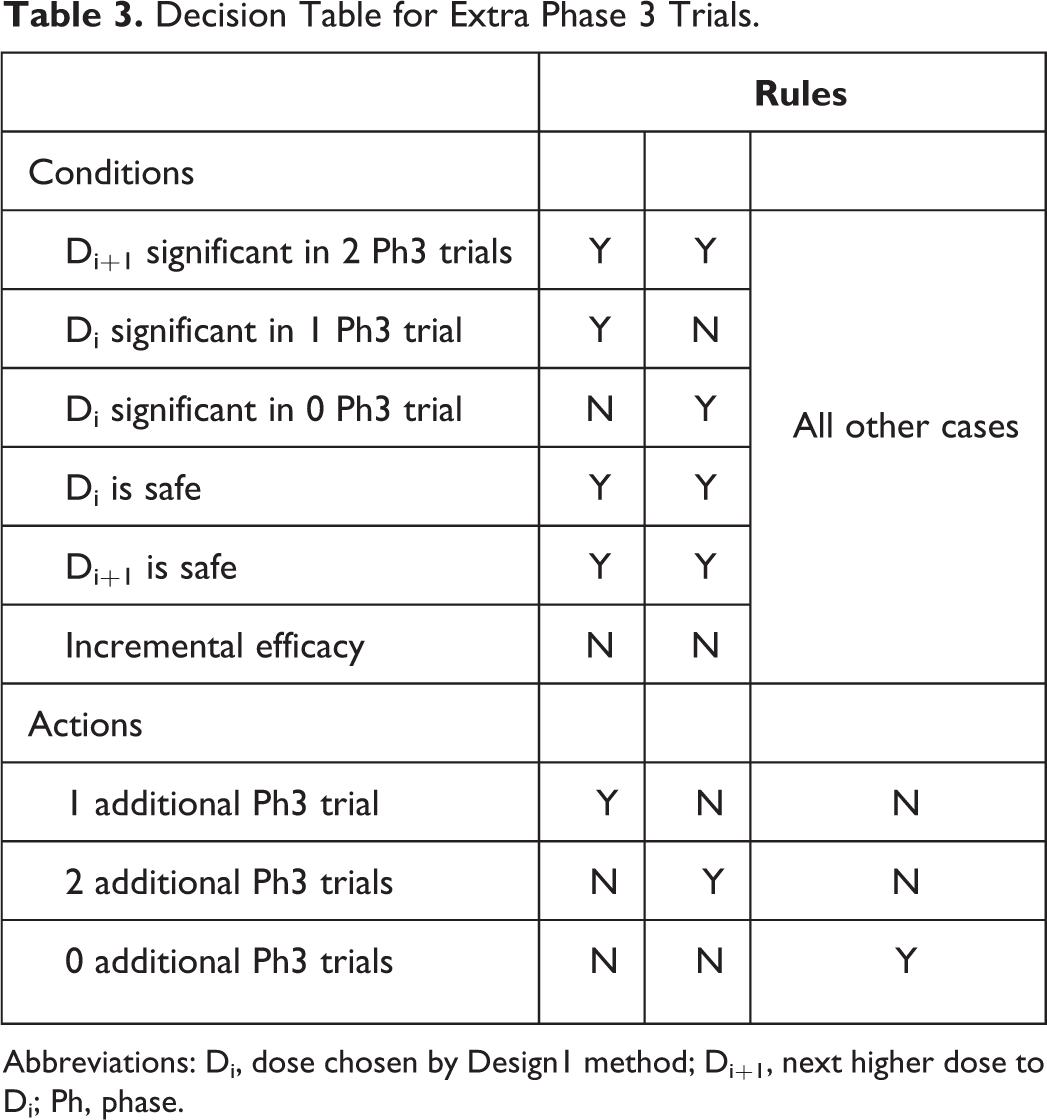
Abbreviations: Di, dose chosen by Design1 method; Di+1, next higher dose to Di; Ph, phase.
Decision Table for Approval and Marketing.
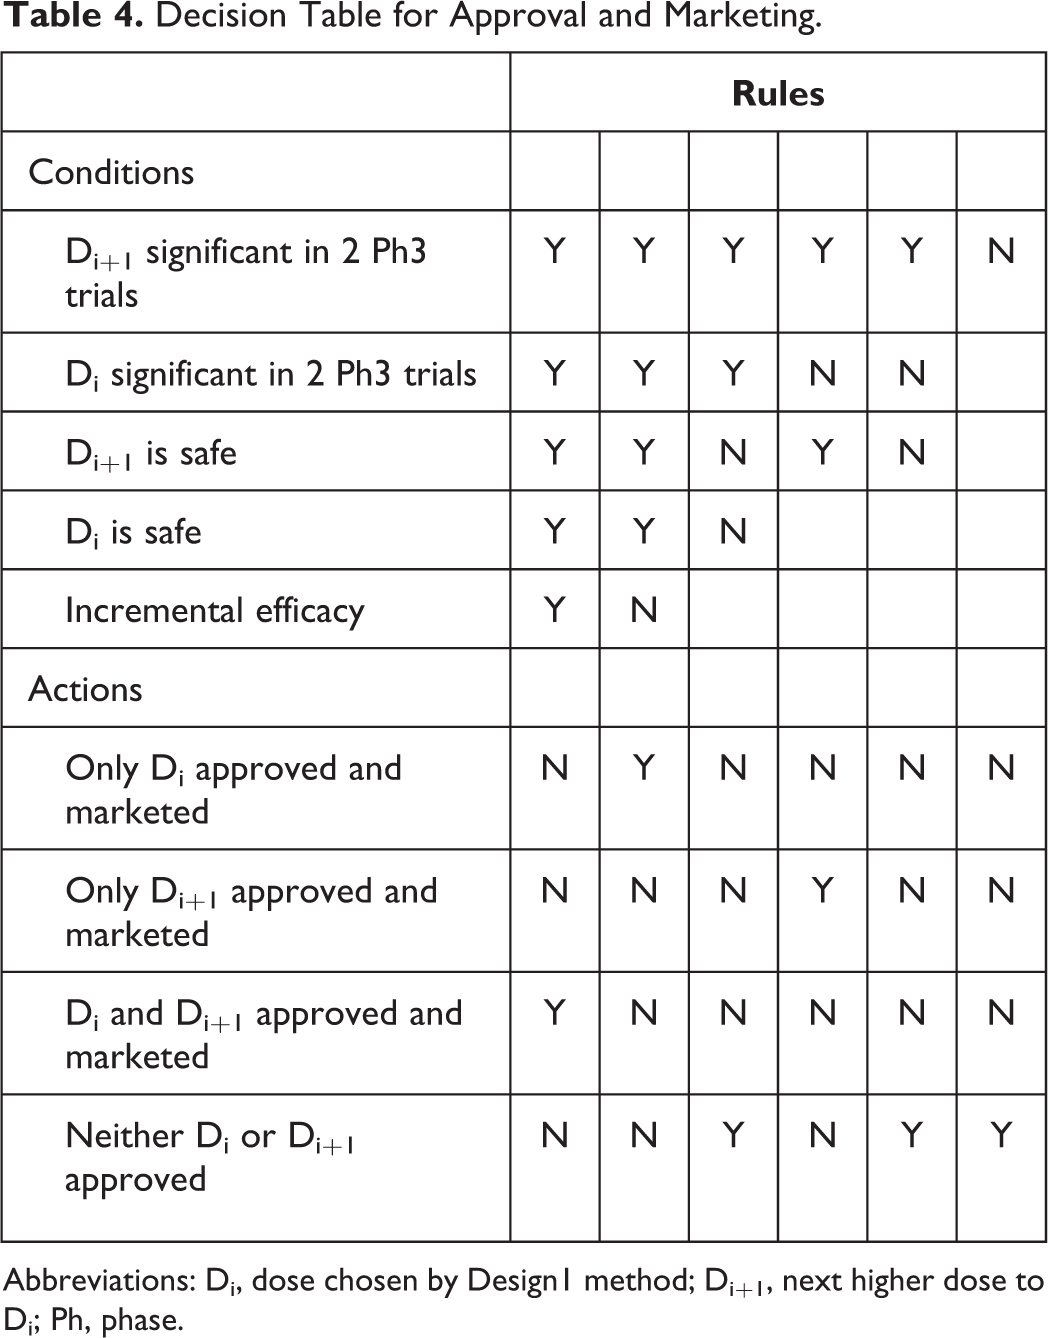
Abbreviations: Di, dose chosen by Design1 method; Di+1, next higher dose to Di; Ph, phase.
The decision to consider initiating Ph3 after Ph2 begins with a significance test on the slope of the efficacy dose-response curve. If that test does not yield significance, then development is stopped. If that test yields significance, then the minimum dose demonstrating adequate efficacy and adequate safety is chosen as Di for Ph3. (Adequate efficacy is defined as an estimated efficacy response of at least 0.8 points in change from baseline on the NRS [relative to placebo], based on the estimated posterior means; adequate safety is defined as an estimated AE rate at most 0.3, based on the isotonic estimates.) If no dose has adequate efficacy and safety, then development is stopped. If a Di is found and is the maximum dose studied in Ph2, then Design1 is initiated for Ph3. If Di is not the maximum dose, then consideration is given toward estimated properties of Di+1, based on the Ph2 trial results: If Di+1 has inadequate safety, then Design1 is initiated for Ph3. If Di+1 has adequate safety, then an evaluation of the estimated NPV using the Ph2 results is made for each of Design1 and Design2, and the design option with the higher estimated NPV is chosen for Ph3 and initiated.
If a decision to initiate Design1 is made, then the following decision algorithm is followed: If the results of Ph3 indicate Di has inadequate safety, development stops. A negative NPV based on the cost of Ph2 and Ph3 is realized. If Di has adequate safety: and if statistical significance is not achieved in both Ph3 trials, then development is stopped and negative NPV realized. and if statistical significance is achieved in both Ph3 trials, then Di is marketed and its realized NPV is computed based on the combined Ph3 results by interpolation from the clinical utility table.
The most complicated decision algorithm is the case when Design2 is initiated in Ph3; it proceeds as follows. The results of Ph3 yield 1 of 3 scenarios:
Di and Di+1 are each found to have inadequate safety after Ph3, in which case development ceases, and negative NPV is realized.
Di is found to have an adequate safety, but the safety profile of Di+1 is inadequate, in which case the decision algorithm described above for Design1 is used to obtain the NPV.
Di and Di+1 are both found to have adequate safety after Ph3. This outcome proceeds as follows: 3a. If Di is significant in at most 1 Ph3 trial and Di+1 is statistically significant in at most 1 Ph3 trial then development ceases and negative NPV is realized. 3b. If Di and Di+1 are both significant in both Ph3 trials, and if incremental efficacy is demonstrated, then both Di and Di+1 are marketed, and their joint NPV is realized, as described below. This is the best-case scenario that will yield the highest NPV. If incremental efficacy is not demonstrated, then only Di is marketed and its NPV is realized. 3c. If Di is not significant in both trials and Di+1 is significant in both trials (the most complicated situation) (note, step-down testing of Di+1 followed by Di is used, so it is not possible to have Di significant in both trials and not have Di+1 significant in both trials), then: 3c.1. If incremental efficacy is achieved between Di+1 and Di, then Di+1 is marketed and its NPV is realized. 3c.2. If incremental efficacy is not achieved between Di+1 and Di based on combined analysis of both Ph3 trial, then consideration is given to conduct additional Ph3 trials for two purposes. The first is to demonstrate incremental efficacy between the two doses to convince regulatory agencies that one truly has identified the MED. The second is to yield 2 trials in which Di is significant. Just because significance is not observed in both of the first 2 Ph3 trials does not mean the estimated magnitude of drug effect for Di is not clinically meaningful. So, additional trials may be powered for the observed nonsignificant, but clinically meaningful, effect seen in the first 2 Ph3 trials. 3c.2.a. Di is significant in one of the completed Ph3 trials, but not the other. In this case, development proceeds with 1 additional Ph3 trial. 3c.2.b. Di is not significant in either of the completed Ph3 trials. Development proceeds with 2 additional Ph3 trials.
After completion of either the 1 or 2 additional Ph3 trials, the following decision algorithm is applied. If Di is not significant in 2 trials, Di+1 is marketed and its NPV is realized. If Di is significant in 2 Ph3 trials and incremental efficacy is achieved, then both Di and Di+1 are marketed and a combination of their respective NPVs is realized as described below. If incremental efficacy is not achieved, then Di+1 is marketed. In this case, the fact that at most 1 of 3 Ph3 trials demonstrated Di significant, and this is used to rationalize demonstration of Di+1 as the MED, since Di was given at least 3 trials’ chance to yield 2 significant.
When both Di and Di+1 are marketed, their NPV is computed via the linear combination

where S52doses is the 5th-year sales of the 2 doses combined, S5Dsmaller is the 5th-year sales of the smaller dose, and S5Dlarger is the 5th-year sales of the larger dose. The coefficients were chosen based on the following rationale. The 5th-year sales will not be the sum of the two since the same subjects who would use the drug if one dose were marketed would likely be split among the two doses. If these were the only subjects who would use the drug, then the coefficients would sum to 1. However, since two doses are available, prescribing physicians will likely prescribe the drug for more subjects than if only a single dose were available. It is felt that this would not double the number of subjects prescribed, so the sales would likely be somewhere between the sum of the two, and the average of the two. Hence, the 0.75 coefficients were chosen as a balance between those two extremes.
Results
All simulation results are summarized in this section. The number of subjects in Ph3 is determined by computation of power and criteria to demonstrate incremental efficacy. The minimum 1500 subject requirement is not used. Unless otherwise noted, all Ph2 trials contain 8 doses plus placebo.
Tables 5 and 6 summarize the key results for the optimal Ph2 sample size for the sigmoid Emax model. Those results indicate an optimal Ph2 sample size of 270 or 135 for most combinations of efficacy and tolerability DR curves (Table 5). The DR combinations in the lower right of Table 5 are generally clear cases (higher efficacy and lower tolerability rates; hence, lower Ph2 sample sizes are required to optimize eNPV. Similarly, the low efficacy + high tolerability DR combination requires the smallest Ph2 sample size to optimize eNPV. From Table 6, we learn that Design2 yielded higher eNPV than Design1 (∼10%-20%) and that Design12 did not improve upon that advantage.
Phase 2 Sample Sizes With Optimal eNPV: Sigmoid Emax Model.a
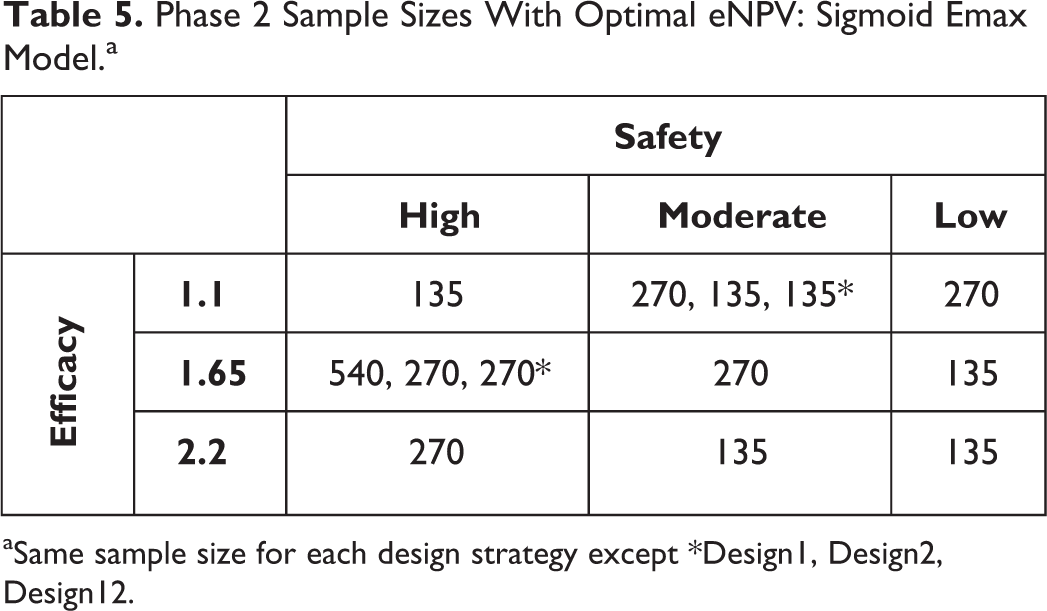
aSame sample size for each design strategy except *Design1, Design2, Design12.
Summary of Optimum eNPV for Sigmoid Emax Model.
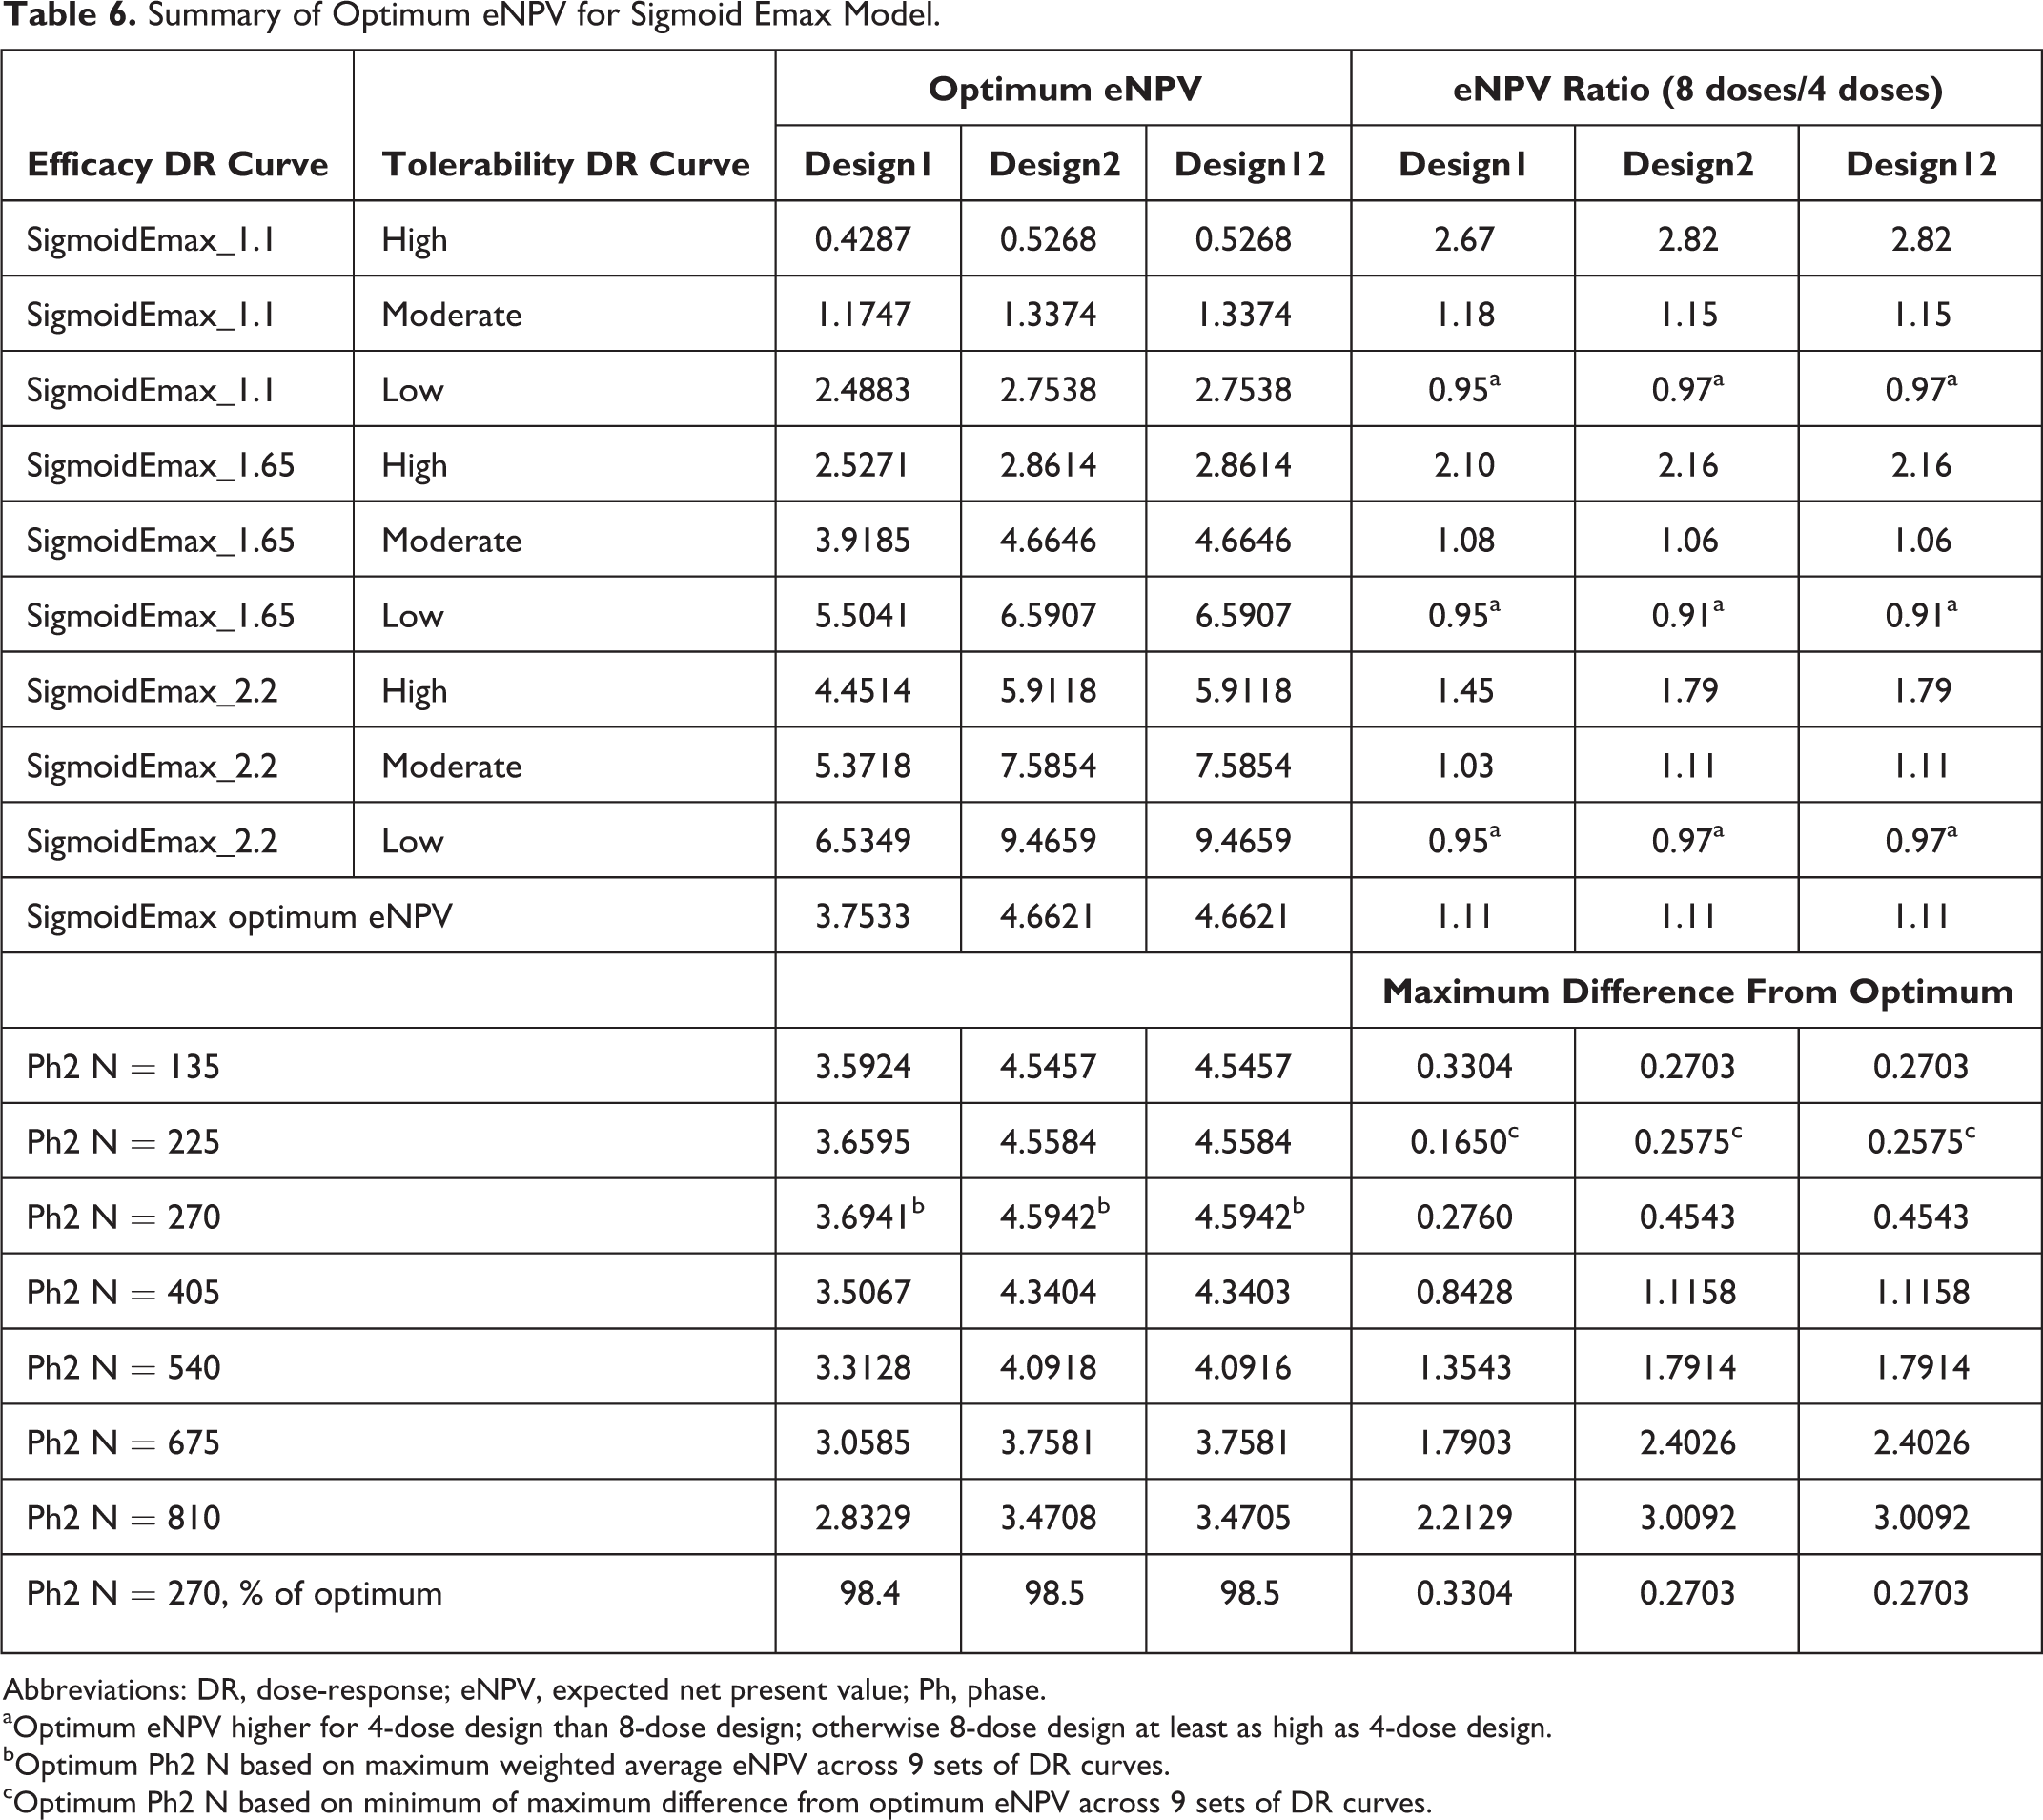
Abbreviations: DR, dose-response; eNPV, expected net present value; Ph, phase.
aOptimum eNPV higher for 4-dose design than 8-dose design; otherwise 8-dose design at least as high as 4-dose design.
bOptimum Ph2 N based on maximum weighted average eNPV across 9 sets of DR curves.
cOptimum Ph2 N based on minimum of maximum difference from optimum eNPV across 9 sets of DR curves.
Overall optimal Ph2 sample size could be computed by combining the results across the 9 DR curve scenarios. Two potential methods are used. 2 The first assumes a 60% chance of having a TRUE underlying maximum efficacy difference from placebo of 1.65, a 20% for each of the other two efficacy levels, and equal probability across the 3 tolerability DR curves. Applying these probabilities yields the optimal eNPV values for each sample size as shown in Table 6, and among those, N = 270 maximizes the eNPV for all 3 designs. The mini-max approach takes the minimum of the maximum difference from optimal eNPV for each sample size, 2 and yields 225 as the optimal Ph2 sample size.
Similar results were observed for the exponential DR curve (Tables 7 and 8), except the magnitude of difference between Design2 and Design1 was generally smaller than 10%, except for the high-efficacy DR curve, for which the difference was just more than 50% higher for Design2 when tolerability rates were low. Also, the 270 Ph2 sample size was optimal via both the weighted method and by the mini-max method.
Phase 2 Sample Sizes With Optimal eNPV: Exponential Model.a
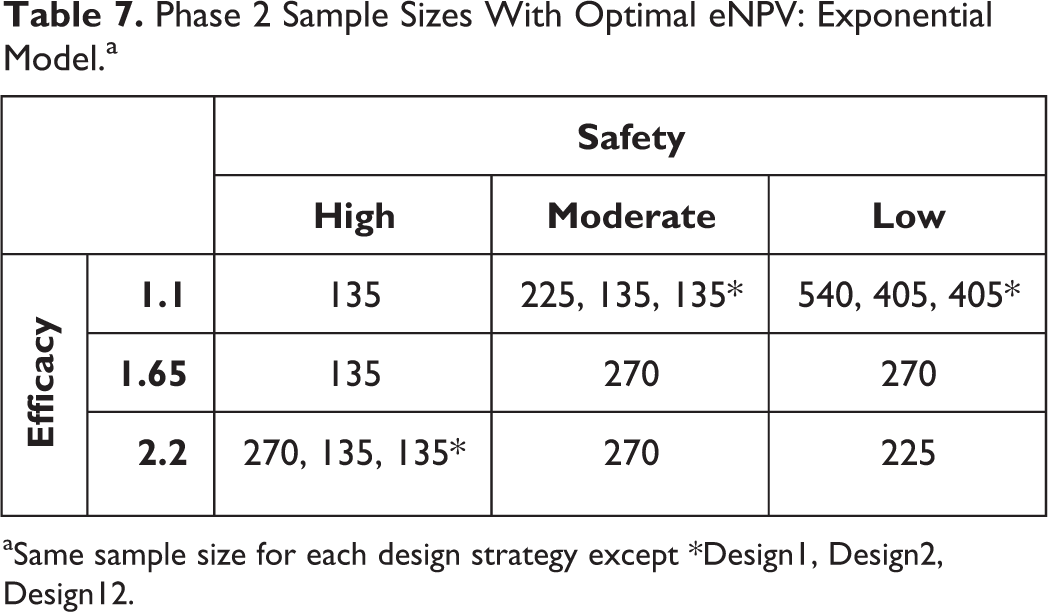
aSame sample size for each design strategy except *Design1, Design2, Design12.
Summary for Optimal eNPV for Exponential Model.
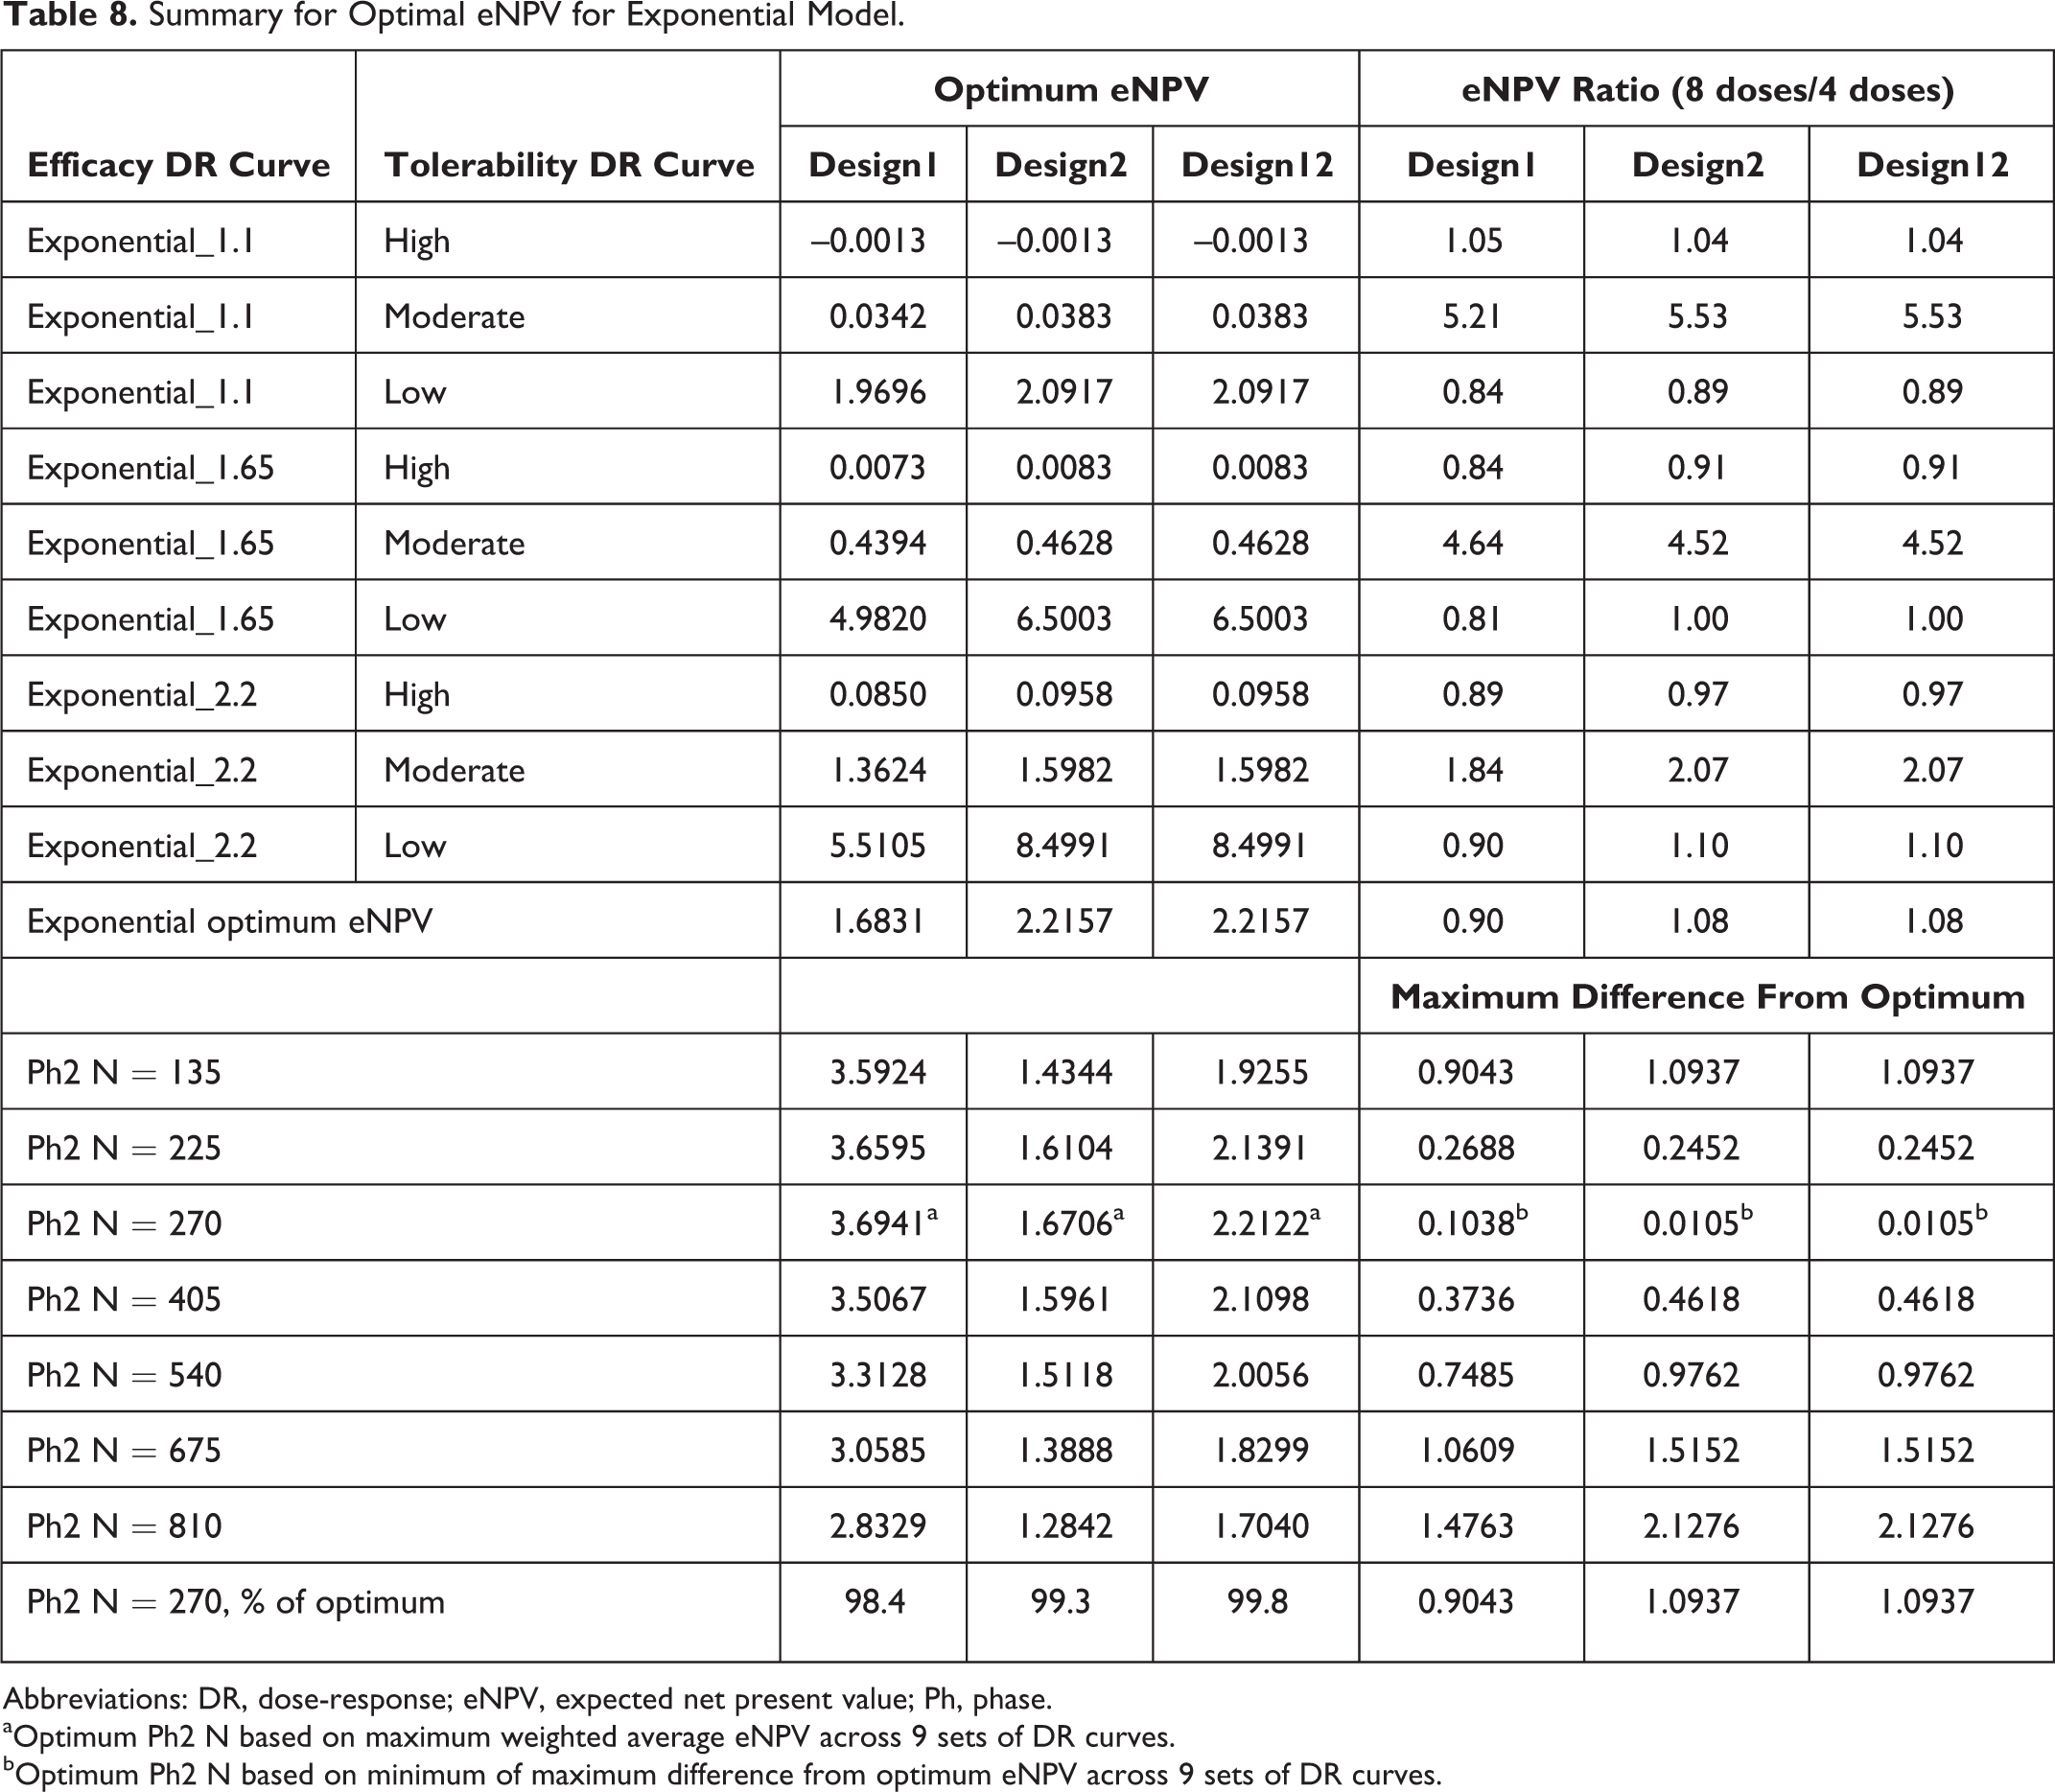
Abbreviations: DR, dose-response; eNPV, expected net present value; Ph, phase.
aOptimum Ph2 N based on maximum weighted average eNPV across 9 sets of DR curves.
bOptimum Ph2 N based on minimum of maximum difference from optimum eNPV across 9 sets of DR curves.
The comparison of 4 vs 8 doses in Ph2 yielded generally similar results for both the sigmoid Emax and exponential efficacy DR models (Tables 6 and 8, respectively). In particular, for the former model, 4 Ph2 doses yielded higher eNPV than 8 doses when tolerability was low, but the reverse was seen when tolerability was moderate or high. The magnitudes of difference were much larger (1.4- to 2.8-fold) for the moderate- and high-tolerability cases, when 8 doses yielded higher eNPV than 4 doses, in comparison to <1.1-fold when 4 doses yielded higher than 8 doses for the low-tolerability cases. A somewhat similar pattern was seen for the exponential efficacy DR curve cases (Table 8), except that the advantages were mixed across the tolerability curves. However, the magnitudes of advantage where much higher for 8 doses over 4 doses for all the moderate-AE DR curve cases (2- to 5-fold) than for the low- and high-AE cases, for which 4 doses showed higher eNPV than 8 doses (at most 1.2-fold).
Figures 4a and 4b demonstrate that the prediction of eNPV from the simulations is close to the TRUE NPV, becoming closer with increasing Ph2 sample size, and very close for most large Ph2 sample sizes. This indicates the decision making based on eNPV is not leading to bad decisions.
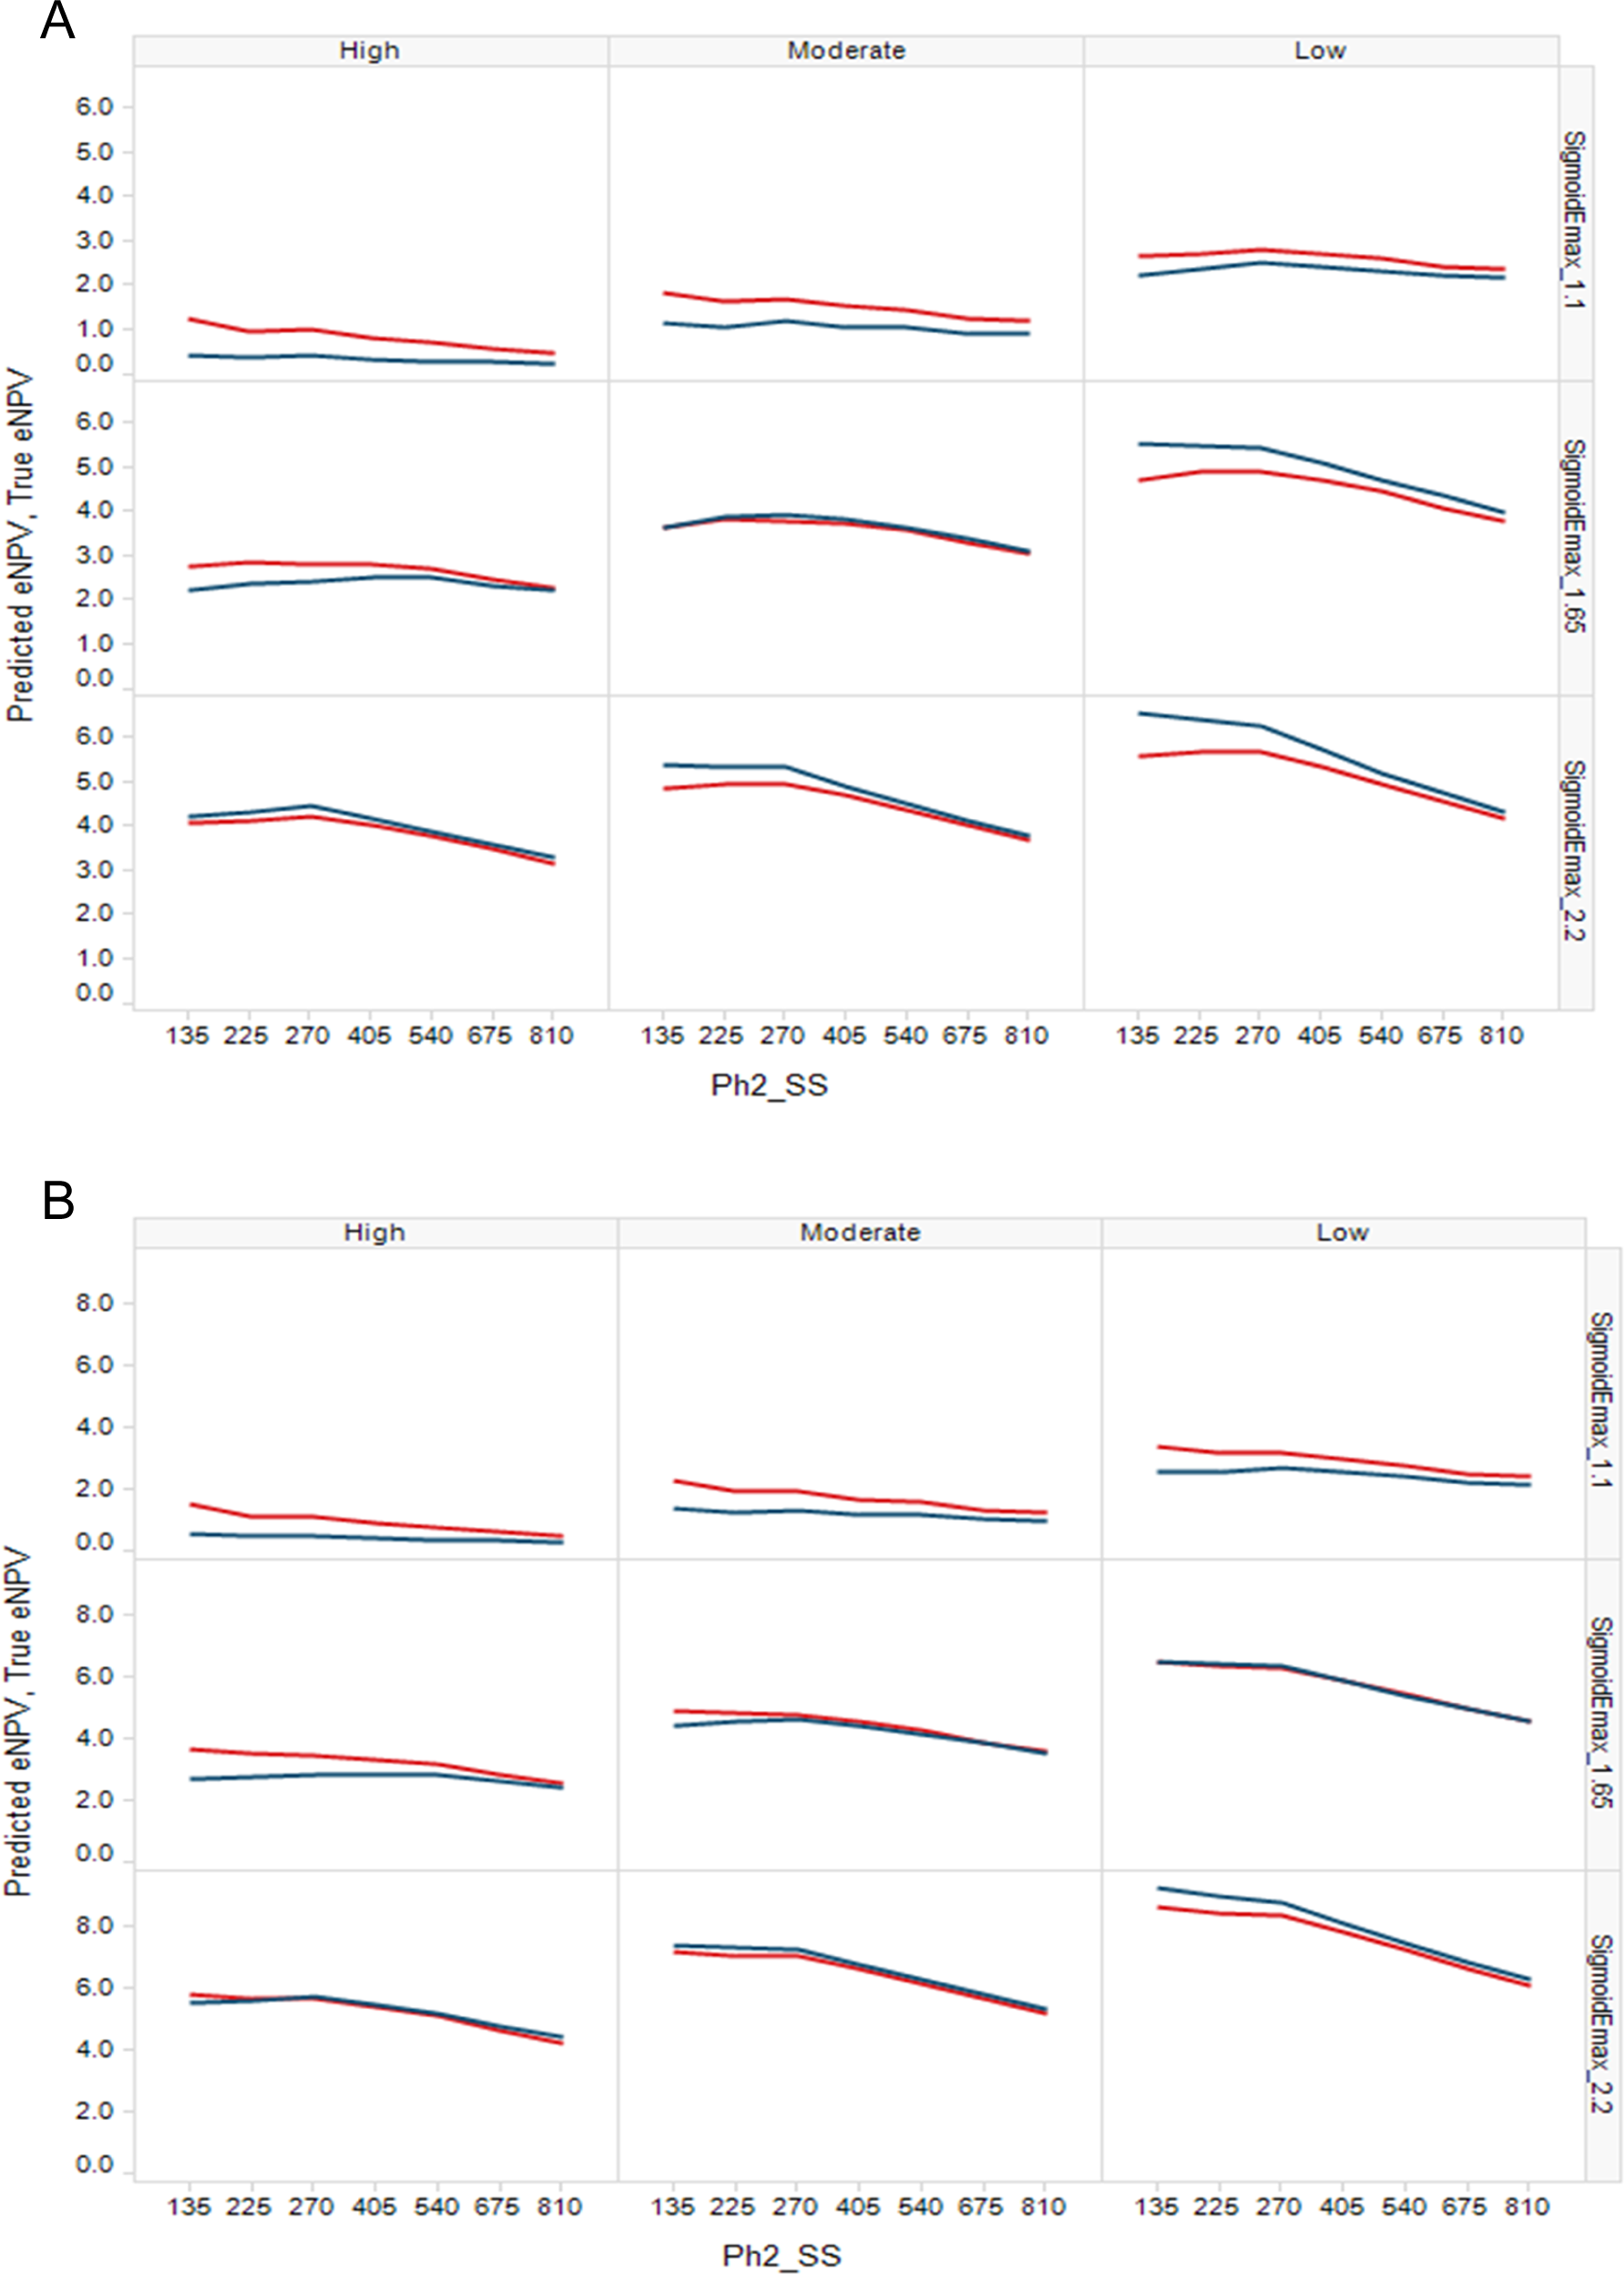
(A) Design1 Predicted eNPV (red) and TRUE NPV (blue) for the Ph2 sample sizes simulated. (B) Design2 Predicted eNPV (red) and TRUE NPV (blue) for the Ph2 sample sizes simulated. (Design12 not shown since eNPVs are very close to those of Design2.) eNPV, expected net present value; Ph2, phase 2. Figure available in color online.
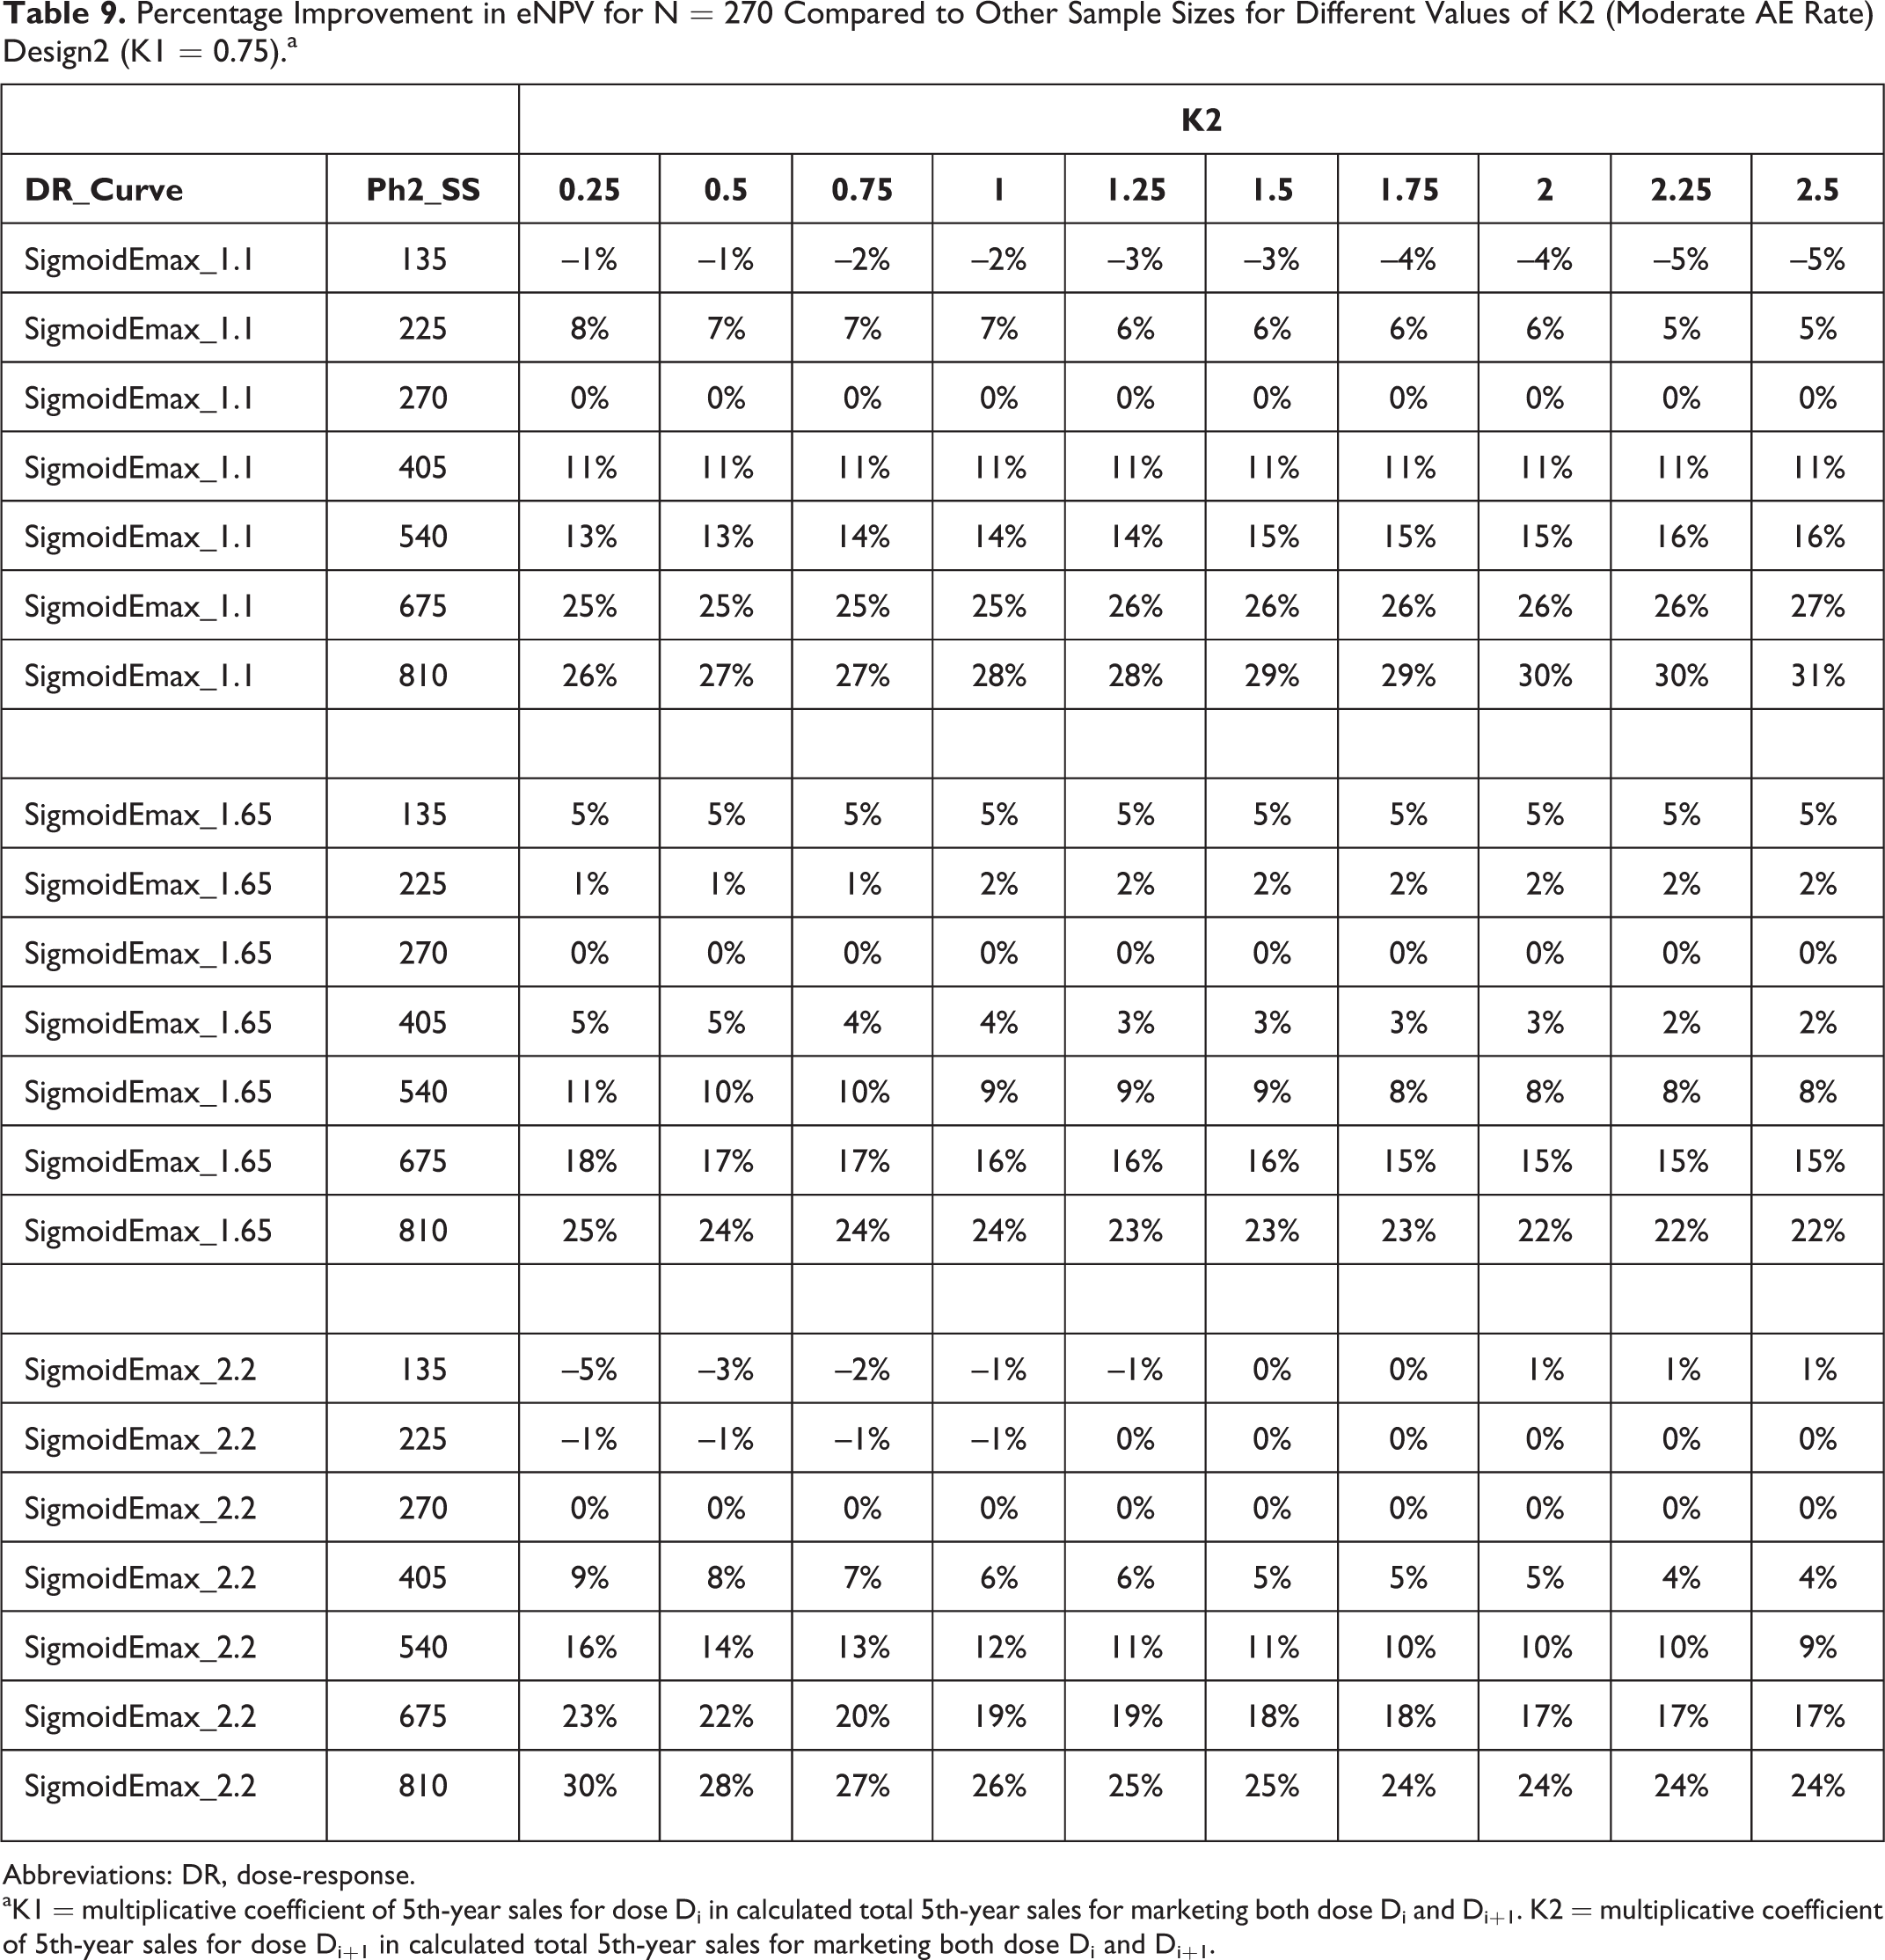
The simulation results were re-evaluated for different choices of the coefficient for the eNPV of the higher dose, when 2 doses are marketed. Those results are summarized in Table 9. The coefficient has little impact on the magnitude of eNPV advantage (or disadvantage in some cases) for Ph2 sample size 270 in comparison to other Ph2 sample sizes.
Percentage Improvement in eNPV for N = 270 Compared to Other Sample Sizes for Different Values of K2 (Moderate AE Rate) Design2 (K1 = 0.75).a
Abbreviations: DR, dose-response.
aK1 = multiplicative coefficient of 5th-year sales for dose Di in calculated total 5th-year sales for marketing both dose Di and Di+1. K2 = multiplicative coefficient of 5th-year sales for dose Di+1 in calculated total 5th-year sales for marketing both dose Di and Di+1.
Discussion
We have presented a case study for designing a Ph3 program and Ph3 trials based on maximizing eNPV. A key perspective for this work is to realize that reliance on eNPV as the sole driver of Ph3 design could lead to less than optimal therapeutic benefits to subjects if the key factors of efficacy and safety are not also optimized. Specifically, if the definition of NPV is derived only from economic outcomes and the Ph3 program is optimized solely based on NPV, then important aspects of efficacy and subject safety could be missed. The current work defines NPV directly in terms of efficacy and safety, so it avoids this potential pitfall. Among the findings from this work are the following.
Taking 2 doses to Ph3 always outperforms taking 1 dose, unless the Ph2 evidence is strong enough to confidently rule out potential for marketing 2 doses. However, it should be noted that larger sample sizes are usually needed to discriminate the two doses to justify marketing both doses, which can substantially improve NPV compared to marketing only 1 dose. To this end, we have included an algorithmic option to conduct 1 or 2 additional Ph3 trials to discriminate the two doses and justify marketing of 2 doses. The eNPV from the Design12 decision approach of whether to take 1 or 2 doses to Ph3 based on simulated eNPV is always close to that from the Design2 approach, so it is probably better to go with Design2 when there is a chance of marketing 2 doses or when the likelihood of obtaining significance for Di in both Ph3 trials is not high. However, this applies only to the cases studied in this paper; obviously there could be cases not studied in which Design12 would be preferable to Design2, for example, when Ph2 results are definitive regarding dose differences in efficacy and/or safety.
Ph2 sample size can be optimized to yield maximum eNPV if constraints on cost and timing are applicable. Obviously, the greater the Ph2 sample size, the higher the chance of correct dose-choice for Ph3; however, this is advised only if cost considerations do not weigh heavily on the decision, and the additional sample size can be completed in a similar time frame as the optimal Ph2 sample size.
Including more doses in Ph2 yielded generally higher eNPVs than did fewer doses, especially when the true underlying efficacy and/or tolerability DR curves are at borderline levels of acceptable/optimal value.
The relative differences in eNPV across sample sizes are only slightly affected by different choices of the coefficient for combining eNPVs of 2 marketed doses. The eNPVs from Design2 and Design12 are generally close to the NPV based on the true underlying efficacy and safety magnitudes of effects if they were known after Ph2. Thus, the simulation approaches described in this paper seem reliable.
Future work on simulating Ph2 through Ph3 and impact on marketing could include the following:
Ratio of revenue to cost or return on investment (ROI) could be considered along with safety and efficacy, as part of the driver for Ph3 trial design and for marketing 1 or 2 doses, instead of NPV. Since pharmaceutical industry budgets are limited, decision makers would likely want to know the impact of ROI. ROI can be calculated from expected values. However, it is important to note that a huge ROI could be obtained by small incremental cost projects that do not do much for revenue growth. This method of using expected values does not take into account risk because it works with expected values. Attempting to get the distribution of ROI is challenging because if there is a positive probability of negative revenue (eg, failure of the program), the ROI is minus infinity.
Other dose choices for Ph3 could be considered, for example, taking 2 doses to Ph3 which are not necessarily adjacent, a fixed strategy of taking Di and Di–1 to Ph3 instead of Di and Di+1, taking 3 doses to Ph3—either Di–1, Di, and Di+1, or 3 nonadjacent doses.
Adaptive dose-finding designs could be used in Ph2 and/or adaptive sample size re-estimation or group sequential Ph3 designs could be used to optimize costs and duration of trials.
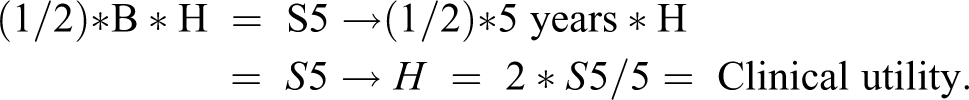
Clinical utility could be investigated as the driver for dose-choice/sample size/number of doses to Ph3 instead of eNPV. Clinical utility integrated over time would not have a patent expiration and thus no exponential decay. Rather it would be constant over time, so could be based solely on the value from the clinical utility table, and thus would be equal to instantaneous 5th-year sales. Software could estimate this from 5th-year sales by making exponential decay instantaneous to yield NPV as the area of the triangle between 0 and 5 years:
Subject characteristics could be used to decide on dose, and/or dose titration, based on optimizing clinical utility from accumulating data within subject. Other criteria for selecting more than one dose could be based on posterior probabilities of response from Di+1 exceeding that of Di for both safety and efficacy or clinical utility.
Conclusions
We have extended previous work 2 from a single Ph3 dose to consider studying, and, if appropriate, marketing 1 or 2 doses. We found that employing a quantitative strategy to choose 1 or 2 doses for Ph3 based on trial results does not substantially alter the eNPV compared to a strategy of always taking 2 doses to Ph3, if appropriate. Similar to previous findings, 2 for 1 Ph3 dose, we found that Ph2 sample size can be optimized at small to modest sizes when considering taking 2 doses to Ph3. We found that choice of number of Ph2 doses depends on the magnitudes and shapes of the true underlying efficacy and safety dose-response curves.
Footnotes
Acknowledgment
The authors thank the following: Karl-Fredrik Berman and Christy Chuang-Stein for their helpful discussions and suggestions on this work; Christy Chuang-Stein for review of an early version of the manuscript and helpful comments and feedback on it; and Sue-Jane Wang for her helpful discussions on this work, especially for pointing out the potential pitfalls of relying on NPV as the sole driver for clinical development planning and protocol design.
Declaration of Conflicting Interests
No potential conflicts were declared.
Funding
No financial support for the research, authorship, and/or publication of this article was declared.
References
Supplementary Material
Please find the following supplemental material available below.
For Open Access articles published under a Creative Commons License, all supplemental material carries the same license as the article it is associated with.
For non-Open Access articles published, all supplemental material carries a non-exclusive license, and permission requests for re-use of supplemental material or any part of supplemental material shall be sent directly to the copyright owner as specified in the copyright notice associated with the article.