
Abstract
Background:
In this article, we study the sample size calculations for the combination drugs of 2 monotherapies with a single approved dose level when the primary endpoints are binary.
Methods:
Two study cases are examined: In the first, each monotherapy has the same indication, while in the second, each monotherapy has a different indication. The sample sizes are calculated by using an asymptotic joint distribution of test statistics and employing unequal allocation for 3 popular measures of 2 proportions: the risk difference, the log relative risk, and the log odds ratio.
Results:
Results show that our proposed method produces smaller total sample sizes compared with the heuristic method.
Conclusions:
The total sample sizes can be reduced by incorporating unequal allocation and dependency between 2 test statistics.
Background
Combination drugs are widely used to treat many diseases. including cancer, hypertension, asthma, diabetes, and arthritis. Hence, pharmaceutical companies often seek to develop combination drugs that combine 2 monotherapies. In such cases, the pharmaceutical companies need to prove that the combination drug has greater efficacy than its 2 monotherapies in order to obtain approval from a regulatory agency. In this article, we consider 3-arm parallel designs, which are often used to compare 3 treatments (the combination drug and its 2 monotherapies) for the development of a combination drug.
The calculation of sample sizes is a key issue in planning such clinical trials. Several articles have been devoted to the study of sample size calculations for combination drugs. 1 –8 For cases where the primary endpoint is a continuous type, Kang and Shin 9 studied the sample size calculations for the combination drugs of 2 monotherapies where each has only 1 approved dose level. The purpose of this article was to extend their results to binary endpoints for 3 popular metrics: the risk difference, the log relative risk, and the log odds ratio.
Specifically, in this article, we modify the method of Laska and Meisner 1 in evaluating the asymptotic power function numerically and using unequal allocation to minimize the total sample sizes. We focus on instances in which each monotherapy of the binary primary endpoint has only 1 approved dose level. Although Laska and Meisner 1 mentioned a binomial model, they did not provide any specific results for binary endpoints. Therefore, in this article, we compare the total sample sizes computed by the proposed method with those calculated using the heuristic method for 2 monotherapies when each monotherapy has the same indication (study case 1) and when they have different indications (study case 2).
Study Case 1: When 2 Monotherapies Have the Same Indication
Notation and Hypotheses
Let A and B denote 2 monotherapies that have only 1 approved dose level for the same disease. When a pharmaceutical company seeks to develop a combination drug AB combining A and B, a 3-arm parallel clinical trial is often planned to compare the 3 treatments (monotherapy A, monotherapy B, and combination drug AB). Let X denote the primary endpoint for the same disease. Because A and B are 2 monotherapies for the same disease, X is the common primary endpoint for the 3 treatment groups. For instance, Jalyn (GlaxoSmithKline, London, UK) is a fixed-dose combination of dutasteride and tamsulosin that is used to reduce the risk of acute urinary retention. 10
Let XA represent the number of favorable events of interest from the group of treatment A. Similarly, XB and XAB can be defined. It is assumed that

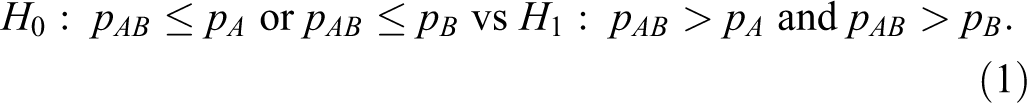
When 2 binomial proportions are compared, there are 3 popular measures: the risk difference, the log relative risk, and the log odds ratio. 11,12 The hypotheses for the development of the combination drug AB in terms of the risk difference are therefore given as follows:
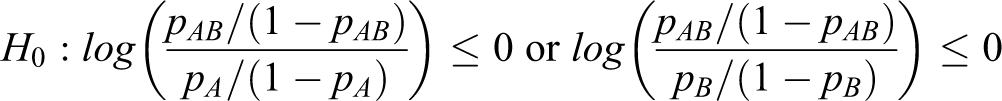
Similarly, the hypotheses in terms of the log relative risk are given by

and the hypotheses in terms of the log odds ratio are given by

In other words, the pharmaceutical company must show that the combination drug is more effective than each of the 2 monotherapies in relation to a preselected measure such as the risk difference, the log relative risk, or the log odds ratio.
The Heuristic Method
First of all, we would like to emphasize that the heuristic method is incorrect because of the assumption of independence described below. Nevertheless, the heuristic method has often been used by some pharmaceutical companies based on my personal experience. That is why we consider the heuristic method in this study.
For simplicity, we describe the heuristic method in terms of the risk difference. The heuristic method in terms of the log relative risk and the log odds ratio can be obtained similarly. The heuristic method to compute the sample sizes for the hypotheses in equation 1 is to divide them into 2 hypotheses as follows:


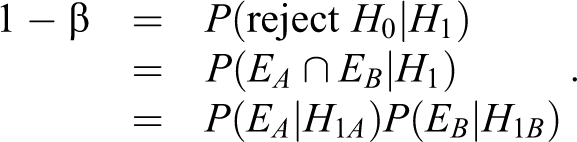
Note that rejecting both H 0A and H 0B in equations 2 and 3 is equivalent to rejecting H 0 in equation 1. Let EA and EB represent the events of rejecting each null hypothesis:

Then, by assuming that EA and EB are independent, the power of testing the hypotheses in equation 1 is
Let
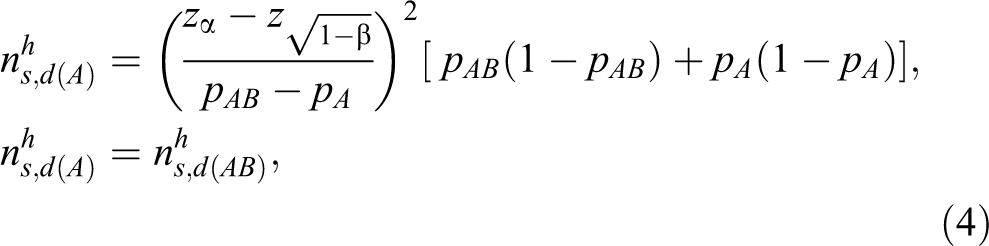
where zα
is the 100αth upper percentile of the standard normal distribution. Similarly,
By a similar argument, the sample size based on the heuristic method in terms of the log relative risk is
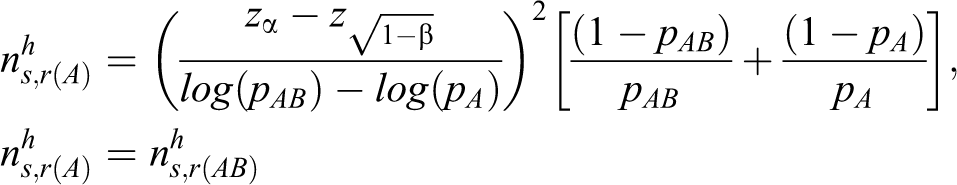
and the sample size based on the heuristic method in terms of the log odds ratio is
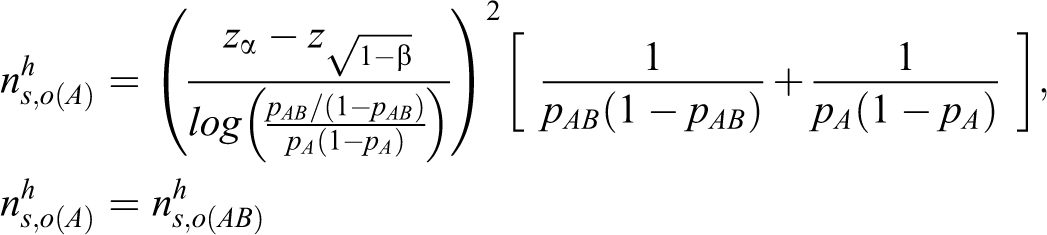
Therefore, the total sample sizes based on the heuristic method for the risk difference, the log relative risk, and the log odds ratio are
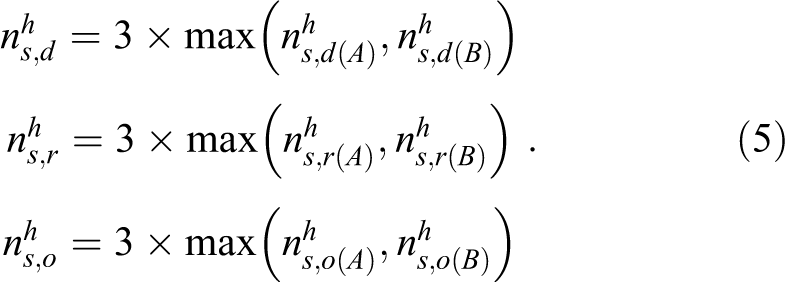
The heuristic method presents 2 problems. The first problem is that, since the group of the combination drug is involved with both EA and EB , the 2 events EA and EB are not independent. The second problem is that the total sample size in equation 5 might be unnecessarily large because the maximum is taken. The proposed method in study case 2 below solves these problems and reduces the total sample size.
Proposed Method for Sample Size Calculation
Kang and Shin 9 modified the method of Laska and Meisner 1 in order to calculate sample sizes for a continuous primary endpoint. In this section, we extend their results to binary endpoints. For ease of explanation, we explain the proposed method in terms of the risk difference. The proposed method in terms of the log relative risk and the log odds ratio can be obtained similarly.
Let Ts ,d(A) and Ts ,d(B) define the following test statistics for equations 2 and 3.
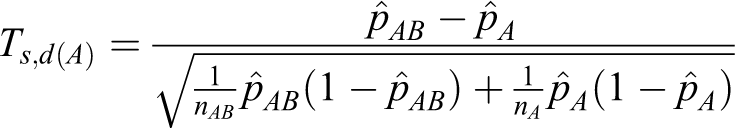
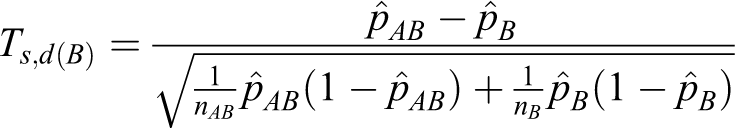
In this article we suggest that the power of testing the hypotheses in equation 1 be calculated directly from the asymptotic joint cumulative probability distribution of 2 test statistics Ts ,d(A) and Ts ,d(B). In other words,

where Zs
,d(A) and Zs
,d(B) are the same as Ts
,d(A) and Ts
,d(B) except that
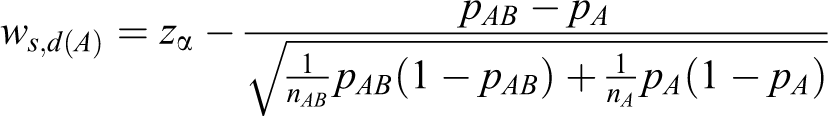
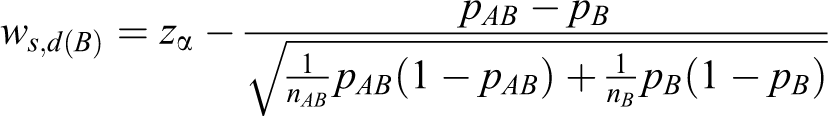
and
Note that zα is used in 2 inequalities in equation 6 because the min test is employed. 1 The min test requires both test statistics Ts ,d(A) and Ts ,d(B) to reject the null hypotheses H 0A and H 0B at the significance level α at most. Thus, the overall type I error rate is controlled under the significance level α regardless of the values of the unknown parameters. 1,14
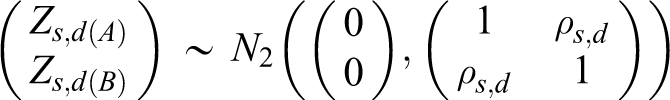
Therefore, the power can be expressed in terms of the cumulative distribution function of the standardized bivariate normal distribution
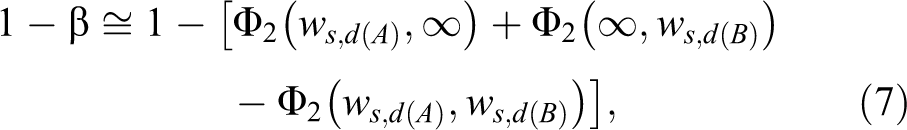
where Φ2 denotes the cumulative distribution function of the standardized bivariate normal distribution.
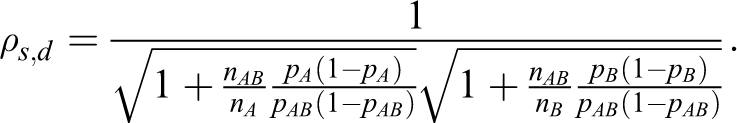
Since ρs ,d ≠ 0, the joint probability density functions of the standardized bivariate normal distribution have the shapes of rotated ellipses and the power function in equation 7 may not achieve the maximum power when ws ,d(A) = ws ,d(B). In addition, the difference between the probability of interest of the combination drug and those of the 2 monotherapies are not equal in many instances. That is,
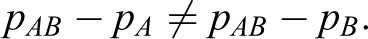
Therefore, we consider the unequal allocation, nAB : nA : nB = 1 : k 1 : k 2. Hence,
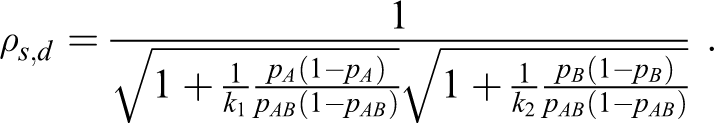
Let N represent the total sample size: N = nAB + nA + nB . Then,

For given values of pAB
, pA
, pB
, and N, the values of k
1 and k
2 are escalated from 0.1 to 3.0 by 0.01 increments to discover the maximum power and the values of k
1 and k
2 that maximize the power function in equation 7. For given values of pAB
, pA
, and pB
, we can find the minimal N and the optimal values of k
1 and k
2 that achieve 80% power by trying several values of N. Note that the optimal values of k
1 and k
2 depend on the values of pAB
, pA
, pB
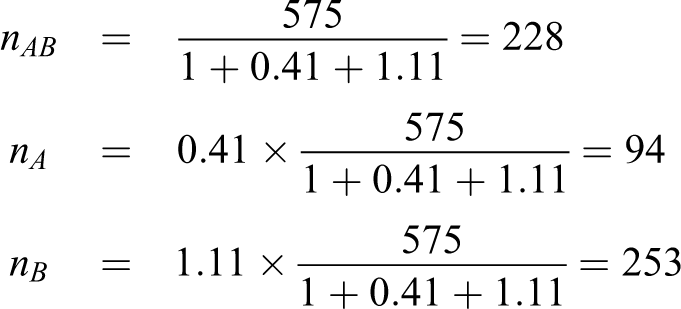
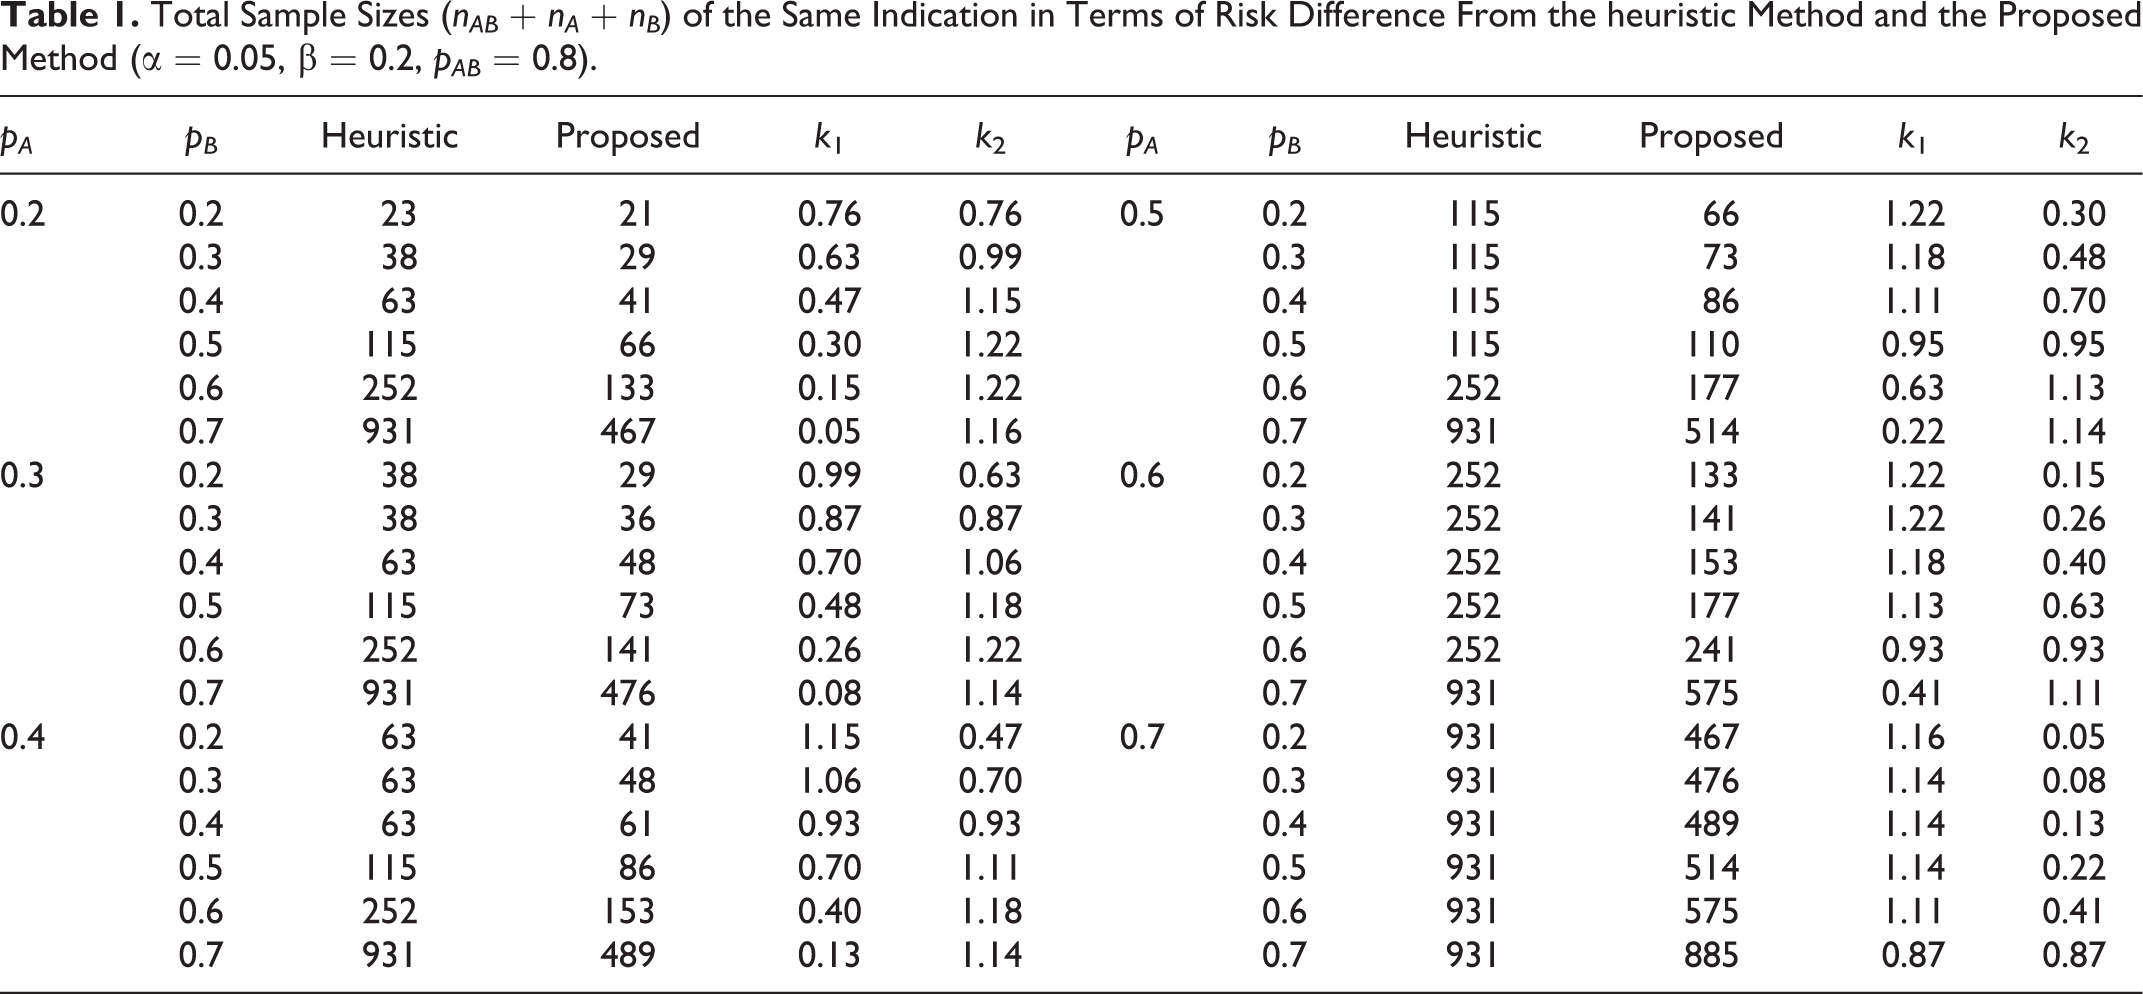
, and N. Table 1 displays the numerical results. The proposed method produces smaller total sample sizes than the heuristic method in all cases. For example, when pAB
= 0.8, pA
= 0.6, and pB
= 0.7, the total sample sizes produced by the heuristic method and the proposed method are 931 and 575, respectively. The proposed method should allocate 575 patients as follows in order to achieve 80% power.
Total Sample Sizes (nAB + nA + nB ) of the Same Indication in Terms of Risk Difference From the heuristic Method and the Proposed Method (α = 0.05, β = 0.2, pAB = 0.8).
For the log relative risk, the same arguments hold with the following conditions.
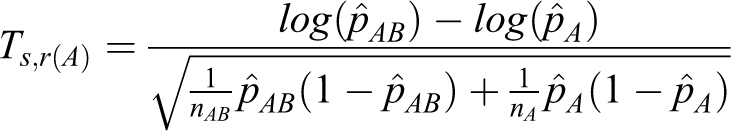


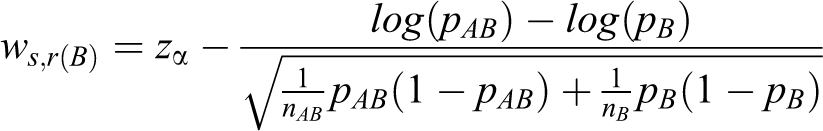
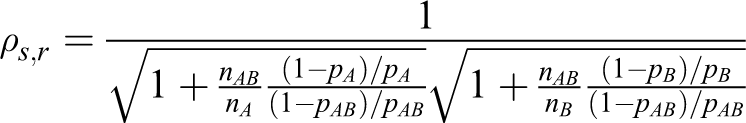
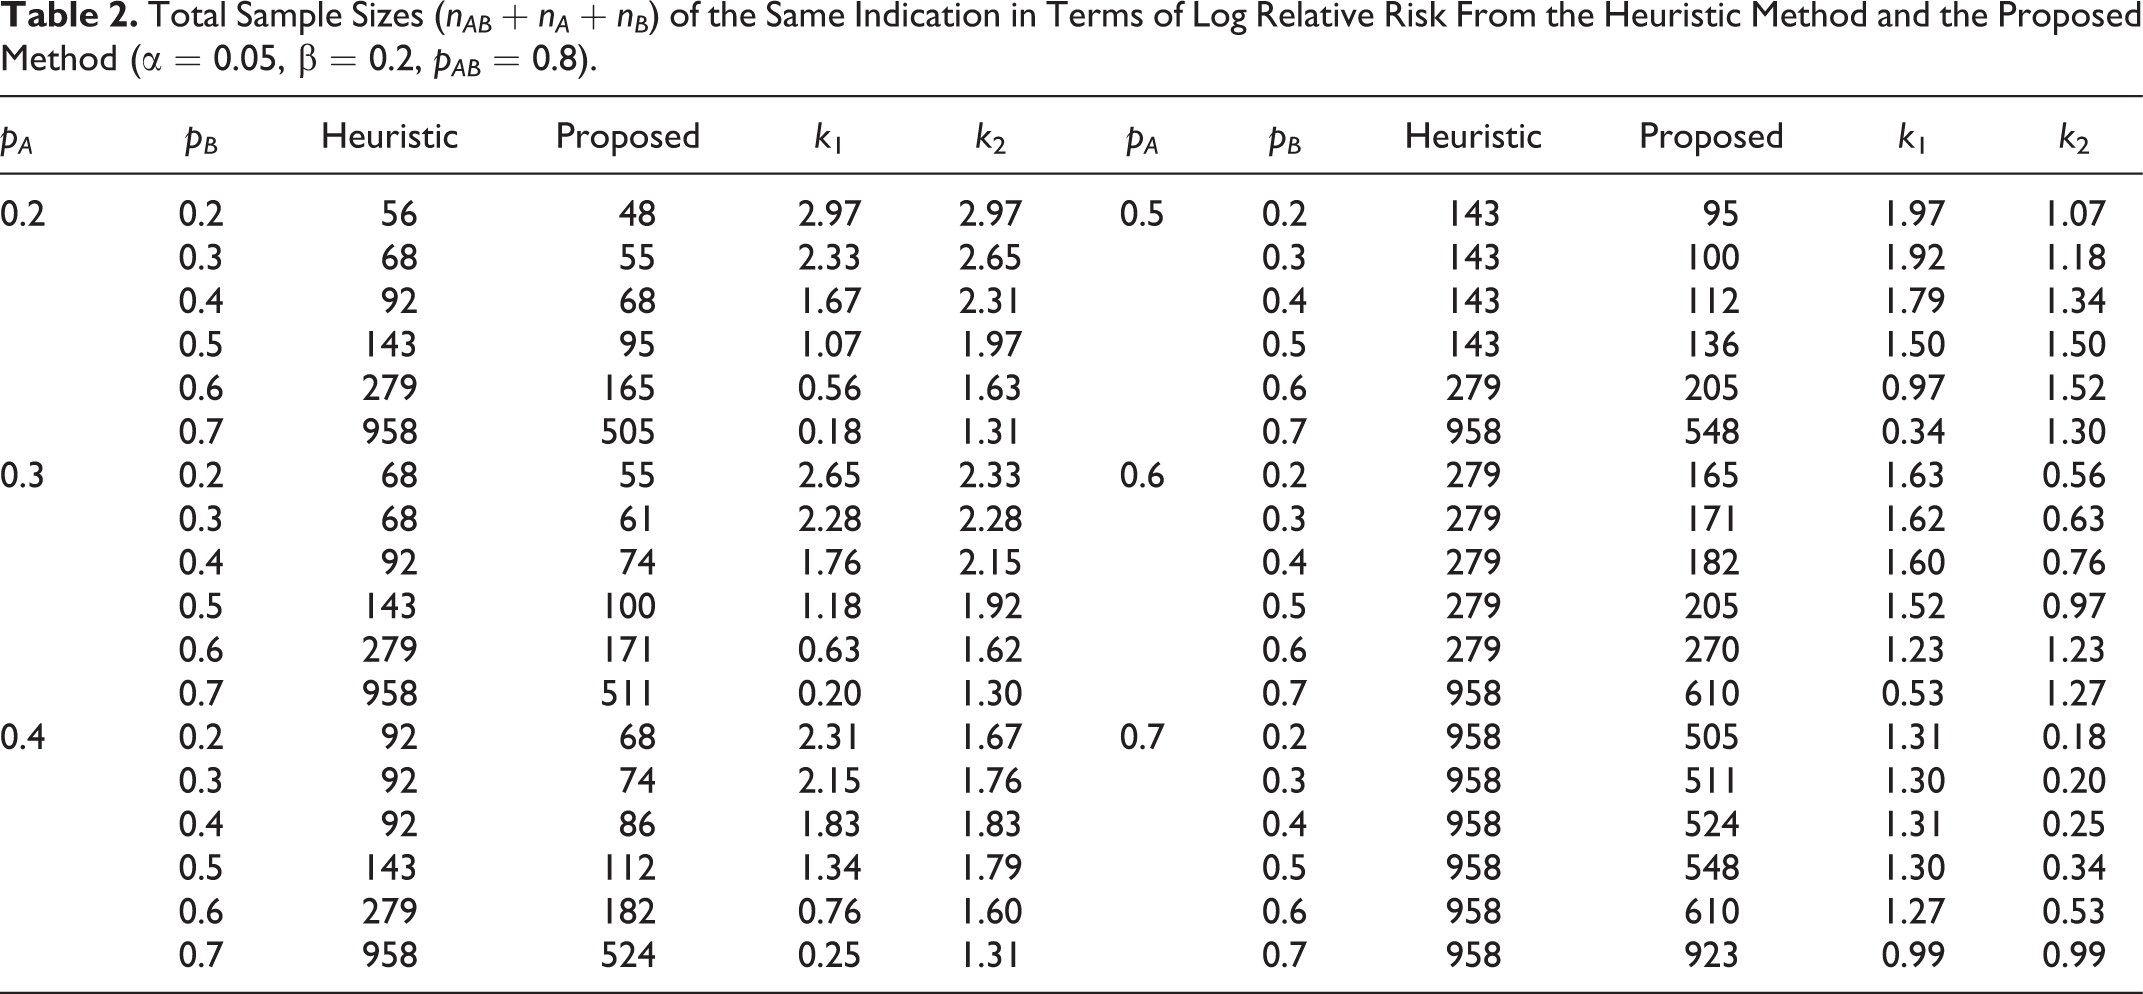
Table 2 shows the total sample sizes produced by the heuristic method and the proposed method for the log relative risk. The total sample sizes from the proposed method are smaller than those from the heuristic method in all cases.
Total Sample Sizes (nAB + nA + nB ) of the Same Indication in Terms of Log Relative Risk From the Heuristic Method and the Proposed Method (α = 0.05, β = 0.2, pAB = 0.8).
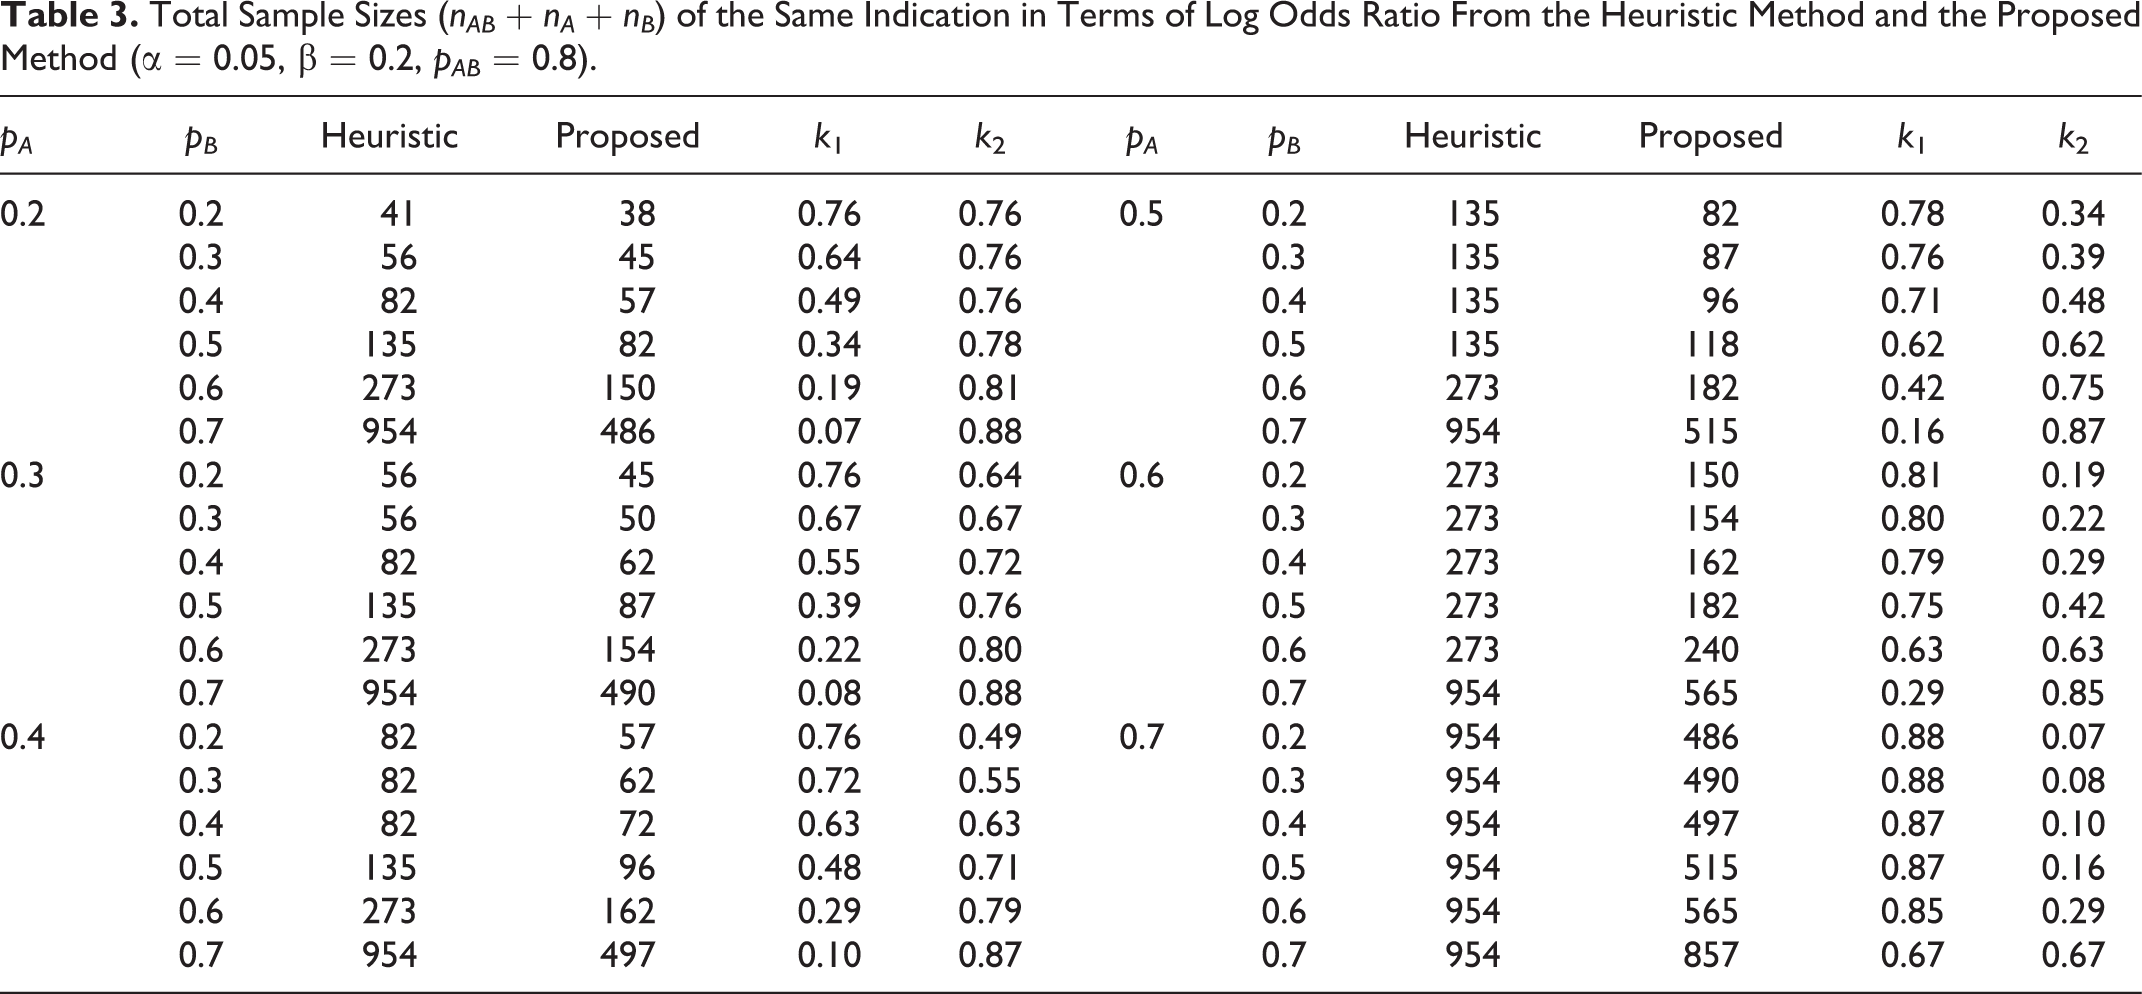
For the log odds ratio, the same arguments also hold with the following conditions.
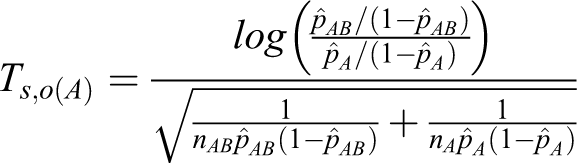
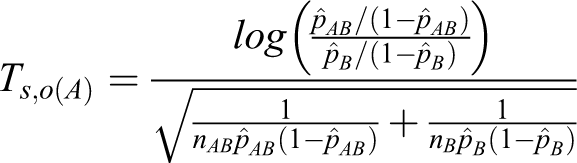

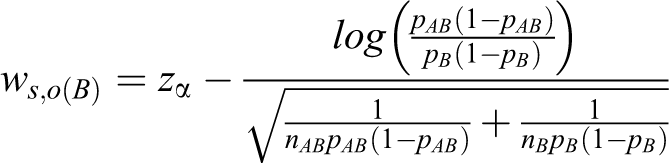
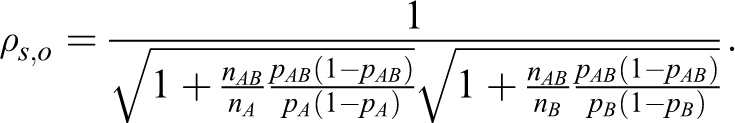
Table 3 presents the total sample sizes produced by the heuristic method and by the proposed method for the log odds ratio. In all cases, the proposed method produces smaller total sample sizes than the heuristic method.
Total Sample Sizes (nAB + nA + nB ) of the Same Indication in Terms of Log Odds Ratio From the Heuristic Method and the Proposed Method (α = 0.05, β = 0.2, pAB = 0.8).
Study Case 2: When 2 Monotherapies Have Different Indications
Notation and Hypotheses
In the previous section, we considered 2 monotherapies for the same indication, while here we deal with 2 monotherapies for different indications used to make a combination drug. For example, Actifed (Johnson & Johnson, New Brunswick, NJ) is a fixed-dose combination of triprolidine and pseudoephedrine that is used to treat seasonal allergic rhinitis (SAR). 15 Triprolidine is an antihistamine used to treat hay fever–like symptoms, while pseudoephedrine is a sympathomimetic used to alleviate nasal congestion.
Let A and B denote 2 monotherapies for 2 different diseases, each with only 1 approved dose level. Suppose that a pharmaceutical company would like to develop a combination drug that combines A and B. Laska and Meisner 1 did not explain how their method might be applied to this situation.
Suppose that the pharmaceutical company plans a 3-arm parallel clinical trial in order to compare the 3 treatments (monotherapy A, monotherapy B, and combination drug AB). Let X and Y be the primary endpoints of the 2 different diseases for the 2 drugs A and B, respectively. It is assumed that
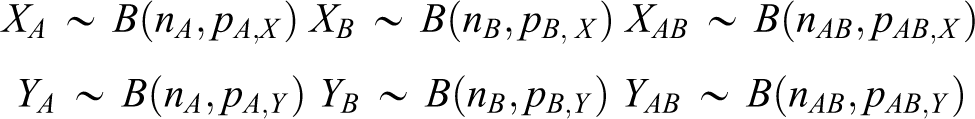
and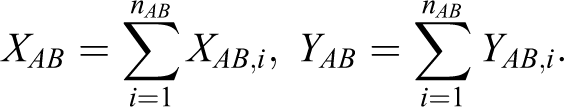
Furthermore, it is assumed that

because the 2 primary endpoints (X and Y) are measured from the same patient in the group of the combination drug.
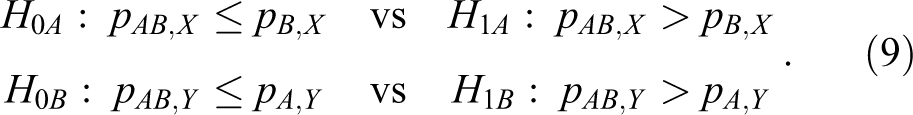
On this basis, we would like to test the following hypotheses for the development of the combination drug AB in terms of the risk difference:
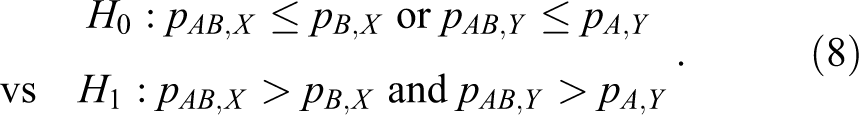
It is noted that pA , X and pB , Y do not appear in the hypotheses in equation 8. The hypothesis H 1A : pAB ,X > pB ,X implies that the combination drug AB has significant additional efficacy in treating the first disease by adding the treatment A. Similarly, the hypothesis H 1B : pAB ,X > pA ,X implies that the combination drug AB has greater efficacy in treating the second disease compared with monotherapy A. Similarly, the hypotheses in terms of the log relative risk are given by
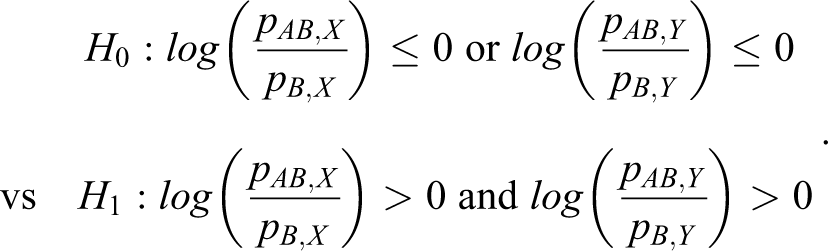
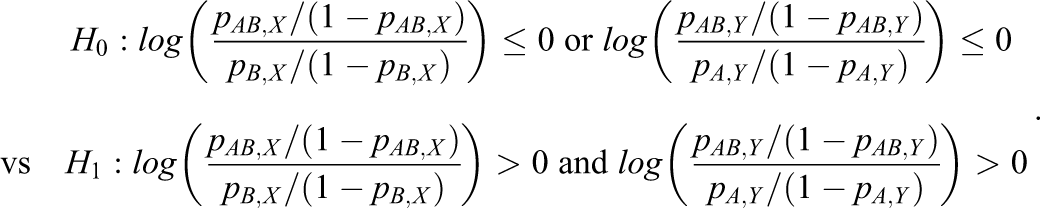
and the hypotheses in terms of the log odds ratio are given by
The Heuristic Method
As seen in the previous section, we would like to emphasize that the heuristic method is incorrect because of the assumption of independence. The heuristic method for calculating sample sizes for the hypotheses in equation 8 is to divide the hypotheses into 2 hypotheses:
Following similar arguments to those for study case 1, let
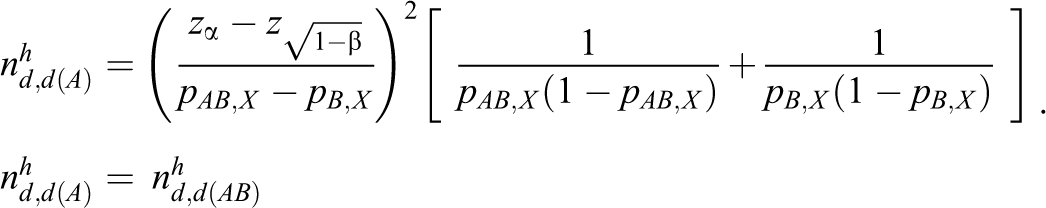
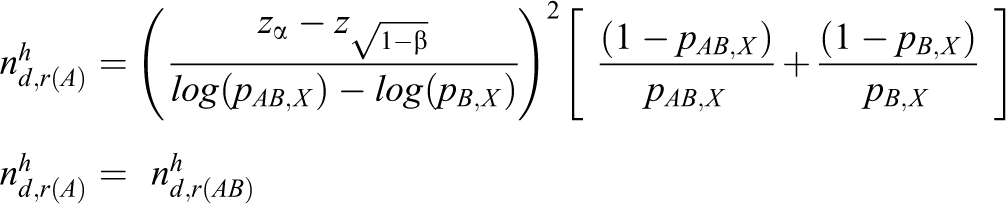
With a similar method,
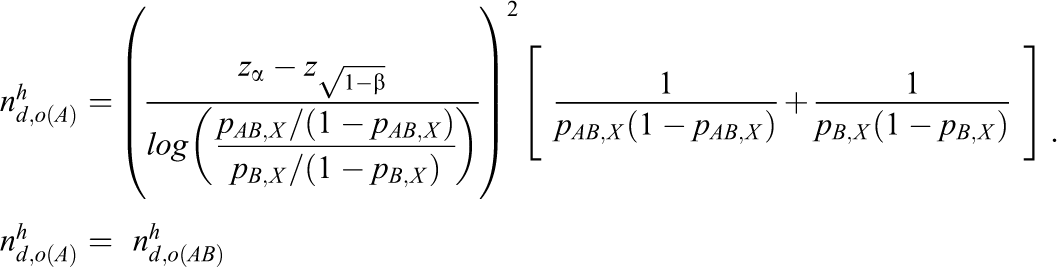
and the sample size based on the heuristic method in terms of the log odds ratio is
Therefore, the total sample sizes based on the heuristic method for the risk difference, the log relative risk, and the log odds ratio are
The heuristic method presents 2 problems, as pointed out in the previous section. For this reason, the total sample size based on the heuristic method might be unnecessarily large.
Proposed Method for Sample Size Calculation
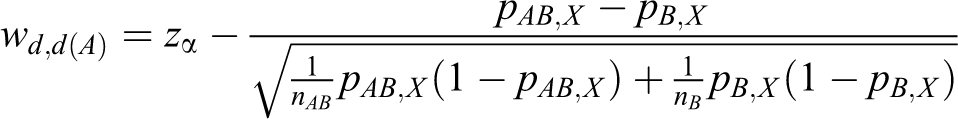
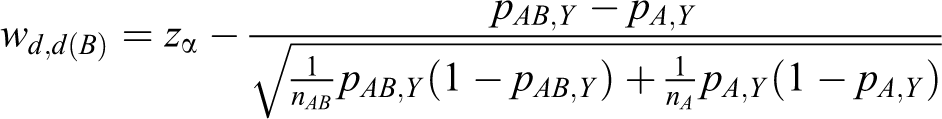
We now present a new sample size calculation method similar to the method presented in the previous section. The hypotheses in equation 8 can be divided into 2 hypotheses as follows.


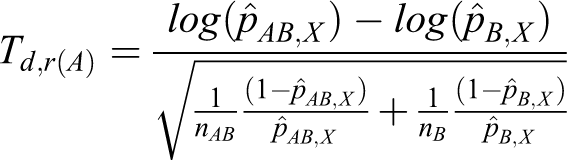
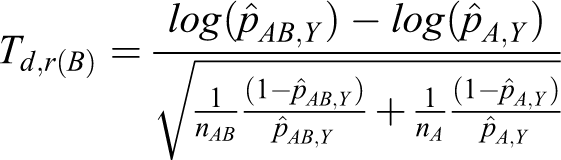
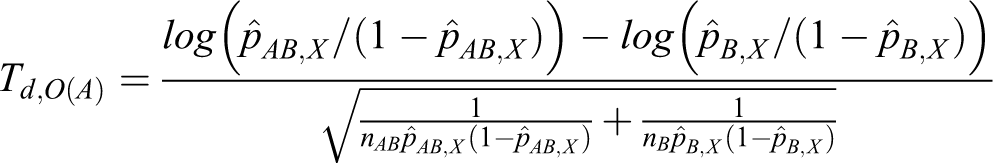
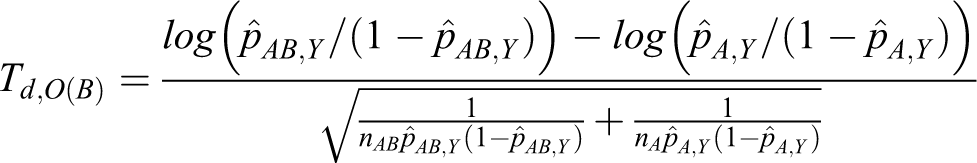
Let Td ,d(A) and Td ,d(B) denote the following test statistics for equations 11 and 12:
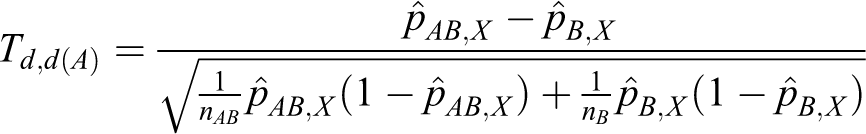
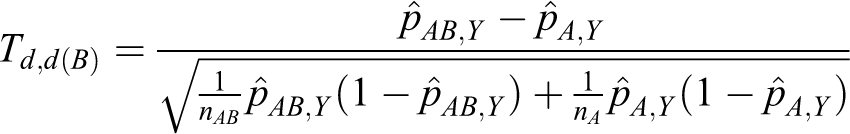
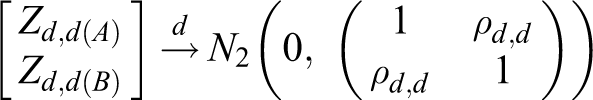
The power of testing the hypotheses in equation 8 is calculated directly from the asymptotic joint cumulative probability distribution of 2 test statistics, Td ,d(A) and Td ,d(B).
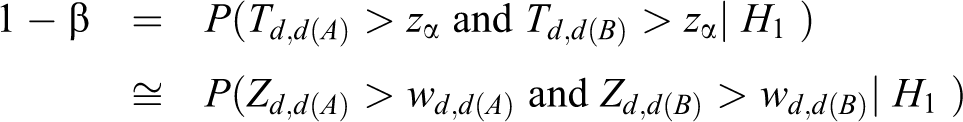
where Zd
, d(A) and Zd
, d(B) are the same as Td
,d(A) and Td
,d(B) except that
and
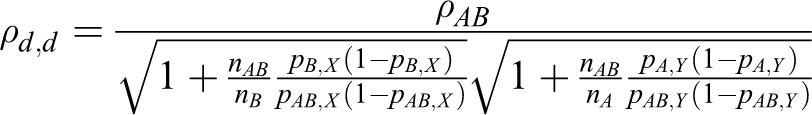
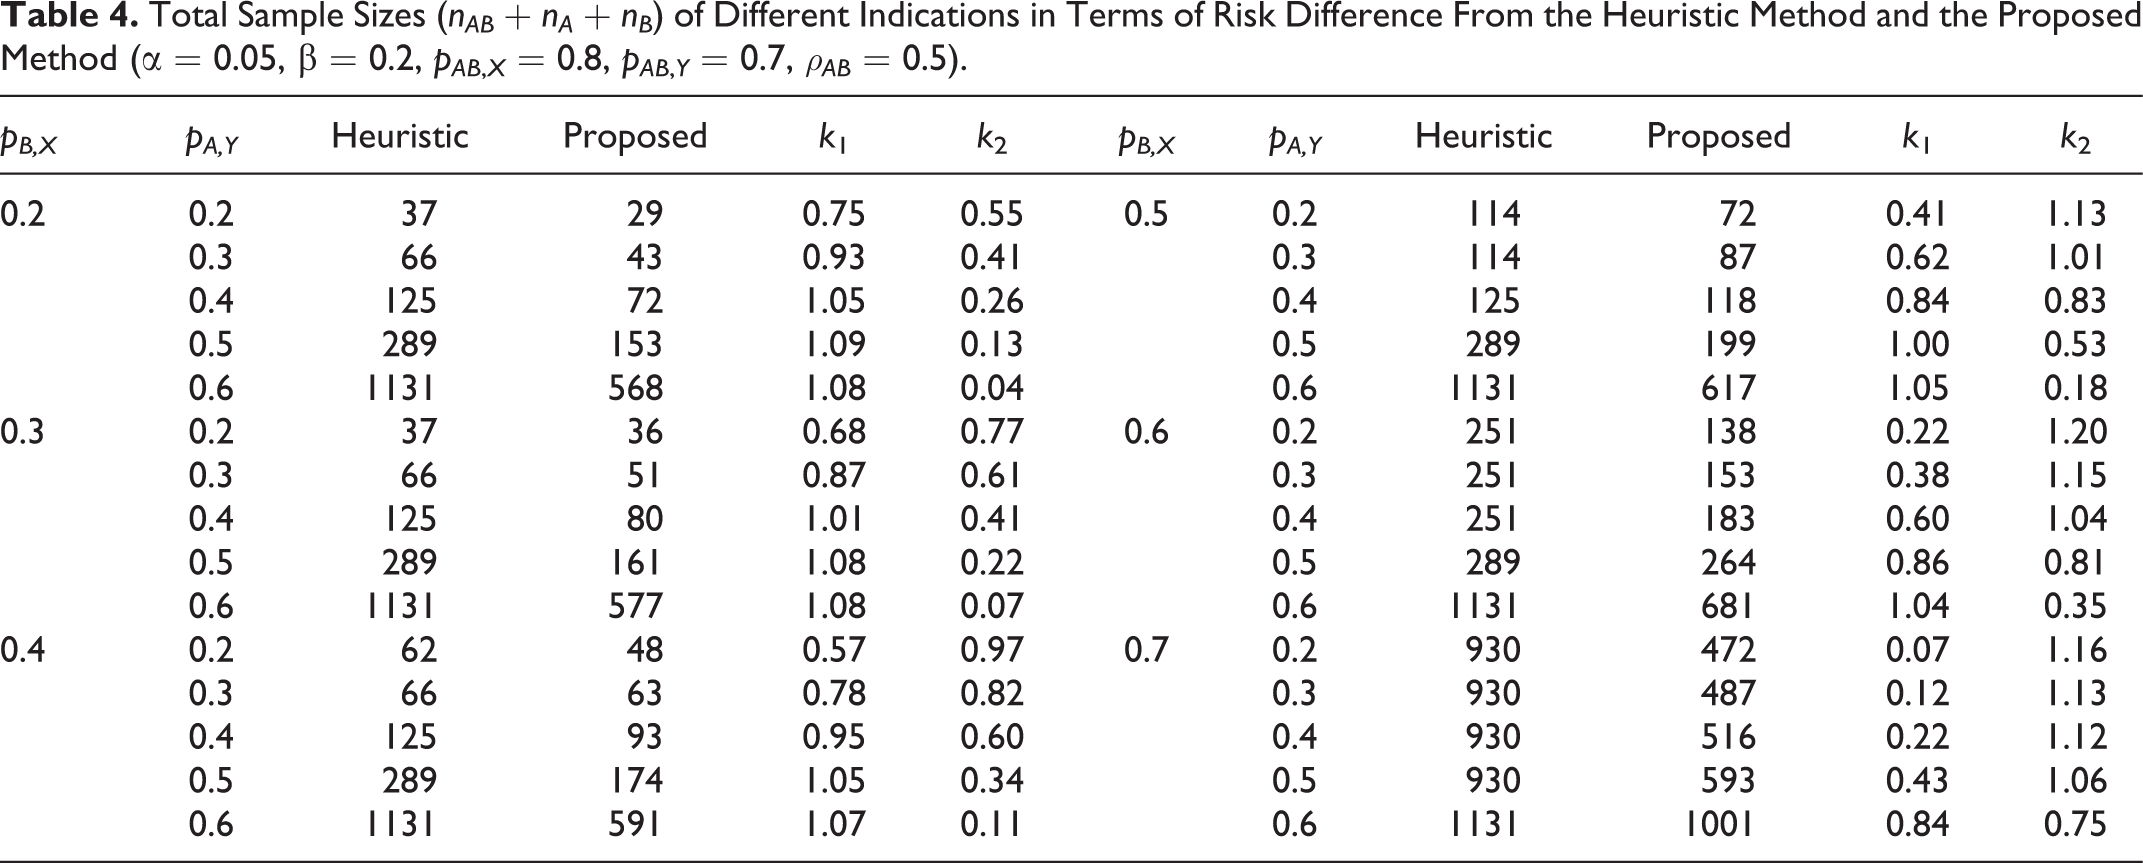
The mathematical derivation of ρd ,d is provided in the Appendix. The same approach as that used in study case 1 is used in this section, with nAB : nA : nB = 1 : k 1 : k 2. Table 4 displays the total sample sizes computed by the heuristic method and the proposed method. The proposed method produces smaller total sample sizes than the heuristic method in all instances.
Total Sample Sizes (nAB + nA + nB ) of Different Indications in Terms of Risk Difference From the Heuristic Method and the Proposed Method (α = 0.05, β = 0.2, pAB ,X = 0.8, pAB ,Y = 0.7, ρAB = 0.5).
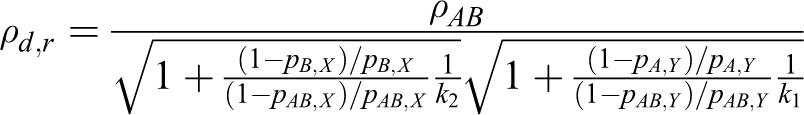
For the log relative risk, a similar conclusion can be obtained under the following conditions.
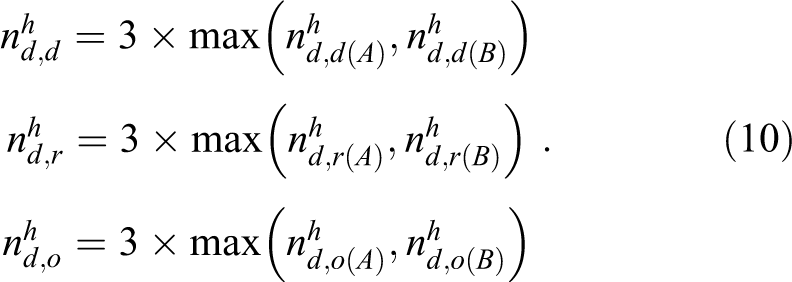
For the log odds ratio, similar results can also be achieved with the following conditions.
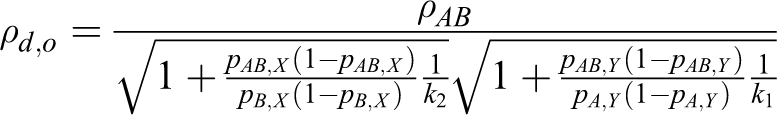
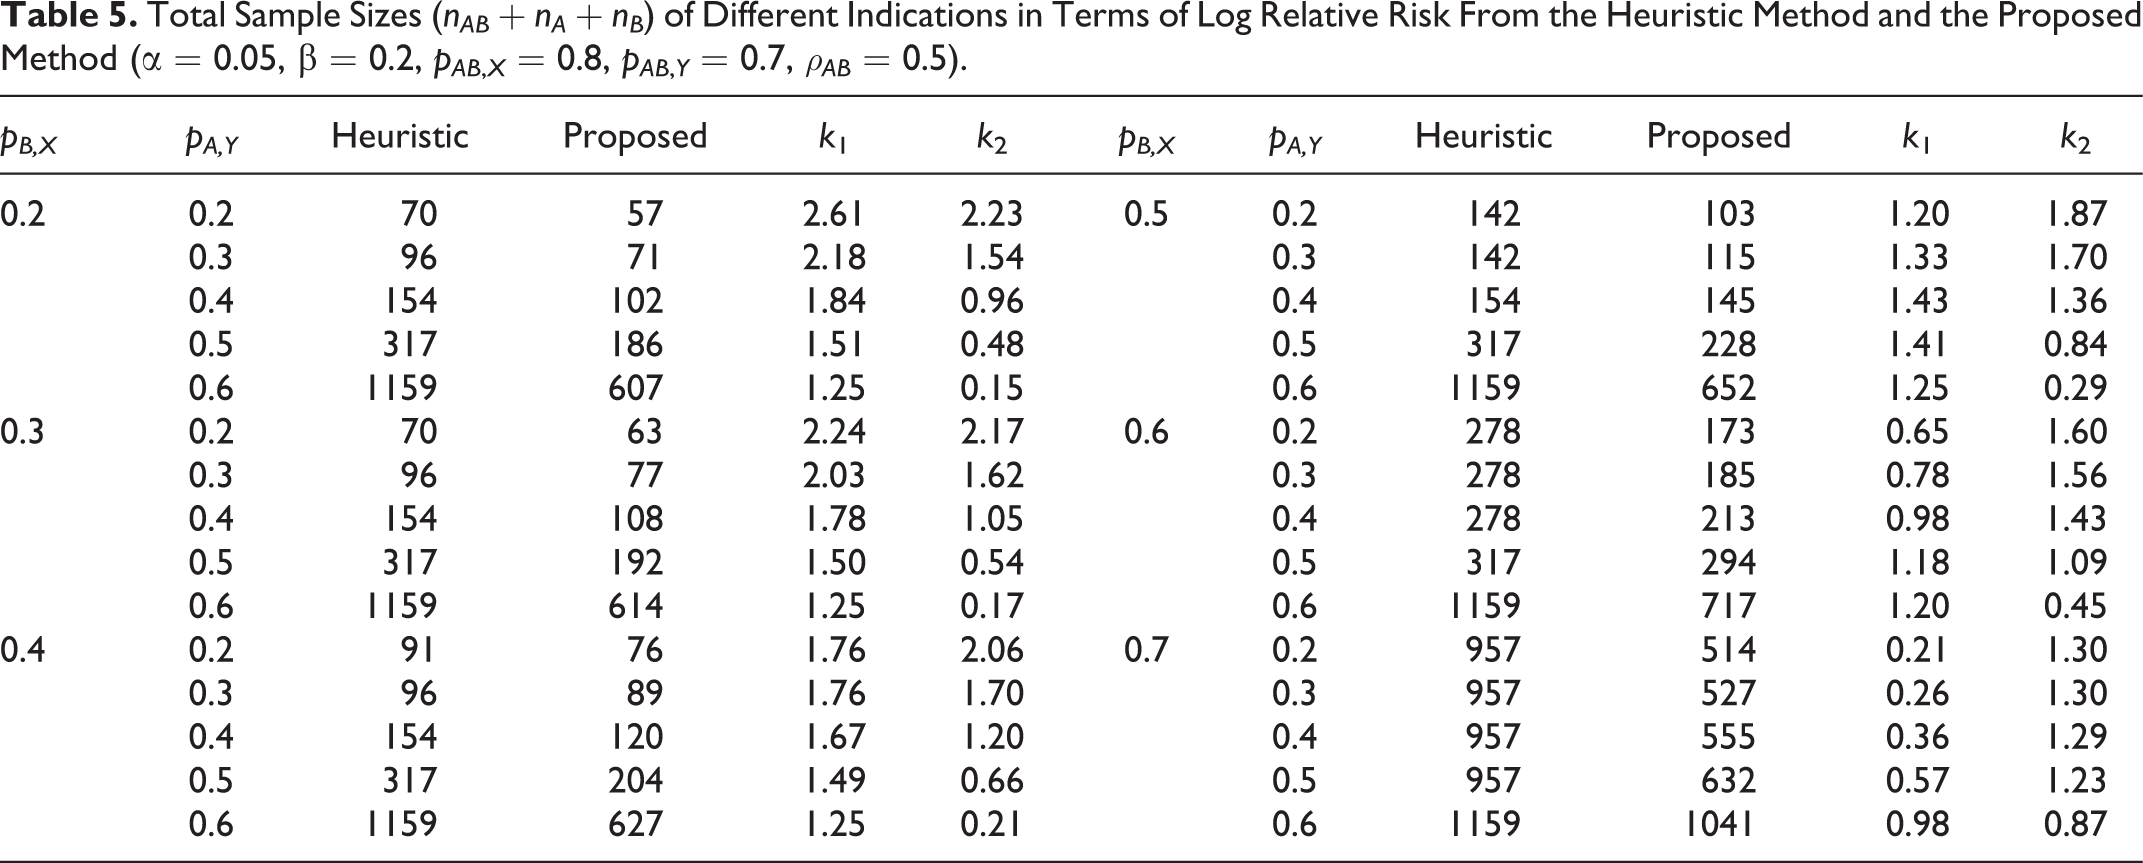
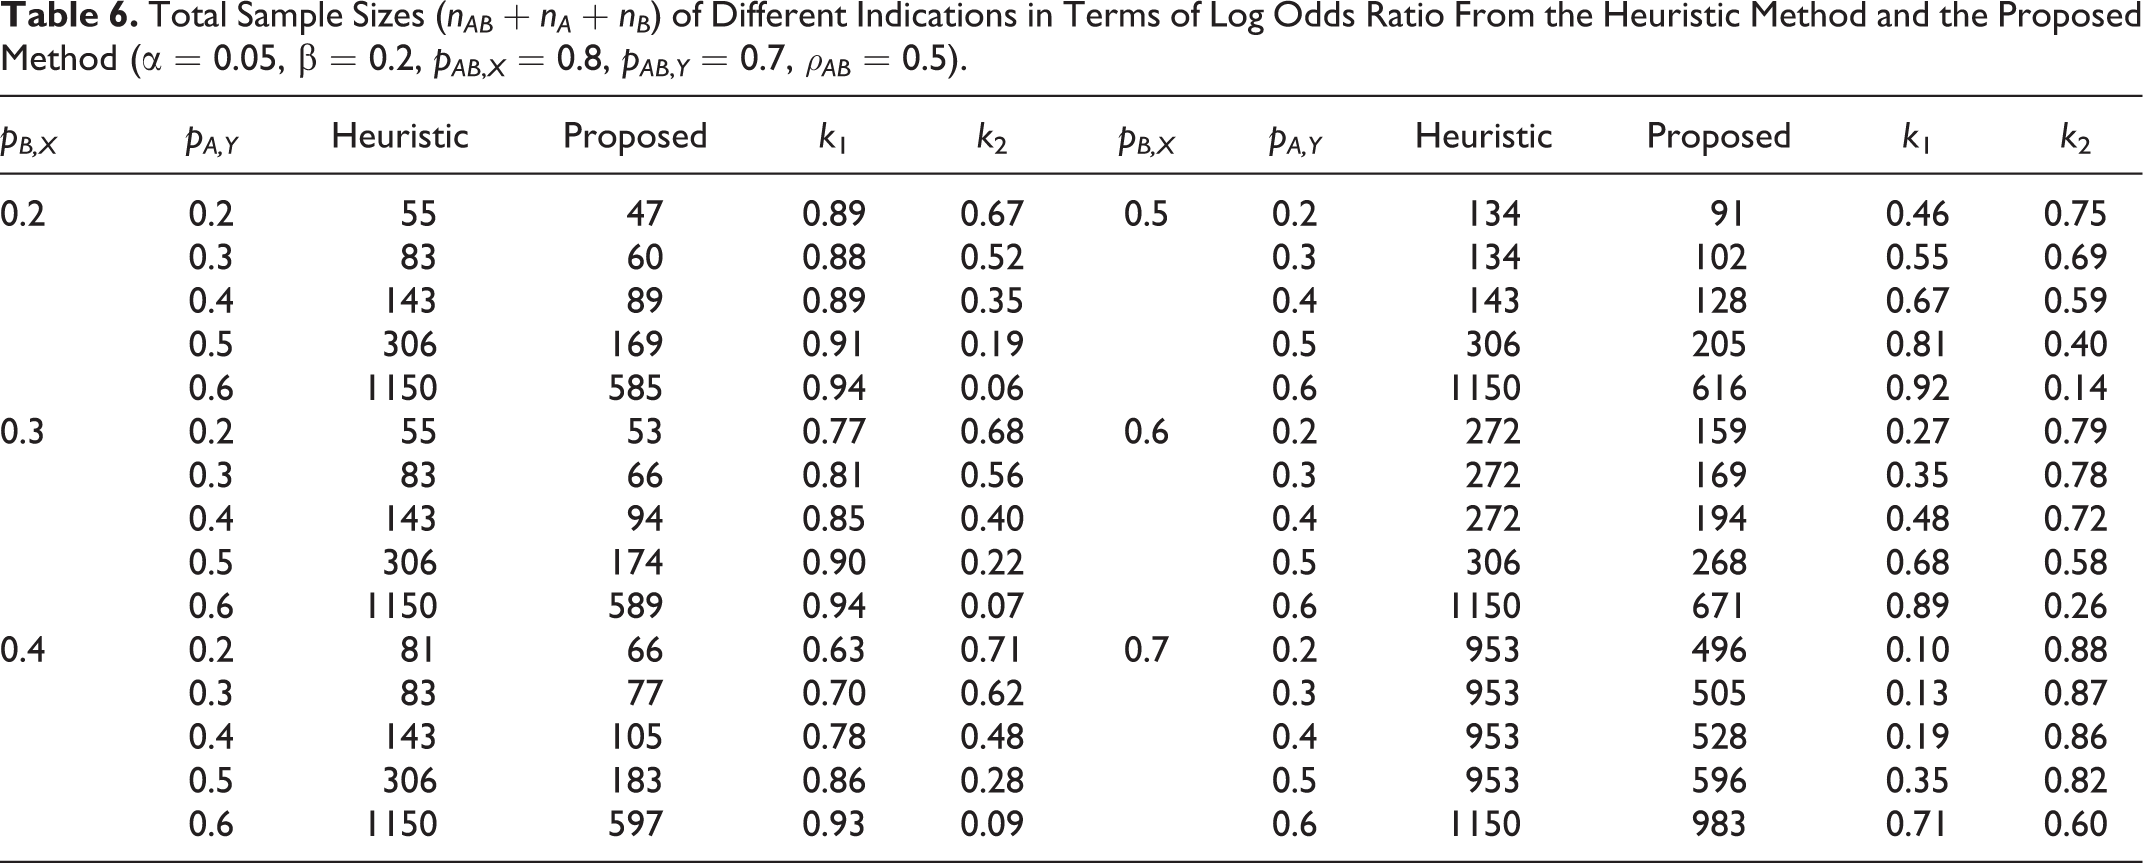
The mathematical derivation of ρd ,r and ρd ,o can be calculated per the Appendix. Tables 5 and 6 present the total sample sizes for the log relative risk and the log odds ratio. The total sample sizes from the proposed method are smaller than those from the heuristic method in all cases.
Total Sample Sizes (nAB + nA + nB ) of Different Indications in Terms of Log Relative Risk From the Heuristic Method and the Proposed Method (α = 0.05, β = 0.2, pAB ,X = 0.8, pAB ,Y = 0.7, ρAB = 0.5).
Total Sample Sizes (nAB + nA + nB ) of Different Indications in Terms of Log Odds Ratio From the Heuristic Method and the Proposed Method (α = 0.05, β = 0.2, pAB ,X = 0.8, pAB ,Y = 0.7, ρAB = 0.5).
Discussion
In this article, we calculated the total sample sizes for the development of combination drugs of two monotherapies with reference to the 3 popular measures of binary endpoints: the risk difference, the log relative risk, and the log odds ratio. The results in Tables 1 to 6 show that the risk difference produces the smallest total sample sizes and the log relative risk yields the largest total sample sizes for various values of (pA , pB ) (or pB ,X , pA ,Y ) when pAB = 0.8 (or pAB,X = 0.8, pAB,Y = 0.7, ρAB = 0.5). It would be interesting to investigate whether the same results hold for the different values of (pAB , pA , pB ) (or pAB ,X , pAB ,Y , ρAB , pB ,X , pA ,Y ).
The largest difference in sample size between the newly proposed method and the heuristic method happens when there is a large difference between pA and pB . When one treatment is obviously better than another, it may not be ethical to include the inferior treatment.
Footnotes
Appendix. The Asymptotic Joint Distribution of the Test Statistics
By the multivariate central limit theorem, we have
where
Since
where
we have the following result by continuous mapping theorem
because
and
Declaration of Conflicting Interests
No potential conflicts were declared.
Funding
This research was supported by the Basic Science Research Program through the National Research Foundation of Korea (NRF), funded by the Ministry of Education, Science and Technology (2013R1A1A2004920).