
Abstract
Background:
Adaptive design methodology has been well studied for continuous, binary, and survival outcomes for decades. However, for complicated endpoints such as recurrent hospitalization in the joint frailty setting and composite endpoint in the win-ratio setting, adaptive design is not intuitive because of sophistication in existing methods to perform sample size re-estimation.
Methods:
The objective of this paper is to propose a practical generalized approach to implement the above activities at the interim stage through approximation so that sample size re-estimation becomes easily understood and readily amenable.
Results:
Through simulations on representative complex situations, the proposed method can maintain the planned statistical power by sample size re-estimation while controlling the type I error.
Conclusion:
The proposed adaptive approach is easy to implement in general sample size re-estimation situations. Its validity can be verified through simulation under varying scenarios. In summary, this approach offers a transparent communication channel with regulatory agencies to facilitate clinical trial development regardless of the complexity of the underlying situations.
Background
Unlike the conventional nonadaptive trials, an adaptive statistical design provides the flexibility so that the interim assessment could modify the trial design midstream with statistical rigor to increase the likelihood for trial success. The typical trial modification is sample size re-estimation with only 1 interim analysis. To facilitate an adaptive design, the data between the first stage and the second stage should be independent. For a comprehensive survey of literature on adaptive design, one can refer to the FDA guidance document on adaptive design issued in September 2018. 1
One of the common utilities to implement an adaptive design is conditional power. When conditional power at the interim stage is undesirable, overall sample size can be increased to maintain the conditional power to a desired level (for instance, 80% or 90%). However, if the conditional power at the interim is too low, the sample size increase may be prohibitive, and even worse, increasing sample size in this setting may lead to claiming nonmeaningful treatment effect or inflating type I error in some extreme cases. The publications by Chen et al, 2 Mehta and Pocock, 3 and Gao et al 4 suggest optimal adaptive design when the conditional power is promising. The advantage of an adaptive design given promising interim result is that the final statistical test can be performed through the original conventional approach without weighting the test statistics at the two stages based on weights that are determined by the planned sample size. In another word, the promising zone approach can maintain or boost the probability for trial success given that the interim result is clinically meaningful and promising. In addition, the final statistical test can be performed in the traditional way just like there are no interim assessment and trial modification.
Majority of methods in the current literature can facilitate calculating the interim conditional power and sample size re-estimation relying on explicit formula without concerning the specific forms of the underlying test statistics. Lan and Wittes generalized the method through Brownian motion. 5 Interim calculation through the method by Mehta and Pocock 3 is only based on the interim Z value. Nevertheless, the Lan and Wittes method was not fully expanded into sample size re-estimation, and the Mehta and Pocock approach still requires some sophistication. Bauer et al 6 provided a contemporary overview of literature on sample size re-estimation in their 2016 paper. Although this paper offers in-depth history and comprehensive coverage of methodology for an adaptive design, it lacks a simplified illustration for implementation. Since for complicated endpoints such as recurrent hospitalization in the joint frailty setting and composite endpoint in the win-ratio setting, intuitive and simple implementation is not readily available in sample size re-estimation, there can be challenges to implement the adaptive strategy for non-sophisticated practitioners. This paper proposes a practical generalized adaptive approach for a wide range of situations.
Methodology
Suppose the initial plan divides the study population into two cohorts with sample size denoted as ni
, i=1, 2. The information associated with each cohort is

where Zi
, i=1, 2, are normalized test statistics for various type of endpoints. For example, they can be the Wald test statistics from the joint frailty model
8
or the Finkelstein and Schoenfeld test statistics
9
in the composite endpoint setting. Joint frailty model is a statistical approach to model two parallel statistical processes and their correlation so that challenging issues such as competing risk and informative censoring can be appropriately addressed. The Finkelstein and Schoenfeld method uses the hierarchical structure of a composite endpoint to score each pair of trial subjects to obtain an aggregate score, and then perform statistical test through a test statistic normalized by the mean and variance of the aggregate score. To illustrate, assume the test is one-sided:
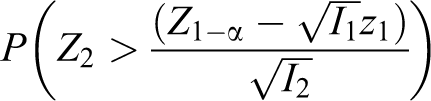
At the interim, Z 1 is realized as z 1. The conditional power can be calculated by the following formula under the alternative hypothesis:
Under the alternative hypothesis, in most situations, it is expected that Zi
, i=1, 2, follow the normal distribution
Based on the result from Chen et al, when the conditional power is 50% or higher, the sample size adjustment for the second stage can be flexible and the final test can be performed in the conventional way without inflating the type I error. Suppose the initial planned power is If interim conditional power is below 50% or above If interim conditional power is between 50% and
In case a more precise promising zone is preferred to the convenient rule of conditional power > 50%, the Mehta and Pocock method can be utilized.
If the sponsor has the resource and desire to increase the likelihood for trial success when the interim result is promising, the upper limit of the promising zone in terms of conditional power can be set at a higher value (eg 90% vs 80%), and the lower limit of the promising zone can be extended if the calculated value by the Mehta and Pocock method is smaller than the 50% conditional power. 3
Simulation Results
To be general, the simulation focuses on 2-arm studies and it is performed under the following frameworks. Simulations were performed using the R software.
Finkelstein-Schoenfeld Framework
For power simulation, assume yearly recurrent hospitalization rates of 60% for the control arm and 48% for the treatment arm. The yearly mortality rates for the control and treatment arms are 28% and 21%, respectively. Quality of life (QoL) improvement at the required analysis visit has a mean of 1 and standard deviation of 1 for control arm, and a mean of 1.5 and a standard deviation of 1 for the treatment arm. The QoL improvement is normalized for the ease of simulation. For type I error simulation, the recurrent hospitalization and mortality rates are set at 60% and 28%, respectively, for both treatment groups while for QoL measure, the mean is set at 1. The larger the QoL measure the better. The yearly attrition rate is 7.5%, and the monthly enrollment is set at 5 per month for simplicity and illustration. The final analysis time is when the last subject reaches 12-month follow-up. The recurrent hospitalizations and death are connected with a gamma frailty

Where exp(·) represent the exponential distribution, and
The Finkelstein and Schoenfeld method considers the hierarchy of death, recurrent hospitalizations, and normalized QoL improvement to rank each pair of trial subjects. For each pair of subjects, time to mortality will be compared to determine a winner. If indeterminate due to both subjects’ survival, the number of recurrent hospitalizations will be compared. If still a tie, then the normalized QoL improvement will be compared. Winner is set as 1 while loser is set as –1. Score for a tie is set as 0. The mean and variance calculated for an aggregate score for all pairs of subjects are used to construct a Z test statistic to assess the treatment effect. For the adaptive scheme to work, the aggregate scores for the interim cohort and the remaining cohort are calculated independently for the respective cohorts. The implementation of the adaptive strategy relies on the value of the interim Z test statistics.
With simulation iterations set at 2000 for power and 10,000 for type I error, Table 1 presents the simulation results. In Table 1, “No Overflow” means that only information used at interim assessment is used for the final test through formula (1), while “Overflow” means all available information for the interim cohort at the final data cut is used for the final test. To illustrate, suppose that the interim assessment is performed on day 200 in calendar time and the final test is performed on day 400 in calendar time in the survival setting. “No Overflow” means that data for the interim cohort are only used up to day 200 at the final test, though at the final test on day 400, subjects in the interim cohort have already cumulated data beyond day 200. On the other hand, “Overflow” means that available data beyond day 200 for the interim cohort is used for the final test.
Simulated Power and Type I Error.a
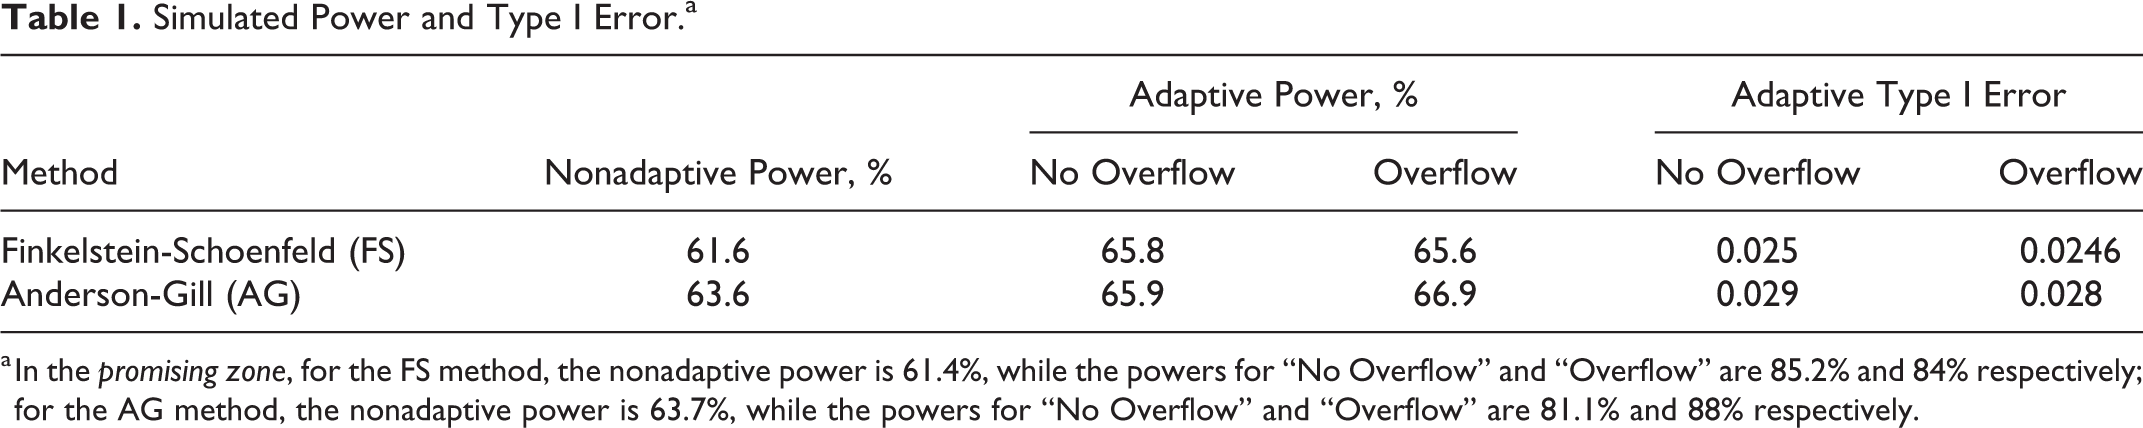
a In the promising zone, for the FS method, the nonadaptive power is 61.4%, while the powers for “No Overflow” and “Overflow” are 85.2% and 84% respectively; for the AG method, the nonadaptive power is 63.7%, while the powers for “No Overflow” and “Overflow” are 81.1% and 88% respectively.
Though the overall power increase is moderate (from 61.6% to 65.8% or 65.6%), in the promising zone (bottom of Table 1), the power increase is substantial: without adaptation, the power is 61.4%; with adaptation, the powers are 85.2% and 84% respectively under “No Overflow” and “Overflow.”
The type I error is controlled at the nominal level of 0.025 for both “No Overflow” and “Overflow” cases.
Anderson-Gill Recurrent Events
The simulation assumptions for the Anderson-Gill 10 model follow that for the Finkelstein-Schoenfeld method except the following: The yearly recurrent hospitalization rates for the control and treatment arms are set at 60% and 45%, respectively, so that the adaptive feature is more likely to be triggered.
The primary endpoint is recurrent hospitalization while death is a competing risk. The Anderson-Gill Cox regression with robust variance estimate is utilized for treatment effect estimation.
With simulation iterations set at 2000 for power and 10,000 for type I error, the simulation results are reflected in Table 1. The trend is consistent with that observed under the Finkelstein and Schoenfeld framework. The type I error under the Anderson-Gill model is slightly above the nominal level of 0.025. This could be due to random variation in simulation or some subtle systematic bias. Further investigation may be warranted. When correlation between recurrent hospitalization and death is strong, the joint frailty model analysis can be a preferred approach than the Anderson-Gill method. Limited simulation results using the joint frailty model yield similar trend observed above.
Discussions
Sample size re-estimation based on interim result through a rigorous statistical scheme can help achieve trial success in a more robust way. The statistical methodology is mature in the general setting when the endpoint of interest is binary, continuous, or time-to-event. However, in the complex situations when the endpoint is recurrent hospitalization in the joint frailty setting or composite endpoint in the win-ratio setting, existing literature may not offer intuitive and easy-to-implement perspective for nonsophisticated practitioners.
The proposed approach provides a practical and simple approach that only utilizes Z value at the interim and the planned sample size to approximate the conditional power so that sample size re-estimation can be readily performed regardless of the complexity of the underlying situation. Though the Lan and Wittes B-value method generalized the conditional power calculation through the elegant Brownian motion process, they did not fully expand their theory into sample size re-estimation and simplify the trial design modification process. The Gao et al or the Mehta and Pocock methods did generalize but still requires some sophistication. The proposed approach offers a practical perspective that greatly simplifies the sample size re-estimation for a wide variety of scenarios. In fact, the conditional power formula in this paper matches that from Lan and Wittes and that from Mehta and Pocock after some simple algebraic manipulation.
The key assumption is that the interim Z test statistics and the second-stage Z test statistics behave similarly in an asymptotic sense. Though the enrollment pattern, event distribution pattern, nonconstant risk ratio between treatment arms, overflow of information for the interim cohort, and other factors can render the two Z test statistics different, the simulation in this paper has not yet revealed any negative consequence of the proposed approach. It would be of interest to see a tangible negative effect through more simulations performed in more extreme situations.
In practice, it is usually sufficient to define the promising zone as conditional power >50%. In case a more precise promising zone is desired, the Mehta and Pocock method can be used. This approach can be easily extended to single-arm studies and group sequential setting. The proposed method in this paper calculates the conditional power assuming the true treatment effect aligns with the observed interim test statistics z 1. Some practitioners may prefer maintaining the original assumed treatment effect when calculating the conditional power. In such cases, one needs to rely on alternative approaches to obtain the expectation of Z 2 (eg, simulation).
Since adaptive designs using conditional error 11 can have certain favorable properties, the idea of this paper may be worth expanding into that direction. Besides the simulations performed on the complex situations to verify the validity of the proposed method, the utility of this approach has also been confirmed in the most commonly encountered settings for endpoints including continuous, binary, and time-to-event, and for trial design types including superiority and non-inferiority. In such sense, the proposed method provides a unified, and importantly, simplified approach to facilitate an adaptive sample size reestimation.
Concluding Remarks
The proposed adaptive approach is easy to implement in general sample size re-estimation situations. Its validity can be verified through simulation under varying scenarios. In summary, this approach offers a transparent communication channel with regulatory agencies to facilitate clinical trial development regardless of the complexity of the underlying situations.
Footnotes
Acknowledgment
The authors thank the two referees for their valuable comments that improved the manuscript.
Declaration of Conflicting Interests
No potential conflicts of interest were declared.
Funding
No financial support of the research, authorship, and/or publication of this article was declared.
Ethical Approval
This article does not contain any studies with human or animal subjects performed by any of the authors