
Abstract
Traditional axial view-based skeletal muscle MRI is valuable for detecting pathological changes but is time-consuming. This study validated a novel time-efficient coronal view-based muscle MRI protocol and a semiquantitative visual scoring system as a practical alternative for evaluating hereditary (HM) and inflammatory myopathies (IM). Using coronal short tau inversion recovery (STIR) and T1-weighted sequences, we assessed edema and fatty infiltration in 102 subjects, including patients with HM, IM, and healthy controls. To verify diagnostic reliability, a plane-to-plane comparison (coronal vs. axial) was performed in the thigh muscles, demonstrating excellent agreement between visual scores (ICC > 0.9, Kappa > 0.79). Clinically, higher visual fat scores in HM correlated significantly with muscle weakness (p < 0.001) and older age, while higher edema scores in IM correlated with weakness (p = 0.013) and female sex. Histopathologically, MRI fat scores correlated with internal nucleation and Oil Red O staining (p < 0.001), whereas edema scores correlated with fiber necrosis (p < 0.001), regeneration, and interstitial fibrosis (p < 0.001). This novel coronal protocol offers a validated, high-throughput alternative enabling wide anatomical coverage in significantly less time, with visual scores that strongly correlate with clinical status and histopathology, supporting its utility as a biomarker for disease monitoring.
Introduction
Myopathies are a heterogeneous group of diseases that cause primary damage to muscle, which leads to symptoms such as muscle weakness, muscle atrophy, and fatigue, depending on the muscle involved. Various etiologies cause myopathy, and the two major categories of myopathy are hereditary myopathy and inflammatory myopathy, each with distinct pathophysiology and disease course. Hereditary myopathy in adults, such as facioscapulohumeral muscular dystrophy (FSHD) and limb-girdle muscular dystrophy (LGMD), often presents with gradual deterioration of muscle strength and functional status, with gradual muscle atrophy and fibroadipose infiltration.1,2 Moreover, inflammatory myopathies such as immune-mediated necrotizing myositis and dermatomyositis commonly present with subacute progressive muscle weakness due to infiltration of immune cells and inflammation of muscles, leading to muscle edema. 3 Muscle biopsy remains important for identifying histopathological changes and diagnosing various myopathies.4,5 However, muscle biopsy, through core needle biopsy or open biopsy, is rarely used for longitudinal follow-up of patient disease progression and treatment response clinically because of its invasive nature.
In recent years, skeletal muscle MRI has been widely used as a noninvasive and reliable tool for evaluation of muscle conditions in various myopathies.6–8 Using the T1 weighted image (T1WI) sequence of MRI, fibroadipose infiltration in muscle tissues can be easily visualized as T1 hyperintensity, whereas muscle edema can be seen as high signals using T2 weighted image with fat saturation sequences, such as short tau inversion recovery (STIR). 9 Various advanced MRI methods, such as quantitative MRI (T1 or T2 mapping), Dixon sequences and proton magnetic resonance spectroscopy (1H-MRS), have been developed for further assessment of muscle edema as well as fatty infiltration of muscles.10–12 While most skeletal muscle MRI is performed on the axial plane of the lower extremities, recent studies have also shown interest in whole-body MRI for widespread evaluation of the muscle status, as myopathies often involve generalized muscles in different patterns.10,13,14 However, axial plane MRI covering the upper and lower limbs is very time consuming, and whole-body MRI often places limb muscles near the edge of the magnetic field, resulting in distortional artifacts. 15
In this study, we explored a novel coronal plane muscle MRI technique for evaluation of the four limb muscles of patients with hereditary or inflammatory myopathy. Compared with axial imaging, coronal imaging resulted in wider anatomical coverage within less time, allowing imaging of the four limbs in a shorter time. We then used a previously described semiquantitative visual scoring method to assess the severity of fatty infiltration and muscle edema to compare this coronal plane muscle MRI with traditional axial plane MRI. We subsequently correlated this visual score with the clinical status of the patient as well as with the histopathological changes in muscle biopsy.
Methods
Study design and participants
This cross-sectional study included adult subjects evaluated for suspected myopathy at a tertiary care neuromuscular center between March 1st, 2019, and May 31st, 2025. Subjects with hereditary myopathy, those with inflammatory myopathy, or healthy controls were recruited, and the categorization was based on clinical, laboratory, imaging, and histopathologic analysis (Supplemental Table 1). The diagnosis of hereditary myopathy was confirmed by genetic testing, established clinical phenotypes, or a strong family history consistent with the patient’s clinical presentation. Specifically, for cases where genetic confirmation was unavailable, inclusion required the presence of a well-defined clinical phenotype (e.g., characteristic patterns of muscle weakness and atrophy) that matched the suspected hereditary condition as well as a strong family history. Inflammatory myopathies were diagnosed according to consensus criteria,16,17 including criteria based on muscle biopsy results and/or myositis-specific autoantibodies. Healthy controls (HC) with no history of neuromuscular disease or systemic illness were recruited for comparison. We employed a frequency-matching (group-matching) protocol to ensure the HC group was comparable in demographic distribution to the patient cohorts. The study was approved by the institutional review board (201705058RIND and 202305102RINA) and registered at clinicaltrials.gov (NCT05048862).
MRI protocol
Muscle imaging was conducted using a 1.5T MRI scanner (MAGNETOM Aera, Siemens Healthineers). A standardized coronal acquisition protocol included T1-weighted (T1) and Short-TI Inversion Recovery (STIR) sequences covering all four extremities in the supine position. The upper limbs were imaged in two sequential stations (proximal arm and forearm; 380-mm FOV), while the lower limbs were captured simultaneously across three stations (pelvis to ankle; 350–400 mm FOV). All acquisitions utilized standard surface coils with a slice thickness of 4 mm (0.1 mm interslice gap) and one signal average (NEX=1). Concatenation settings varied from 2 to 4 based on anatomical coverage. Sequence parameters were set as follows: for T1-weighted images, TR = 450–780 ms, TE = 11 ms; for STIR sequences, TR = 2300–4600 ms, TE = 68 ms.
MRI visual scoring
We grouped the muscles for MRI scoring by functional grouping where each muscle groups contributes to a main action at muscle strength testing as shown in Supplemental Figure 1. In the analysis of the correlation between muscle strength testing and fat or edema scores on MRI, the muscle strength of each action is compared to the major muscle group involved, as following: shoulder abduction – deltoid, elbow flexion – biceps brachii, elbow extension – triceps brachii, wrist extension – extension compartment of forearm, wrist flexion – flexion compartment of forearm, knee extension – quadriceps femoris, knee flexion – biceps femoris, dorsiflexion – anterior compartment of leg, plantarflexion – posterior compartment of leg. Two neurologists (G.H. Lee, W.Y. Su), blinded to clinical data, independently assessed the images using a modified semiquantitative scoring system.18,19
We used the intraclass correlation coefficient (ICC) to calculate the intrarater consistency via a two-way mixed effect and absolute agreement model, which showed high consistency, with an ICC of 0.924 and a 95% CI of 0.853 ∼ 0.962. The interrater consistency was also calculated using a two-way random effect and absolute agreement model, which showed high consistency, with an ICC of 0.831 and a 95% CI of 0.685 ∼ 0.912. Compared with traditional axial protocols, the visual scoring system using this novel coronal view-based MRI protocol demonstrated high consistency (fat score ICC = 0.959, edema intensity ICC = 0.910, edema area ICC = 0.917). (Supplemental Table 1)
Muscle Strength and Laboratory Assessment
Muscle strength was tested and graded using manual muscle testing (MMT), which was performed at the time of MRI and was graded from 0–10 in each muscle group. 20 Two different summative scores for manual muscle testing MMT12 and MMT22 were used in the study. MMT12 were used included the muscle strength of shoulder abduction, elbow flexion, wrist extension, hip flexion, knee extension and ankle dorsiflexion of both sides, which has a score ranging from 0 to 120, which was adapted from the MRC sum score used in Guillain Barre Syndrome evaluation of motor function. However, to more comprehensively evaluate the muscle power of both proximal and distal muscle groups as different myopathy having tendency of affecting different muscle groups, we also used the MMT22 which included the muscle strength of commonly tested proximal and distal muscles including shoulder abduction, elbow flexion, elbow extension, wrist flexion, wrist extension, hand grasp, hip flexion, knee flexion, knee extension, foot dorsiflexion and foot plantar flexion of both sides, which has a score ranging from 0 to 220. Clinically relevant information such as demographics, comorbidities and disease duration was extracted from electronic medical records.
Muscle biopsy and histopathology
The biopsy site was selected based on clinical assessment, targeting muscles that demonstrated moderate weakness (typically MRC grade 4) to ensure sufficient diagnostic yield and avoid end-stage muscle. The most common biopsy sites were the vastus lateralis and biceps brachii. To maintain the independence of the clinical and radiological assessments, the biopsy site was chosen primarily based on clinical phenotype rather than guided by the coronal MRI findings. Histopathological features were evaluated semiquantitatively on H&E and Oil Red O stained sections, following international consensus criteria. 21 A 4-point scale (0–3) was used to grade fiber size variation, internal nucleation frequency (<3%, 3–10%, 10–30%, >30%), necrosis/regeneration (<2%, 2–5%, >5%), and endomysial fibrosis. Oil Red O staining was similarly graded from 0 (negative) to 3 (marked extracytoplasmic lipid accumulation). To enable direct comparison, MRI scores were extracted specifically from the muscle segments corresponding to the biopsy sites.
Statistical analysis
Group differences were assessed using ANOVA or the Kruskal‒Wallis test for continuous variables and the χ2 test or Fisher’s exact test for categorical variables. Spearman correlation was used to examine relationships between MRI scores, muscle strength, creatine kinase (CK) levels, and biopsy features. Accounting for the uneven strata of MRI scores, we used rank regression models to evaluate the associations of clinical variables with MRI scores in univariate and multivariate frameworks stratified by disease group. The interrater agreement was assessed with the interclass correlation coefficient (ICC) and Cohen’s kappa. Statistical significance was set at p < 0.05. Analyses were performed using SPSS (version 25).
Results
Participant characteristics and validation of the new MRI protocol
Demographics of the included subjects.
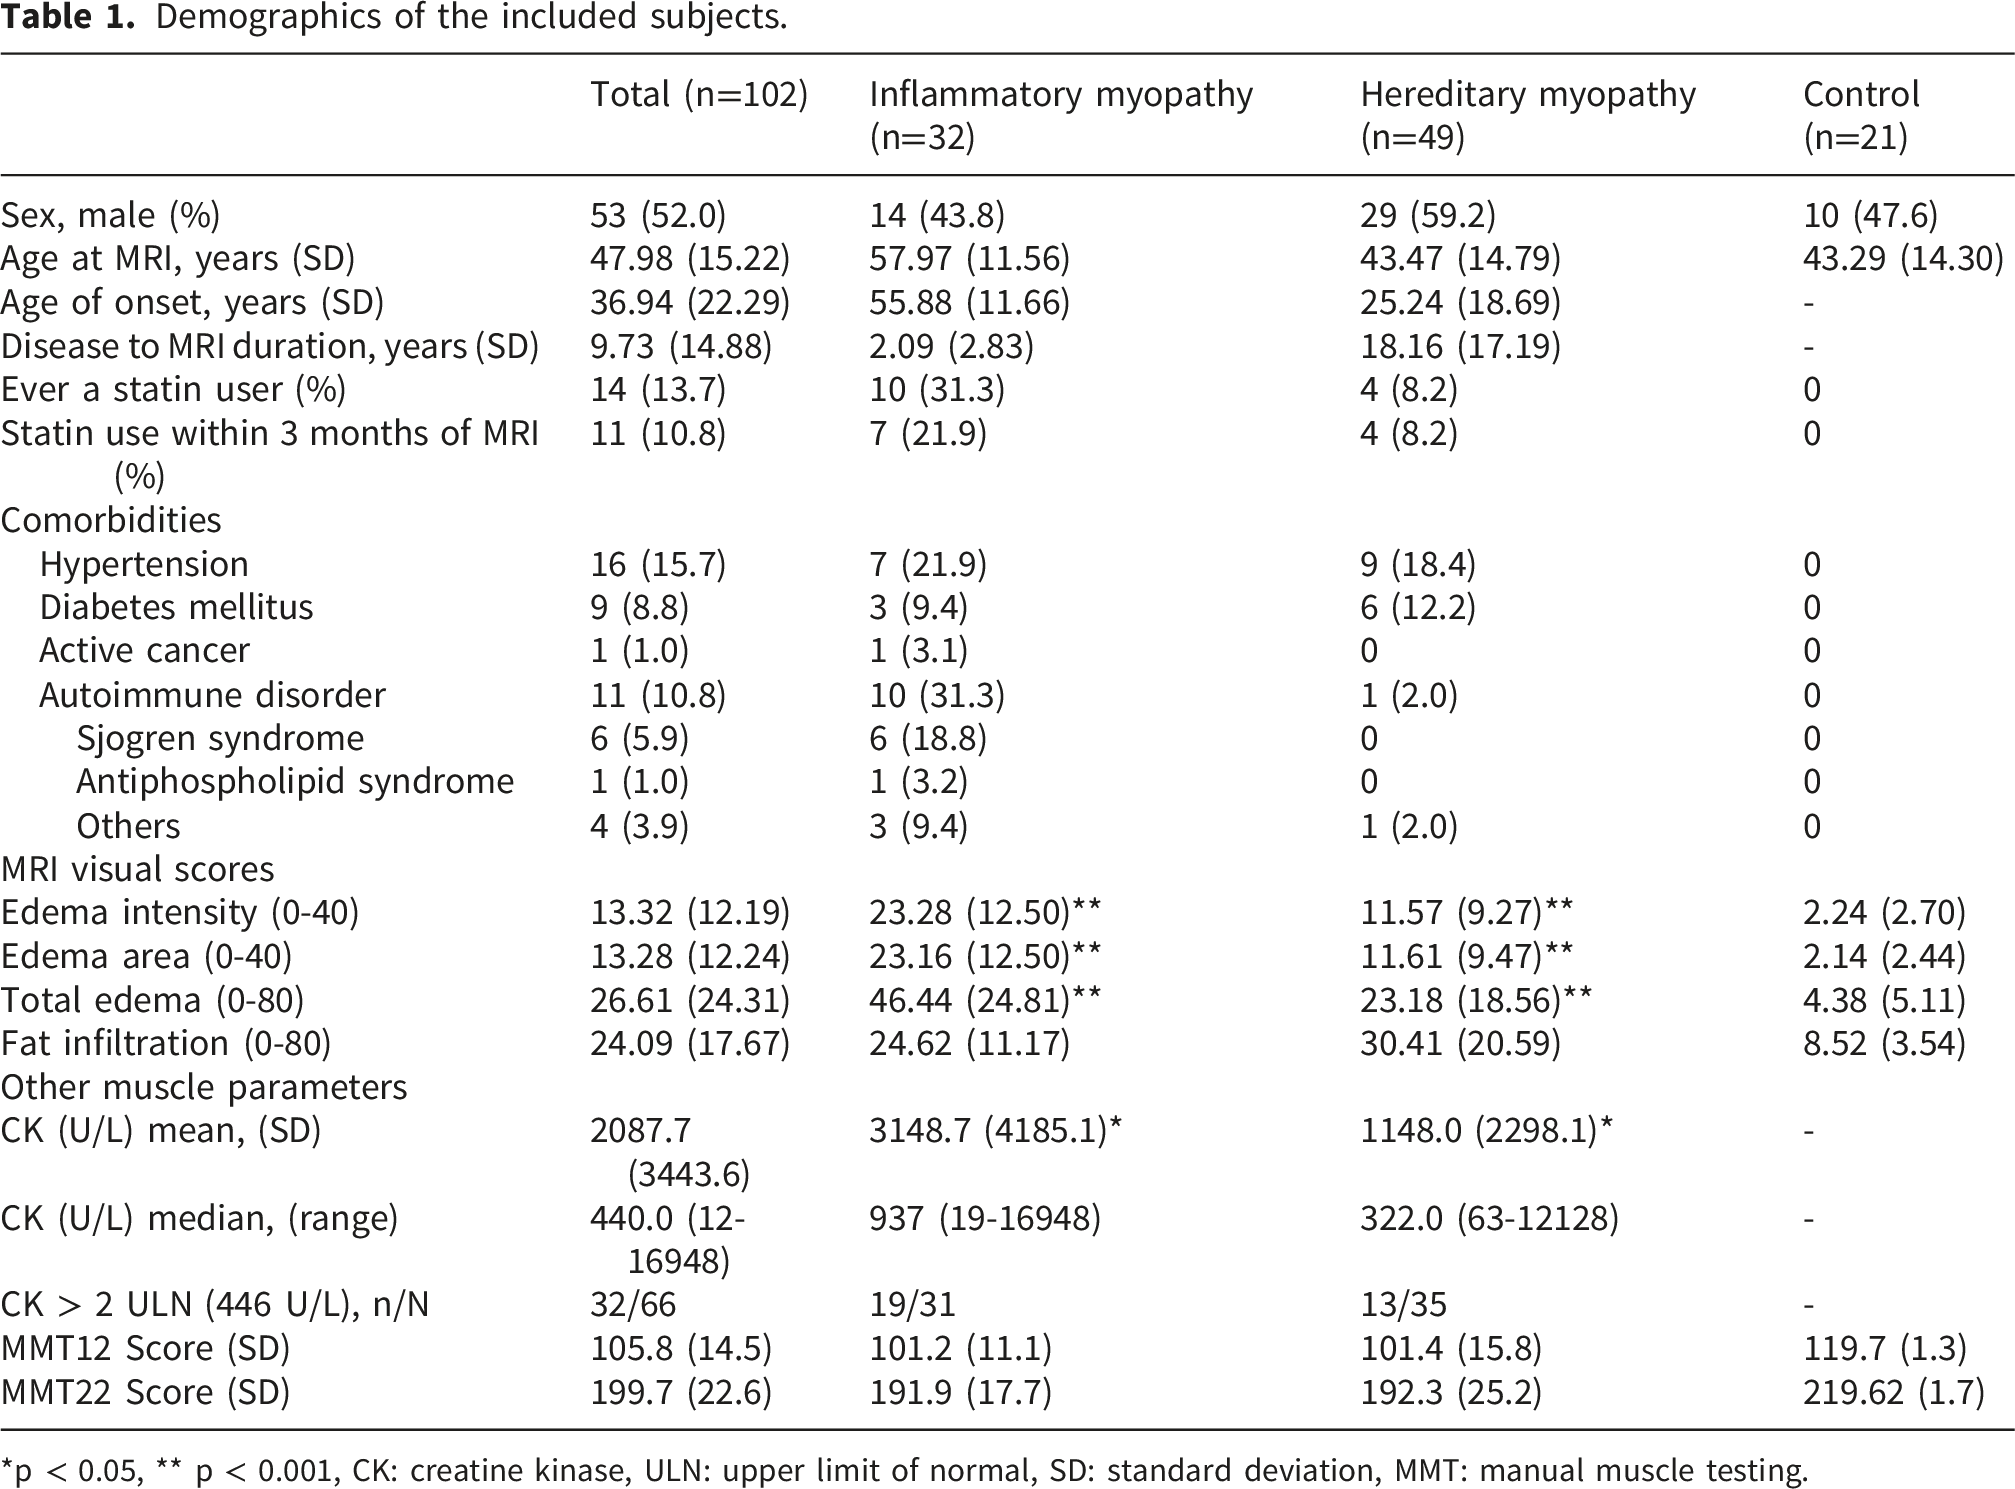
*p < 0.05, ** p < 0.001, CK: creatine kinase, ULN: upper limit of normal, SD: standard deviation, MMT: manual muscle testing.
The total acquisition time for the four-limb MRI coronal view protocol (39 minutes 57 seconds ± 5 minutes 33 seconds) was significantly shorter than that for the traditional axial view protocol, which took approximately 40 minutes to complete the traditional axial view of only the thigh muscles. To validate the diagnostic reliability of this time-efficient protocol, we performed a direct plane-to-plane comparison between the coronal and axial views of the thigh muscles in a representative subset (n=10, where 4 were healthy control, 5 were hereditary myopathy, 1 was inflammatory myopathy).The visual scores derived from the coronal plane demonstrated excellent agreement with the traditional axial gold standard, with an intraclass correlation coefficient of 0.959 (Cohen’s κ = 0.798) for fat scores, 0.910 (κ = 0.790) for edema intensity scores, and 0.917 (κ = 0.916) for edema area scores (Supplemental Table 1C). A demonstration of the muscle edema and fat infiltration MRI visual scoring system as well as muscle histopathological scores are shown in Figure 1. Furthermore, post-acquisition image processing could be used to convert coronal view images into axial views and study the specific muscle of interest in each limb, although with lower resolution (Supplemental Figure 2). Visual score grading of MR images and histopathology. Demonstration of MRI visual scoring system for the edema area (0–2), edema intensity (0–2) and fat score (0–4) of the four limbs (A). Only the proximal muscle or upper and lower limbs are demonstrated; however, forearm and lower leg imaging was performed and scored in the same manner for all included patients. The histopathology scoring system is shown in (B) with H&E and Oil Red O staining. BMD: Becker muscular dystrophy, LGMD: limb-girdle muscular dystrophy.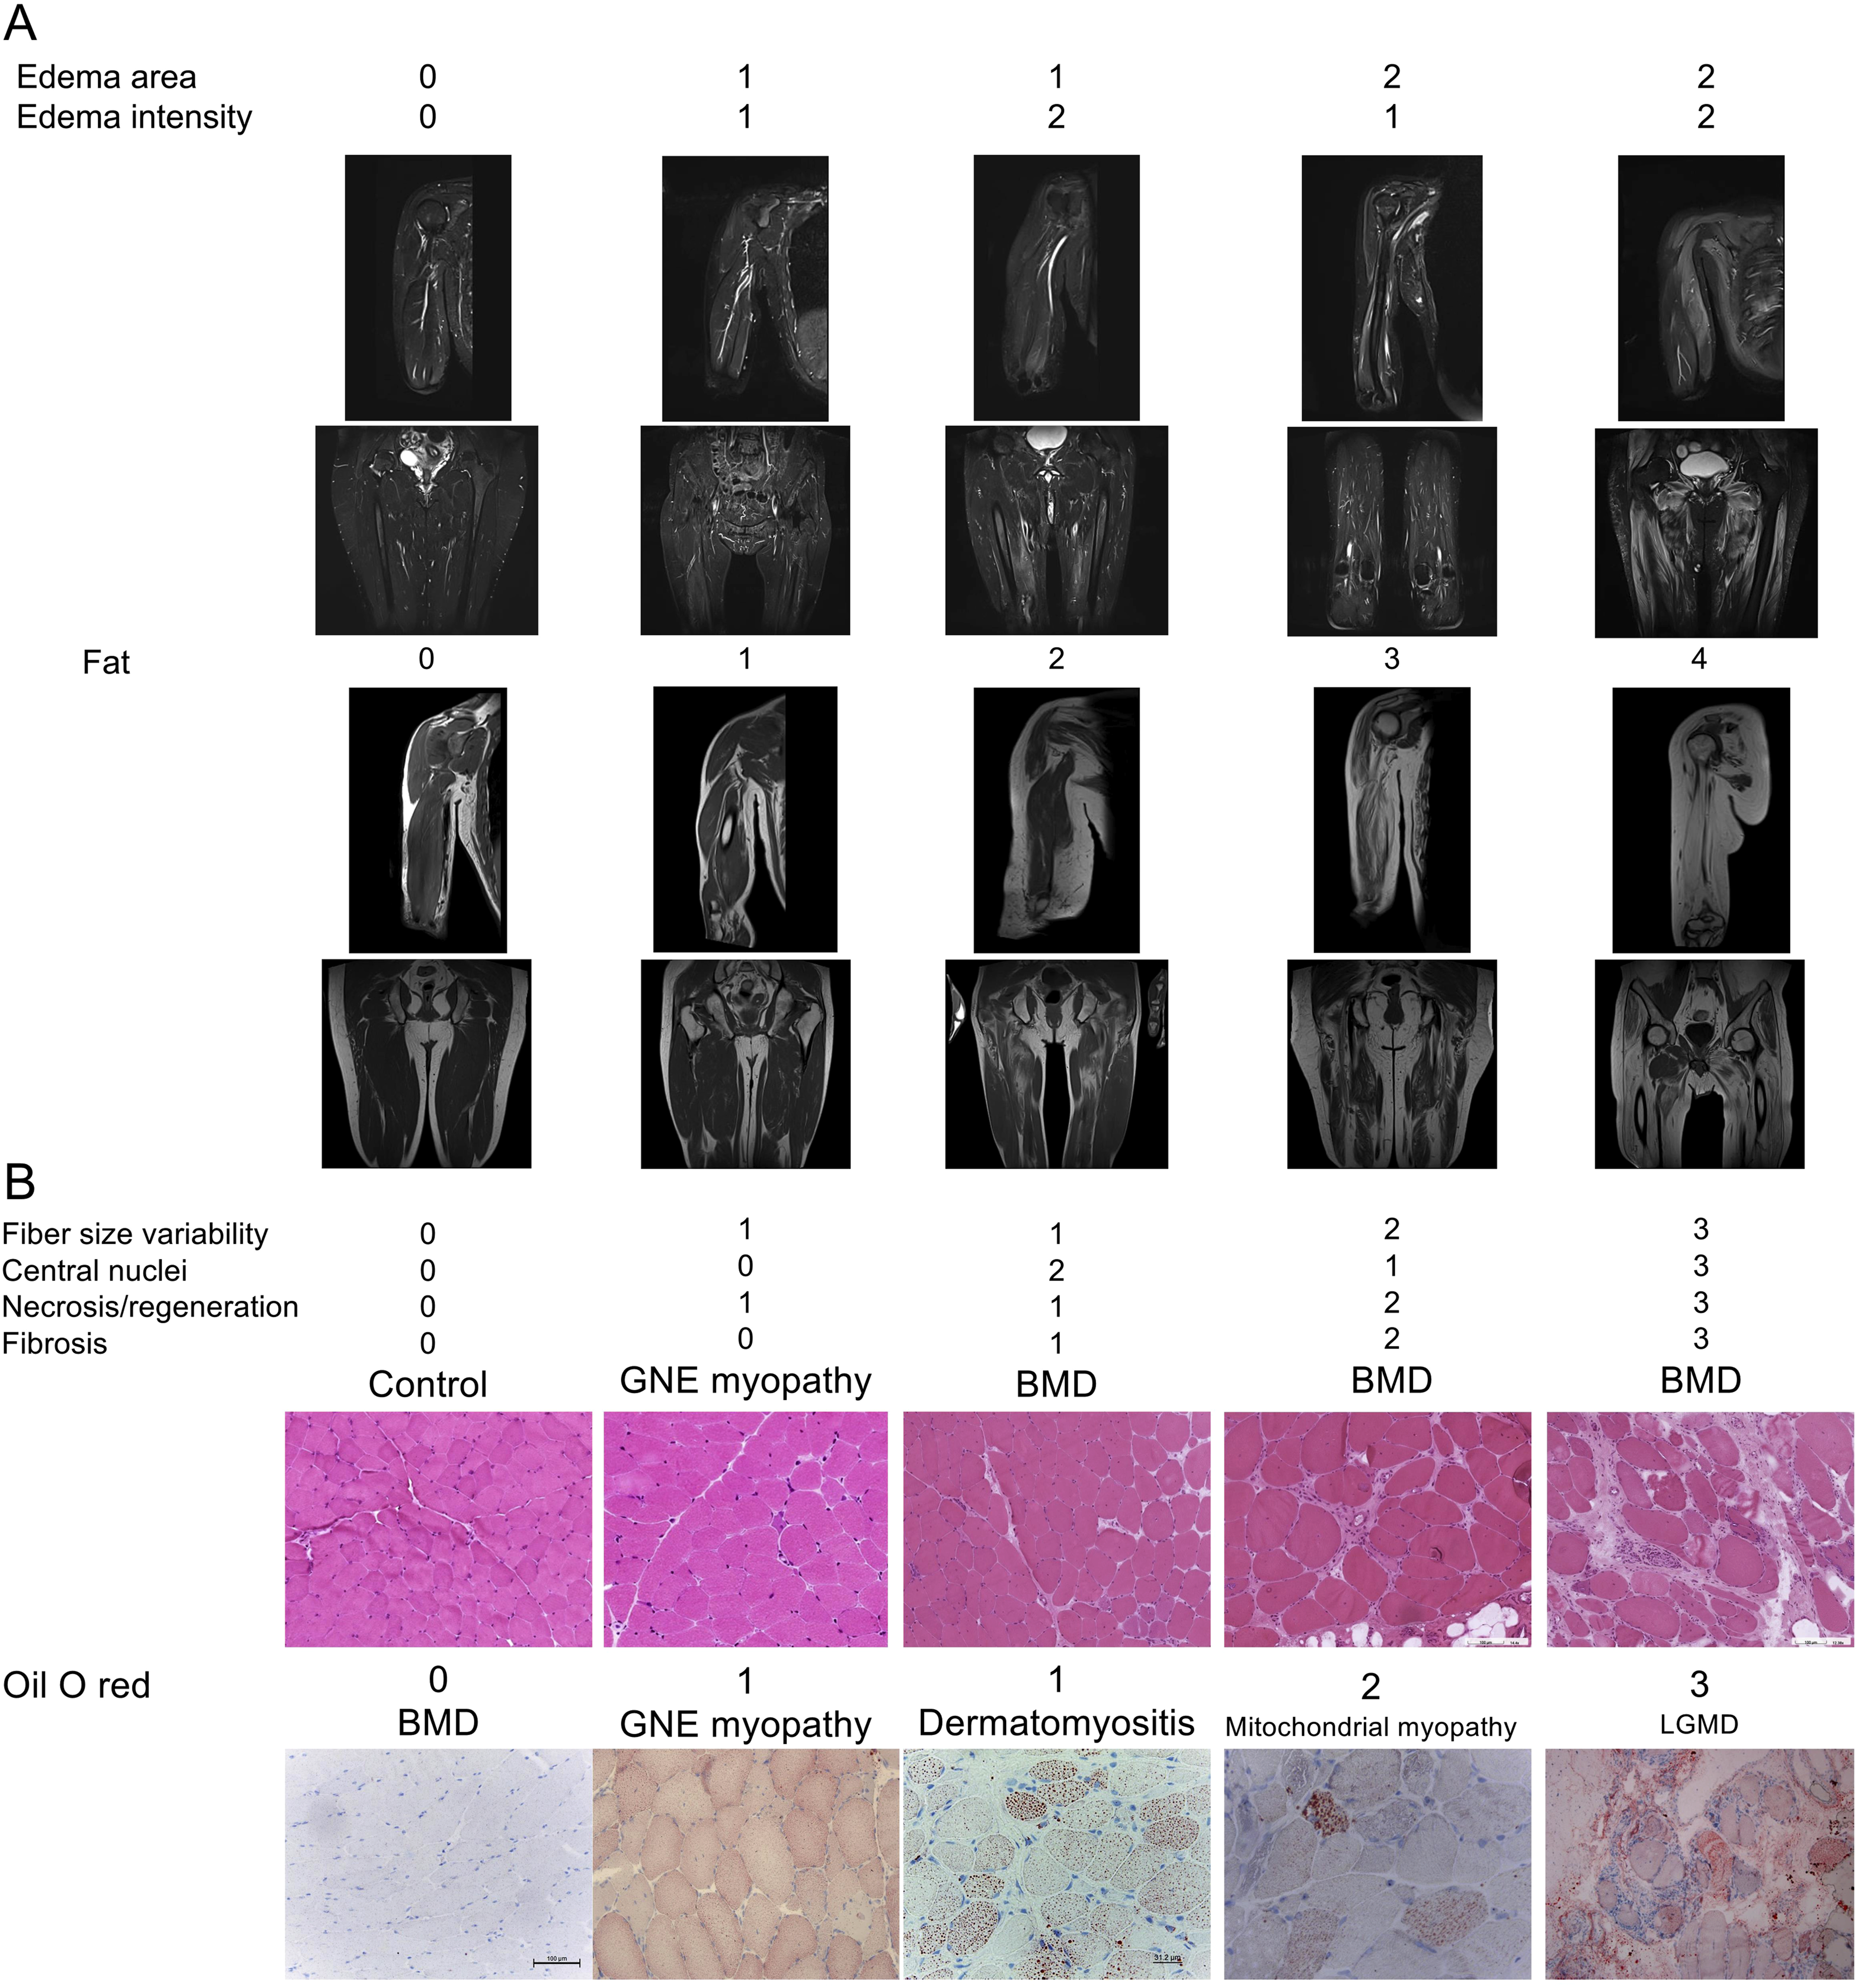
Coronal view-based MRI visual score correlated with the clinical status of patients with FSHD and IMNM
Individual muscle MMT–MRI visual score correlation in patients with FSHD and IMNM.
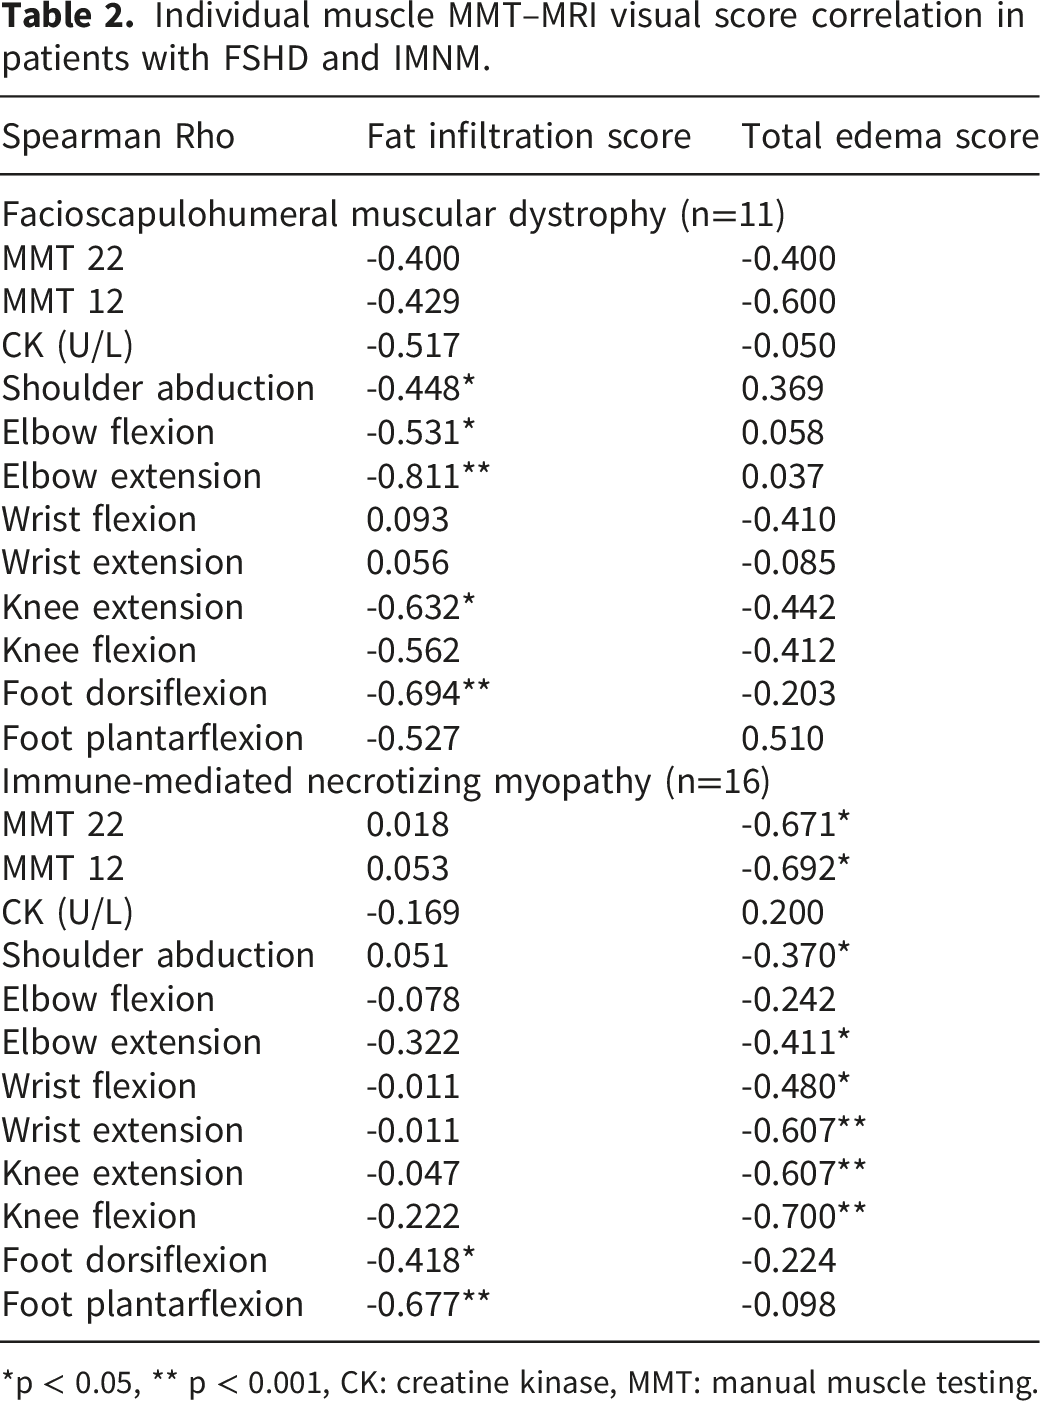
*p < 0.05, ** p < 0.001, CK: creatine kinase, MMT: manual muscle testing.
In the FSHD group, individual muscle MRI fat scores were inversely correlated with the strength of the muscle groups involved, including elbow extension (ρ = –0.811, p < 0.001), foot dorsiflexion (ρ = –0.694, p < 0.001), shoulder abduction (ρ = –0.448, p < 0.05), elbow flexion (ρ = –0.531, p < 0.05), and knee extension (ρ = –0.632, p < 0.05). In the IMNM group, the MRI total edema scores were inversely correlated with the MMT22 (ρ = –0.671, p < 0.05) and MMT12 (ρ = –0.692, p < 0.05) scores. Individual muscle MRI edema scores and muscle strength, including wrist extension (ρ = –0.607, p < 0.001), knee extension (ρ = –0.607, p < 0.001), knee flexion (ρ = –0.700, p < 0.001), shoulder abduction (ρ = –0.370, p < 0.05), elbow extension (ρ = –0.411, p < 0.05) and wrist flexion (ρ = –0.480, p < 0.05), were also inversely correlated in the IMNM group. In summary, the coronal view-based MRI visual scoring system was able to reflect the clinical status of patients with FSHD and IMNM, with fat scores showing inverse correlations with the muscle strength of FSHD patients and edema scores showing inverse correlations with the muscle strength of patients with IMNM.
External validation of the coronal view-based MRI visual scores
To further explore the clinical relevance of the coronal view-based MRI visual scores to other myopathies, we applied the visual scoring system to patients with hereditary and inflammatory myopathy as well as healthy controls without neuromuscular diseases for external validation. The total edema score was significantly greater in the inflammatory myopathy group than in the hereditary myopathy group (46.44 ± 24.81 vs. 23.18 ± 18.56, p<0.001). Similar patterns were observed in the edema intensity (23.28 ± 12.50 vs. 11.57 ± 9.27, p<0.001) and edema area (23.16 ± 12.50 vs. 11.61 ± 9.47, p<0.001). However, the fat infiltration score was greater in patients with hereditary myopathy (30.41 ± 20.59) than in those with inflammatory myopathy (24.62 ± 11.17), although the difference was not statistically significant (Figure 2). MRI visual scores of the cohorts. MRI visual fat and edema scores in patients with hereditary myopathy, inflammatory myopathy and healthy controls. * p < 0.05, ** p < 0.001, HM: hereditary myopathy, IM: inflammatory myopathy.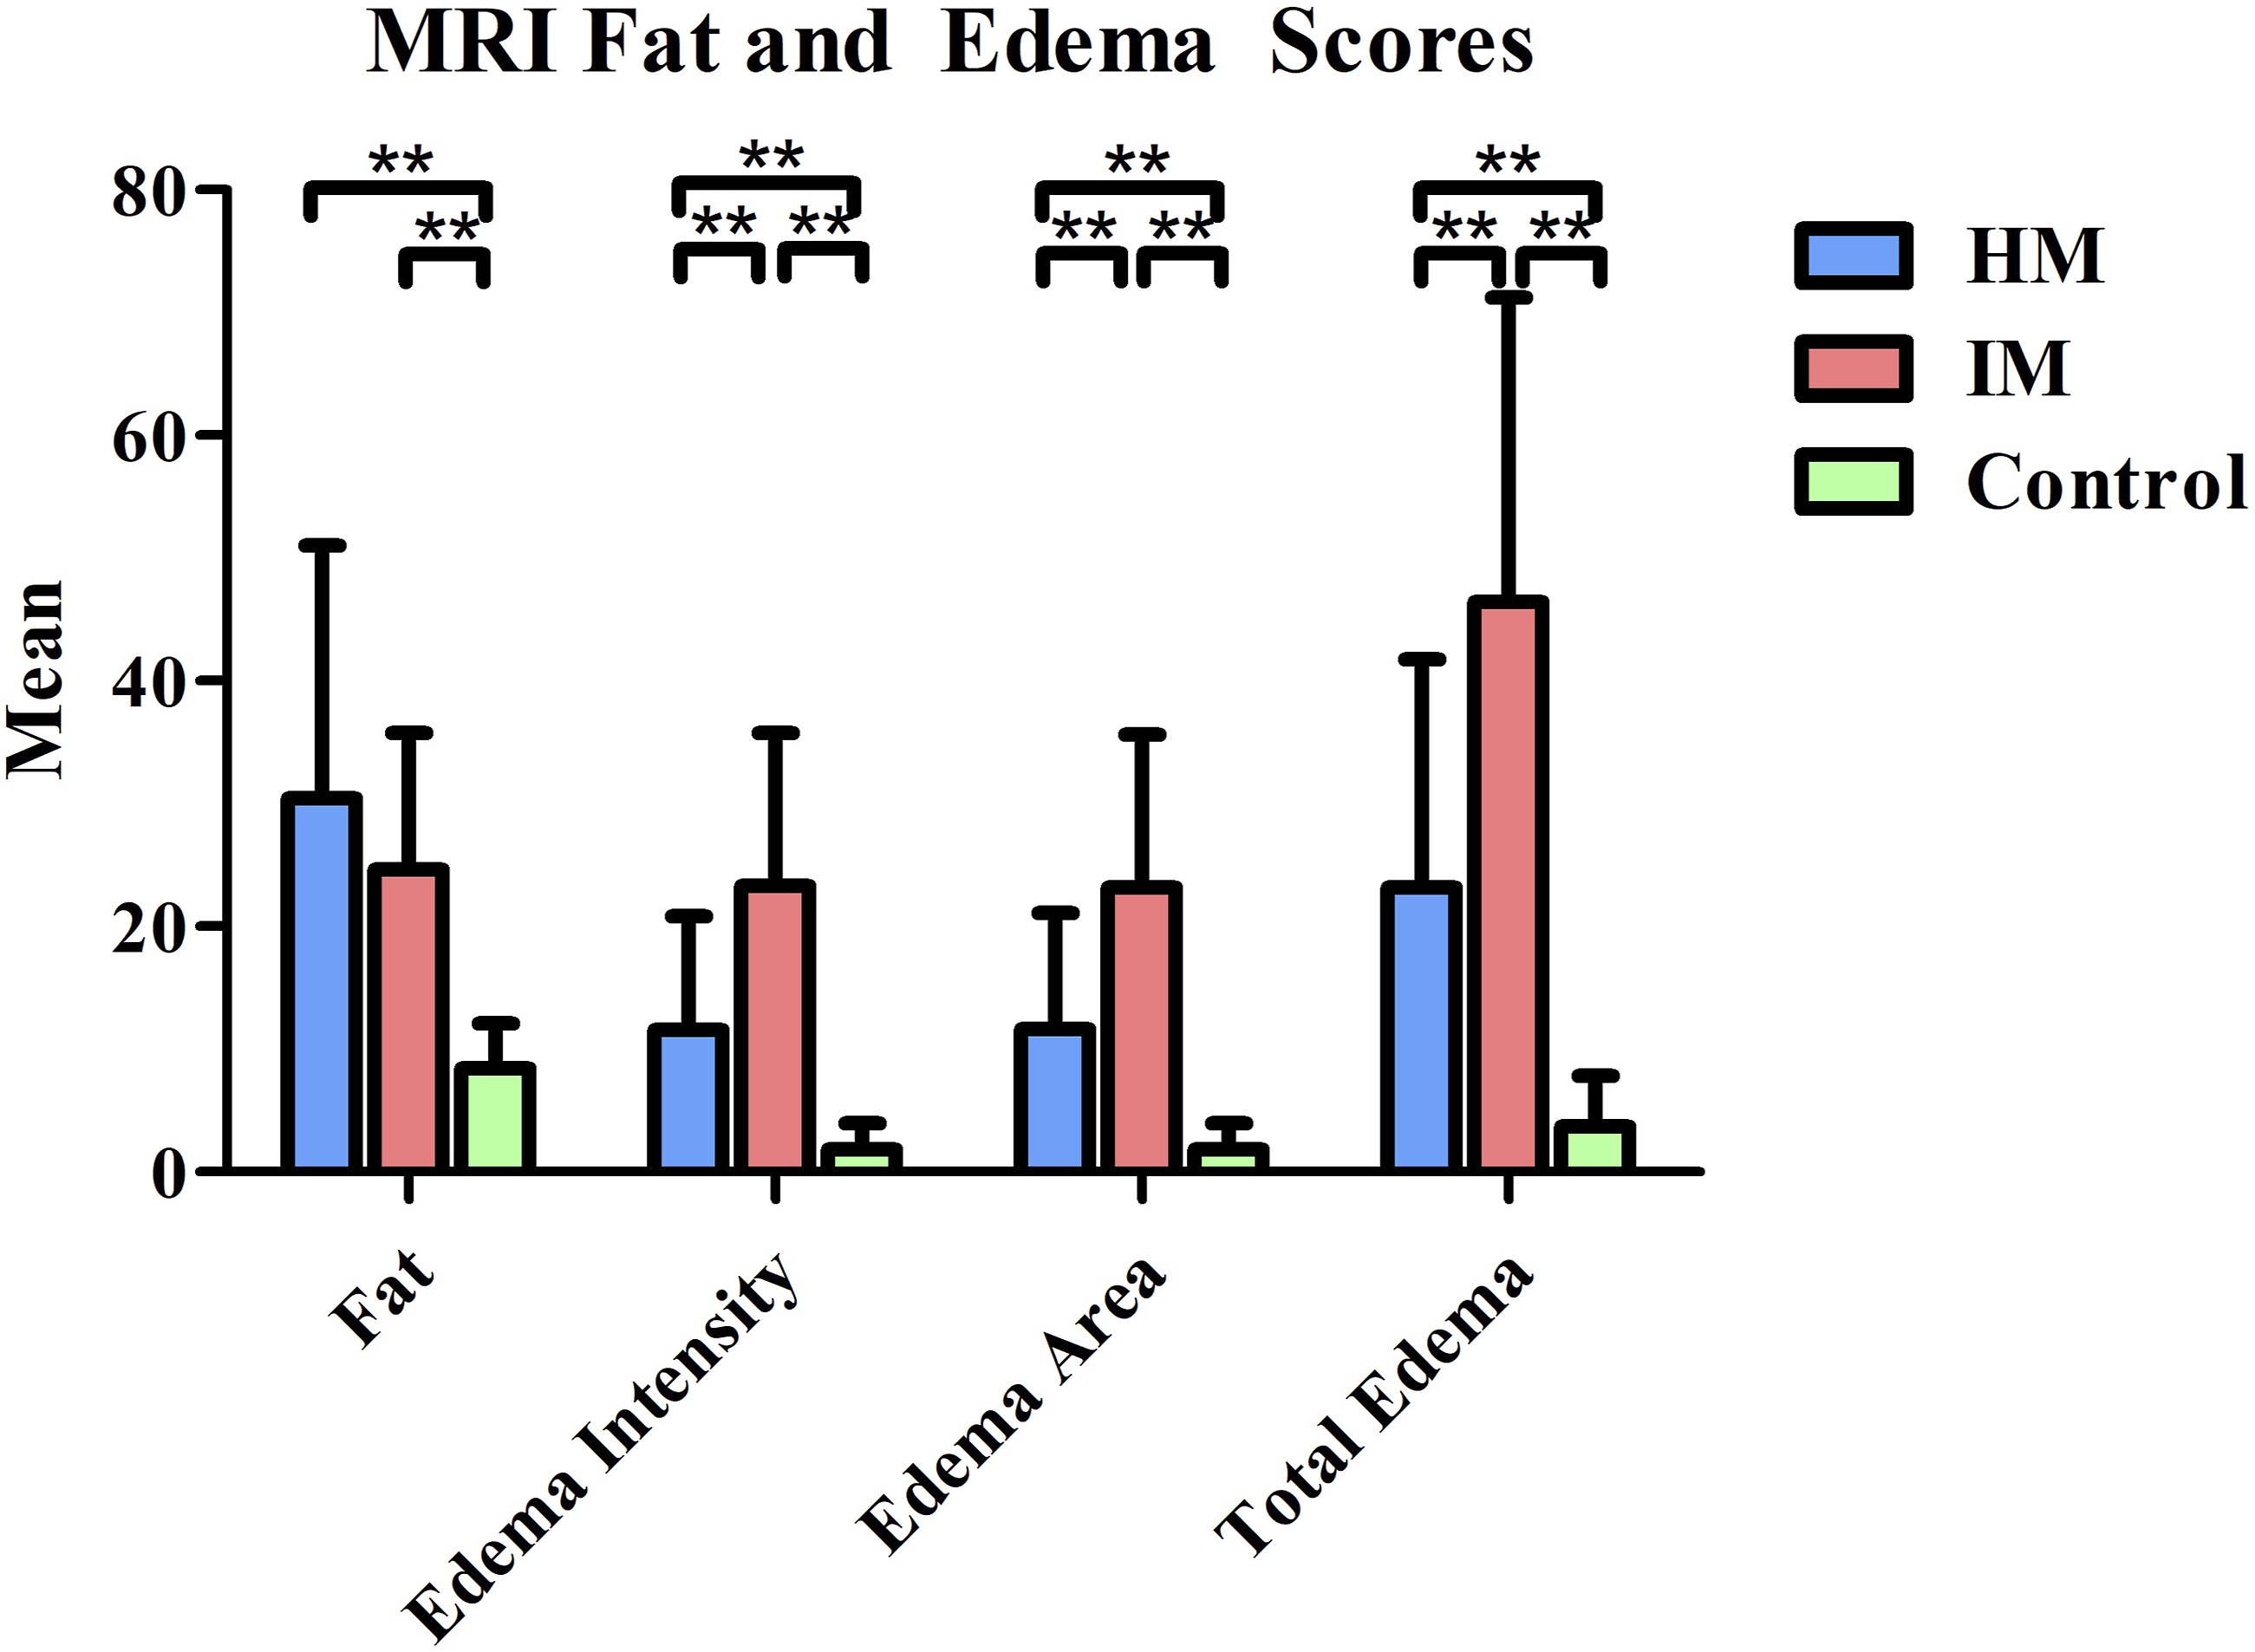
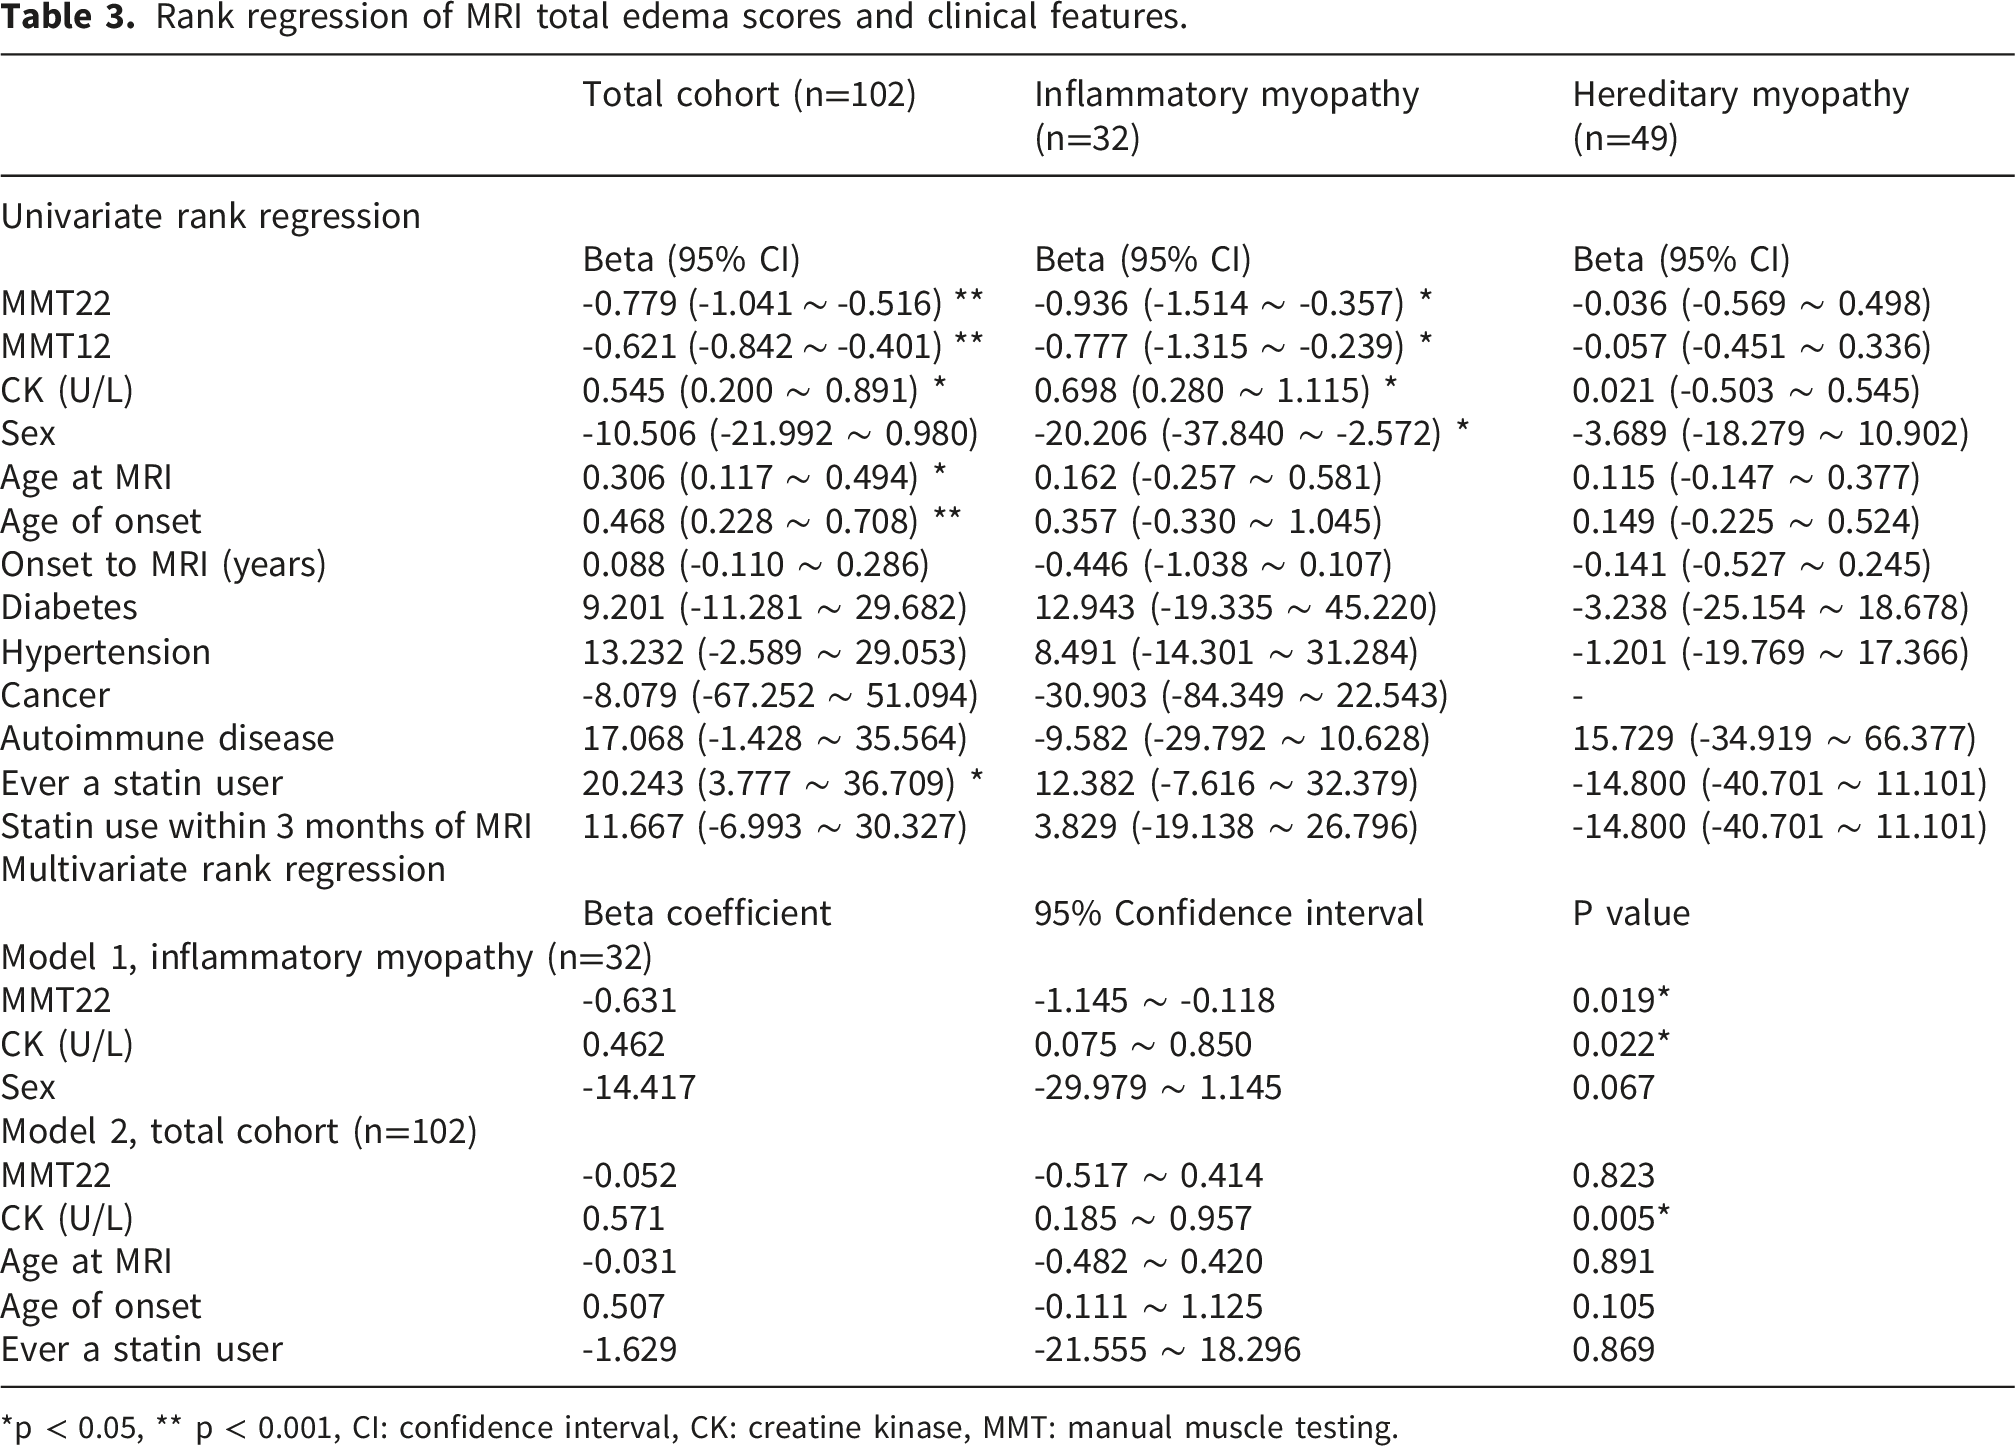
The results of the analysis of the clinical correlations are summarized in Figure 3, Tables 3 and 4. In the inflammatory myopathy group, univariate rank regression revealed that higher total edema scores were significantly associated with lower MMT22 scores (β = –0.936; 95% CI: –1.51 to –0.36; p < 0.05), female sex (β = –20.21; 95% CI: –37.84 to –2.57; p < 0.05), and higher CK level (β = 0.698; 95% CI: 0.28 to 1.12; p < 0.05). These variables were subsequently entered into a multivariate model, which confirmed that MMT22 score (β = –0.631; 95% CI: –1.145 to –0.118; p = 0.019) and CK level (β = 0.462; 95% CI: 0.075 to 0.850; p = 0.022) were independent predictors of the total edema score, while female sex were not. Univariate rank regression also revealed a significant association between higher total fat scores and older age at MRI (β = 0.392; 95% CI: 0.091 to 0.693; p < 0.05) and older age of onset (β = 0.564; 95% CI: 0.053 to 1.075; p < 0.05). MRI visual scores and muscle strength in hereditary myopathy and inflammatory myopathy patients. Scatterplot and linear regression of the MMT22 and MRI fat scores (Figure 3(A)) and of the MMT22 and MRI total edema scores (Figure 3(B)) in patients with hereditary myopathy and inflammatory myopathy. HM: hereditary myopathy, IM: inflammatory myopathy, MMT: manual muscle testing. Rank regression of MRI total edema scores and clinical features. *p < 0.05, ** p < 0.001, CI: confidence interval, CK: creatine kinase, MMT: manual muscle testing. Rank regression of MRI fat scores and clinical features. *p < 0.05, ** p < 0.001, CI confidence interval, CK: creatine kinase, MMT: manual muscle testing.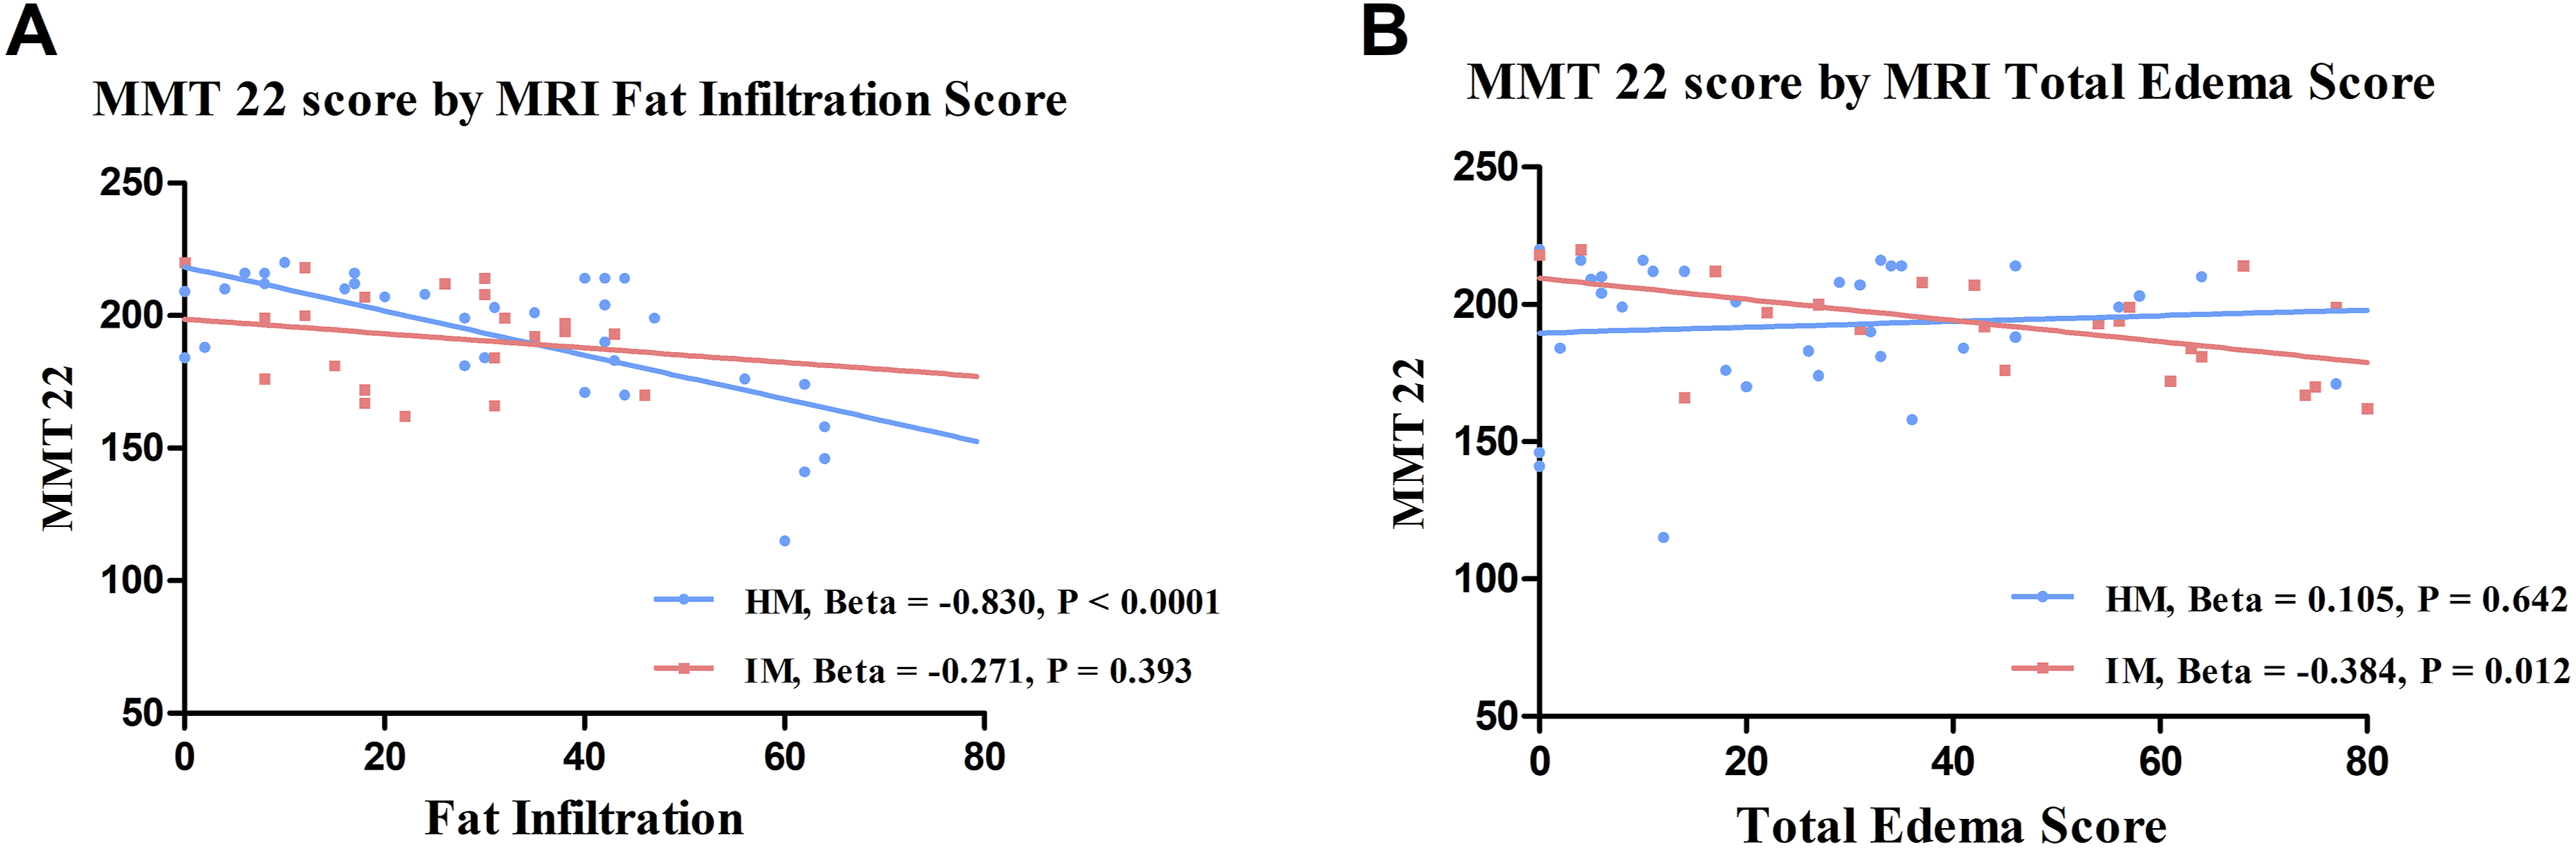
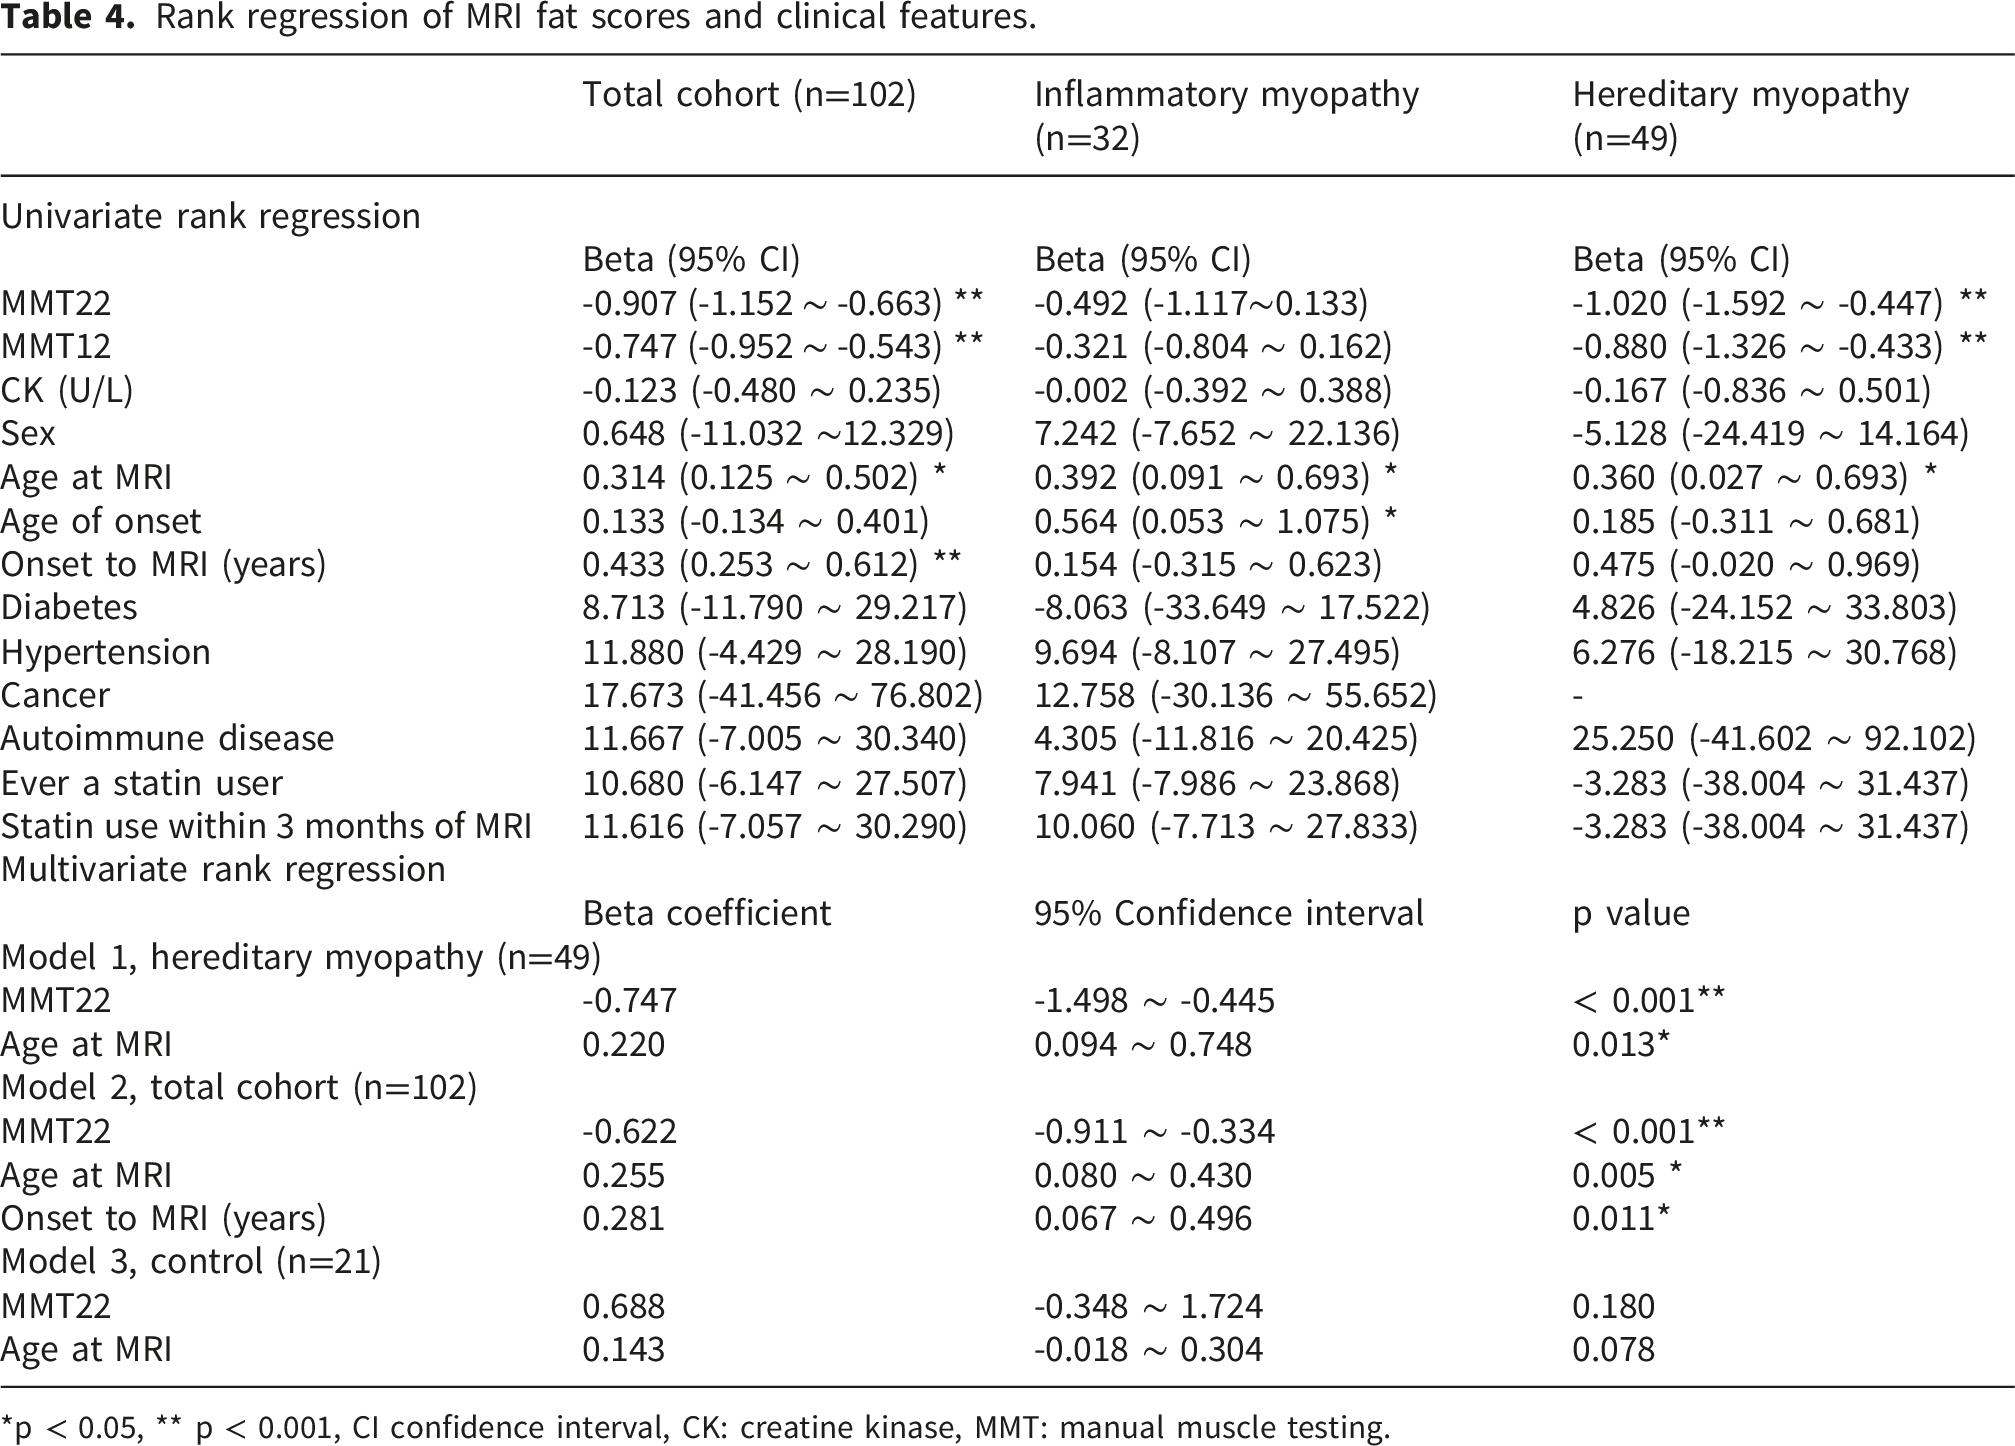
In the hereditary myopathy group, univariate rank regression revealed that higher total fat scores were significantly associated with lower MMT22 scores (β = -1.020; 95% CI: –1.592 to –0.447; p < 0.001) and older age when MRI was performed (β = 0.360; 95% CI: 0.027 to 0.693; p < 0.05). The multivariate analysis confirmed that both MMT22 (β = –0.747; 95% CI: –1.498 to –0.445; p < 0.001) and age at MRI (β = 0.220; 95% CI: 0.094 to 0.748; p = 0.013) were independent predictors of the total fat score in the hereditary myopathy group. However, univariate rank regression did not identify any statistically significant predictors of the total edema score in the hereditary myopathy group. As a result, when patients with hereditary myopathy and inflammatory myopathy were used as external validations, we found that the MRI visual scores significantly correlated with the clinical status of myopathy patients.
MRI visual scores correlated with histopathological changes
Because different MRI sequences reveal different molecular changes, an interesting question is what histopathological features underlie the pathological changes observed on MRI. Among all the included patients, 47 patients (22 subjects with hereditary myopathy, 23 subjects with inflammatory myopathy and 2 healthy controls) provided muscle biopsy data within 15 days before or after MRI acquisition. The biopsy site was mainly at the biceps brachii (n= 41), quadriceps femoris (n=5), and tibialis anterior (n=1).
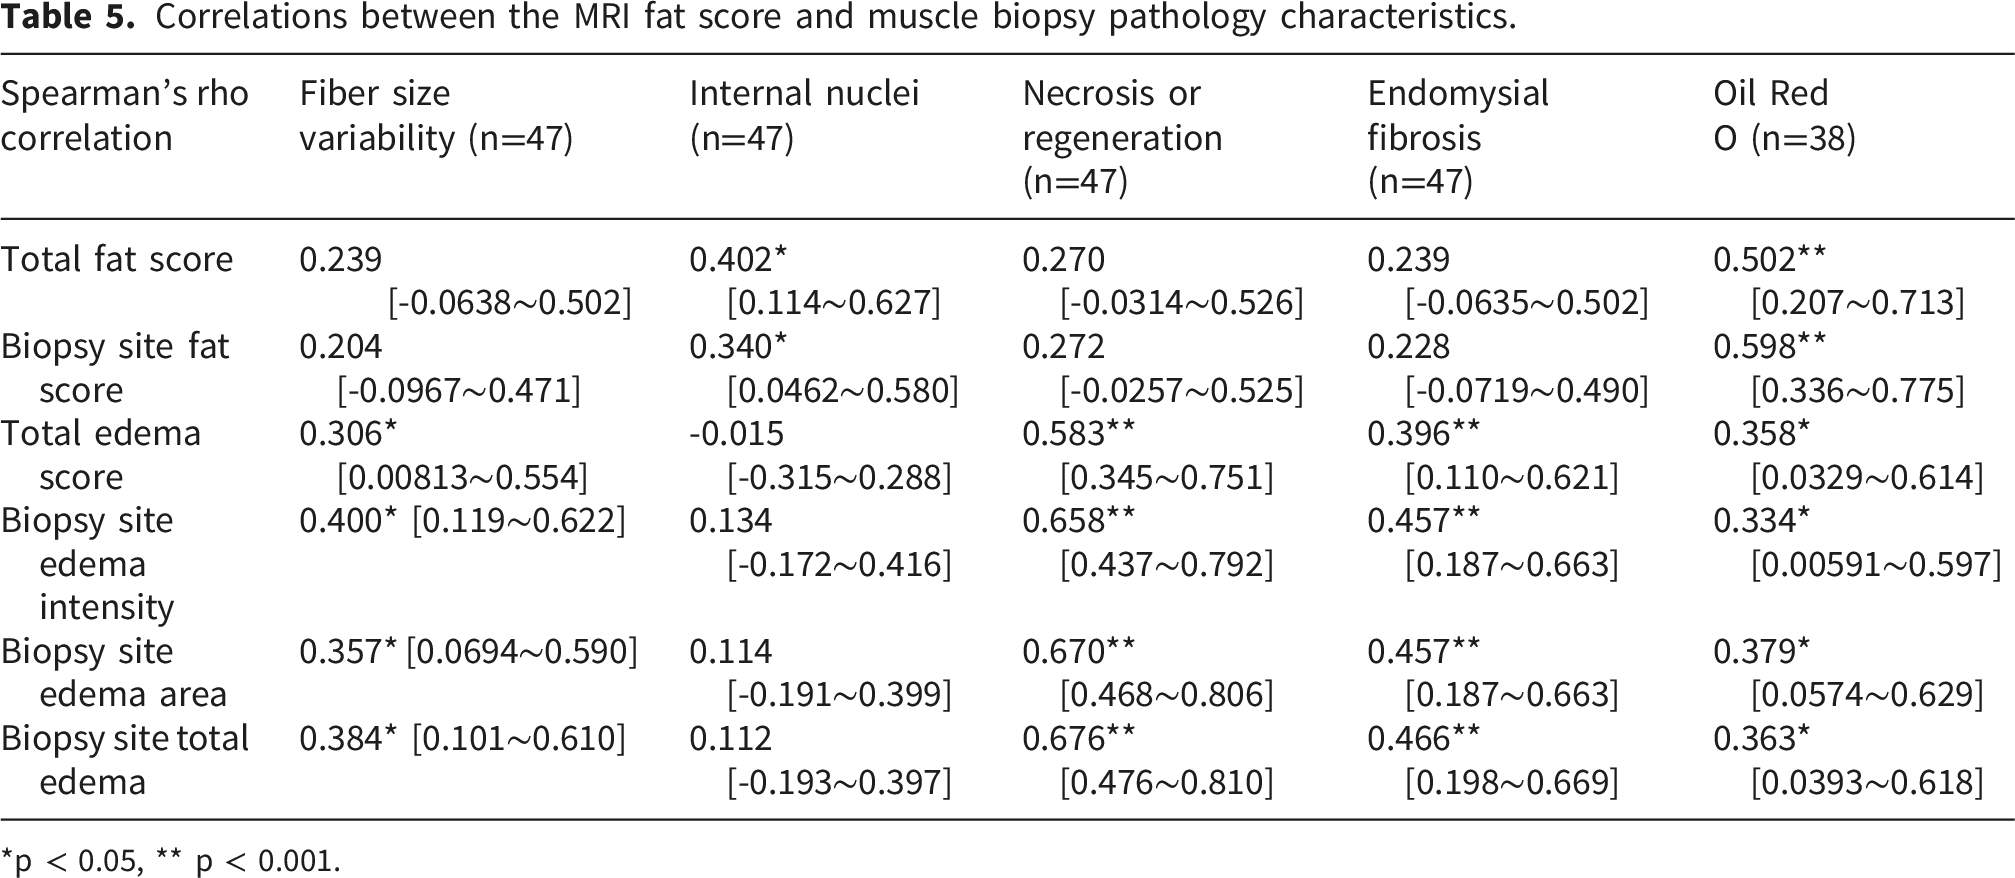
Correlations between the MRI fat score and muscle biopsy pathology characteristics.
*p < 0.05, ** p < 0.001.
Discussion
In this study, we present a novel coronal view-based visual MRI scoring system for evaluating muscle edema and fat infiltration across patients with hereditary and inflammatory myopathies. Our findings demonstrate that this time-efficient MRI acquisition protocol together with the semiquantitative visual scoring system correlate well with the clinical functional impairment as well as muscle histopathological markers in patients with hereditary myopathy or inflammatory myopathy.
Traditional axial view-based muscle MRI remains the diagnostic gold standard for identifying selective patterns of muscle involvement, such as the characteristic posterior compartment sparing or involvement in various muscular dystrophies. 24 However, the prolonged acquisition time required for a comprehensive four-limb axial survey often limits its feasibility in routine clinical practice, particularly for patients with advanced physical disability or those in high-volume neuromuscular clinics. Our protocol capitalizes on the fact that the long axis of major limb muscles aligns naturally with the coronal plane. This orientation allows for the simultaneous capture of bilateral extremities in a single acquisition, drastically reducing table time while maintaining a broad field of view. To address concerns regarding the diagnostic accuracy of this simplified approach, we conducted a rigorous validation study comparing axial and coronal planes in the thigh—a pivotal region for myopathic assessment. Our findings revealed excellent consistency (fat score ICC = 0.959, edema ICC = 0.910–0.917), demonstrating that the coronal-based scores are highly representative of the data obtained through traditional axial imaging. While we acknowledge that the coronal view may offer less anatomical detail for small, individual muscles (e.g., specific forearm flexors), our study suggests that grouping muscles into functional compartments provides a more robust and reproducible measure of ”global disease burden.” This compartmental approach reduces inter-rater variability and, as shown in our results, correlates strongly with clinical functional scales and histopathological markers. Furthermore, the feasibility of post-acquisition multiplanar reconstruction ensures that axial-like orientations can still be scrutinized if a specific muscle of interest requires detailed inspection. In conclusion, our coronal view-based protocol offers a validated, high-efficiency alternative that balances anatomical screening with clinical practicality, making it an ideal candidate for a longitudinal biomarker of disease activity in both hereditary and inflammatory myopathies.
To explore the clinical significance of the coronal view-based MRI visual score, we first examined the clinical correlation in two specific disease cohorts: patients with IMNM and patients with FSHD. Consistent with their underlying pathophysiology, we found that inflammatory myopathies demonstrated markedly higher edema scores, whereas hereditary myopathies were characterized by greater fat infiltration. Patients with IMNM exhibited particularly prominent edema, aligning with prior observations of aggressive inflammation and severe myocellular injury in this subgroup. 3 In contrast, patients with FSHD demonstrated chronic fat replacement in muscle, which is reflective of progressive muscle fiber degeneration. 22 The MRI edema scores and fat scores were significantly correlated with muscle strength in patients with IMNM and FSHD, respectively. These findings reinforce the clinical relevance of MRI in reflecting the clinical and functional status of these patients.25,26
By extending the use of this coronal view-based MRI visual scoring system to patients with various hereditary myopathies and inflammatory myopathies via regression analyses, we revealed divergent clinical predictors of imaging abnormalities. In inflammatory myopathy, total edema scores were independently predicted by both elevated CK and reduced MMT22 scores, suggesting inflammatory burden causing muscle damage and muscle vulnerability. In hereditary myopathies, fat infiltration was significantly associated with older age, the disease duration and lower muscle strength, reflecting cumulative disease progression over time. These findings support the hypothesis that MRI markers may reflect both disease activity and chronicity: acute inflammation versus longstanding degeneration of the muscle status.
While muscle MRI is widely used in the evaluation of various myopathies, including muscle edema indicating active muscle inflammation and chronic fat replacement in muscle degeneration and dystrophy, histopathology changes under muscle biopsy remain important. In this study, we demonstrated that the coronal view-based MRI visual score, for both biopsy site muscles and all assessed muscles, showed meaningful associations with histopathological features. Fat scores were significantly correlated with Oil Red O staining and central nucleation, whereas edema scores were correlated with fiber size variability, myofiber necrosis and regeneration, and interstitial fibrosis. In hereditary myopathy with a longer disease course, fat scores were more elevated, which also correlated with positive Oil Red O staining, as well as internal nucleation. Various hereditary myopathies often present with chronic degeneration of muscle, in which internal nucleation becomes prominent under chronic muscle damage, and ultimately, muscle atrophy and fat infiltration become prominent after prolonged degeneration, which may be positively detected by Oil Red O staining.27,28 On the other hand, previous studies have shown that muscle edema visualized by T2 hyperintense signals under fat-suppression sequences (commonly used STIR) indicates muscle inflammation, cell necrosis, denervation changes and myocyte swelling.29,30 Active muscle inflammation in inflammatory myopathy leads to myofiber necrosis and regeneration, which causes fiber size variability due to the presence of both atrophied and hypertrophied fibers.27,31 These findings further support the biological relevance of imaging–pathology relationships in neuromuscular disease.11,32,33 A previous study indicated that conventional axial view-based MRI has difficulty reflecting interstitial fibrosis changes in histopathology. Notably, our novel coronal view-based MRI revealed a significant correlation between histopathological interstitial fibrosis and the STIR image score. We hypothesized that interstitial fibrosis involves a loose extracellular matrix, which has the capacity to retain water. As a result, the signal change would be noted in the STIR images, but this hypothesis requires further investigation.34,35
However, this study had several limitations that need to be addressed. First, as a cross-sectional study, we were unable to study temporal changes in the MRI findings of myopathies. Future studies with longer follow up period and longitudinal data are needed to determine whether MRI scores can predict functional decline or even therapeutic response. Second, although the total cohort size was robust (n=102), the sample sizes for specific myopathy subtypes were relatively small, which may limit the statistical power for subgroup analyses. Nevertheless, our primary objective was to demonstrate the broad feasibility and clinical utility of this protocol across a spectrum of myopathies. Our results successfully confirmed distinct patterns, predominant fatty infiltration in hereditary myopathies and edema in inflammatory myopathies, that strongly correlated with functional status, supporting the protocol’s generalizability. Third, we relied on a semiquantitative visual scoring system rather than fully quantitative methods. While Dixon-based Proton Density Fat Fraction (PDFF) is the current gold standard for quantification, it requires specialized post-processing and longer acquisition times.22,36,37 Our visual scoring system, validated by high inter-rater agreement (ICC 0.831), provides a practical and accessible alternative for rapid screening in busy clinical environments where patient throughput and comfort are prioritized. We acknowledge that the non-linear nature of these visual grading strata is a limitation. Correlations between MRI scores and clinical/pathological variables were assessed using Spearman’s rank correlation, as this non-parametric approach acknowledge that the interval between grades are not necessarily linear. We used rank regression to account for the non-equal strata of MRI visual scores for non-parametric multivariate analysis of MRI visual scores and clinical features. Fourth, to prioritize time efficiency, we did not perform a systematic plane-to-plane comparison (axial vs. coronal) for every muscle group across the entire cohort. However, our validation analysis in the thigh muscles demonstrated excellent agreement between the two planes (ICC > 0.9), suggesting that the coronal view serves as a reliable surrogate for assessing overall disease burden, even if the anatomical granularity for specific small muscles is lower than that of axial imaging. Fifth, we acknowledged that our study had fewer control compared to either inflammatory or hereditary myopathy patients. We used a frequency-matching approach rather than individual 1:1 matching, with a primary goal to ensure that the control group as a whole did not differ significantly in its demographic (age and sex) distribution from the total myopathy group. While the inflammatory myopathy patients were older compared to the hereditary myopathy and healthy control group, when comparing the healthy control and all myopathy patients, there were no significant difference in both age and sex distribution. Finally, our protocol focused exclusively on limb muscles; detailed evaluation of axial muscles, such as neck and paraspinal muscles, was not included. This may be a limitation in specific myopathies with predominant axial involvement.
Conclusion
We developed a novel coronal view-based muscle MRI protocol, together with a semiquantitative visual score for muscle edema and fat infiltration assessment, which correlated well with the clinical condition and histopathological changes in patients with myopathy. This time-efficient protocol allows a wide anatomical coverage within less time.
Supplemental material
Supplemental material - Time-efficient coronal MRI reflects clinical and pathological features of myopathies
Supplemental material for Time-efficient coronal MRI reflects clinical and pathological features of myopathies in Gin Hoong Lee, Chi-Chao Chao, Hsin-Chieh Huang, Hsin-Yi Huang, Wei-Yu Su, Te-Wei Wang, Chih-Chao Yang, Tiffany Ting-Fang Shih, Sung-Tsang Hsieh and Hsueh-Wen Hsueh in Journal of Neuromuscular Diseases.
Footnotes
Acknowledgments
We confirm that we have read the Journal’s position on issues involved in ethical publication and affirm that this report is consistent with those guidelines.
Consent for publication
All authors have read and agreed upon the contents of this manuscript submitted to Journal of Neuromuscular Diseases.
Author contributions
All the authors contributed to the data acquisition and analysis.
Funding
The authors disclosed receipt of the following financial support for the research, authorship, and/or publication of this article: This study was supported by grants from National Taiwan University Hospital to H.-W.H. (111-M0008, 113-M0004) and National Science and Technology Council H.-W.H. (114-2314-B-002 -122).
Declaration of conflicting interests
The authors declared no potential conflicts of interest with respect to the research, authorship, and/or publication of this article.
Data Availability Statement
The datasets generated during analysis and/or during the current study are available from the corresponding author upon reasonable request.
Supplemental material
Supplemental material for this article is available online.
References
Supplementary Material
Please find the following supplemental material available below.
For Open Access articles published under a Creative Commons License, all supplemental material carries the same license as the article it is associated with.
For non-Open Access articles published, all supplemental material carries a non-exclusive license, and permission requests for re-use of supplemental material or any part of supplemental material shall be sent directly to the copyright owner as specified in the copyright notice associated with the article.