
Abstract
Background
Distal myopathies (DMs) comprise a heterogeneous group of hereditary muscle diseases characterized by predominant distal muscle weakness and atrophy overlapping with hereditary neuropathies, leading to diagnostic delays or misclassification.
Results
We conducted a retrospective analysis of 125 patients from 103 families with DMs revealed at a federal genetics referral center in Russia from 2010 to 2025, representing the largest Russian DM cohort. Causative variants were identified in 20 genes, most commonly in the GNE (30.1%), DYSF (13.6%), and TTN (9.7%) genes. Although distal muscle involvement predominated, lower limb muscle magnetic resonance imaging (MRI) showed proximal involvement in 93.4% (71/76) of cases regardless of disease stage. Across the cohort, gracilis, rectus femoris, and tibialis posterior were relatively spared. Referral misdiagnosis as hereditary neuropathy occurred in 32.8% (41/125) of cases. To characterize diagnostic pitfalls, we compared patients initially referred with neuropathy to those referred with DM. We demonstrated that group differences were evident solely in the needle electromyography (EMG) reports, while clinical features and lower limb muscle MRI data were broadly comparable. We analyzed the probable causes of EMG misinterpretations, which most commonly included severe spontaneous activity being mistaken for active denervation, high-amplitude motor unit potentials being misclassified as neurogenic, and, in some cases, the wrong choice of muscle for the study.
Conclusion
According to our data, one-third of patients with DM were initially referred for suspected neuropathy. In many cases, misclassification was likely due to pitfalls in EMG interpretation, highlighting the need for careful EMG analysis in patients with myopathies.
Introduction
Distal myopathies (DMs) comprise a heterogeneous group of hereditary muscle diseases characterized by predominant distal muscle weakness and atrophy.1,2 While William R. Gowers provided an early description of distal form of myopathy in 1902, the condition was not established as a distinct clinical entity until Lisa Welander’s seminal 1951 report on a large cohort of patients with late
The genetic spectrum of DMs continues to expand.5,6 To date, more than 30 causative genes have been identified, most with autosomal dominant or recessive inheritance patterns, though X-linked and digenic forms have also been reported1,2,7–9. DMs exhibit substantial phenotypic overlap with other neuromuscular conditions, underscoring the need for detailed clinical characterization to achieve an accurate diagnosis.1,2
The overall prevalence of DMs remains insufficiently defined. Current epidemiological data are mainly based on regional cohort neuromuscular studies, which are an important framework for future population
In Russia, comprehensive cohort data on DMs remain limited. The largest published series have primarily focused on selected genetic subtypes, most notably the relatively prevalent GNE
The increasing application of next
Here, we analyzed clinical and instrumental data from a cohort of patients with genetically confirmed DMs. We provide a consolidated overview of DM genetic and phenotypic spectrum while highlighting practical diagnostic challenges by comparing referral patterns for neuropathy versus myopathy.
Materials and methods
Patient cohort
This study was conducted at the Research Centre for Medical Genetics (RCMG), Moscow, Russia, and represents a retrospective analysis of patients with DM evaluated between January 2010 and December 2025. Patients were included in the study if they carried pathogenic, likely pathogenic variants, or variants of uncertain significance (VUS) considered plausible disease-associated candidates. The cohort comprised 125 patients from 103 families with positive findings after different molecular approaches (Figure 1(a)). Of these, 109 patients were recalled for a standardized neurological examination (Figure 1(b)). Patient cohort representation. (A) Pie chart showing the proportion of cases with causative variants identified by different molecular genetic studies. WES, whole exome sequencing; WGS, whole genome sequencing; qPCR, quantitative polymerase chain reaction; FSHD, facioscapulohumeral muscular dystrophy (B) Venn diagram showing the overlap of cases with available clinical examination, muscle MRI, and EMG data.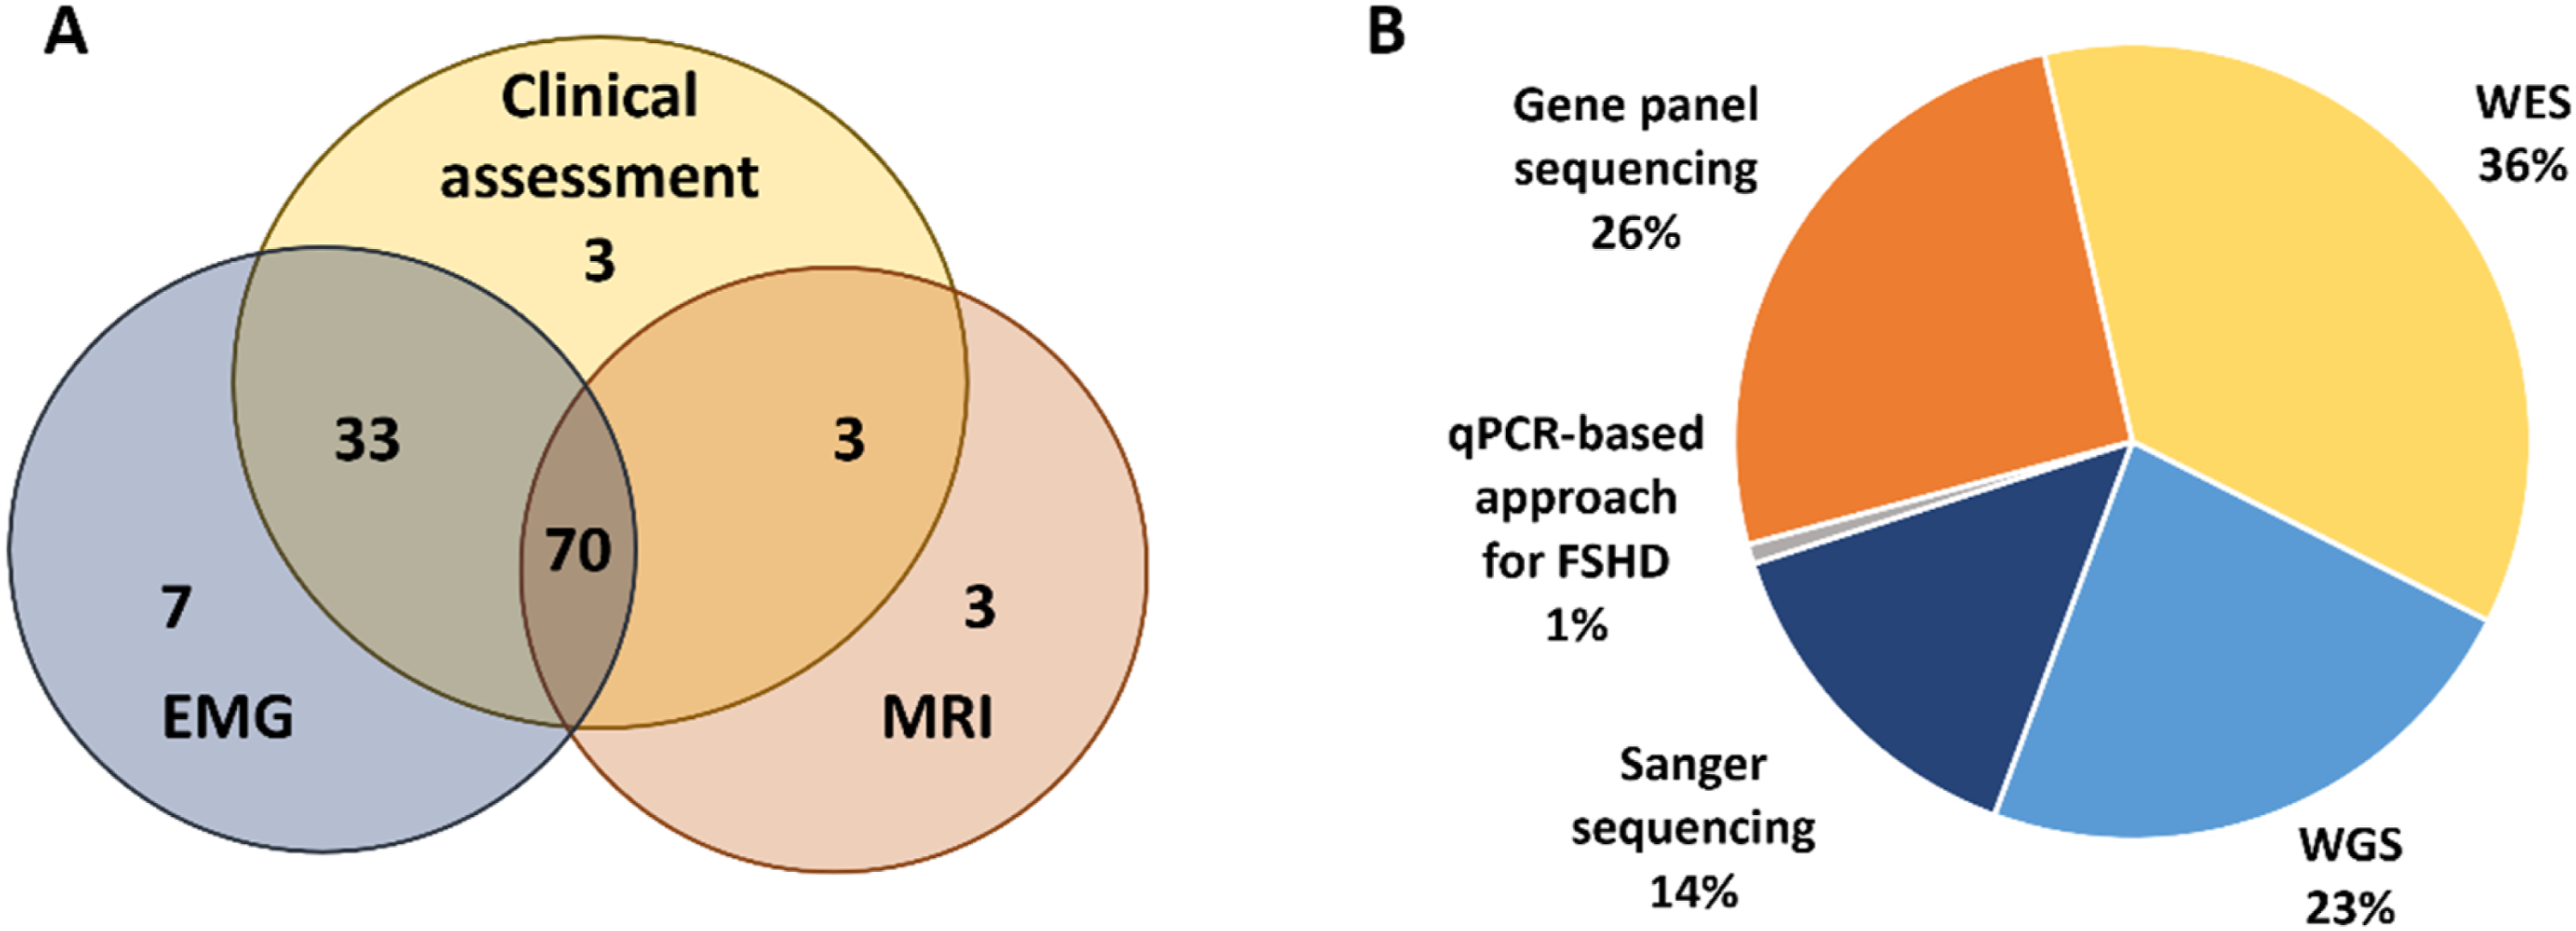
Clinical data collection
General data included gender, self
Electrodiagnostic studies
Ancillary investigations, when available, were extracted from medical records and reviewed retrospectively. These data comprised reports on electrocardiography, echocardiography, spirometry, and needle electromyography (EMG) performed at referring institutions. Needle EMG protocols were analyzed for 110 patients.
Muscle MRI data
Muscle MRI of the lower limbs was performed using a 1.5T scanner (Siemens MAGNETOM Skyra, Erlangen, Germany) with axial T1
Genetic testing
Peripheral blood samples were collected from probands and, when available, from affected and unaffected family members. Genomic DNA was extracted using standard methods. Genetic testing includes various NGS approaches. A total of 32 patients underwent gene panel (Suppl. table 1), 45 patients underwent whole exome sequencing, and 29 patients underwent whole genome sequencing (WGS) (Figure 1(a)). WGS was performed as part of a joint research program with the Biotech Campus LLC. Candidate variants were confirmed by Sanger sequencing, and segregation analysis was performed in available family members when appropriate including 18 affected family members. The variant c.169_170delinsTT in the GNE gene (NM_001128227.3) was identified by Sanger sequencing in one patient of Bashkir ancestry in our previous work. 14 All variants were confirmed by Sanger sequencing, which was carried out using ABIPrism 3100xl Genetic Analyzer (Applied Biosystems, Foster City, CA, United States) according to the manufacturer’s protocol. For one patient, D4Z4 repeat contraction was assessed using a PCR-based method as previously described. 19 Variant interpretation followed the ACMG/AMP standards and guideline. 20
Statistical analysis
Group comparisons for continuous variables (MMT scores for arm, hip, and hand; Gini severity coefficients for thigh and lower leg muscles) were performed using the Mann–Whitney U test, while binary variables (presence of muscle atrophy in hands, feet, upper and lower legs; spontaneous activity on EMG; and proportion of purely myopathic EMG findings) were analyzed using Fisher’s exact test. For bilateral atrophy measures, a composite variable was generated and coded as 1 if at least one side was affected, and as 0 otherwise.
To quantify the selectivity of muscle involvement, we calculated the Gini coefficient based on muscle-level modified Mercuri scores (0–4) for each patient. Higher values indicate a more selective distribution of fatty degeneration, whereas lower values reflect a more diffuse pattern. Gini coefficients were computed separately for thigh and lower leg muscle groups to assess regional selectivity in addition to the overall analysis.
To account for overall disease severity, we additionally calculated a severity-weighted Gini coefficient. This metric was defined as the standard Gini coefficient multiplied by the normalized overall Mercuri burden (
Ethical compliance
The studies involving humans were approved by the Institutional Review Board of the Research Centre for Medical Genetics, Moscow, Russia (Protocol No. 7/2 dated 9 November 2020) The studies were conducted in accordance with the local legislation and institutional requirements. The participants provided their written informed consent to participate in this study.
Results
Patient cohort
Overall, from January 2010 to December 2025, 125 patients from 103 families were diagnosed with DMs via molecular genetic analysis. The cohort included 52 males (52/125, 41.6%). The mean age at the last assessment was 38.2 years (range 9–72). The mean age at symptom onset was 24.4 years (range 0–64), with a mean disease duration of 13.8 years (range 0–62). A disease duration of 0 years reflects several relatives evaluated through family screening who reported no symptoms at the time of examination. A positive family history was reported in 29 families from 103 (28.2%). An autosomal dominant inheritance pattern was identified in 38 families (38/103, 36.9%), an autosomal recessive pattern in 65 families (65/103, 63.1%) including 3 consanguineous cases (3/103, 2.9%).
The most common presenting symptom at disease onset was gait disturbance (72/125, 57.6%). Difficulty running was reported as the first symptom in 8.8% (11/125) of cases. Other first symptoms included inability to walk on heels and/or toes, muscle pain, hand weakness, isolated elevation of serum CK, and foot deformity. Loss of ambulation was observed in 10.8% of cases (13/120) for whom anamnestic data were available, at a mean age of 35.6 years (range: 22–48). This finding was predominantly associated with pathogenic variants in the GNE (9/13) and DYSF (3/13) genes.
On examination, proximal upper limb weakness was present in 41.3% (45/109), and distal upper limb weakness in 56,9% (62/109). Proximal lower limb weakness was noted in 60.6% (66/109), while distal lower limb weakness in 87.2% (95/109). Neck weakness was observed in 34.9% (38/109), and asymmetric muscle involvement was present in 34.9% (38/109) patients.
Serum CK level was known for 100 patients and was elevated more than two-fold (≥ 400 U/L) in 78% (78/100) of patients, including 13/100 (13%) with very high CK levels (≥ 3000 U/L).
Cardiac and respiratory assessments were available for only a subset of patients, primarily because these evaluations were typically initiated only in patients with corresponding complaints. Cardiac evaluation was available for 68 patients, and 22 of them (32.4%) had abnormalities, mainly cardiac arrhythmias detected on the electrocardiogram. Respiratory assessment was available for 17 patients, of whom 3 (17.6%) showed signs of respiratory insufficiency.
Overall, disease Genetic studies results. (A) Genes causative of DM in our cohort. Percentages indicate the proportion of families with the variants in this gene among 103 families with DM. (B) The distribution of causative variants in the cohort according to ACMG criteria.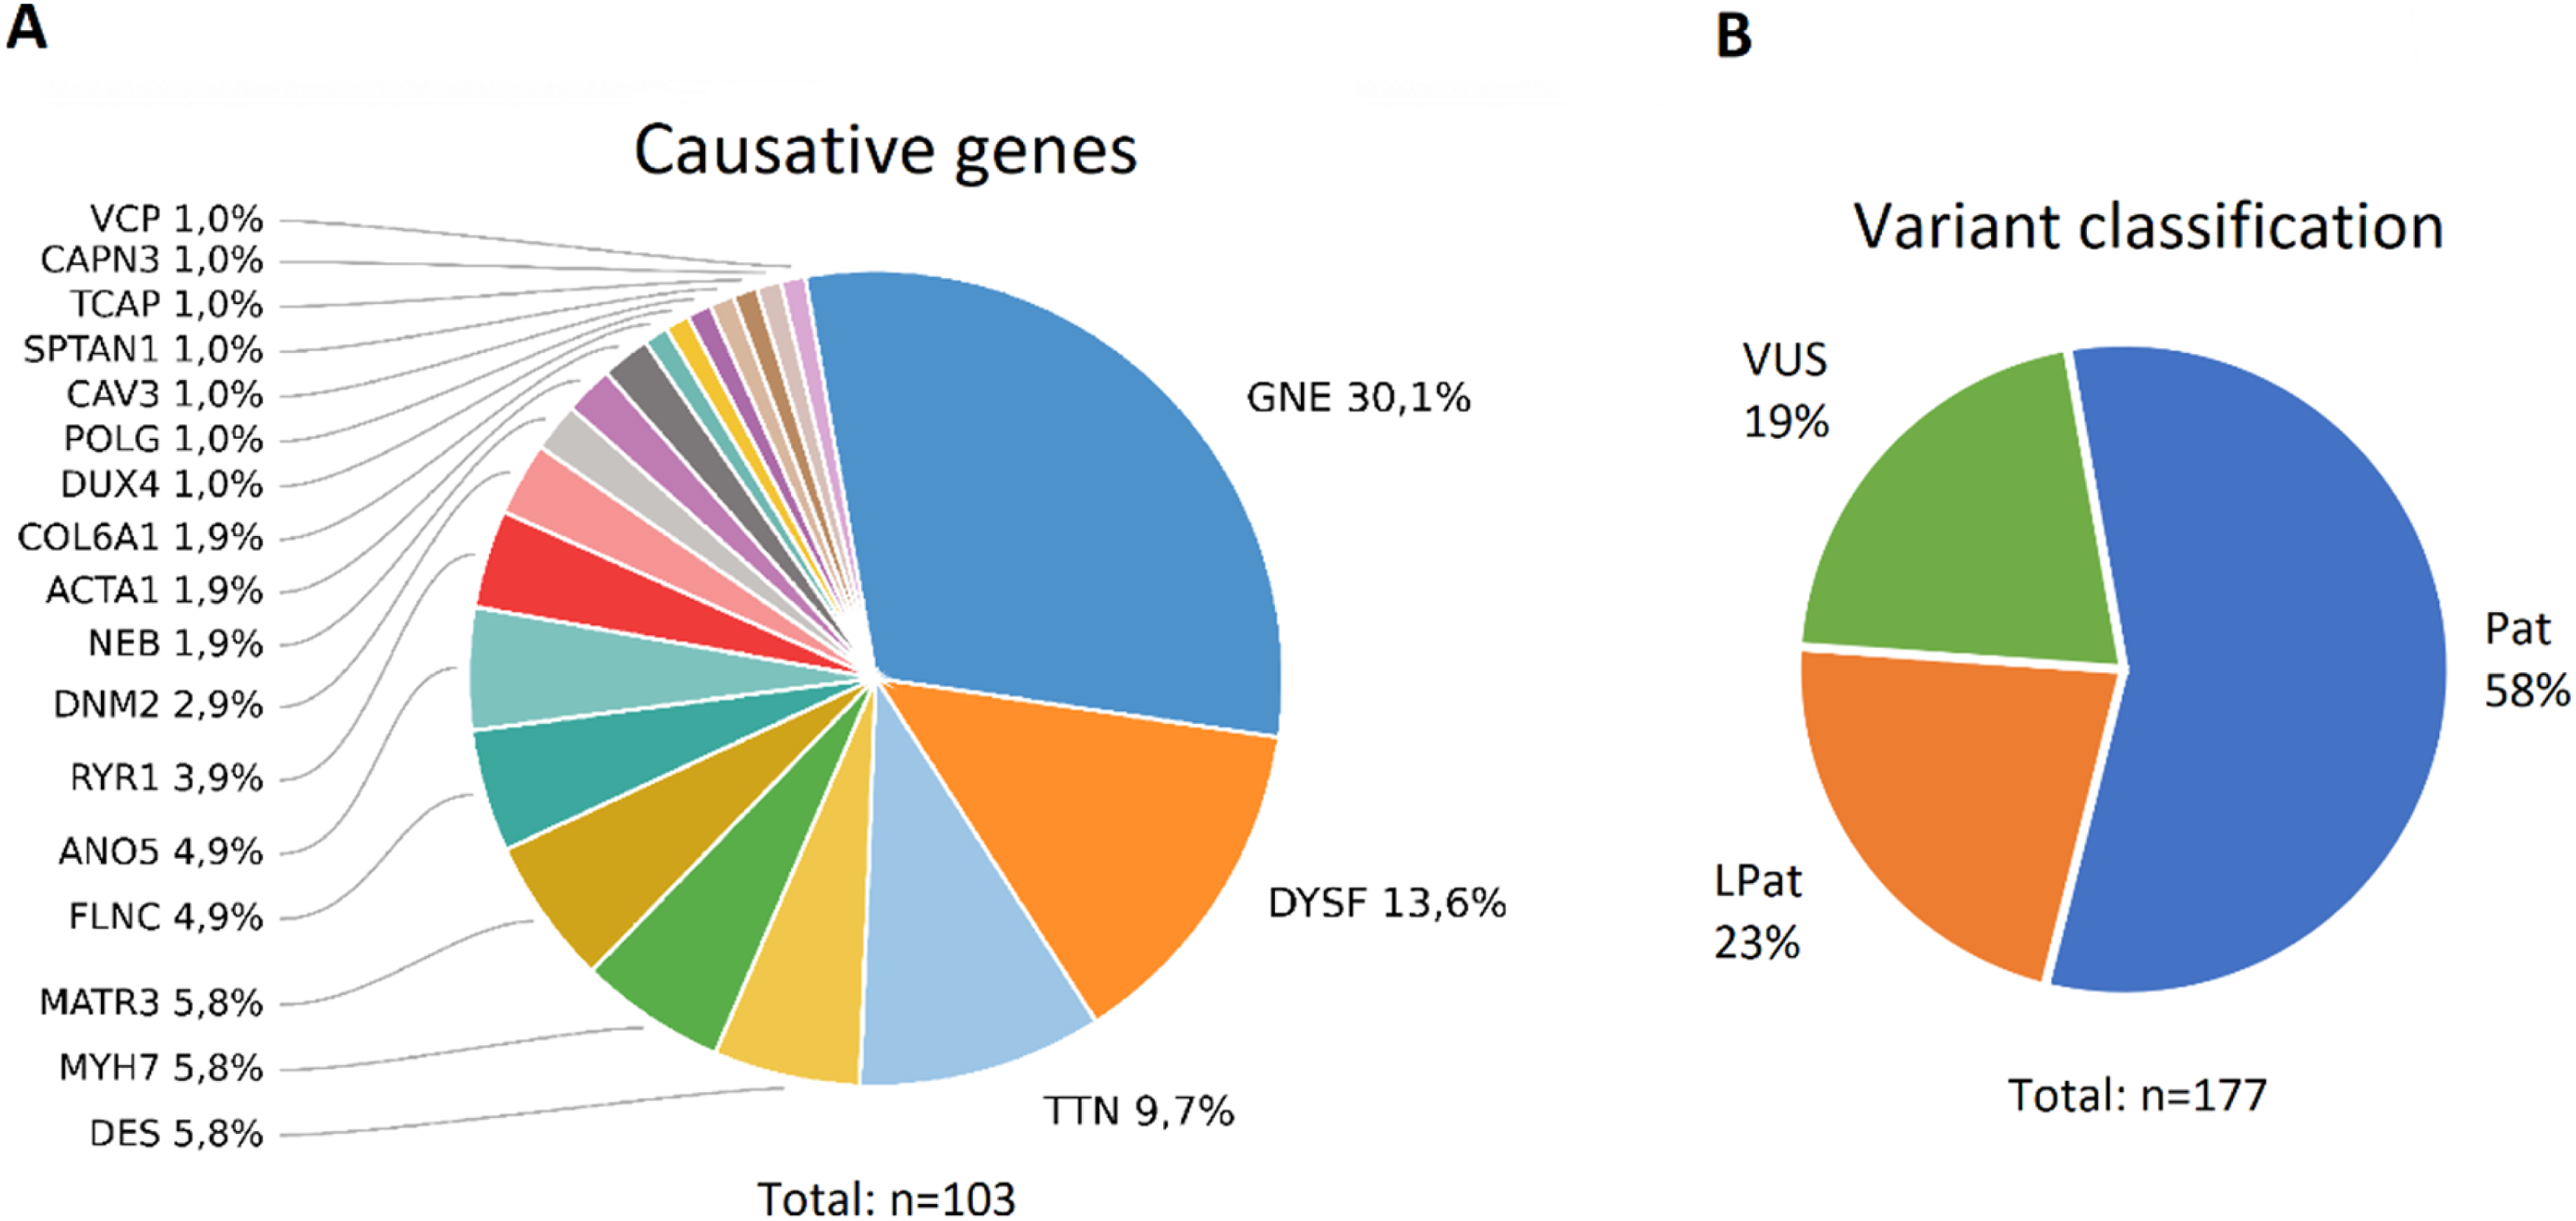
In six cases, we detected variants in genes that had either been linked to DM in only a few isolated case reports, or had never been associated with DM before (CAPN3, COL6A1 (two families), POLG, SPTAN1, and TCAP). Interestingly, patient carrying variants in the CAPN3 gene had been referred with a diagnosis of inherited neuropathy due to their needle EMG data. It is noteworthy that the patient with biallelic pathogenic variants in the CAPN3 gene had clearly clinically predominant lower leg muscle involvement (Figure 3(h)), although muscle MRI showed fat infiltration both in the thigh and lower leg muscles (Figure 3(h), (i)). Notably, patients with COL6A1-associated myopathy showed a clearly distal onset, initially presenting with difficulty walking on their heels, and at the time of examination had predominantly distal muscle weakness and atrophy (Figure 3(a)). Also, muscle MRI demonstrated the characteristic “sandwich” pattern and “target” sign typical for collagen VI-related myopathies (Figure 3(b), (c)). Furthermore, we identified causative variants in genes primarily associated with congenital nemaline myopathies (NEB and ACTA1), which have only rarely been linked to DM in previous case reports (Figure 3 (d)-(g)). In our cohort, these patients showed distal-predominant muscle weakness and atrophy. Notably, both patients with ACTA1-related myopathy also had hand muscle involvement. Clinical and muscle MRI findings in patients with some DMs. (A, B) A 50-year-old female with COL6A1-myopathy (A) Distal muscle atrophy, classical “inverted champagne bottle” appearance of the lower legs, pes cavus, and mild hand muscle atrophy. (B) Axial T1-WI muscle MRI demonstrating the “sandwich” pattern and “target” sign typical for collagen VI-related myopathies. (C) Axial T1-WI muscle MRI of a 52-year-old female with COL6A1-myopathy showed a “sandwich” and target sign in vasti muscles and rectus femoris, respectively. (D, E) A 17-year-old female (D) and a 38-year-old female (E) with ACTA1-related myopathy showing a clearly distal phenotype, including hand and lower leg muscle atrophy. (F) A 36-year-old male with NEB-related myopathy presenting with lower leg muscle atrophy, pes cavus, and hammertoes. Axial T1-WI muscle MRI of the lower legs shows mild involvement of the soleus muscles. (G) A 44-year-old female with NEB-related myopathy showing lower leg muscle atrophy. Axial T1-WI muscle MRI demonstrates predominant fatty replacement of the lower leg muscles. (H, I) A 22-year-old male with CAPN3-related myopathy presented clinically predominant lower leg muscles involvement. Axial T1-WI muscle MRI showing posterior compartment of thigh and lower leg muscles atrophy with fat infiltration.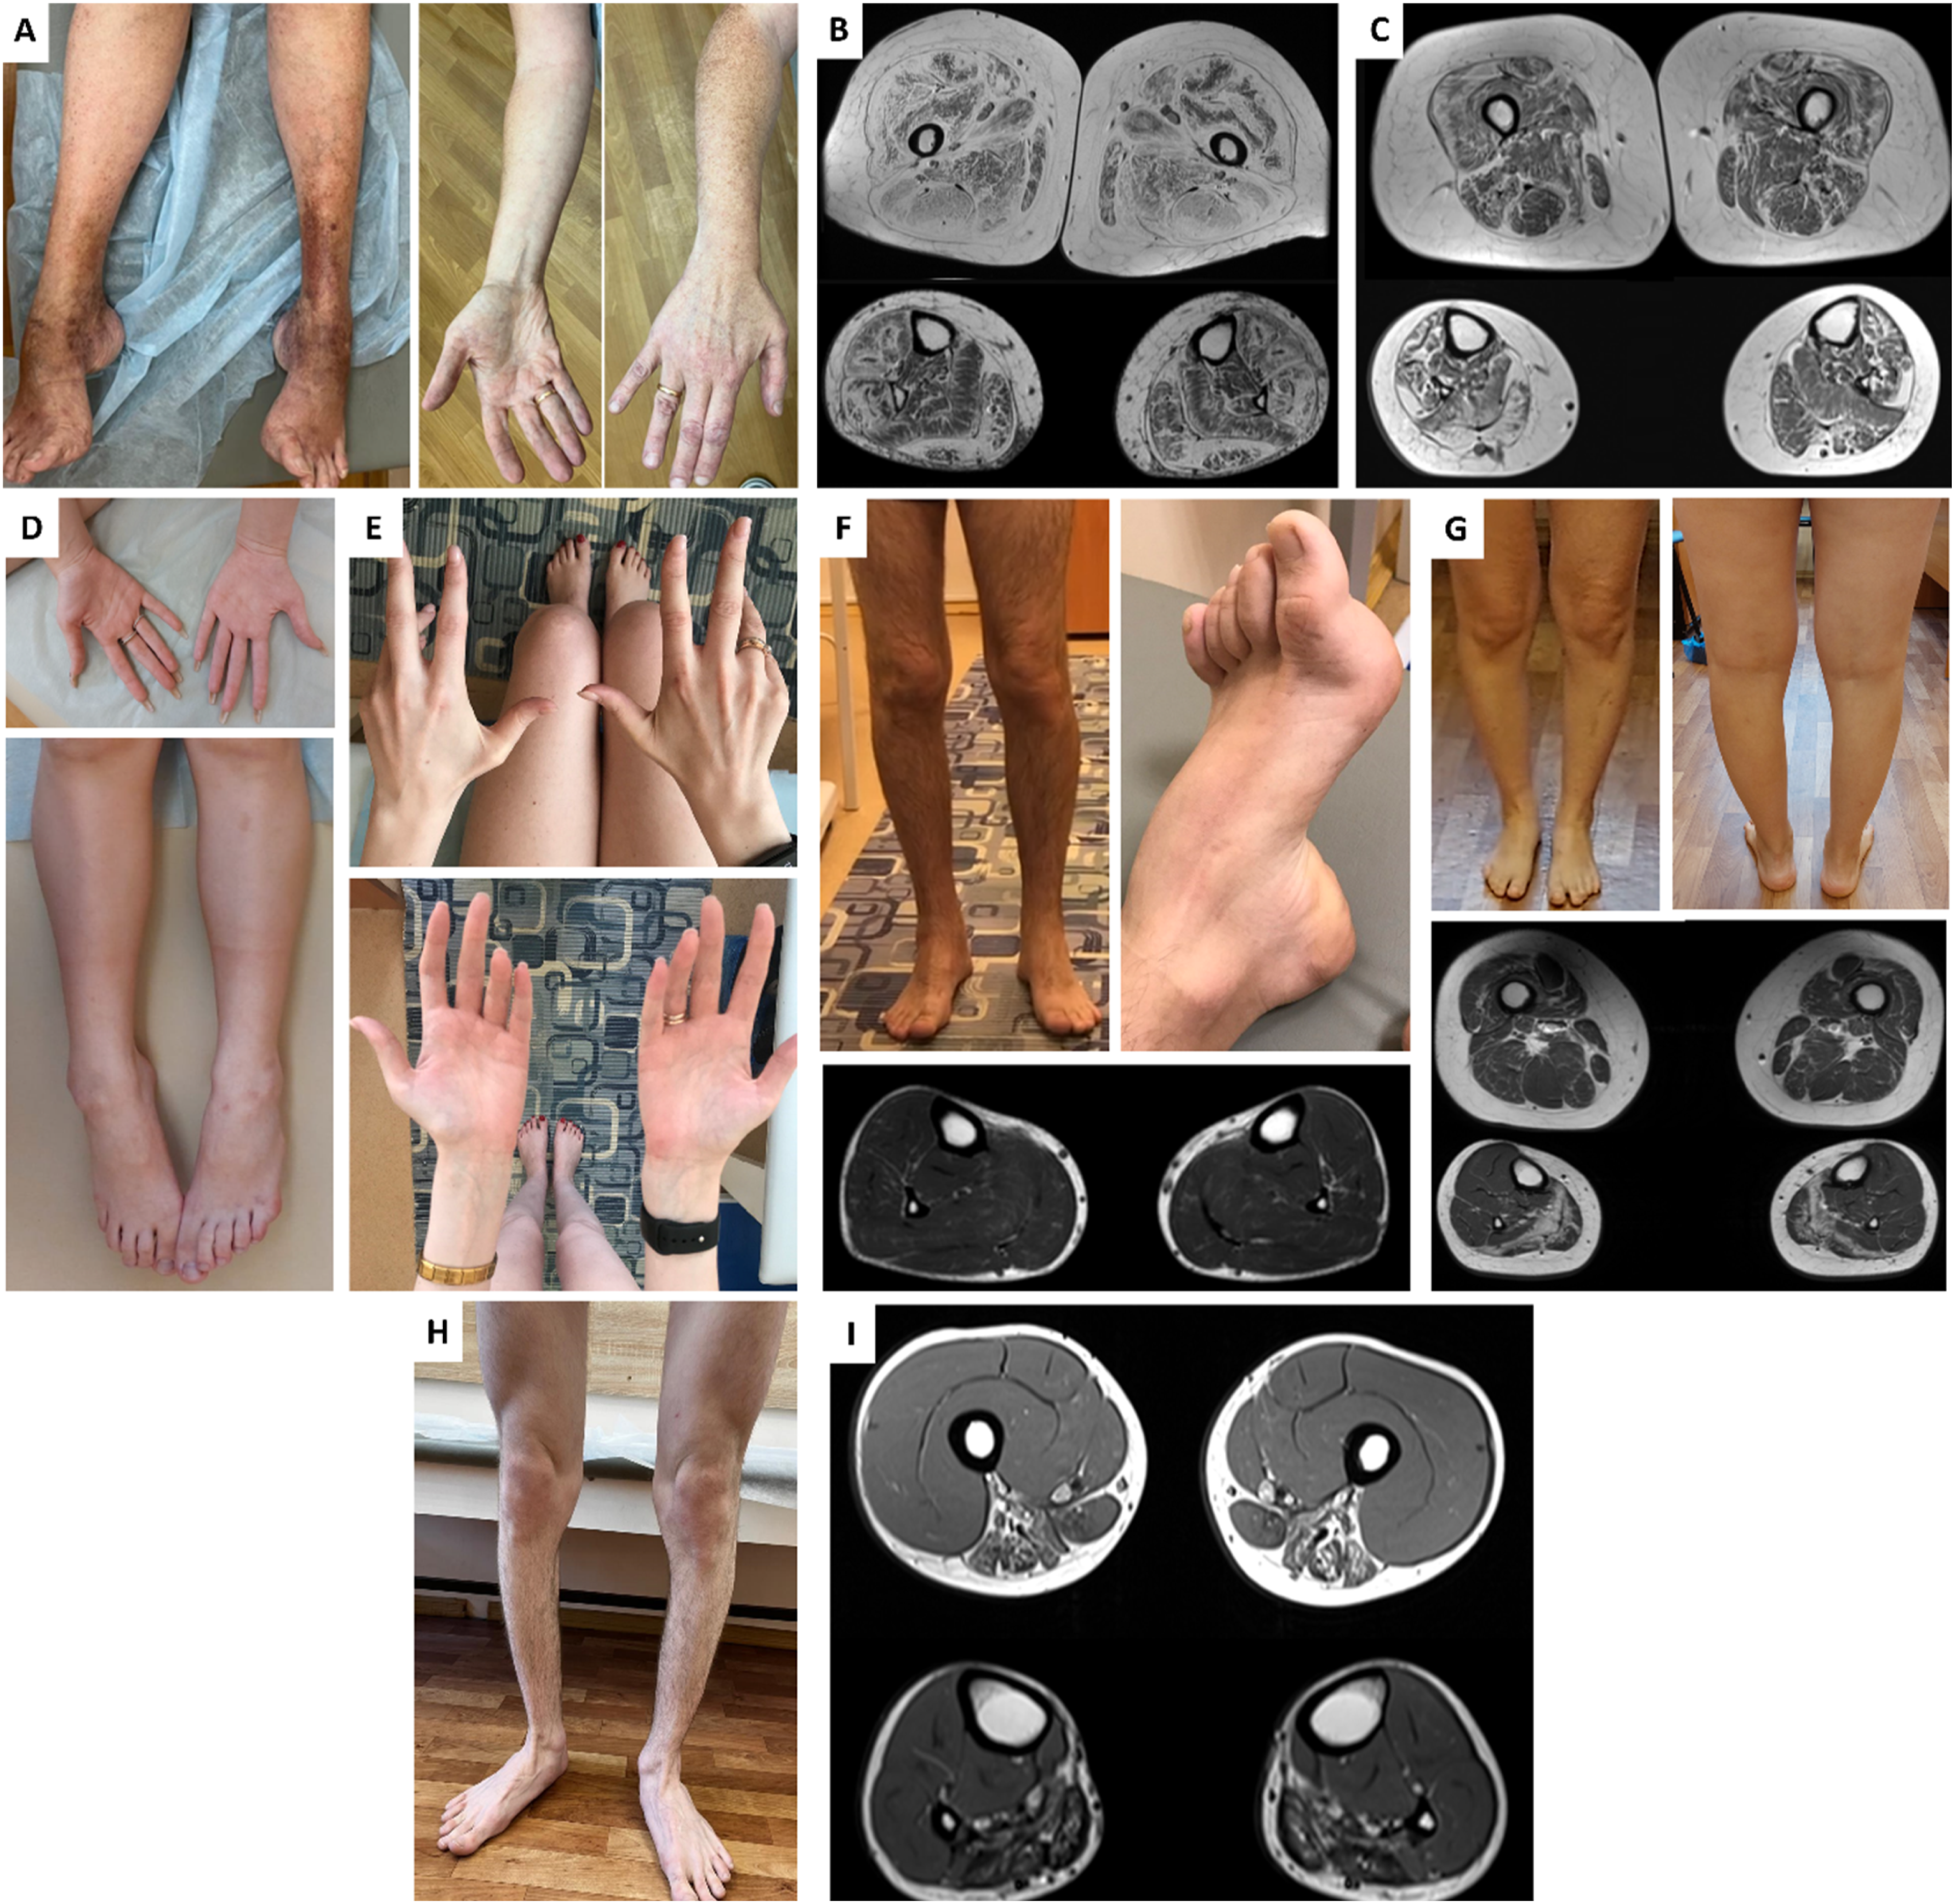
In one patient presenting with isolated asymmetric distal lower limb muscle weakness, previously performed WGS did not identify causative variants in genes that could explain the phenotype. Subsequent molecular testing revealed a reduced number of D4Z4 repeat units (9) on chromosome 4 with permissive 4qA haplotype, leading to a diagnosis of facioscapulohumeral muscular dystrophy.
Needle electromyography findings
Needle EMG was performed in 110 patients (Figure 4(b)). Of these, 34 patients (30.9%) underwent the procedure two or more times. The myogenic pattern was definitely identified in 76.4% (84/110) of patients, but 23.6% (26/110) of patients had other findings (Figure 4(a)), including a neurogenic pattern in 25 cases and absence of any abnormalities in 1 case. To identify potential sources of misinterpretation, we performed a descriptive retrospective analysis of the original needle EMG protocols in all cases where neurogenic abnormalities had ever been reported. The analysis, conducted by an experienced clinical neurophysiologist, was based on the original EMG conclusions and the supporting arguments documented in the reports. We found that in most cases, severe spontaneous activity was interpreted as evidence of an active denervation process. Additionally, high Characterization of needle EMG findings. (A) Identified patterns of needle muscle MRI and probable causes of incorrect EMG conclusions. The pie chart demonstrates the proportion of cases in which the EMG pattern was consistently interpreted as myogenic versus other patterns on protocol review. The bar chart indicates the most frequent factors to an initial neurogenic interpretation in EMG reports (high MUP amplitudes, examination of a wrong muscle, and significant spontaneous activity). (B) Spontaneous activity on needle EMG across genetically confirmed DMs. Stacked bar chart showing the distribution of spontaneous activity grades (no, 1+, 2+, 3+) on needle EMG by gene. Segment height reflects the number of patients per gene, with gene-specific colors consistent across all bars. Within each bar, genes are arranged from the most frequent at the bottom to the least frequent at the top. The total number of patients in each category is shown above the bars.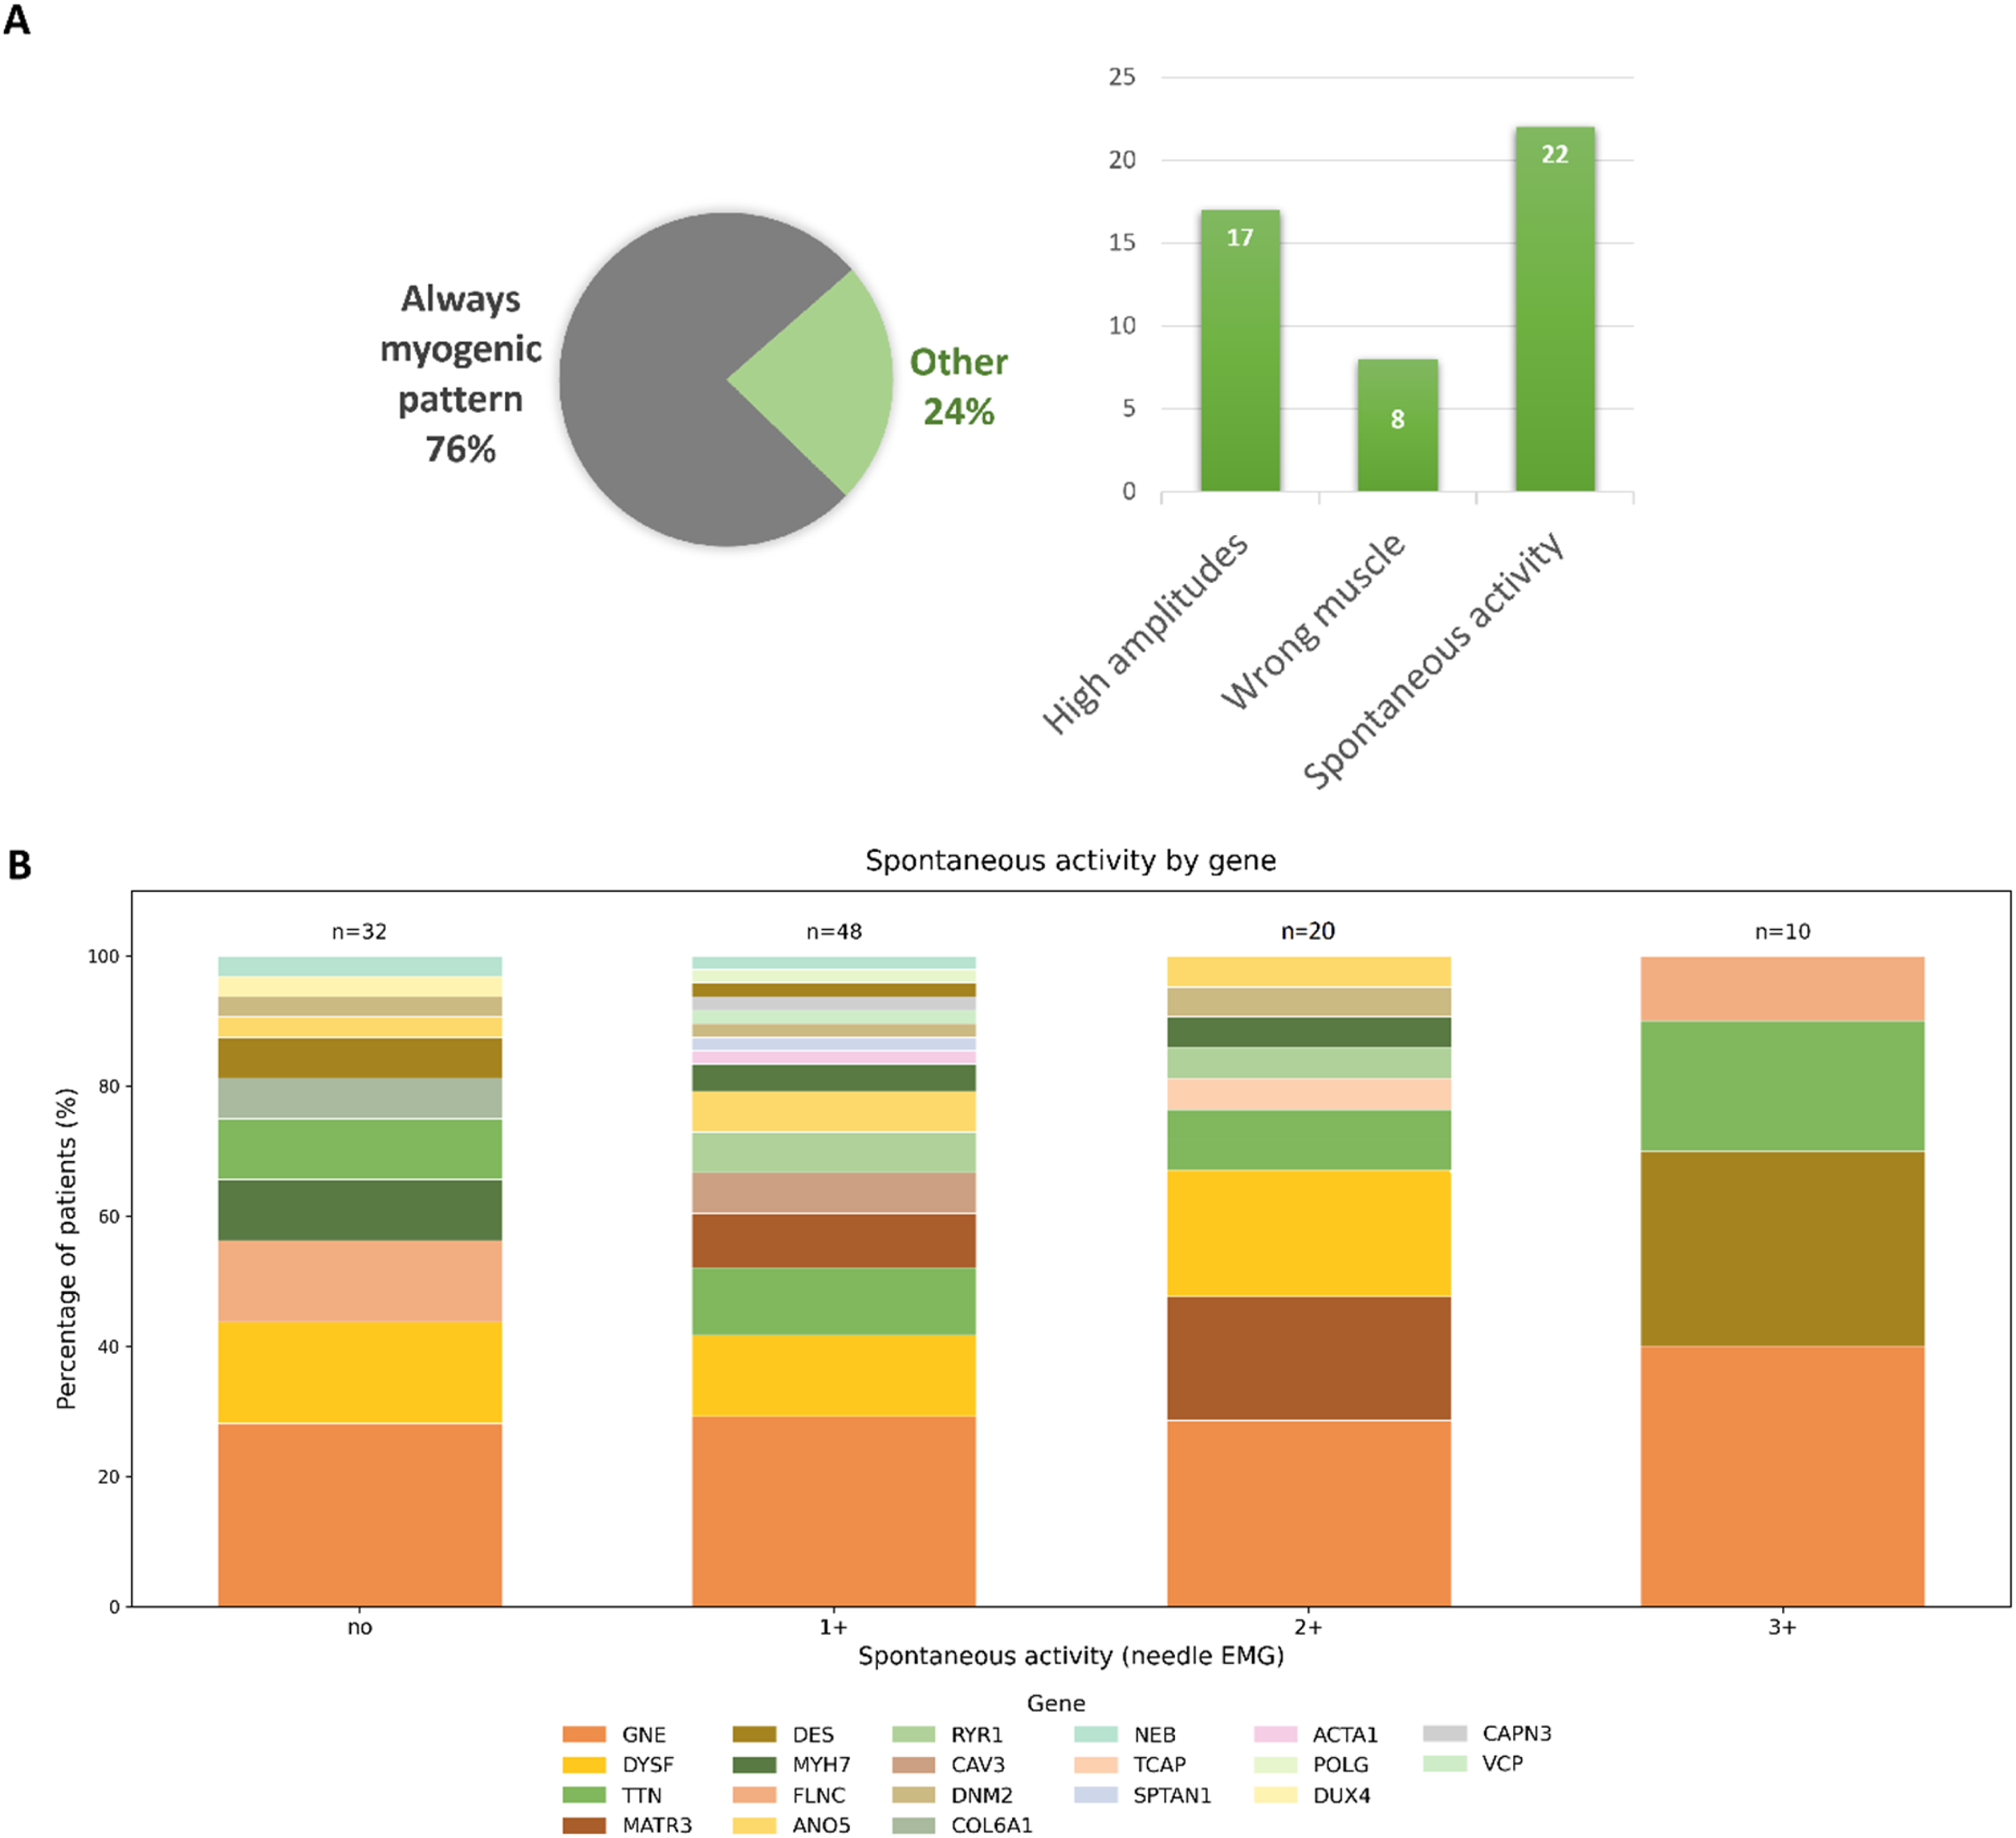
Pathological spontaneous activity was identified in 78 patients (78/110, 70.9%). Mild spontaneous activity (1+) was observed in 48 patients (48/110, 43.6%), moderate (2+) in 20 (20/110, 18.2%), and severe (3+) in 10 (10/110, 9.1%) (Figure 4(b)). Notably, the distribution of genetic diagnoses across spontaneous activity grades was similar.
Muscle MRI data
Lower
A heatmap summarizing the extent of muscle involvement in different myopathies is shown in Figure 5(a). Based on imaging of lower limb muscles, patients are grouped by gene and ordered by overall severity within each group. Left Analysis of muscle MRI studies in the DM cohort (A) Heatmap of modified Mercuri scores across 44 muscles (bilateral thigh and lower leg muscles) in patients with molecularly confirmed DMs. Patients are grouped by gene (ordered by gene frequency), and within each gene group are ordered by overall MRI severity. The blue side stripe demonstrates disease duration (years) for each patient (light to dark indicates shorter to longer disease duration). Color scales for Mercuri scores and disease duration are shown on the right and bottom. (B) Mean modified Mercuri grade (0-4) for each bilaterally assessed muscle, ranked from the most to the least affected. Dots indicate the cohort mean; error bars show bootstrap 95% confidence intervals based on 10,000 resamples (B=10,000).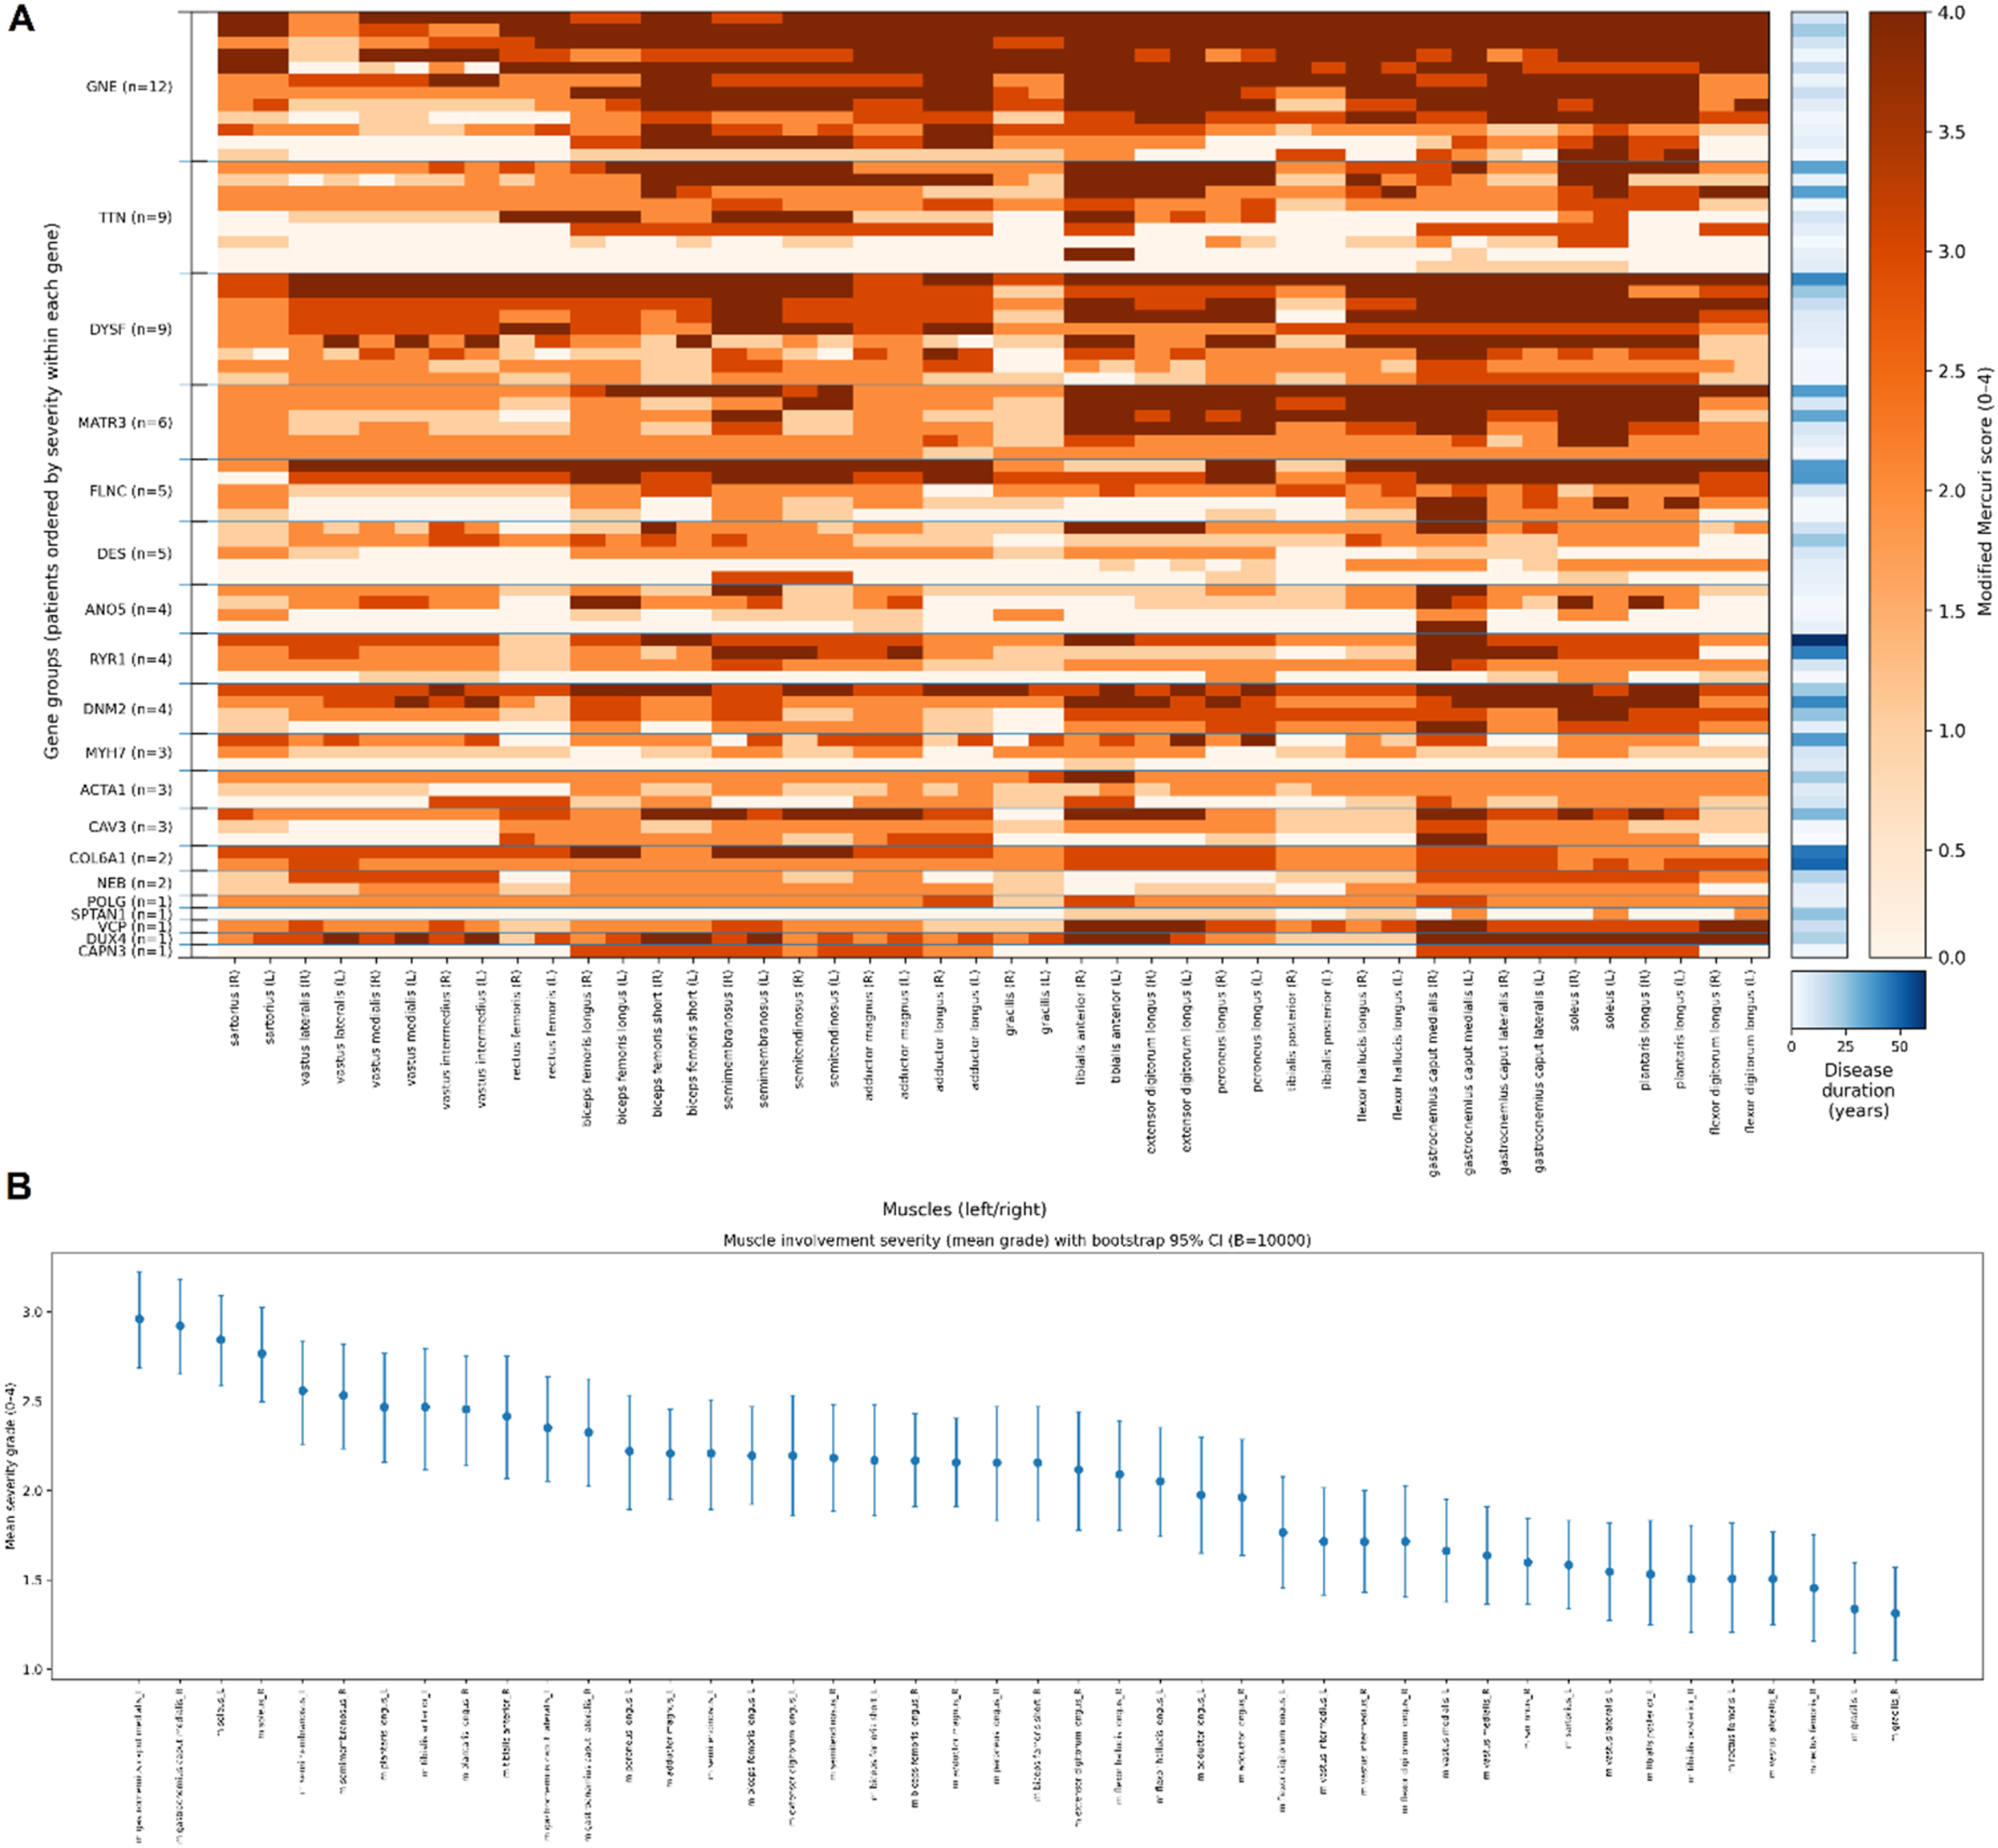
To summarize muscle involvement across the cohort, we calculated the mean modified Mercuri grade (0–4) for each bilaterally assessed muscle and ranked muscles by average severity (Figure 5(b)). Uncertainty around the mean was estimated using bootstrap 95% confidence intervals (10,000 resamples). The plot highlights preferential involvement of specific lower-limb muscles and overall similarity between left and right sides at the cohort level. Using pooled right- and left-side scores for each muscle, the lowest mean modified Mercuri scores were observed for m. Gracilis (mean 1.32; 27.9% of sides scored 0; 61.0% scored ≤1), m. Rectus femoris (mean 1.48; 33.1% scored 0; 53.9% scored ≤1), and m. Tibialis posterior (mean 1.52; 29.9% scored 0; 50.6% scored ≤1). Additional relatively spared muscles included m. Vastus lateralis (mean 1.53; 29.2% scored 0; 45.5% scored ≤1), m. Sartorius (mean 1.59; 20.1% scored 0; 41.6% scored ≤1), and m. Flexor digitorum longus (mean 1.74; 25.3% scored 0; 44.8% scored ≤1).
Revision of referral misdiagnosis
We stratified patients according to the initial referral diagnosis. Group 1 comprised patients referred with a diagnosis of hereditary neuropathy/neuronopathy, but who ultimately had a molecularly confirmed diagnosis of DM. Group 2 included patients in whom the referral diagnosis was concordant with the final molecular genetic diagnosis. Group 1 included 41 patients (41/125, 32.8%). The most common referral diagnoses were hereditary motor and sensory neuropathy (HMSN) in 73.2% (30/41), distal spinal muscular atrophy in 9.7% (4/41), and distal hereditary motor neuropathy in 4.9% (2/41). The variants in 14 genes were identified in this group (CAPN3, COL6A1, DES, DNM2, DUX4, DYSF, FLNC, GNE, MATR3, MYH7, NEB, RYR1, SPTAN1, TTN). The variants in the GNE gene were most frequent (34.1%, 14/41), followed by variants in the FLNC (12.2%, 5/41) and DYSF genes (9.8%, 4/41), and TTN gene (7.3% each, 3/41). In one familial FLNC case, two affected relatives had independently been referred with diagnoses of HMSN and amyotrophic lateral sclerosis, respectively. This FLNC case was described in more detail in our earlier paper.
21
The reason for the initial interpretation as a neurogenic disorder in these patients remains unclear, but may reflect limited awareness of DMs. In the remaining affected relatives from this family, the diagnosis was established primarily on the basis of the family history.
Comparison of patient groups with different referral diagnosis
We compared Group 1 and Group 2 between each other by some clinical features, needle EMG and muscle MRI data (Figure 6). Clinical features selected for comparison included atrophy of the hand muscles, proximal and distal lower limb muscles, and separately atrophy of extensor digitorum brevis muscle (m.EDB), Manual Muscle Testing (MMT) scores for hand and thigh muscles (Figure 6(a)). Additionally, we compared the two groups regarding the proportion of cases with definite myogenic changes on EMG (Figure 6(b)). For muscle MRI, we compared the Gini coefficient of proximal versus distal lower limb muscles to assess selective involvement (Figure 6(c)). According to the analysis, the groups did not differ in selected clinical features or in the selectivity of muscle involvement. The only statistically significant difference between the groups was observed on needle EMG. In the group with a referring diagnosis of DM (84 patients), some patients showed a neurogenic pattern (8.3%, 6 of 72 patients in the Group 2 who had EMG data), whereas 55.0% patients from the first group (21 of 39 patients in the Group 1 who had EMG data) had non-myogenic (neurogenic or normal) findings on EMG (p Comparison of a group of patients with a discordant referral clinical diagnosis and a group of patients in which the referral diagnosis coincided with the molecular diagnosis. The results of the comparison of clinical characteristics (A), neurophysiological (B) and lower limb muscle MRI data (C). The values of the MRC scale were used to calculate the MMT score of the upper limb muscles (arm abduction, wrist flexion and wrist extension, forearms flexor and forearms extensor muscles), hand muscles (dorsal interossei and opponens pollicis muscles), and thigh muscles (thigh flexion, adduction and abduction, lower leg flexion and extension).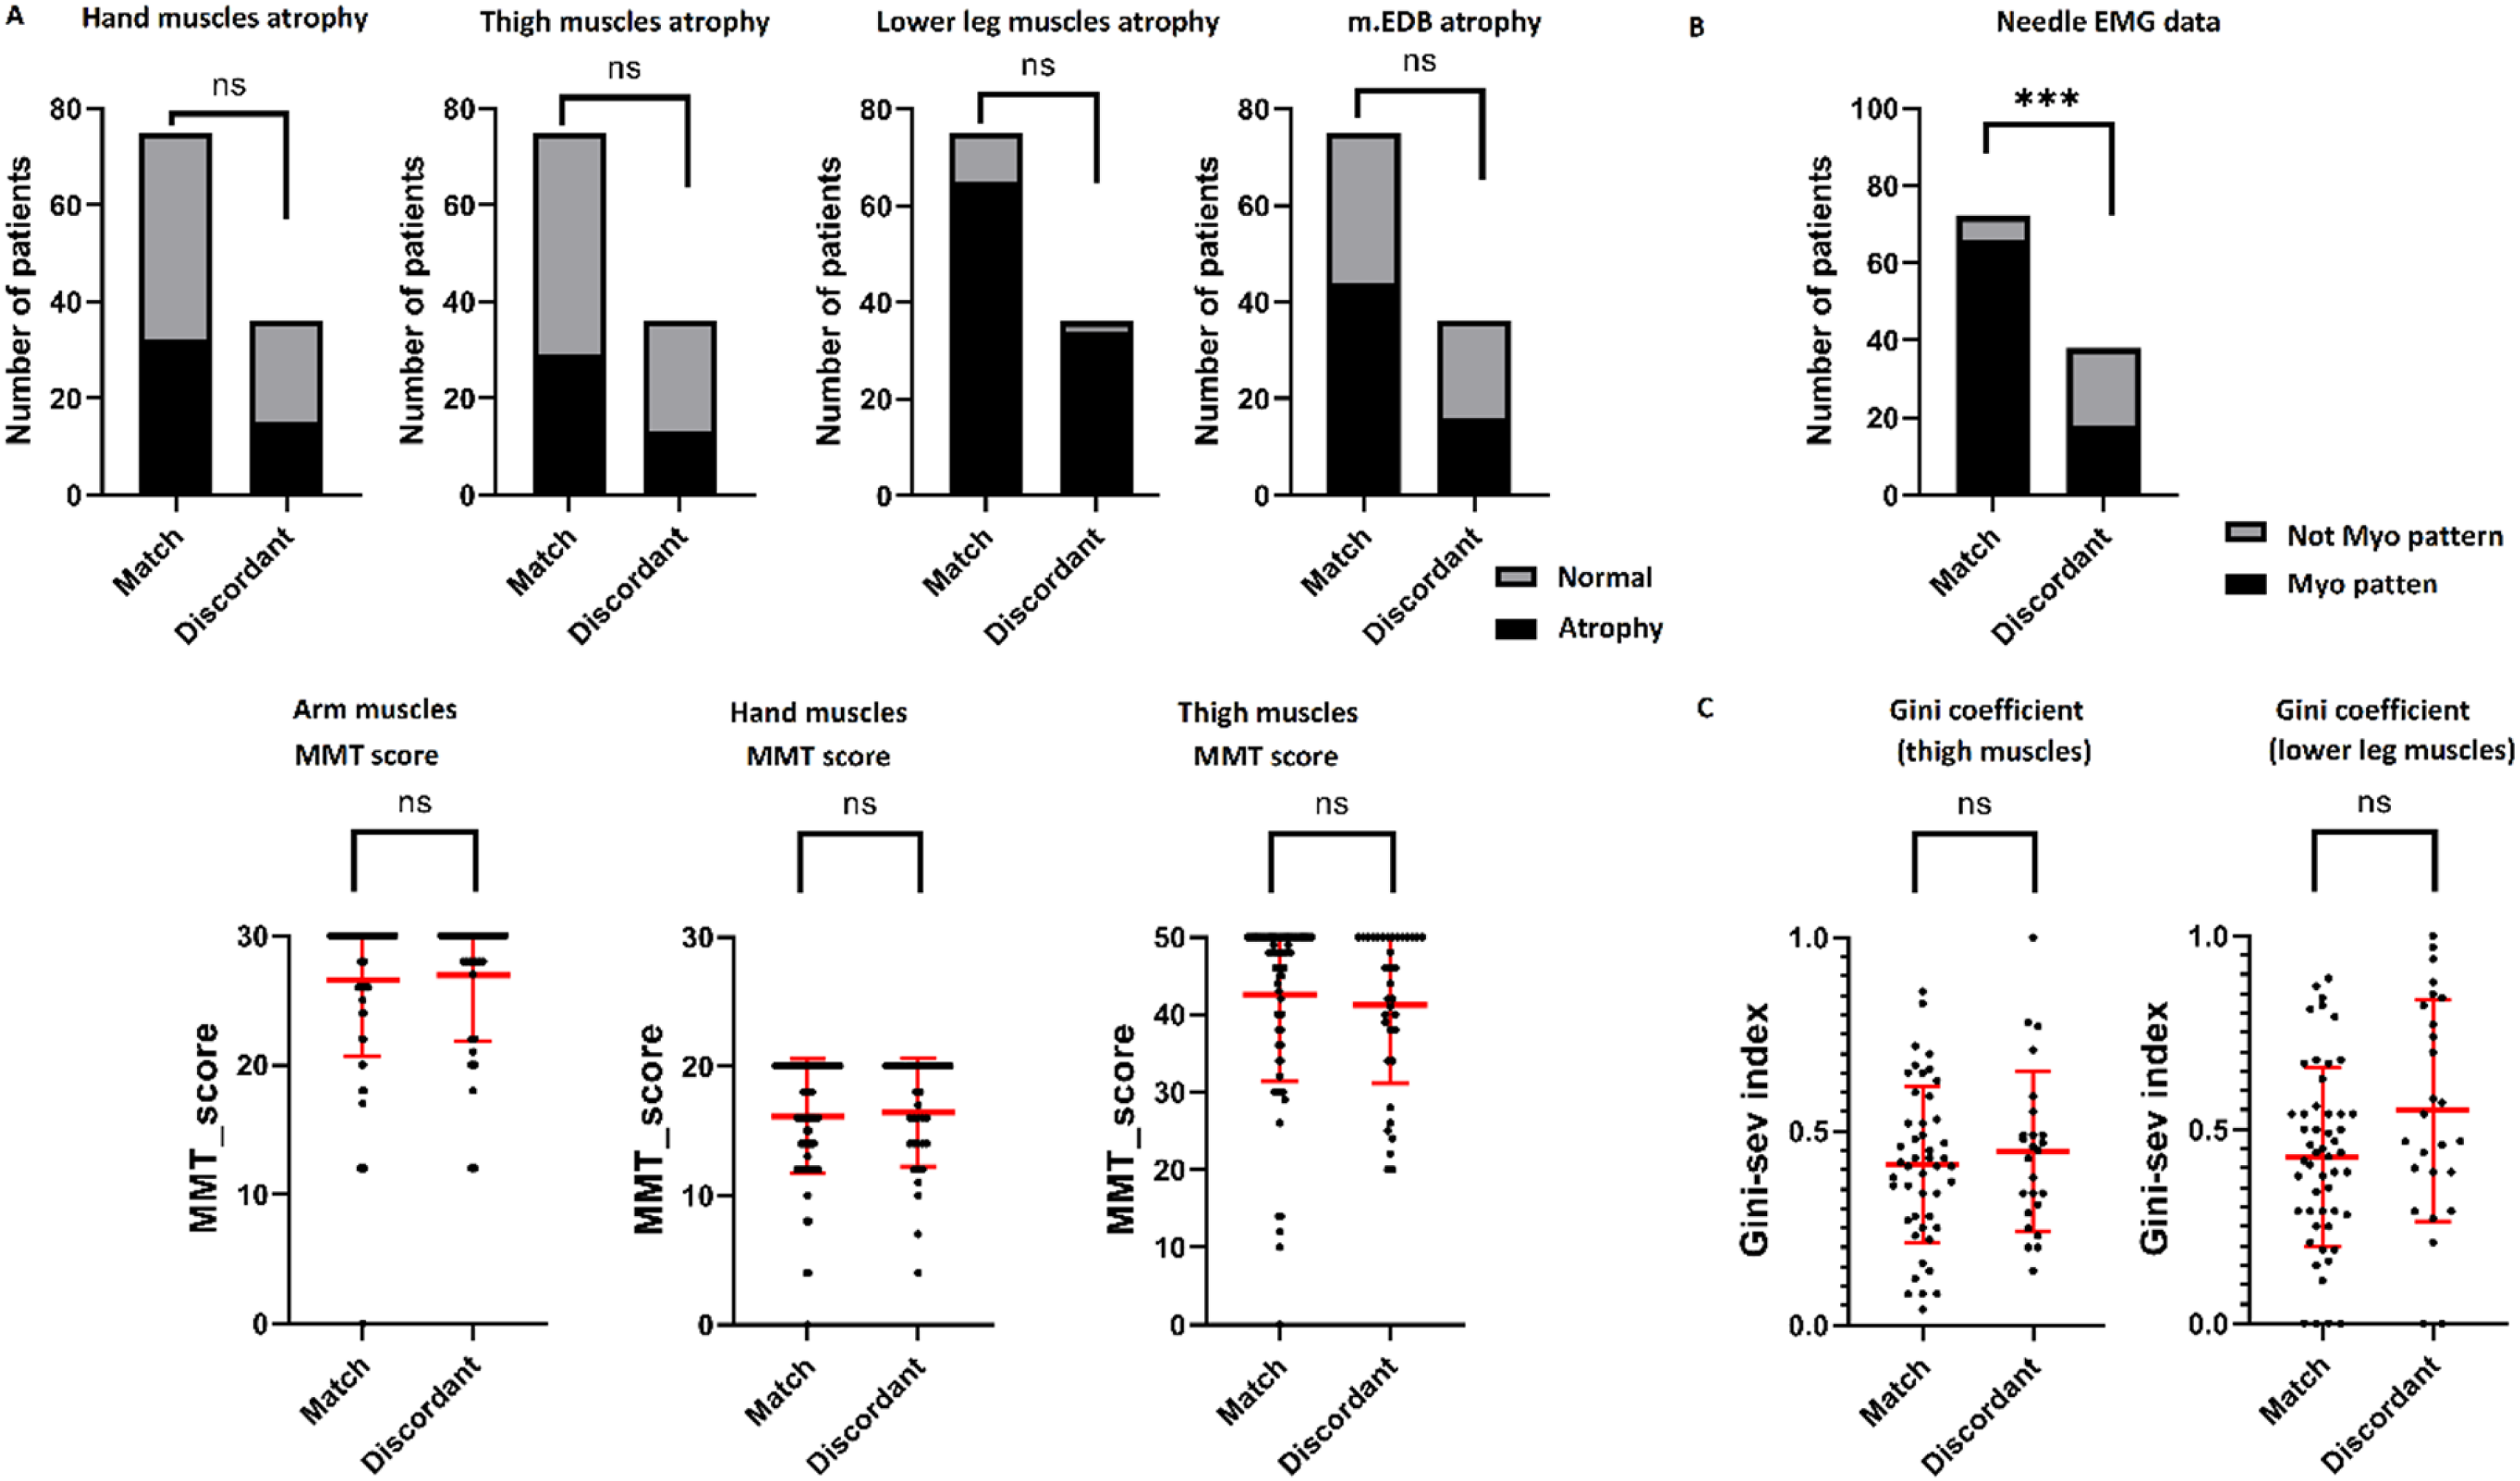
Discussion
DMs demonstrate significant genetic heterogeneity, as indicated by the wide spectrum of genes observed in our cohort and other large patient groups. While the predominant causative genes are largely consistent across published international cohorts, their relative distribution varies considerably. The most frequently implicated genes commonly include the MYH7, GNE, DYSF, TTN, and ANO5 genes.
In the largest Spanish single
In our cohort the distribution of causative genes was different. The most frequently implicated genes were GNE (n = 31/103 families, 30.1%), DYSF (n = 14/103 families, 13.6%), and TTN (n = 10/103 families, 9.7%). Notably, although pathogenic MYH7 variants are often among the most common in European cohorts, they were less frequent in our cohort, showing a prevalence similar to that of MATR3 and DES variants. This distribution may reflect regional clustering of pathogenic variants, particularly in autosomal recessive genes.
Disease phenotype evolution over time is an important consideration in clinical differential diagnosis. For example, in our cohort, a patient with FSHD type 1 was identified at an early stage of the disease, when only the lower leg muscles were involved. Although clinical examination revealed no asymmetry in leg muscle involvement, muscle MRI demonstrated clear asymmetric changes. Given the negative WGS result, this finding pointed toward a possible diagnosis of FSHD.23–25 Foot dorsiflexion weakness is a known initial symptom in late-onset FSHD cases and should be taken into account for the early diagnosis of FSHD.26,27
Surprisingly, within our DM cohort, we identified the patient harboring pathogenic variants in the CAPN3 gene typically associated with proximal muscular dystrophy. Although the patient presented with a clinically distal
The evidence linking 3 other genes (POLG, SPTAN1, and TCAP) to DM phenotype remains limited and is largely based on small series or single
Finally, COL6A
In clinical practice, patients with DMs may be initially referred with a diagnosis of neuropathy, even when EMG data are available.39–41 In our cohort, misinterpretation of EMG findings appears to be a major cause of referral for hereditary neuropathy for several reasons. Severe spontaneous activity was often misinterpreted as evidence of active denervation, leading to an initial diagnosis of neuropathy. However, such pathological spontaneous activity as fibrillation potentials and positive sharp waves, although usually associated with denervation, is not specific to denervation alone. In myopathies, these potentials reflect segmental necrosis and inflammation of muscle fibers, which disrupt their connection to the end
Different types of abnormal spontaneous activity, including myotonic and other discharges, are frequently reported as electrodiagnostic features in MFM cohorts and reviews.23,24 Nevertheless, severe spontaneous activity is not an obligate feature of MFM. In our cohort, genes within the MFM spectrum (DES, FLNC, and TTN) were represented across all grades of spontaneous activity (Figure 3(b)). Notably, MFM
Furthermore, high
A practical way to reduce EMG
In diagnostically challenging cases with discordant neurogenic and myopathic EMG findings, the possibility of coexisting two disorders cannot be entirely excluded. Nevertheless, no additional pathogenic, likely pathogenic variants or VUS were identified in other neuromuscular disease-associated genes, and no non-hereditary causes that could explain the EMG findings were detected. Furthermore, the clinical phenotype and muscle MRI findings were concordant with the final diagnosis.
Currently, lower limb muscles MRI plays a significant role in diagnosis of myopathies. In recent years, its value in distinguishing myopathic from neurogenic patterns and in identifying disease
Our study has several limitations. First, we included patients carrying VUS, since excluding these cases would have substantially reduced the cohort size and limited representation of the real-world diagnostic spectrum of hereditary myopathies. In many cases, segregation analysis and functional studies were unavailable, limiting variant reclassification according to ACMG criteria. Second, muscle biopsies, histological and immunohistochemical analyses, RNA studies, and protein-level assays such as Western blotting were not systematically available at our center and therefore were not performed for all patients. Nevertheless, we believe that the clinical significance of several candidate variants may be clarified in future studies.
Conclusion
This study represents the largest cohort of patients with DM reported from Russia, comprehensively characterized through clinical and instrumental assessments, including structured neurological examinations, analysis of MRI patterns and EMG findings. In DMs, misdiagnosis as neuropathy is prevalent and is largely driven by interpretative challenges associated with EMG data. Integrating MRI
Supplemental material
Supplemental material - Analysis of diagnostic pitfalls in 125 genetically confirmed cases of distal myopathies
Supplemental material for Analysis of diagnostic pitfalls in 125 genetically confirmed cases of distal myopathies by Dmitrii Subbotin, Artem Borovikov, Anna Kuchina, Inna Sharkova, Anastasia Vlasenko, Galina Rudenskaya, Sergey Nikitin, Olga Gilvanova, Daniil Degterev, Dmitry Druzhinin, Evgenia Druzhinina, Daria Grishina, Elena Dadali, Andrey Marakhonov, Polina Chausova, Sergei Fomenko, Oxana Ryzhkova, Olga Shchagina, Sergey Kutsev, Aysylu Murtazina in Journal of Neuromuscular Diseases
Footnotes
Acknowledgments
We thank the physicians who referred patients for DNA diagnostics: Oxana Angelcheva (Moscow), Inga Anisimova (Moscow), Sergey Bardakov (Saint Petersburg)Ludmila Bessonova (Moscow), Fatima Bostanova (Moscow), Darya Guseva (Moscow), Nina Demina (Moscow), Alana Khokhova (Vladikavkaz), Natalia Kuryakova (Moscow), Sabina Nagieva (Moscow), Eugenia Melnik (Moscow), Kamilla Mollaeva (Makhachkala), Elena Shestopalova (Moscow), Peter Sparber (Moscow), Maria Sumina (Ekaterinburg), Anait Voskanyan (Moscow).
Ethical considerations
The studies involving humans were approved by the Institutional Review Board of the Research Centre for Medical Genetics, Moscow, Russia (Protocol No. 7/2 dated 9 November 2020) The studies were conducted in accordance with the local legislation and institutional requirements.
Consent to participate
The participants provided their written informed consent to participate in this study.
Author contributions
Dmitrii Subbotin: Investigation, Data curation, Visualization, Writing – original draft; Artem Borovikov: Formal analysis, Writing – review and editing; Anna Kuchina: Resources, Investigation; Inna Sharkova: Resources, Investigation; Anastasia Vlasenko: Resources, Investigation; Galina Rudenskaya: Resources, Investigation; Sergey Nikitin: Resources, Investigation; Olga Gilvanova: Resources, Investigation; Daniil Degterev: Resources, Investigation; Dmitry Druzhinin: Resources, Investigation; Evgenia Druzhinina: Resources, Investigation; Daria Grishina: Resources, Investigation; Elena Dadali: Resources, Investigation; Andrey Marakhonov: Investigation, Formal analysis; Polina Chausova: Investigation; Sergei Fomenko: Investigation; Oxana Ryzhkova: Investigation; Olga Shchagina: Investigation; Sergey Kutsev: Supervision, Funding acquisition; Aysylu Murtazina: Supervision, Investigation, Writing – review and editing.
Funding
The authors disclosed receipt of the following financial support for the research, authorship, and/or publication of this article: This work was supported by the Ministry of Science and Higher Education of the Russian Federation (the Federal Scientific-technical program for genetic technologies development for 2019–2030, agreement No 075-15-2025-481).
Declaration of conflicting interests
Authors declared no potential conflicts of interest with respect to the research, authorship, and/or publication of this article.
Data Availability Statement
The data to support the findings of this study are available upon request from the corresponding author.
Supplemental material
Supplemental material for this article is available online.
References
Supplementary Material
Please find the following supplemental material available below.
For Open Access articles published under a Creative Commons License, all supplemental material carries the same license as the article it is associated with.
For non-Open Access articles published, all supplemental material carries a non-exclusive license, and permission requests for re-use of supplemental material or any part of supplemental material shall be sent directly to the copyright owner as specified in the copyright notice associated with the article.