
Abstract
Measures of democracy are regularly employed in the statistical analysis of economic, political, and social policy. This paper reviews the measures" setup, strength, and weaknesses across the three most prominent democracy datasets: PolityIV, Freedom House, and Varieties of Democracy. The measures developed by the Varieties of Democracy project outperform Polity2 and Freedom House Index with respect to the underlying definition and measurement scale, as well as the theoretical justification of the aggregation procedure. The three indices display a high level of agreement for those observations included in all three datasets. The most substantial differences between the indices lie in the indices’ coverage, i.e. in their non-missing observations (in Polity2 coding, for example, years during which a country is occupied by foreign powers constitute missing values), the availability of disaggregate data and the above mentioned key areas. This paper clarifies when to proceed with caution, but for the most part advocates the use of Varieties of Democracy in the statistical analysis of democracy.
Introduction
The characteristics of a country’s system of governance are essential for the understanding of basic questions in political science and economics. 1 Over the past thirty years systems of governance have been measured in several different ways. Numerous studies have demonstrated that the results vary with the index used. 2 Hence, it is of utmost importance to understand the specific setup of the existing indices before deciding which index to use. This paper facilitates the decision of which index to use when by examining the three most commonly used democracy datasets: The PolityIV, Freedom House, and Varieties of Democracy (V-Dem) data. The measures developed by the V-Dem project outperform Polity2 and Freedom House Index (FHI) with respect to the underlying definition and measurement scale as well as the theoretical justification of the aggregation procedure. This article illustrates under which circumstances the three democracy measures code countries dis-/similarly and points out those frameworks under which certain measures can/should not be employed.
The question of how to correctly quantify a state’s system of governance for statistical analyses has been a highly contested subject in applied political and economic research. 3 The discussion in today’s literature evolves around three central questions. 4
Definition: along which components should a system of governance be defined?
Measurement: how to quantify these components?
Aggregation: how to combine them into a single index of democracy?
There is no consensus in the current literature on any of these questions. Due to the multifaceted nature of the concepts “system of governance” or “democracy”, a one-size-fits-all answer to the first question is unlikely to exist. 5 The characteristics of a system of governance relevant for a study vary with the research question at hand. This has led to the creation of numerous distinct democracy indices. 6 Most of the democracy indices used in the empirical literature rely on different definitions of democracy. They capture different aspects of a state’s authority and decision-finding structure. Several papers exist examining the strengths and weaknesses of democracy measures. 7
The suitability 8 of a democracy measure for a given statistical application depends on the research framework. However, its internal validity and reliability can be examined independently. The question “does the democracy measure capture what it is supposed to?” is generally referred to as the concept of validity. Note that the “what it is supposed to measure” part varies with the underlying definition of each democracy measure. “How well/how precisely does the democracy index measure what it is supposed to?” on the other hand refers to an index’s reliability. 9 The two concepts are, by definition, highly interlaced. So, how to assess and compare the validity and the reliability of existing democracy measures? Both validity and reliability depend on the underlying definition and measurement level as well as the data collection and aggregation procedure. Consequently, these are the central quality criteria this paper will examine for Polity2 and FHI as well as for the V-Dem indices, in particular for their Electoral Democracy index, Polyarchy. Evaluating its implicit assumptions and definitions as well as their implications for statistical analyses is crucial for choosing an appropriate democracy measure. To understand the conceptual differences underlying the definition and setup of the democracy measures, each of the three central questions stated above will be briefly summarized in the remainder of this section.
Definition of democracy
In current debates on measures quantifying systems of governance (“democracy indices”), it has become the norm to use the term “democracy” pars pro toto, i.e. synonymously to “system of governance”. This paper follows this convention. Nevertheless, from a theoretical point of view it is important to acknowledge that the democracy indices are in fact measuring observed levels of authority patterns or systems of governance. The word “observed” is key here: following Dahl (1971), Goertz (2006), and Treier and Jackman (2008), this paper distinguishes between the concept of democracy as a theoretical construct and its actual observable manifestations, i.e. democracy is viewed as a latent, continuous quantity. A democracy measure’s validity therefore can be thought of in terms of concept-measure consistency. To obtain a valid measure of democracy, the well-defined concept should drive the methodology. 10 A consequence of this latency is the uncertainty/noise in the coding of the empirical measures. 11 In addition to noise in the measures coding due to the latency of democracy several studies, such as Bollen (1993), Bollen and Paxton (2000), or Elff and Ziaja (2018), show that method factors (i.e. coder-specific systematic biases in each dataset) can provide further sources of uncertainty in democracy measures. To avoid false inference, a precise definition of the concept of democracy 12 guiding the methodological construction of the empirical index is essential. Following Goertz (2006) and Dahl (1971) perfect democracy and autocracy can be thought of as the poles between which a continuum of polyarchies/authority patterns/systems of governance unfolds.
Even on a conceptual level the question of how to conceptualize a system of governance is an entire field of research.
13
Schumpeter’s minimalist definition
14
captures the core trait of an institutional definition of democracy:
The central criticism of this minimalist institutional definition is that by acknowledging only the electoral dimension other defining components of democracy are ignored.
16
Instead of defining democracy institutionally Dahl (1971) goes back to the word’s Greek origin.
17
He takes a substantive approach and views
On a conceptual level, a distinction between de facto and de jure attributes of a polity can be made. This paper regards the formal institutional setup of a polity as its de jure framework. Observable policy outcomes, on the other hand, constitute de facto elements. This concept of de facto encompasses the way the institutions operate in practice as well as the performance and practices generated by the actors in the system. 20 Political violence carried out by non-governmental actors for example, can be a byproduct of the “institutional output” unintended by the system’s setup and consequently can be part of the de facto reality.
Lastly, it is not enough to identify components to include in a definition of democracy. The theoretical relations of these components with each other need to be taken into account. Only once a logical structure between these elements is established can they be aggregated into a measure of democracy in a meaningful way. 21 Not ordering the elements vertically by their level of abstraction gives rise to problems of redundancy and conflation (joining elements which are symptoms of distinct overarching attributes). 22
Measurement scale of the democracy measure
The question of how to quantify the components and on what kind of scale to map the empirical distribution of cases should also be determined by the concept behind the measure. Most polychotomous democracy indices, such as Polity2 or FHI, are coded on a nominal or ordinal scale. However, in empirical research these indices are often treated as if they were coded on an interval scale, even though there is no numerical relationship between the categories. Doing so implies that the differences between the values have a meaningful interpretation. This is a major point of criticism of several of the polychotomous indices. 23 While the definition and aggregation procedure of the V-Dem democracy indices 24 permits using them as quasi continuous measures, this is not the case for Polity2 and FHI. Polity2 is defined on a scale that is not even ordinal, 25 and differences between categories have no meaningful interpretation. One specific FHI score can be the result of a variety of different underlying factors. The FHI aggregation procedure using equal weighing and collapsing further contributes to its final measurement scale at best being ordinal.
Concept-measure consistency is also essential in terms of the scale’s end points. Whether a democracy index can take on top or bottom values should be determined by whether the concept of democracy allows for perfect democracy and autocracy endpoints. Assuming a continuous concept, the ends of the conceptual scale can be thought of as unreachable poles (one can get infinitely close to but never reach them). Fixed endpoints imply that one believes in a state of perfect autocracy/democracy. From the empirical point of view there is a disadvantage to attainable top and bottom values which becomes obvious with long time series. For example, the increased number of democracies in the system of states after the end of the Cold War made it impossible to examine “the societal dynamics associated with the consolidation and maintenance of democratic authority patterns” 26 within these states using the Polity Coding scheme.
Collection, aggregation, and weighting of components
The question of how to adequately collect, weigh, and aggregate components has been subject to much debate. 27 The most important discussion points are displayed in Table 1. The validity and reliability of a measure increase the more adequately these points are adressed.
The principles of aggregation.
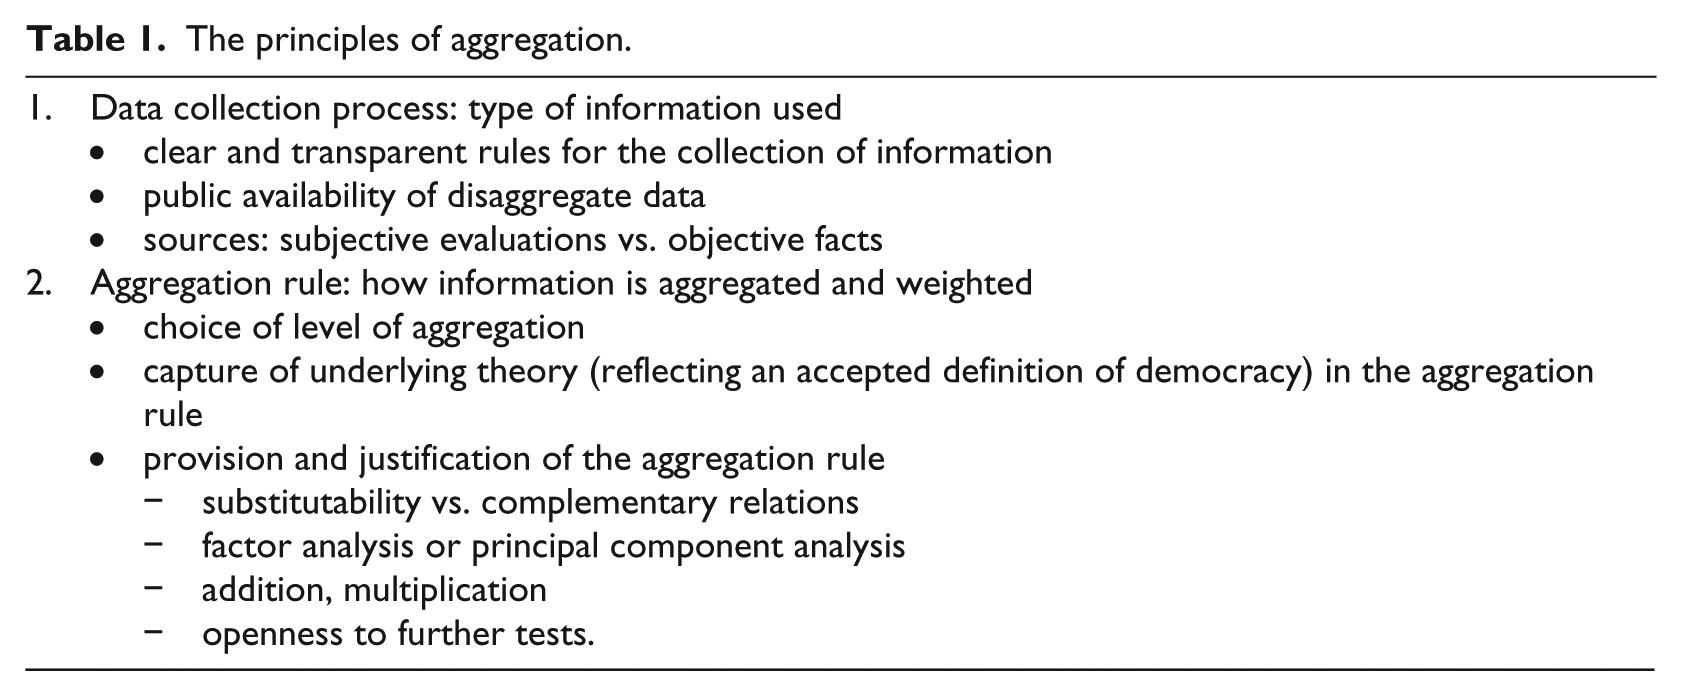
The first principle of aggregation acknowledges the fact that the type of information captured in the disaggregated data is essential. 28 Several democracy measures are based on components coded using subjective inferences “and perhaps even guesses” (Cheibub et al., 2010: 77). Including of subjective evaluations reduces replicability and increases measurement error, but due to democracy being a social construct a limitation to formal (and better quantifiable) indicators leads to lower validity. 29 Replicability is a key feature for a useful democracy measure. Hence, clear and transparent rules for the information collection process and public availability of disaggregate data should be considered crucial. 30 This point has not been adequately addressed by many of the existing indices, e.g. FHI, and consequently has been frequently criticized. 31
The second principle of aggregation concerns the aggregation rule, i.e. how the disaggregate information is weighted and aggregated. First, a suitable level of aggregation should be determined. 32 While a high level of aggregation (aggregating all components and indicators into one democracy index) is appealing for the use of a democracy index in empirical calculations, it also entails loss of complexity, information, and validity. 33 Second, the underlying theory (reflecting an accepted definition of democracy) 34 should be captured in the aggregation rule. 35 Third, to increase replicability the aggregation rule should be provided and justified. 36 This entails, for example, a justification of choice of relation between the components: are they substitutes or complements? A non-arbritrary aggregation rule justifies its use of addition or multiplication of components or even the use of factor or principal component analyses. And, last but not least, it is open to further examination. 37
Democracy as a political concept is inherently difficult to define and to capture in a quantitative way. Yet this paper demonstrates that the V-Dem project succeeded in constructing quantitative measures excelling in the key areas mentioned above. The goal of this paper is thus to provide a thorough overview of relevant issues to consider when choosing a democracy measure for a statistical application. It seeks to give the reader an understanding of the differences, weaknesses, and strengths of the three democracy datasets.
Democracy indices
The number of existing democracy indices is too vast to give a detailed overview in one paper. 38 Some indices, such as the ones (or those) offered by V-Dem, are available in country–event format. For the sake of increased comparability among indices and the usability in classic time-series cross-country studies this paper focuses on data in country–year format. Table 2 summarizes the three main democracy measures discussed in this section. It displays the measurement scale, the democracy definition, the measure’s temporal and geographical scope, its range, aggregation rule as well as its strengths and weaknesses.
Overview of the democracy measures analyzed in this paper.
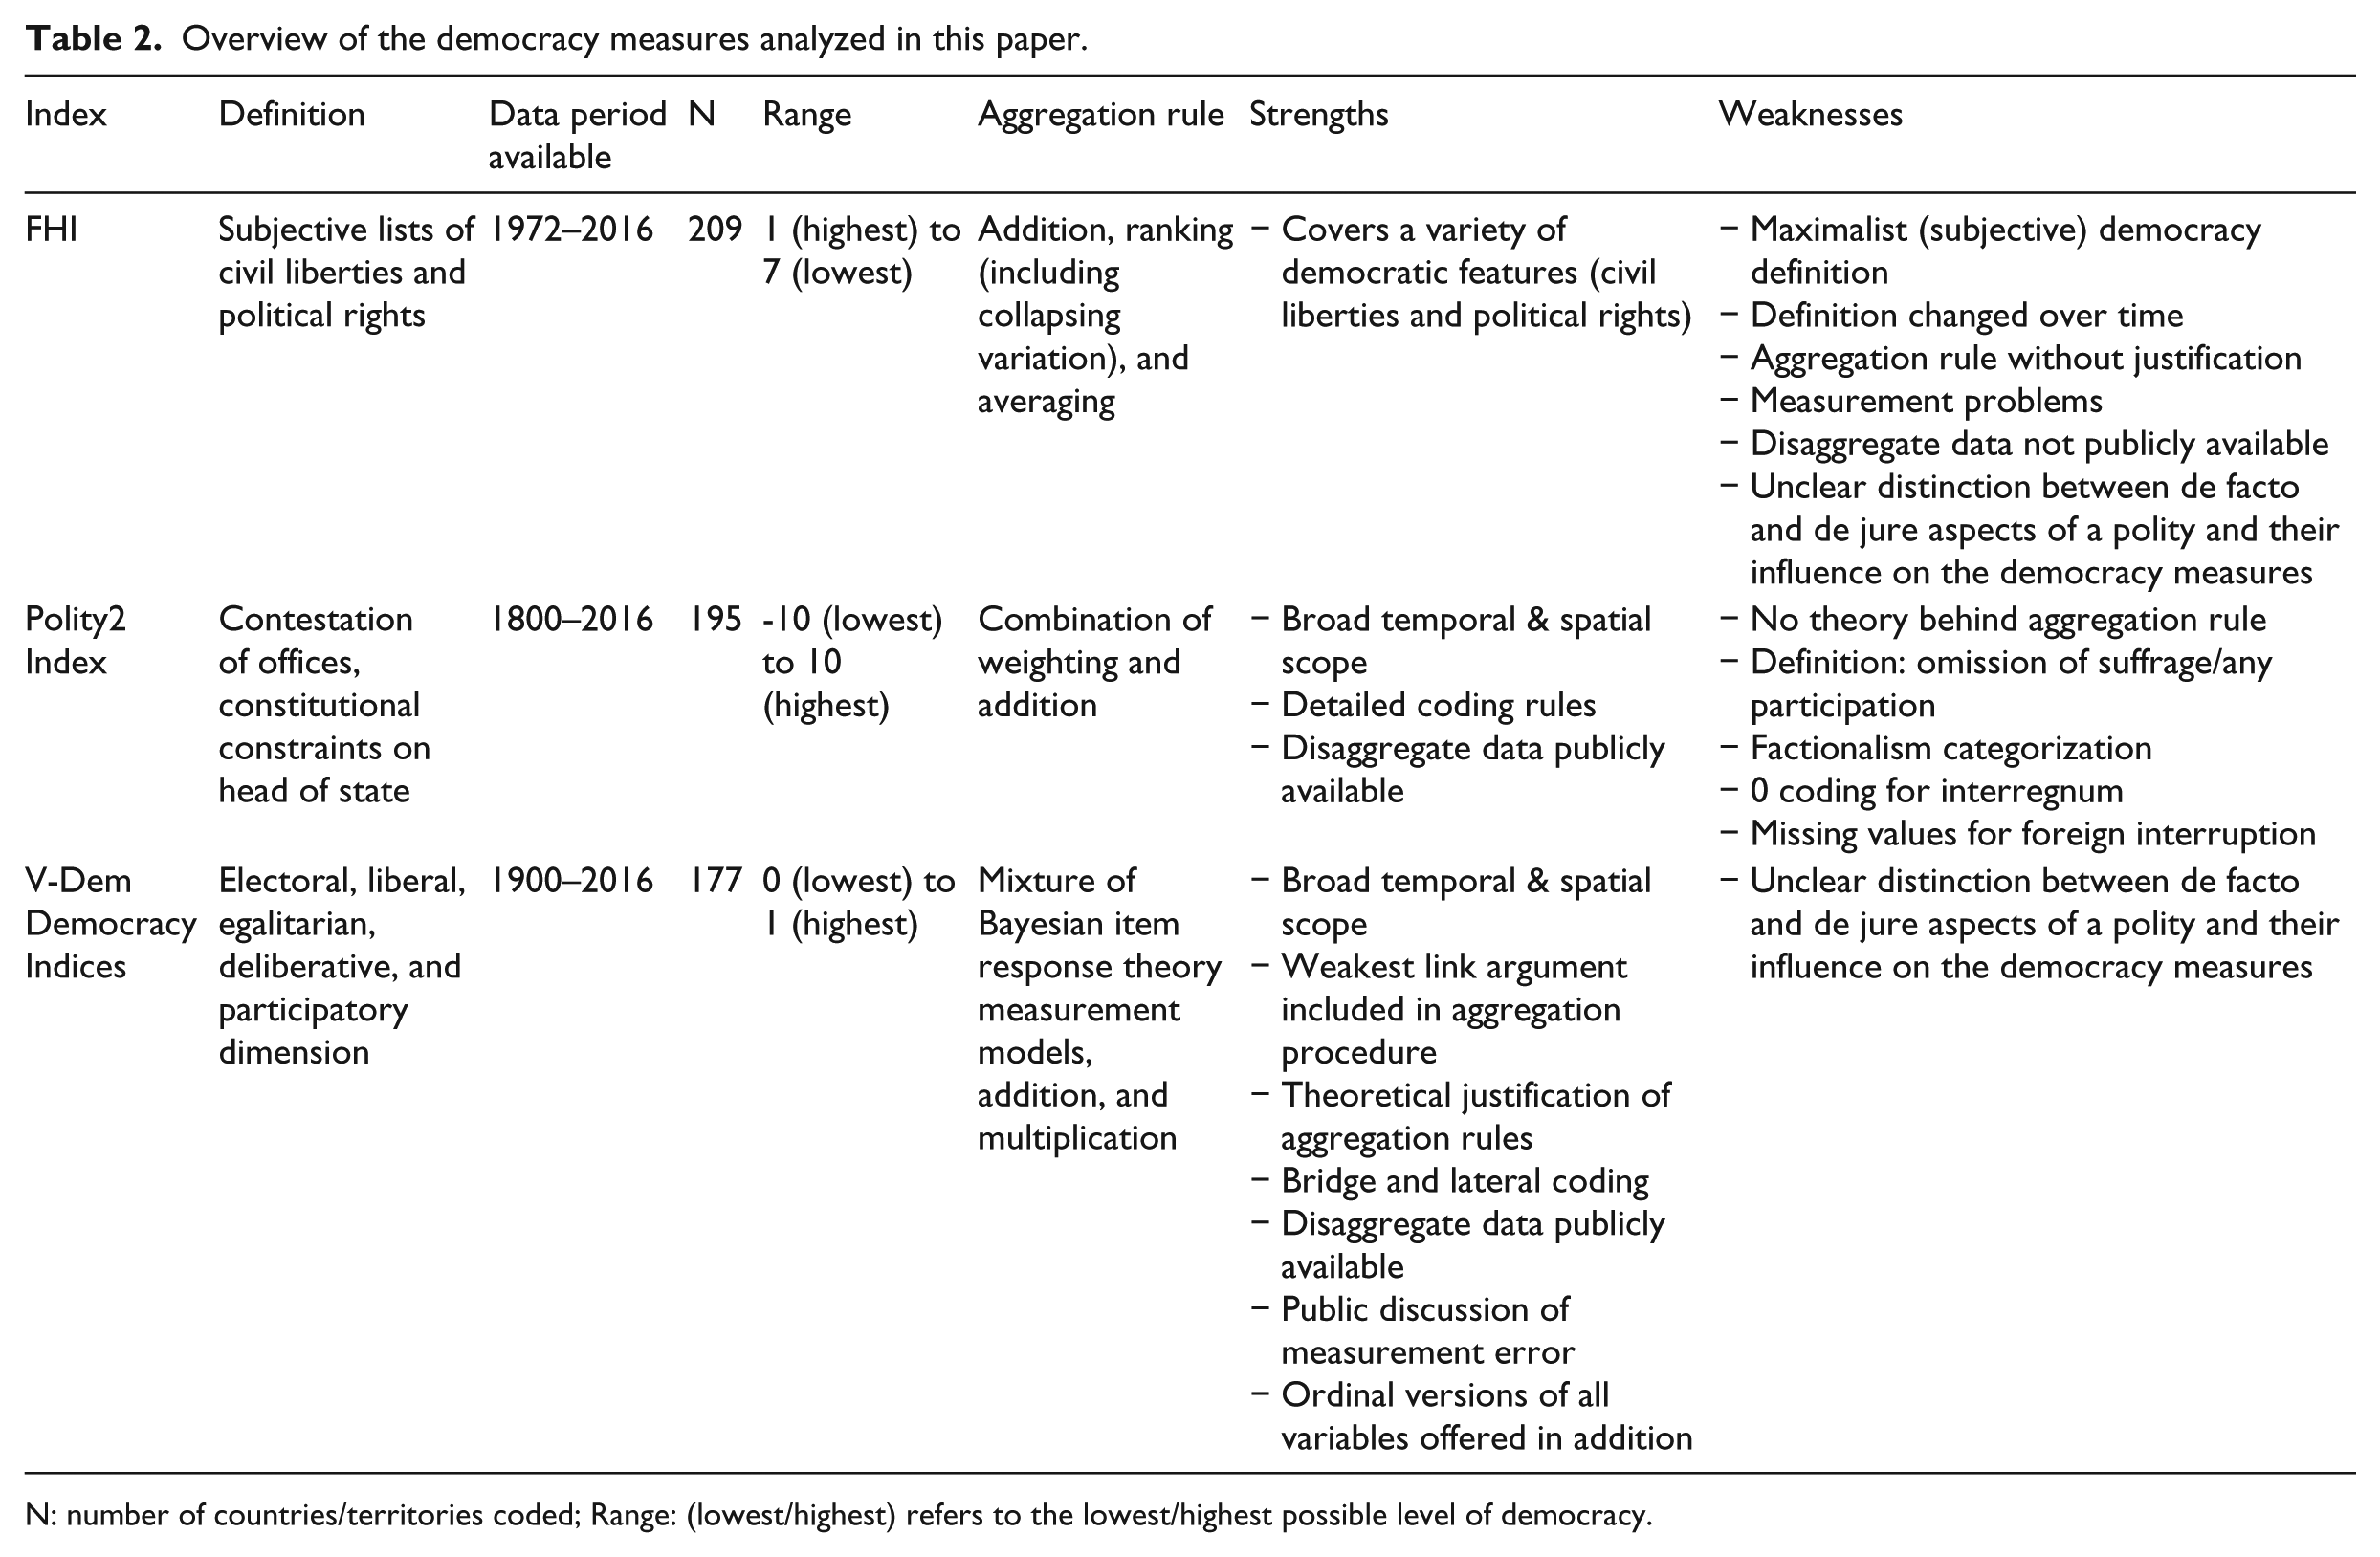
N: number of countries/territories coded; Range: (lowest/highest) refers to the lowest/highest possible level of democracy.
Polity index
Due to its broad chronological (1800–2016) and geographical scope (195 countries) the Polity index is one of the most frequently used democracy indices in current research. When it was first introduced in 1975 it constituted one of the first major attempts to quantify authority patterns on a global scale over an extended period of time. These first codings were based on the detailed theories of authority patterns put forward by Eckstein (1973) and Gurr (1974). The first Polity data was coded with the explicit objective of answering the question whether “the durability (persistence and adaptability) of political systems depends at all upon the nature of their structures of political authority”. 39 Said structures of political authority, i.e. the institutional framework, therefore form the core of the Polity index.
Today the data is assembled by researchers from the Polity IV Project 40 at the Center for Systemic Peace. The most recent version of data available is the Polity IV Dataset Version 2016, Marshall et al. (2017b). 41
The Polity index ranges from −10 (strongly autocratic) to 10 (strongly democratic) and is calculated by subtracting a measure of autocracy (Autoc) from a measure of institutionalized democracy (Democ):
Components of the Polity index and the democratic concepts they capture.
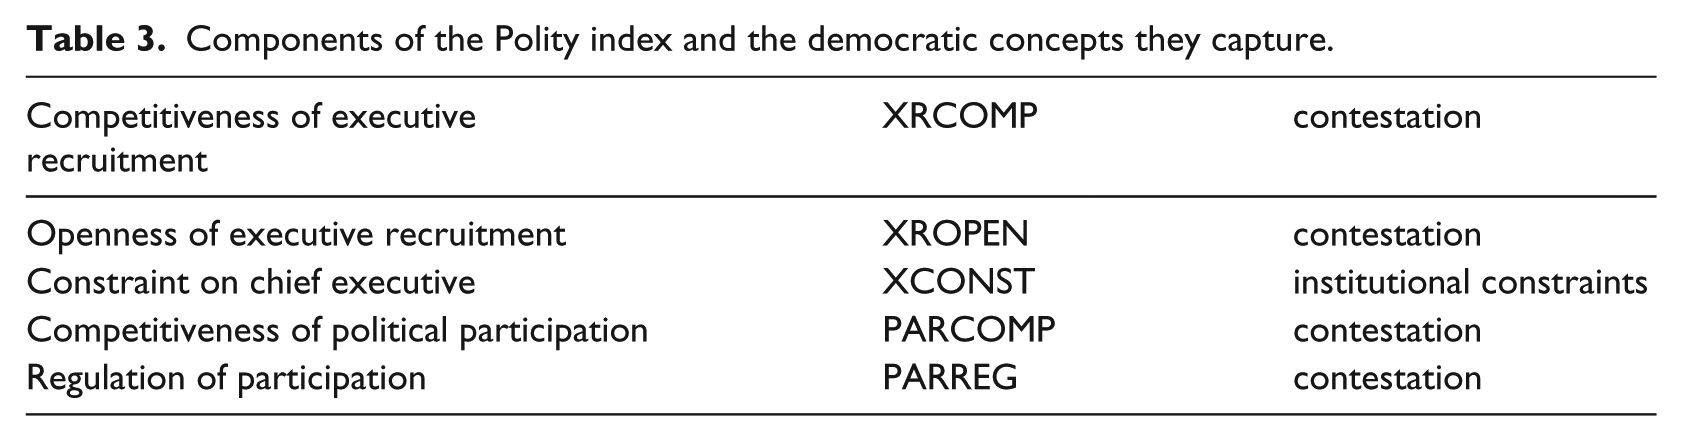
Note that these components capture the people’s participation only with respect to participation in the political process, but no suffrage requirement is included. Hence “participation” as used by the Polity Project is not equal to the use of the term in the debates on measuring democracy. Rather, the participation components evaluate the extent to which oppositional political activity is possible and regulated. The Polity index is in fact a measure of political contestation rather than democracy—even if one embraces the minimalist democracy definition with contestation and participation. 47
Table 4 depicts the aggregation rule of Polity and the weighing scheme for Democ and Autoc. A country–year receives a score (scale weight) for each component. The points scored for Autoc are subtracted from the Democ index to obtain the Polity index. Aside from a vague theory (explaining the “logic of institutionalized democracy and autocracy”, Marshall et al. (2017a: 15–16)), there is no justification given for the weighting and aggregation rule. Each of the component variables (XRCOMP, XROPEN, XCONST, PARCOMP, PARREG) is coded using three or more categories. However, not all of the categories are taken into account when calculating the democ/autoc and consequently the Polity index. In a thorough examination of the Polity aggregation procedure Goertz (2006) shows that the Polity index suffers from concept-measure inconsistency, i.e. the measure does not capture the underlying concept of democracy very well.
Aggregation rule of the Polity index.
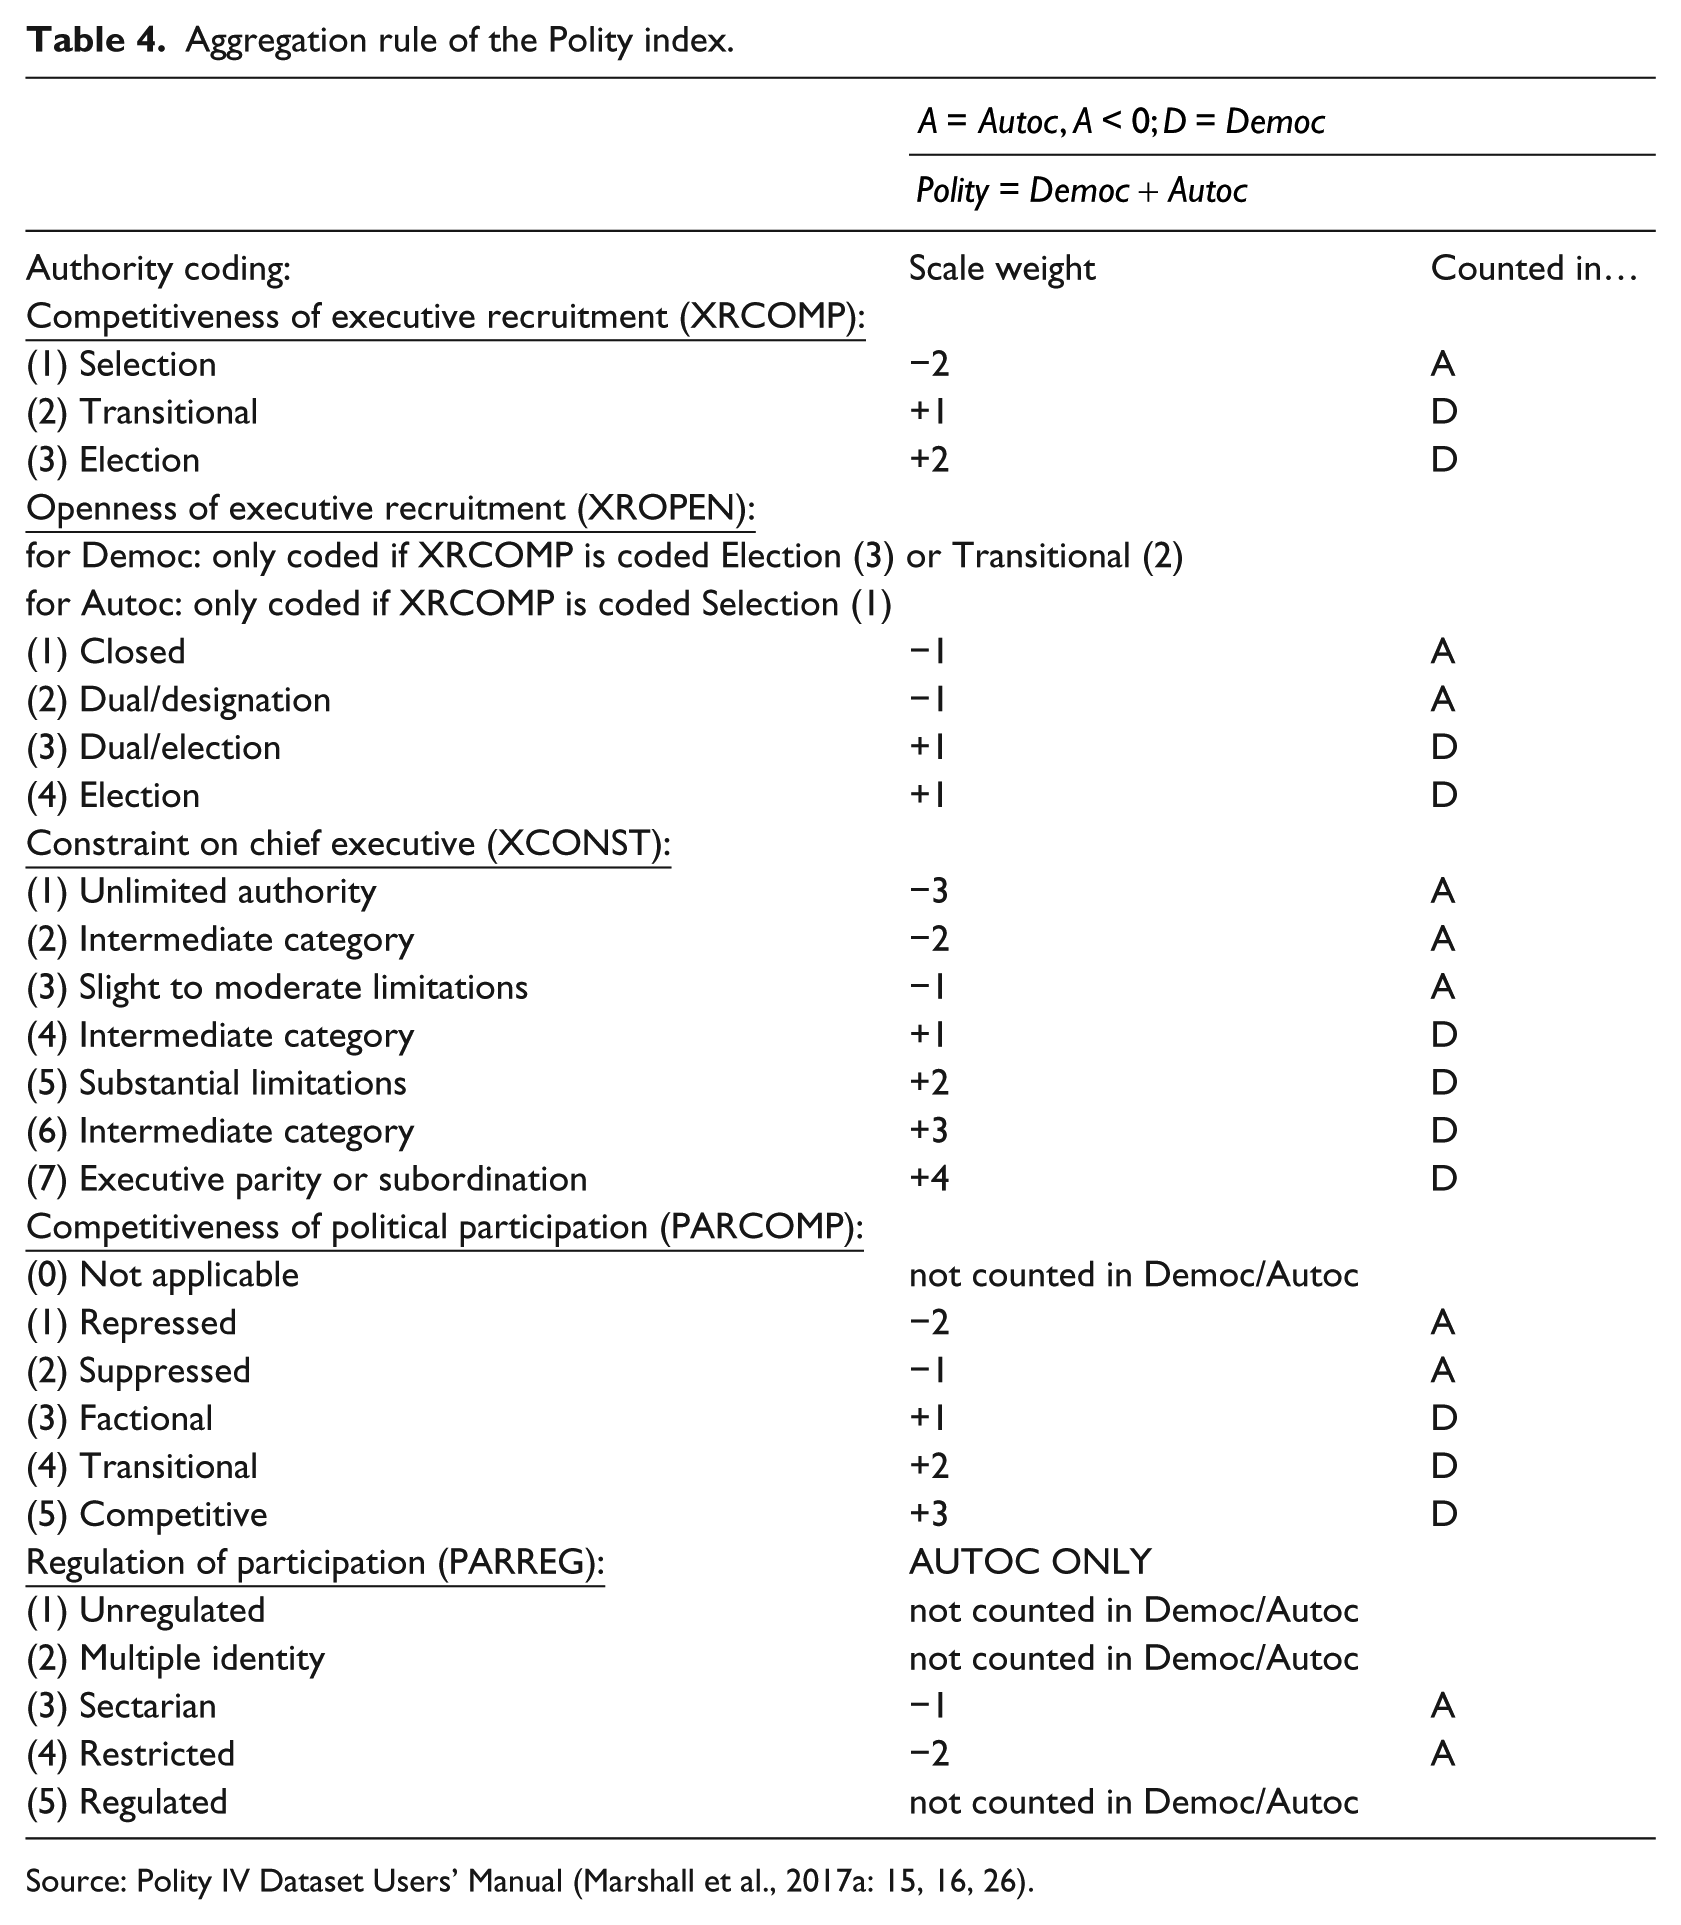
Source: Polity IV Dataset Users’ Manual (Marshall et al., 2017a: 15, 16, 26).
Since the idea behind Polity was to quantify institutional frameworks, it reached the limits of its domain in cases where there was no regular institutional setup. Years in which a country’s central political authority is collapsed are considered as an interregnum period and coded “−77” on Democ, Autoc, and Polity. Years in which central authority is taken over by foreign powers are considered interruption periods and coded “−66” for each index. During transition periods in which “new institutions are planned, legally constituted, and put into effect”, 48 the indices receive a “−88” coding. Of 17,228 observations in the Dataset Version 2016, this is the case for 772 observations, i.e. around 4.5% of the observations. These three categories limit the use of the Polity index in empirical research. To integrate these cases into the Polity scheme and make them accessible for quantitative studies, the Polity IV Project introduced Polity2. It is defined as follows:
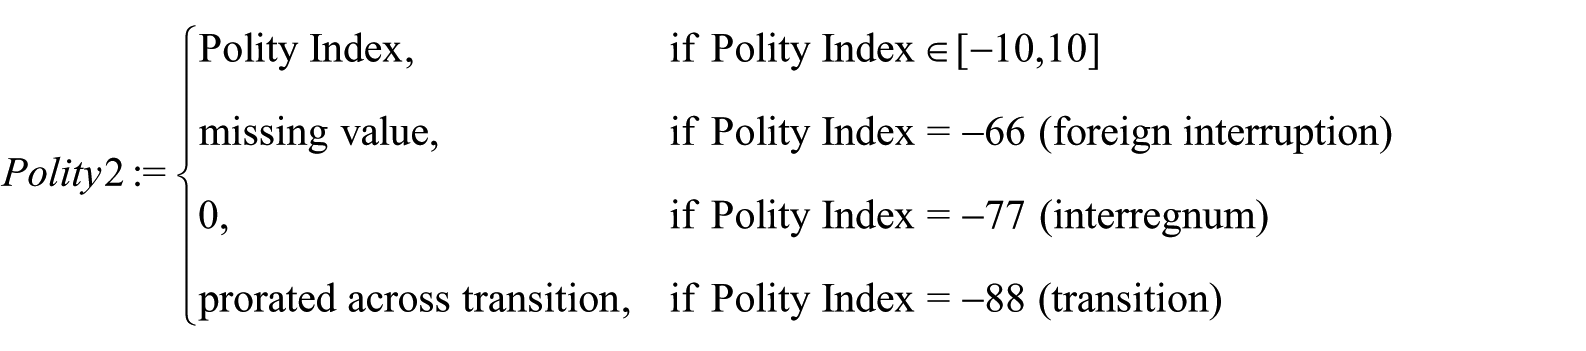
Even though this definition enables the inclusion of transition and interregnum cases in time-series and cross-section models, it creates a range of problems. First, the foreign interruption observations are still missing. In the Dataset Version 2016 there are 233 such cases, i.e. 1.3% of all observations. Depending on the goals of the research at hand, especially when examining democratic transtitions/autocratic backsliding or democracy and civil conflict, these missing cases are of particular interest. Second, a Polity2 value of “0” can occur in three different cases. 49 The most intuitive one is if a country’s Autoc score equals its Democ score, as it does, for example, in the case of Albania in 1996. The second reason why a country might be assigned a Polity2 value of “0” in a given year is a transition period. If a country is undergoing such a transition, its Polity2 value is pro-rated across the time span of the transition. For example, if it has a transition year in 1990 and index values of “−2” in 1989 and “2” in 1991, then 1990 will be assigned a “0”. Both of these codings are still somewhat suitable for empirical research since the differences between the Polity2 values remain meaningful. However, this is not true for the third case in which a country might be assigned a value of “0”. In years in which a total collapse of central political authority occurs the country is assigned a Polity2 value of “0”. The civil war in Afghanistan, 1992–1995, is an example of such a case of “anarchy”. The meaning behind this particular “0” is rather different from the others and it renders differences between Polity2 values impossible to interpret. This “0-coding” hence affects the measurement scale: Polity2 is coded on a nominal (not even an ordinal!) scale limiting the usability of Polity2 in econometric models (at least if the “0-coding” is maintained).
In the Polity III Data (a predecessor of the Polity IV Dataset) some categories of the components on competition (PARCOMP) and regulation of political participation (PARREG) were defined with explicit reference to conflict. 50 Hence, countries experiencing severe civil conflict were highly unlikely to be classified as high/low democracies. Rather, they were categorized as semi-democracies/anocracies, leading to a number of studies 51 examining why semi-democracies seemed to be more prone to conflict than “pure” democracies/autocracies. Being aware of this point of criticism, the Polity IV Project removed the explicit references from the definitions of the components. 52 However, even though the categories no longer include the explicit reference, they still capture the concept of a country undergoing conflict. 53 Due to the categorization of interregnum, interruption, and transitions as described above, and this coding problematic, the aggregate Polity2 should not be used in research on civil conflict.
One of the strongest advantages of the Polity IV Dataset is the availability of the disaggregate data. 54 This enables the breakdown of Polity2 into its components. Once the issues mentioned above (factionalism, missing interruption values etc.) are adequately adressed, the components can be reassembled to form a measure of political contestation that (while still not continuous) can be employed in certain empirical models.
Freedom House
Freedom House is a United States (US)-based non-governmental organization dedicated to the promotion of freedom and democracy worldwide. Founded in 1941 in the midst of World War II, it has significantly amplified its sphere of operation and influence with the publication of annual “Freedom in the World” reports since 1973. The reports are based on annual surveys of global political rights and civil liberties. The survey data is available for 209 countries and territories from 1972 to 2016. With 209 countries covered, FHI is the most inclusive of the three measures studied. The first reports and ratings were single-authored by Raymond Gastil, who argued in Inkeles (1991): “By working alone the author has not had to integrate the judgments of a variety of people. The hunches and impressions that are so important in a survey of this kind would be almost impossible to keep on the same wave lengths if one had an Asianist, Africanist, and Latin Americanist to satisfy before the ratings were finalized for each year”. 55 While today the reports are produced by a team of “external analysts”, 56 the checklist question framework introduced by Gastil and its inherent subjectivity remains. FHI is not built upon any theoretical concept of democracy or freedom; rather, it is a country comparison of an undefined concept of “freedom” based upon said “hunches and impressions”. Bush (2017) shows that these impressions correspond to a large degree to the US elite’s perception of other countries’ systems of governance and hence proposes taking FHI as a measure of such. 57 The remainder of this section will further illustrate this by providing a short overview of the components and aggregation procedure as well as the most prominent points of criticism. 58
The Freedom in the World Index (FHI) evaluates the freedom concept along two dimensions: freedom of political rights and civil liberties. It is assembled in three steps. First, the Freedom House coders award points/scores from 0 (smallest) to 4 (greatest degree of freedom) to 27 questions. Twelve of these questions regard the political rights dimension, while the remaining 15 questions address the implementation of civil liberties. 59 Instead of five clear-cut possible answer categories (0–4 points) for each of these questions, a number of subquestions are given to clarify the concept. The disaggregate data is not publicly available; hence there is no way of knowing or replicating how a country achieved a certain score or of testing the implications of the aggregation rule. 60
In a second step, depending on the sum of scores obtained in the political rights and civil liberties components, a rating is assigned. The score to rating conversion for both components is presented in Table 5 for the political rights index. 61 The conversion for Civil Liberties is carried out analogously. It is worth noting that (due to the high number of possible ways of obtaining a certain score rating) each of the seven categories captures numerous countries with very distinct political rights and civil liberties.
Score to rating conversion for FHI’s political rights index.
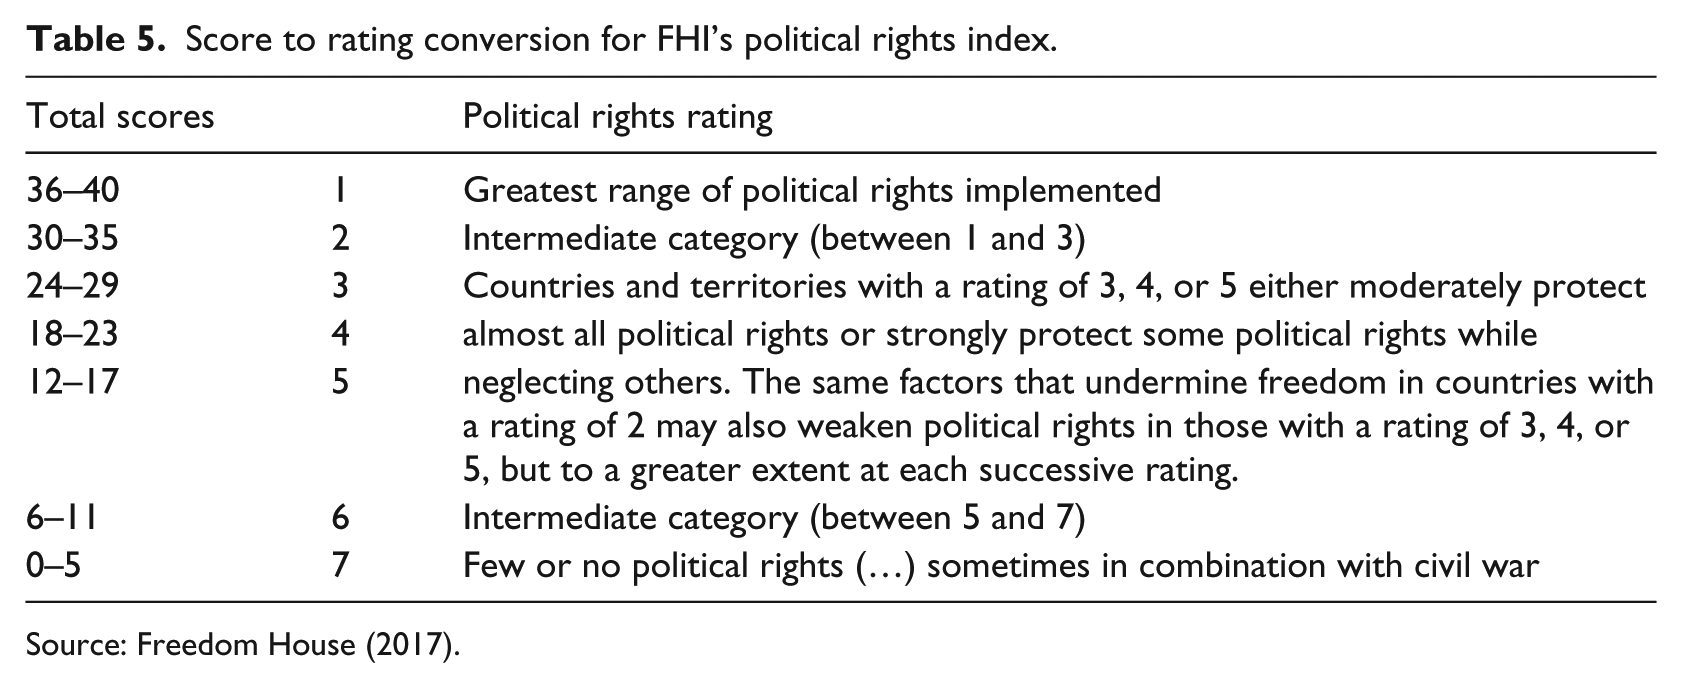
Source: Freedom House (2017).
In a third step, the political rights and civil liberties ratings are averaged to form the freedom rating. It ranges between 1 and 7. This rating is used to categorize the countries into three groups: Free (rating between 1 and 2.5), Partly Free (rating between 3 and 5), and Not Free (rating between 5 and 7). As mentioned above, each of the seven categories contains a wide range of countries with politically very different environments. Further categorizing them into three groups inherently continues to disguise this variation. 62
One of the most criticized aspects of the Freedom House data is the compilation of components by means of checklist questions without a theoretical justification. This is problematic in several ways: first, the components are not ordered by level of abstraction and the relationship between the components is not considered. This gives rise to the problem of conflation 63 as criticised by Munck and Verkuilen (2002: 14); Coppedge et al. (2011) rightfully observe that “the high inter-correlations of the Freedom House indicators coupled with their ambiguous coding procedures suggest that these components may not be entirely independent of one another” (Coppedge et al., 2011: 251). 64 Second, as mentioned above, there are no clear-cut answers for the checklist questions. Since the questions are formulated in such a way as to capture highly subjective features (e.g. “Are the electoral laws and framework fair?”), the lack of clear answers transmits this problem of subjectivity further into the data. This criticism was, for example, made by Cheibub et al. (2010: 75).
Another point of concern is the inappropriate aggregation rule of addition—equal weighting. Assigning equal weights to each question asked/concept contained is disputable in light of their content. This aggregation rule does not capture the complementarity of the concepts of participation and contestation. Furthermore, it does not view them as necessary conditions for a democracy. 65 It is also noteworthy that the measurement scale is neither continuous nor ordinal, it is at best categorical. 66
There is also concern with respect to the usage of FHI in a time-series context. A number of studies have exposed an ideological bias in the Freedom House data: Bollen and Paxton (2000: 77), for example, find evidence of a systematic downrating of Marxist–Leninist countries, especially in Freedom House’s early years and abating around the mid 1980s. In addition, in some years the coding rules are altered from one year to the next and previous years are not updated. Cheibub et al. (2010: 75) and Munck (2009: 148, footnote 15) observe that the use of Freedom House data in a time-series context is hence hardly justifiable.
The problem of subjectivity is also inherent in the coding of the time series. Freedom House states: “The scores from the previous edition are used as a benchmark for the current year under review. A score is typically changed only if there has been a real-world development during the year that warrants a decline or improvement (e.g., a crackdown on the media, the country’s first free and fair elections), though gradual changes in conditions, in the absence of a signal event, are occasionally registered in the scores”. 67 This benchmarking can potentially lead to the transmission of a subjective coding bias over long periods of time.
In conclusion, Freedom House data should be used in statistical analyses with extreme caution. The dataset by Freedom House exemplifies “problems in all three areas of conceptualization, measurement, and aggregation”, (Munck and Verkuilen, 2002: 28).
V-Dem dataset
The V-Dem dataset is assembled by a cooperation of over 50 scholars from all over the world, co-hosted by the Department of Political Science at the University of Gothenburg, Sweden, and the Kellogg Institute at the University of Notre Dame in the US. Several of the scholars involved in the evolution of the V-Dem dataset contibuted to the literature on democracy measurement long before the V-Dem came to life (for example Michael Coppedge, Carl Henrik Knutsen, Jan Teorell, and Pamela Paxton, to name a few). They were well aware of the ongoing debate about the definition, scaling, and aggregation of existing democracy measures. As a result, the V-Dem dataset provides answers to several of the problems discussed in the first section and is probably the most stringent and transparent dataset on democracy available today.
A first version of the dataset was introduced in Lindberg et al. (2014). The most recent version of the data (the one used in this paper) is Version 7.1 (Coppedge et al., 2017c). The data is available in country–year as well as in country–date format.
Numerous country experts, coordinators, and research assistants code basic variables capturing distinct features of a democratic system. 68 The variables are distinguished by type: type A variables are “based on extant sources and (…) factual in nature”, 69 while type B and C variables are coded by country coordinators and experts. Type B variables are more factual than C and do not contain as much judgment. Type C variables, on the other hand, require a greater amount of judgment and country-specific knowledge, such as language and state of affairs. The question of how to aggregate variables coded by multiple experts into a single “best estimate” for each variable is quite important in this context (for example, when some of the expert-coded questions are coded on an ordinal scale). Most of the type C variables are based on questions with answers on an ordinal scale and are thus aggregated across coders using Bayesian item response theory models. 70 Once the basic variables are aggregated into indices they are assigned to type D. 71
One of the main qualities distinguishing the V-Dem dataset from others is their definition and conceptualization of democracy: V-Dem acknowledges the fact that a democracy measure’s validity/concept-measure consistency hinges on the proper definition of the underlying concept. Given the multifaceted nature of the concept of democracy, they provide disaggregate data. This gives empirical scholars the opportunity to construct democracy measures based upon concepts defined as needed in particular research frameworks. As a potential starting point, they propose considering democracy as a multidimensional concept consisting of the following five distinct dimensions:
The electoral dimension 72
The participatory dimension 73
The egalitarian dimension 74
The deliberative dimension 75
The liberal dimension 76
In addition, V-Dem also recognizes the importance of an aggregation procedure reflecting the theoretical relationships between the concept’s attributes for concept-measure consistency. Low-level indices (type D) in the V-Dem dataset are combined into several mid-level indices, which in turn are then aggregated into high-level indices reflecting these five dimensions of democracy. In this aggregation process, issues of complementarity/substitutability or family resemblance between these dimensions are addressed. In the V-Dem definition of democracy, the electoral dimension is circled out as the core element without which no country shall be labelled democratic. 77 Hence, the electoral democracy index is combined with the high-level indices of dimensions 2–5 to create four indices of democracy. 78 These four indices based on five dimensions are considered to embody the “varieties of democracy” (V-Dem).
Detailed information regarding V-Dem disaggregate data is given in the V-Dem Codebook (Coppedge et al., 2017b). The basic A, B, C-type variables are aggregated into low-level indices (type D), for example by “adding a denominator (e.g., per capita), by creating a cumulative scale (total number of), or by aggregating larger concepts (e.g., components or indices of democracy)” (Coppedge et al., 2017b: 36).
The electoral democracy index, Polyarchy, reflects the minimalist democracy definition of contestation and participation. 79 To construct it, five low-level indices reflecting freedom of expression, association, suffrage, and free and fair elections are aggregated into two mid-level indices of electoral democracy: the additive and the multiplicative polyarchy index. The additive index is constructed by weighted addition of the five low-level indices and reflects the substitutability of democracy’s attributes. The multiplicative polyarchy index, on the other hand, is constructed by multiplying the five low-level indices and captures the complementarity of the five concepts (a very low score on one of the components will lower its overall multiplicative polyarchy index). The electoral democracy index joins complementarity and substitutability by averaging the additive and multiplicative polyarchy indices. The aggregation process for the other four high-level democracy indices is analogous. It is displayed in Figure 1.
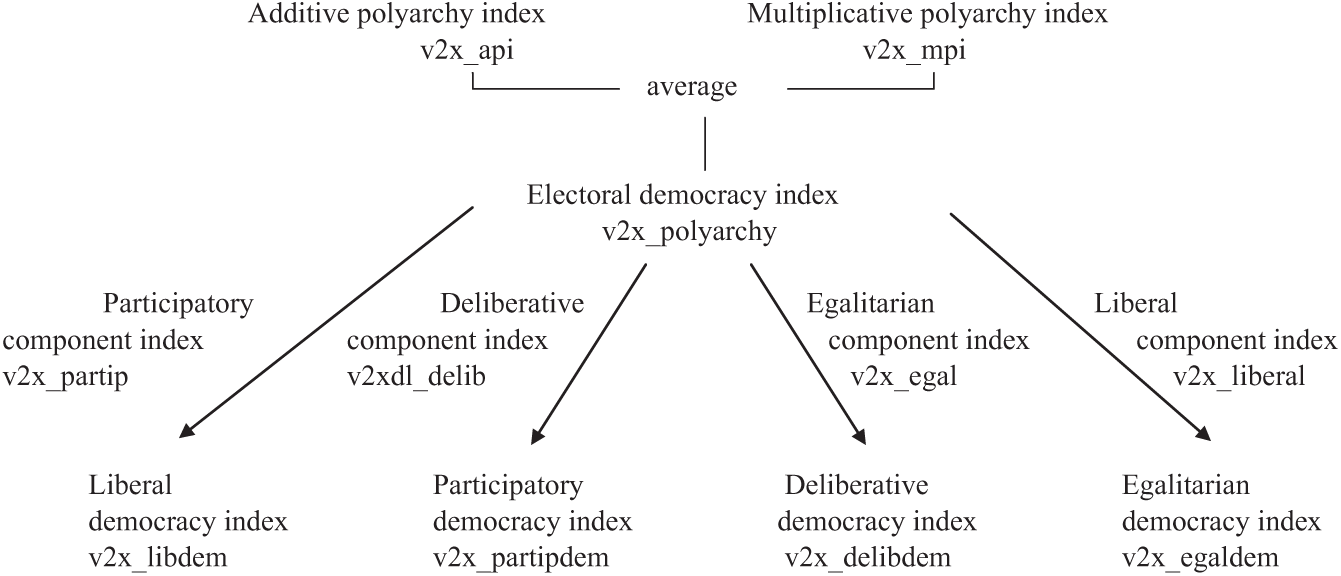
Aggregation process for high-level V-Dem indices.
The arrows represent an aggregation procedure which averages multiplication (complementarity) and addition (substitutability) of the two components:

Polyarchy influences each high-level democracy index to the power of 1.6. 80 Setting a higher rate of influence for Polyarchy than any of the other component indices underlines the importance of the electoral democracy principle. Contestation and participation should be satisfied to a certain degree before further aspects of democracy can be employed to distinguish between higher levels of democracy.
The V-Dem indices are continous and range between [0,1]. Since in some instances ordinal measures might be needed, the V-Dem Project also offers the main indices as ordinal variables with 3, 4, or 5 categories respectively. The classification rules for the ordinal indices are also provided (Coppedge et al., 2017b: 268).
In addition to the democracy indices, the V-Dem dataset provides measures of uncertainty for each of the indices. For each of the indices the standard deviation (index suffixed _sd) as well as the “interval in which the measurement model places 68 percent of the probability mass for each country-year score” 81 (denoted by index suffixed _codelow and _codehigh) are given. These highest posterior density intervals can be seen as an indication of the skewedness of the underlying distribution: if the distances between the point estimate and the upper and lower bound are not equal, the underlying posterior distribution is skewed.
The dataset is very transparent. Even the project manager, responsible for crafting a specific variable, or the compiler is listed in the data. The number of experts coding a variable is also given (variable suffixed with _nr). The default number of coders for the period 1900–2012 is five or more.
The project documentation is extensive. Aside from Coppedge et al. (2017b), the project offers for example documentation on methodology (Coppedge et al., 2017e), on the units of observation (Coppedge et al., 2017d), and on the project’s setup (Coppedge et al., 2017f).
To ensure consistency of codings accross countries and over time, bridge and lateral codings are employed. 82 Bridge coding refers to one coder coding a certain question for multiple countries over the entire time series, while lateral coding refers to the coding of a variable across all countries in a single year. Acknowledging the fundamental role of the country experts, V-Dem provides information on country expert selection processes. 83 To avoid repercussions, the country experts remain anonymous. 84
An important feature of the V-Dem dataset to note is its sensitivity due to the Bayesian item response theory models. With addition of “new information”, for example through the addition of a new bridge or lateral coder or the addition of a new year, the point estimates for the indices change from each dataset version to the next. As a result, country scores differ between the versions. While this might seem odd at first, this sensitivity to new information is one of the biggest strengths of the data: while Polity2 is struggling with the lack of variation in high democracies and low autocracies (as mentioned in the section Polity index), the abovementioned sensitivity of the V-Dem data will facilitate its adaption to new international constellations without loss of variation. Furthermore, it highlights that the country scores are point estimates with inherent uncertainty. This is a crucial point to keep in mind, especially when creating rankings based on democracy measures. 85
One minor issue to consider with the V-Dem dataset is that its distinction between de facto and de jure aspects of a polity (and hence their influence on the democracy measures) is not discussed or illustrated. Polyarchy, for example, contains a suffrage requirement and thus a measure of institutionalized enfranchisement (de jure participation). However, it is questionable how far actual (de facto) participation is captured. The data introduced in Vanhanen (2000) as well as the Scalar Index of Polities by Gates et al. (2006), for example, measure participation as the percentage of the population that actually voted in the most recent parliamentary or presidential election (or both). 86 Considering voter turnout as a sole measure of participation can produce misleading results, for example if voting is mandatory. To capture a de facto aspect of participation, Polyarchy includes an indicator on electoral violence. 87 A discussion of the inclusion of de jure/de facto criteria in the definition of democracy would be desirable.
Nevertheless, with the public availability of disaggregate and aggregate data, theoretical justification for the detailed aggregation rule, and comprehensive spatial and temporal coverage, the V-Dem dataset provides the most well-documented and well-grounded collection of democracy measures available today.
Comparison
The previous section outlined the diverse definitions and aggregation procedures embedded in each of the democracy measures. In addition, the three datasets vary considerably in terms of countries and years covered. These differences in definition, availability of disaggregate data, and country–years coded by each index are substantial and often prove decisive with respect to the question of which index to use in which framework. To assess dissimilarities in coding between the three indices, the sample is restricted to those observations available in all datasets for the remainder of this section. This sample will be referred to as the trunk dataset.
Note that while the reduction to a trunk dataset is necessary, it is also a very harsh restriction and a considerable amount of information is disregarded. For example, restricting the sample to countries included in the Freedom House data limits the timeline to post 1972 years. However, Polity2 and V-Dem data can be compared using data from 1900 on. It becomes even more drastic when the observations left out are chosen by attribute (and not by year): in the Polity2 coding scheme, observations during which a country is occupied by foreign powers constitute missing values (which is not the case for Polyarchy and FHI). Thus, these cases are not part of the trunk dataset.
How does this restriction affect similarities between the measures? Comparing pairwise correlations 88 to the correlations obtained using the trunk dataset (see Table 6) shows that for the observations in the trunk dataset (top right) the indices’ correlation is larger or (almost) equal to the pairwise comparison (displayed in the bottom left part).
Pairwise correlation coefficients. Bottom left: for all observations; top right: only observations coded in all datasets. Number of observations in parentheses below.
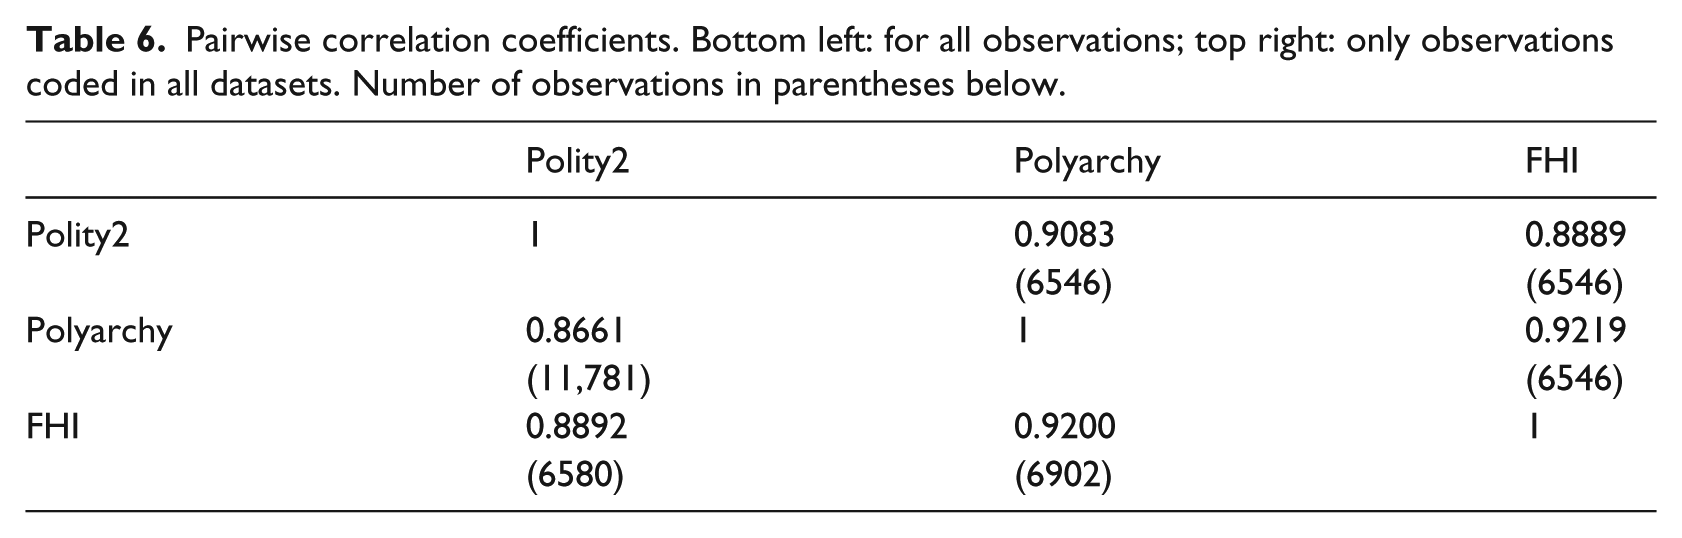
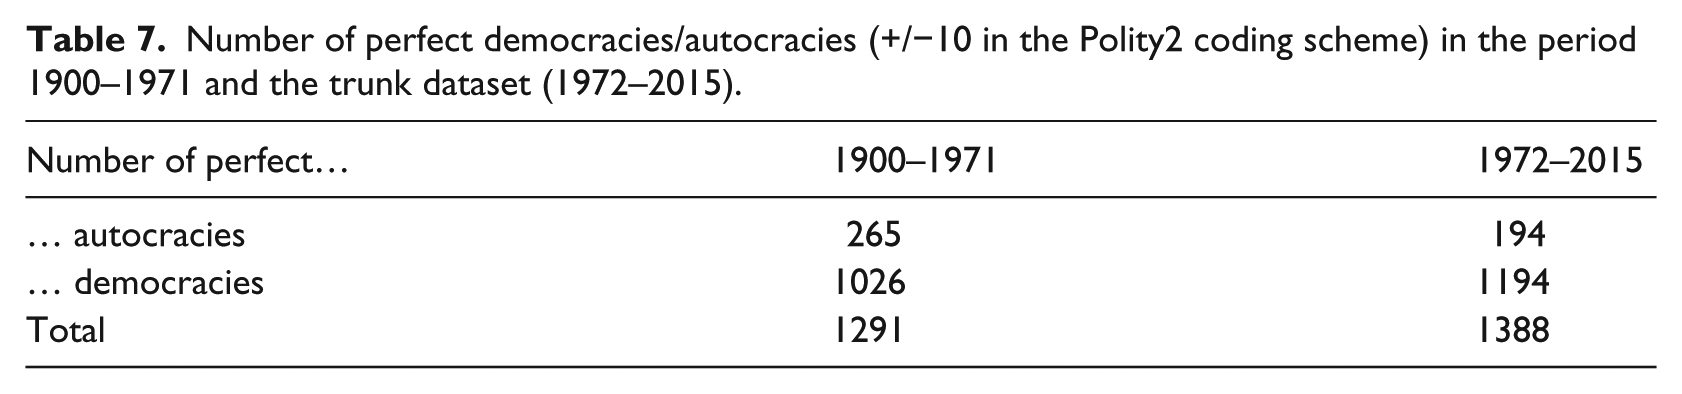
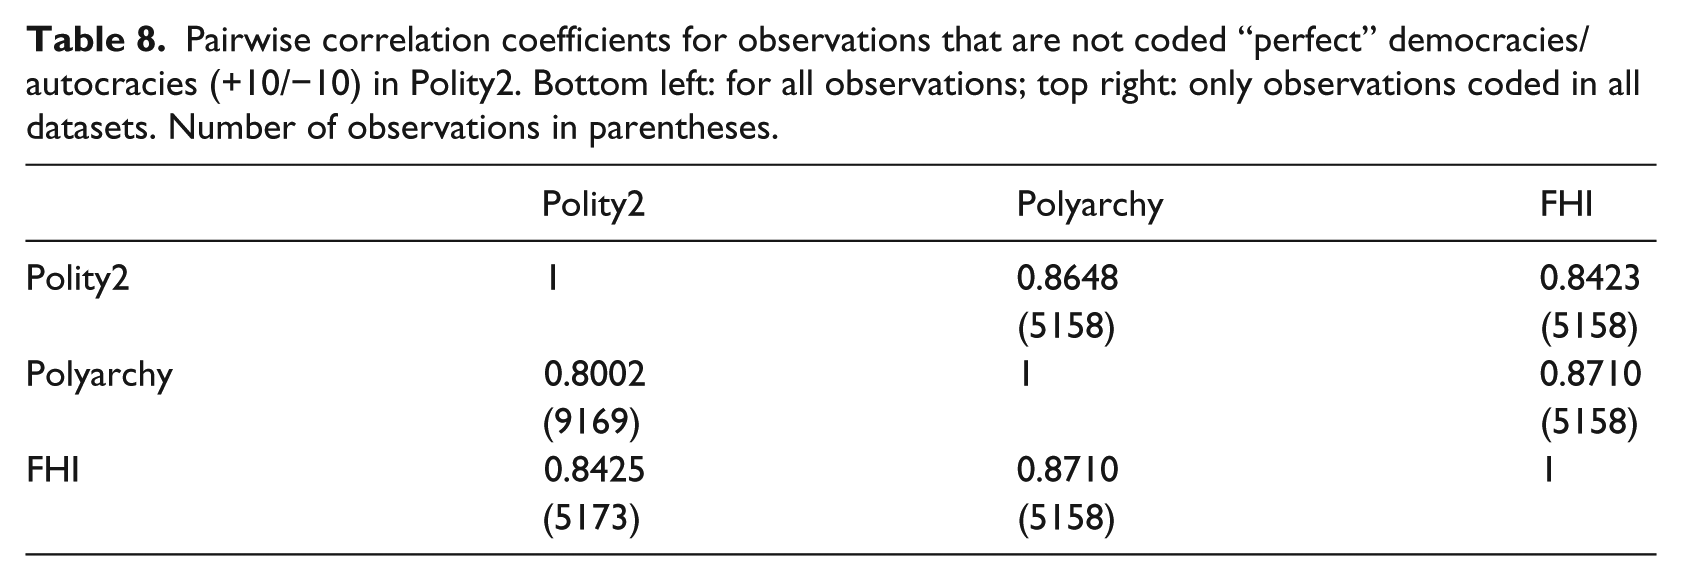
Coppedge et al. (2011: 252) 89 point out that high intercorrelations between the democracy indices are at least partly due to observations which are “perfectly” democratic/autocratic. The trunk dataset contains 6546 observations for 167 countries from 1972 to 2015. In comparison with the period 1900 to 1971, the number of “perfect” democracies drastically increased after 1972, which could explain the higher intercorrelations in the trunk data. As displayed in Table 7, around 21.2% of the observations in the trunk dataset are coded as perfect democracies/autocracies (+/−10 on the Polity scale). When removing them from the sample, the correlations decrease as displayed in Table 8. Limiting the dataset to observations available for all three indices thus implies obtaining a sample with a high fraction of perfect democracies/autocracies, which in turn contributes to an intercorrelation between indices that is larger or (almost) equal to the pairwise comparisons.
Number of perfect democracies/autocracies (+/−10 in the Polity2 coding scheme) in the period 1900–1971 and the trunk dataset (1972–2015).
Pairwise correlation coefficients for observations that are not coded “perfect” democracies/autocracies (+10/−10) in Polity2. Bottom left: for all observations; top right: only observations coded in all datasets. Number of observations in parentheses.
Summary statistics
Table 9 displays summary statistics for the democracy indices discussed above. Since it represents the minimalist democracy definition of contestation and participation, the Polyarchy index 90 was chosen from the V-Dem indices. 91 For facilitated comparability FHI was reversed and both FHI and Polity2 were normalized between 0 and 1. 92 Due to different geographical and temporal scopes covered by each index, the number of observations for which the summary statistics are computed are quite different. 93 The summary statistics for all observations available per index are displayed in the top part of Table 9. The summary statistics for the trunk dataset are displayed in the lower part of Table 9. 94
Summary statistics for the democracy indices.
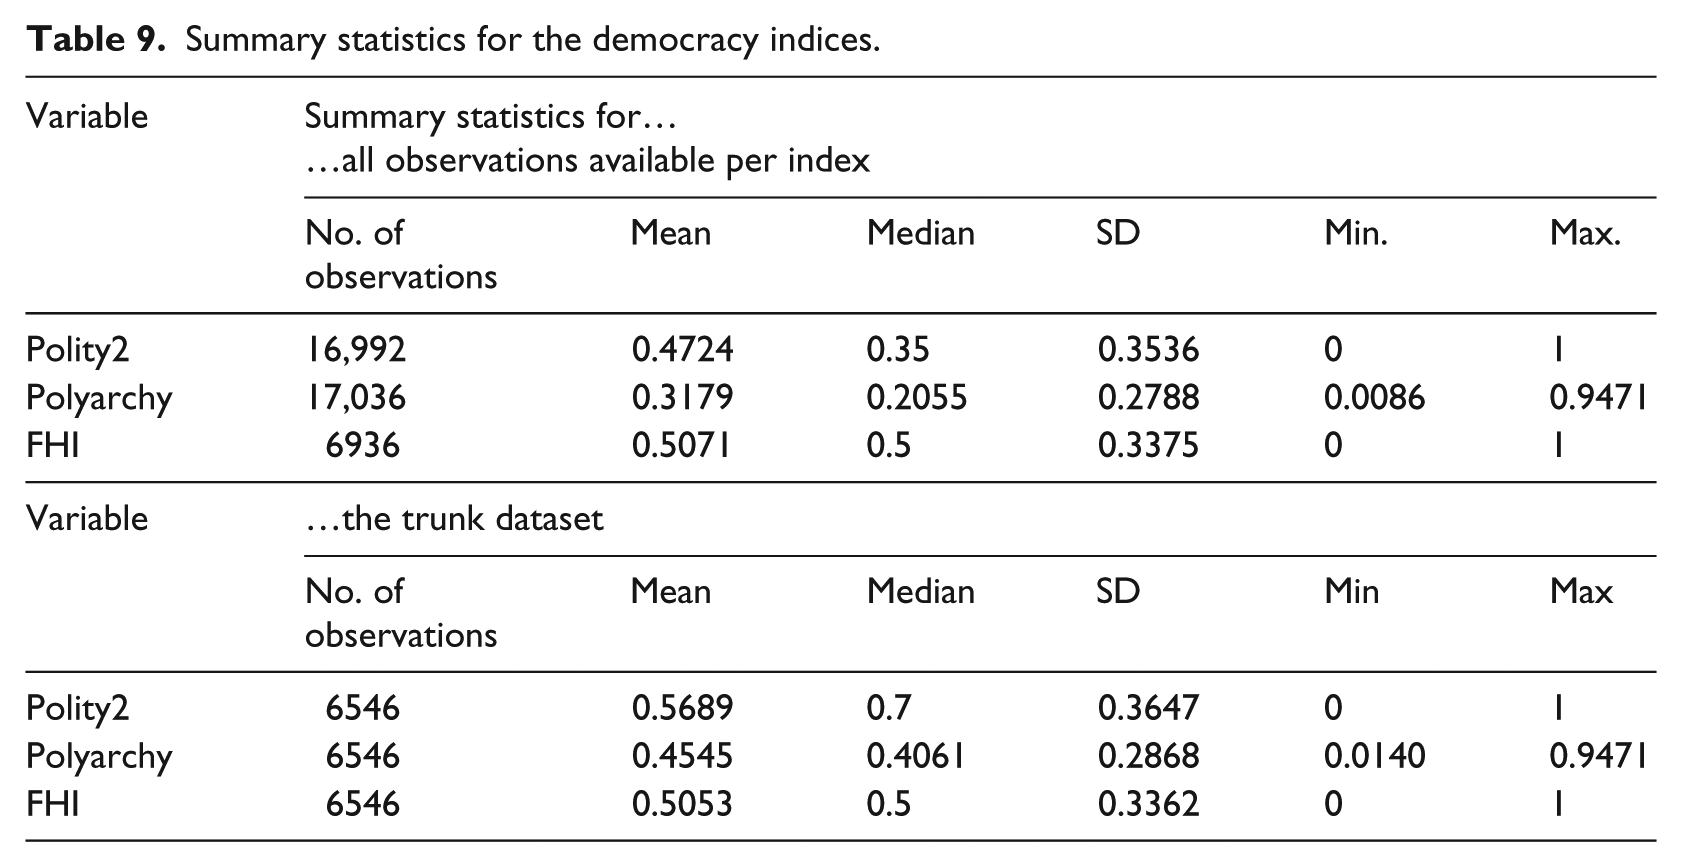
The distributions of all three measures are U-shaped, 95 with peaks (particularly pronouced for Polity2 and FHI) at the extremes. 96 As discussed above, 18.2% of the observations in the trunk dataset are coded as “perfect” democracies by Polity2. This high number of perfect democracies is also reflected by a Polity2 median that is substantially larger than Polity2’s mean. The distributions of FHI and Polyarchy are more even. However, FHI considers around 14% of observations in the trunk dataset as perfect democracies and around 9% as perfect autocracies, while no observation is coded as either by the V-Dem Project. Polity2 and FHI capture very little variation in highly democratic/autocratic systems (the US, for example, is coded as a perfect democracy from 1972 to 2015), as opposed to Polyarchy. 97 This has an important implication for the choice of measure in frameworks in which highly democratic/autocratic countries are examined. FHI also has a comparatively high number (around 8.5% of the observations) of perfect autocracies, i.e. observations coded as 0. In addition, the high and low numbers of perfect democracies/autocracies have a noteworthy theoretical implication for the future development of the respective countries’ time series: for those countries the system of governance is not able to improve/deteriorate.
Examining the differences
The following section examines the differences in coding between the three democracy measures and their implication for the country ranking within each index. The section closes with a country study exemplifying the differences in coding variation, ranking, and disaggregation possibilities.
Difference with respect to attributes of the democracy definition
Polity2 assigns a value of 0 98 for observations in which a country undergoes a period of interregnum/anarchy and pro-rates the respective country’s democracy value over the length of a transition period (see section Polity index).
The boxplot in Figure 2 shows that Polyarchy and FHI are both much lower than Polity2 (i.e. the interquartile range of the differences is strictly positive) for countries in anarchy and transition periods. Interestingly, at the same time the difference in values between FHI and Polyarchy is low for these cases (median differences of around
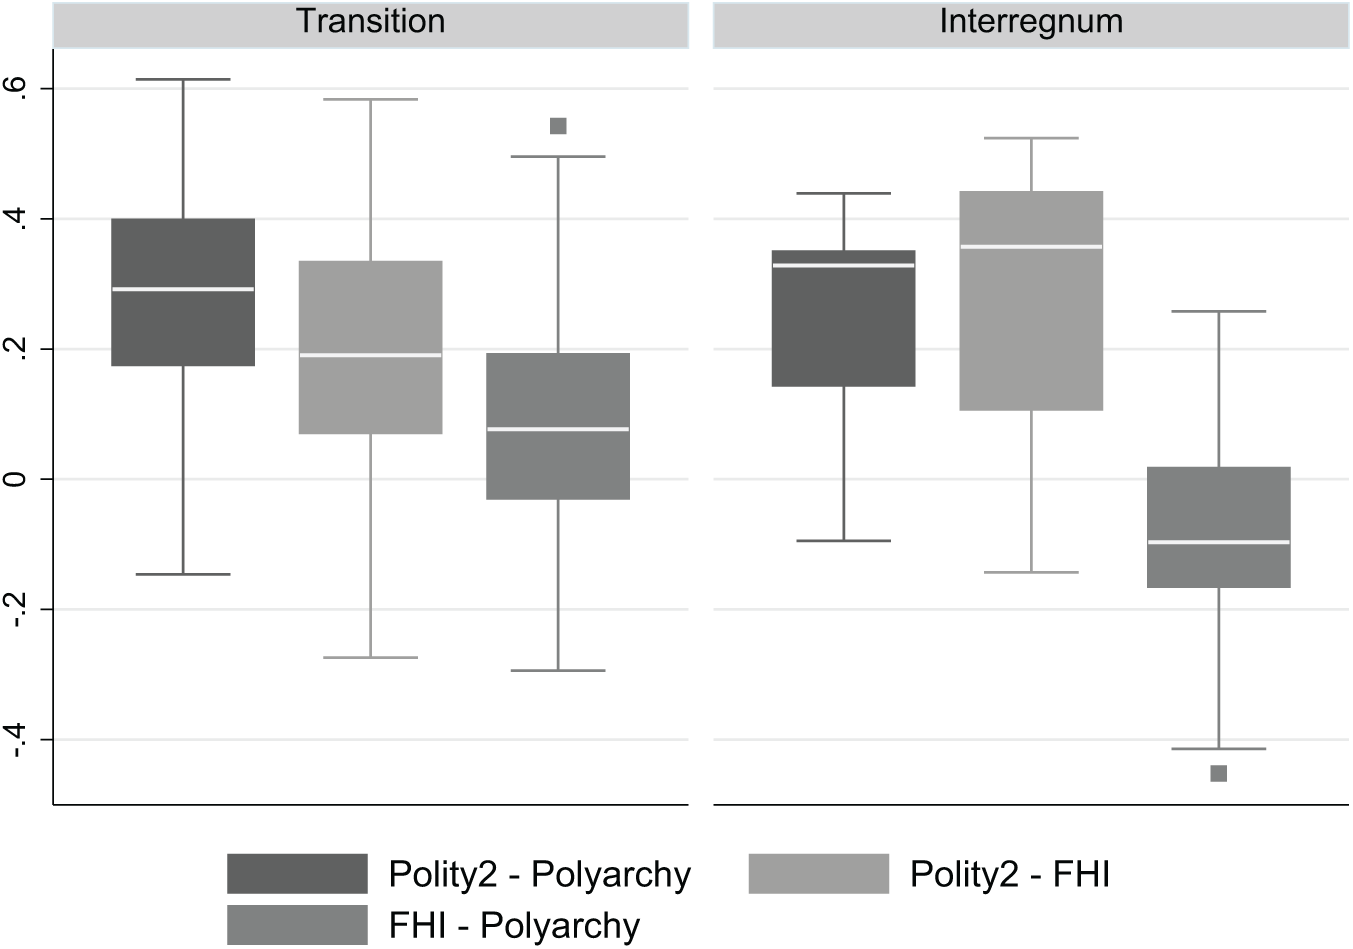
Boxplot of differences between index values for cases coded as transition or interregnum in the Polity scheme.
As mentioned in the section Polity index, the original aim of the Polity data was to capture a country’s formal institutional setup. This led to the Polity index reaching the boundaries of its domain in cases where there were no regular institutions, i.e. in cases of interregnum, transition, or occupation. Even though V-Dem includes several aspects beyond the formal institutions, the absence of a regular institutional framework in post-World War II Germany seems to be posing difficulties for V-Dem as well: Germany is not coded between 1946 and 1948. Since this is the only such case, the recommendation to prefer V-Dem indices or FHI whenever a share of the relevant observations falls in the categories discussed above remains valid.
Difference in coding by level of democracy
The high intercorrelations between the democracy measures discussed above show that there is a strong relationship between them. This is to be expected, as the three indices are supposed to measure the same thing—democracy. But the correlations do not provide information on the “agreement” between the indices. Agreement can be thought of as the identity line, when two indices are plotted with respect to each other. If all observations are close to the identity line, the indices “agree” and the differences between them are close to zero. A case with high correlation, but limited agreement, occurs, for example, if one index were to consistently code each country half as democratic as the other.
In the following, the general agreement between the indices is examined and systematic differences are explored. Let’s assume there was a “hypothetical democracy scale” along which all countries could be sorted. Does one index systematically code highly democratic/autocratic countries (on the top/bottom of the hypothetical scale) differently from another index? The “hypothetical democracy scale” is, of course, unknown (and given the different definitions underlying the democracy measures, it is strictly hypothetical). However, assuming the three democracy measures are three ways of capturing very similar concepts, we can use the average of the three measures as a proxy for the hypothetical scale. Differences between the index pairs are plotted against this average, i.e. the “hypothetical democracy scale” in Figure 3. The solid line at y=0 marks the observations for which there is perfect agreement between the indices (i.e. where the difference between them equals zero). The dashed lines mark the 95th percentile and the fifth percentile; hence, 90% of the observations fall between the top and bottom dashed line. The black line represents a linear fit (pooled ordinary least squares (OLS)) of the differences in democracy measures on “hypothetical democracy”. 99
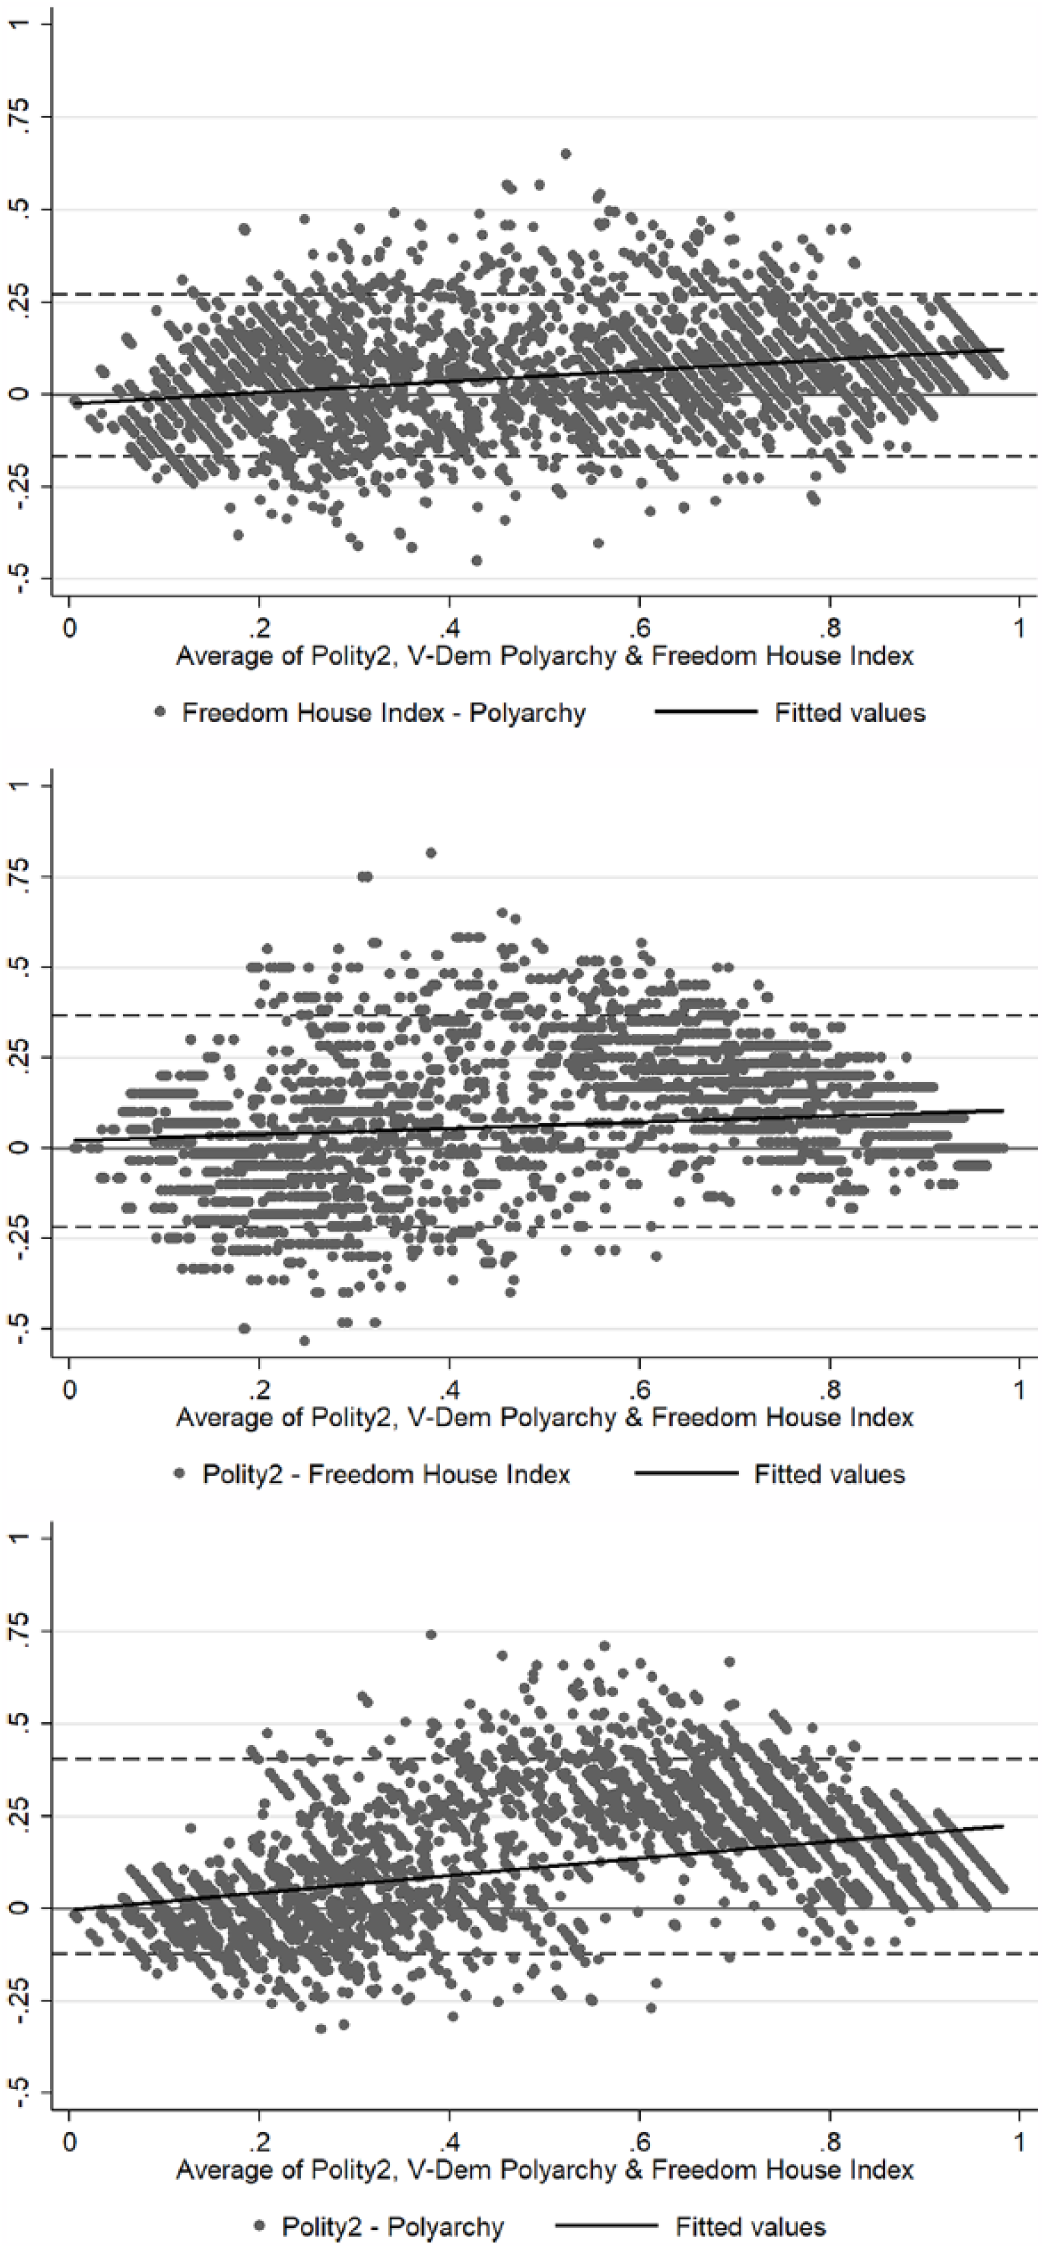
Pairwise differences between indices plotted over average democracy levels: horizontal lines at 0, the 95th percentile, and the fifth percentile.
For all indices the differences get closer to zero towards the democratic/autocratic extreme. The plot for Polity2 and the V-Dem Polyarchy index provides useful insight on the agreement between the two indices: the fitted line is positive and increasing. In a large number of cases, Polity2 rates countries as more democratic than the Polyarchy index. For the intermediate 90% of observations, the difference between the two index values tends to be positive. In fact, for countries in the upper half of the democracy scale, there is very little agreement: the difference in index values becomes larger as the level of “hypothetical democracy” increases. The vast majority of countries located between 0.55 and 0.8 on the hypothetical democracy scale are coded strictly more democratic by Polity2 than by Polyarchy. For countries at the very low end (until 0.1) of the democracy scale, on the other hand, the two indices seem to agree to some extent: differences are symmetrically distributed close to 0. There are comparatively few observations for which Polyarchy is significantly larger than Polity2 (those in the fifth percentile). They occur for countries on the lower half (between 0.1 and 0.7) of the hypothetical democracy scale.
The plot for FHI and Polyarchy also displays an increase in difference between the two measures with rising hypothetical democracy values. The fitted line is increasing, but it is negative for hypothetical democracy values below 0.16. Countries on the lower end of the hypothetical democracy scale are coded as slightly more democratic by Polyarchy than by FHI. However, this is reversed for countries above the 0.18 threshold: for these, FHI tends to be slightly larger than Polyarchy and increasingly so with rising levels of democracy. Large differences (as measured by the 10% of observations for which the absolute differences in democracy values are particularly high) occur for countries anywhere on the democratic scale except the end points.
Polity2 and FHI’s agreement is almost consistent across hypothetical democracy values: the fitted line is nearly horizontal, but positive. Polity2 tends to code countries as slightly more democratic anywhere on the democracy scale. Examining the large differences only, FHI tends to be larger than Polity2 only for countries in the lower half of the democratic scale.
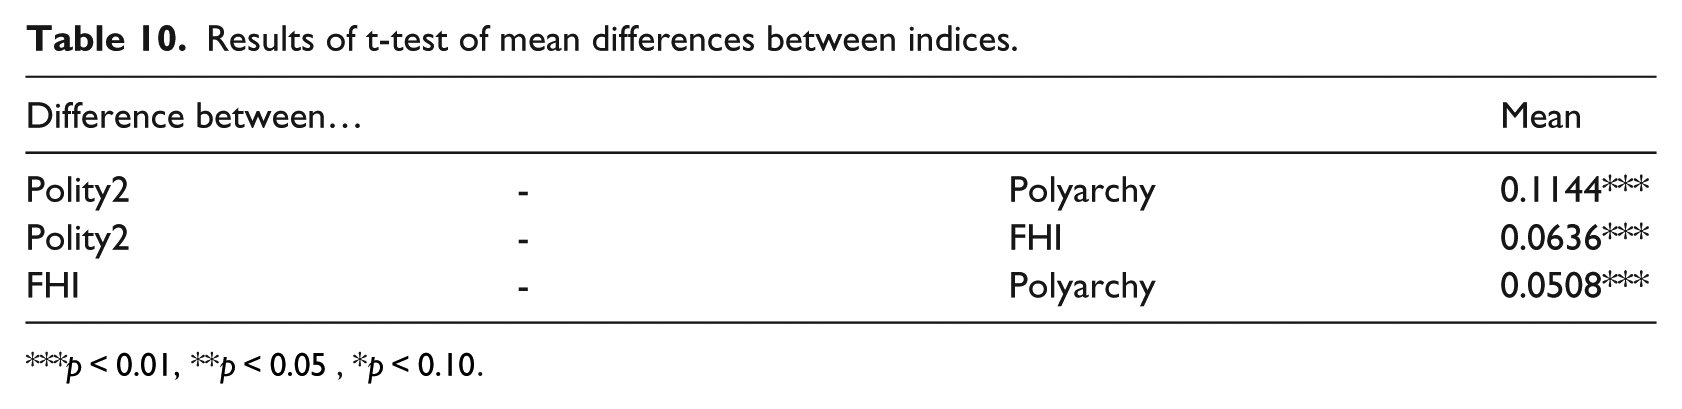
The assessment of dis-/agreements between democracy measures concludes by testing whether there are significant differences in coding between the indices: is the mean difference between the indices different from zero (H0)? The results are displayed in Table 10. They are in line with the findings from Figure 3 above. The mean differences are positive and significantly different from zero. On average, Polity2 assigns the highest democracy values, followed by FHI. Polyarchy on average assigns the lowest democracy values. Due to Polyarchy’s definition, this comes as no surprise: as discussed above, it captures the minimalist democracy definition of contestation and participation.
Results of t-test of mean differences between indices.
Difference by region
To examine the results from the last section, world averages from 1900 to 2016 are plotted in Figure 4. Recall that the Polyarchy index captures the minimalist democracy definition of contestation and participation. When examining the world averages, this becomes obvious as it is—on average—quite austere, i.e. lower than FHI or Polity2, in its coding. Interestingly, the world averages show that FHI values fluctuate between Polity2 and Polyarchy only from 1990 onwards. Before that the FHI average is above the Polity2 one.
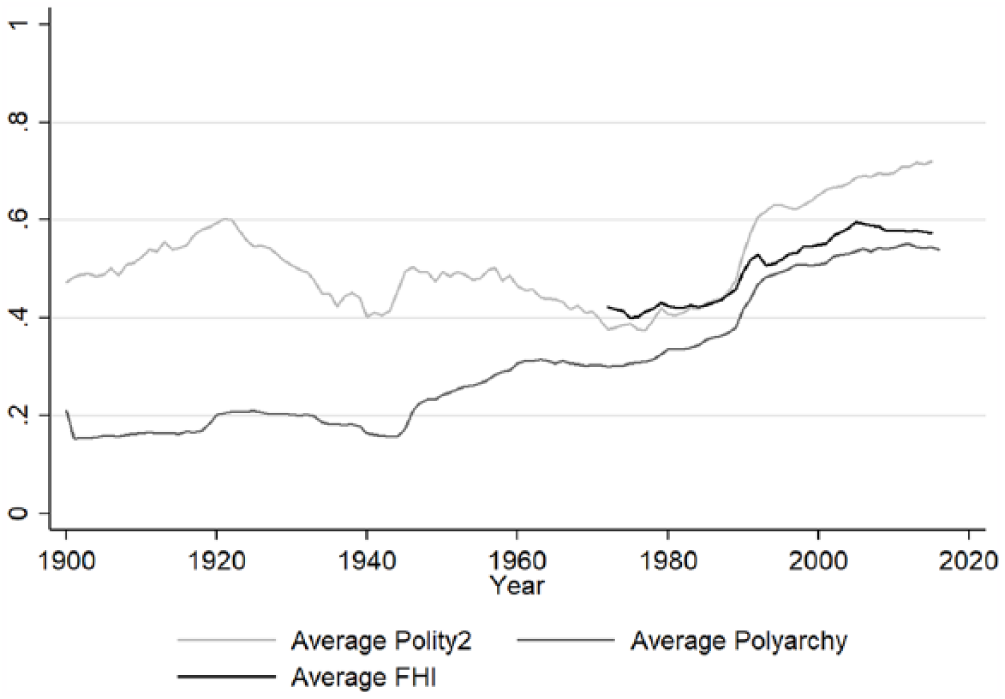
World averages of Polyarchy, Polity2, and FHI.
Figure 5 breaks up the dataset by geopolitical region 100 and displays regional averages for each of the democracy measures. For most regions the Polity2 values are larger or equal (almost equidistant) to the Polyarchy values, while FHI mostly “fluctuates” between the other two. The change in coding between FHI and Polity2 averages noted in Figure 4 is particularly visible in the following regions: in Latin America and the Caribbean, the Middle East and North Africa, and East and South Asia, the Polity2 average is below the FHI average prior to 1990, but above it after. In addition, when examining the regional averages for Eastern Europe and Central Asia (EECA), Polity2 and Polyarchy index show a high level of agreement for the observations before 1990. FHI, on the other hand, codes the EECA observations as much less democratic than the other two indices between 1972 and 1990. This might be a reflection of FHI’s early ideological bias, as discussed in the section Freedom House. It could also indicate that the Polyarchy values are too high. It is the only time span and region in which Polyarchy is higher than both Polity2 and FHI. In the following section, the coding of the EECA countries will be examined in more detail to shed light on this finding.
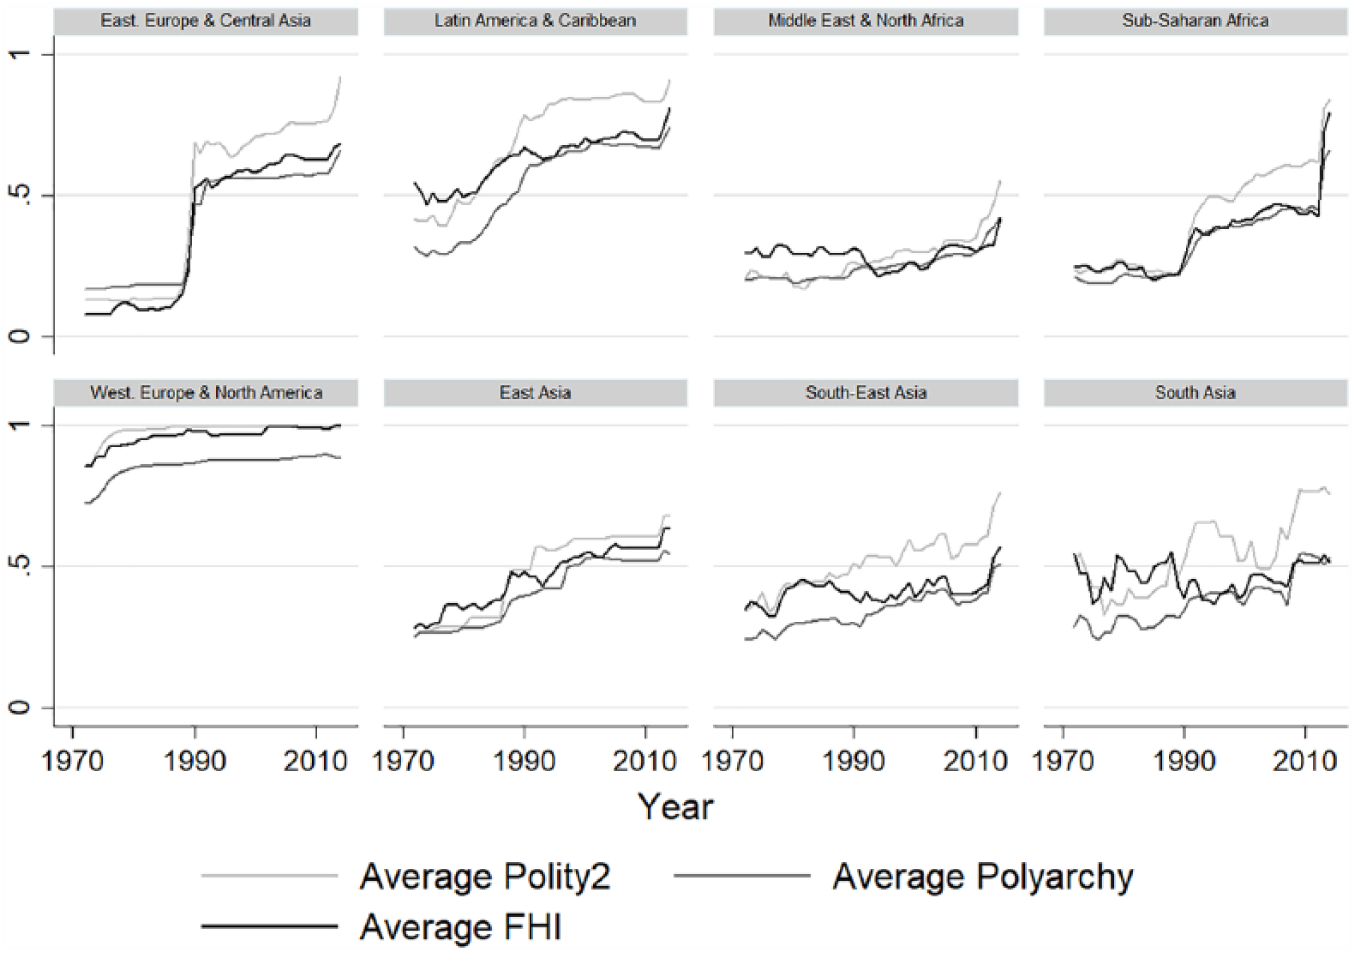
Regional averages of the three democracy measures.
Eastern Europe & Central Asia
The regional comparison in Figure 5 provides some insight into the “austereness” of each democracy index. On average, Polity2 assigns the highest and Polyarchy the lowest values, while FHI fluctuates between the other two. The only time and region in which there seems to be a systematic deviation from this scheme is in Eastern Europe & Central Asia (EECA) before 1990. There are 31 countries in the region. 101 Albania, Bulgaria, Mongolia, and Romania provide good examples of the coding phenomenon discussed above. Hence, their coding will be studied in more detail in the remainder of this section. The respective democracy values assigned by Polity2, FHI, and Polyarchy are displayed in Figure 6. 102 To understand why Polyarchy codes each country comparatively high, Polyarchy is broken up into its components in Figure 7. The share of the population with suffrage and the elected officials index 103 are coded with the highest possible value over the entire time span. This strongly contributes to the high Polyarchy values in these countries prior to 1990. It is a central difference between the three indices and their underlying definitions of democracy. As discussed above, Polity2 and FHI 104 do not include any components capturing suffrage requirements. Polity2’s categories XROPEN (“Recruitment of the chief executive is ‘open’ to the extent that all the politically active population has an opportunity, in principle, to attain the position through a regularized process” (Marshall et al., 2017a: 22)) and XRCOMP (“Competitiveness refers to the extent that prevailing modes of advancement give subordinates equal opportunities to become superordinates” (Marshall et al., 2017a: 21)) are closest in meaning to V-Dem’s elected officials index. Here a lack of detail and organization in the theoretical concept of the Polity2 scheme becomes apparent: the very definition of XROPEN mixes several important attributes, namely the regularized electoral process (in V-Dem captured by the elected officials index), the extent to which the politically active population is de jure allowed to participate (i.e. the share of population with suffrage), as well as the actual de facto opportunities the population has to influence the electoral process (in V-Dem this is covered, for example, through the clean elections index). The Polity2 categories do not distinguish between different attributes of the underlying concepts of the de jure electoral process and the de facto as well as de jure participation of the population.
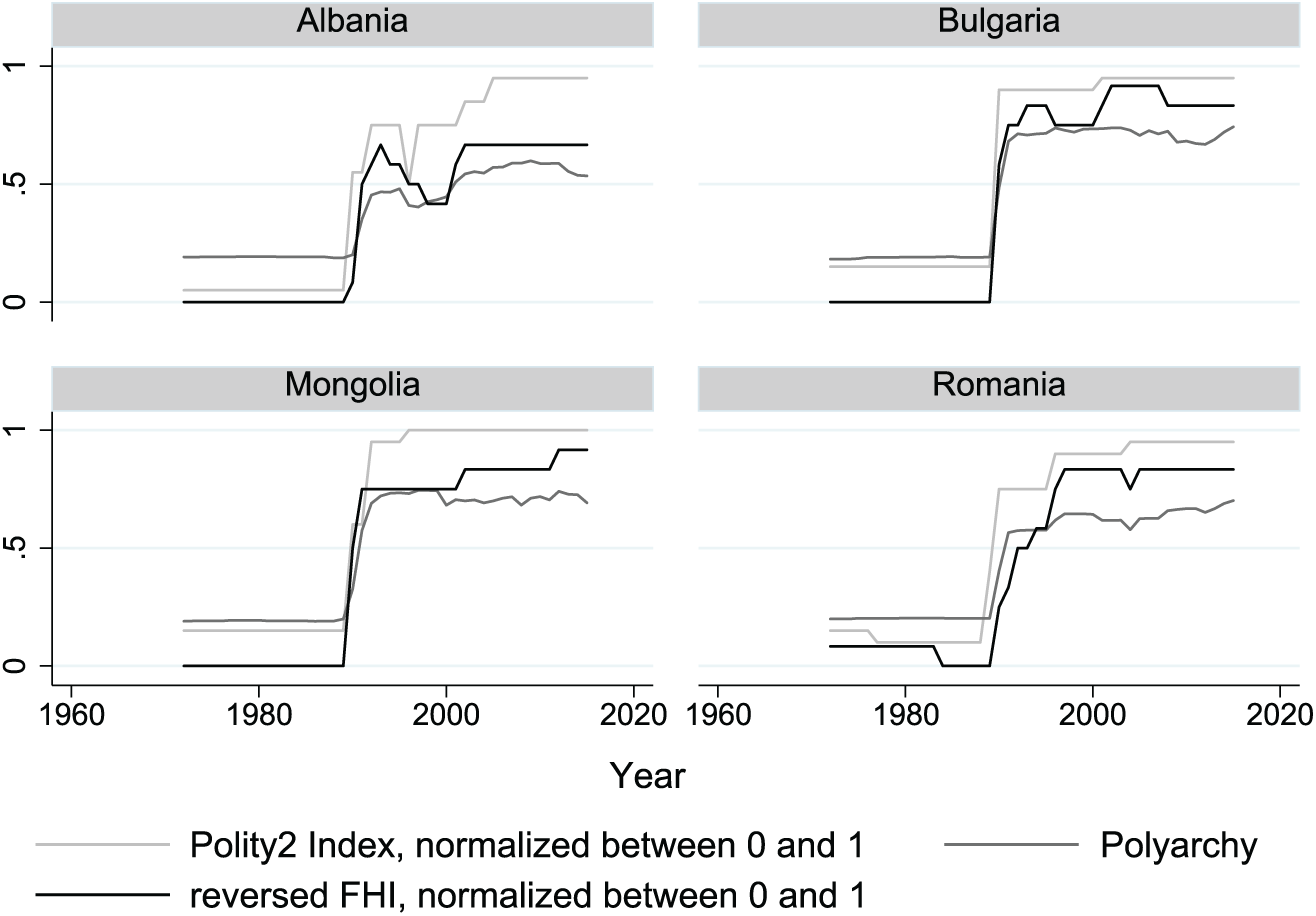
Democracy coding by Polity2, FHI, and Polyarchy for Albania, Bulgaria, Mongolia, and Romania.
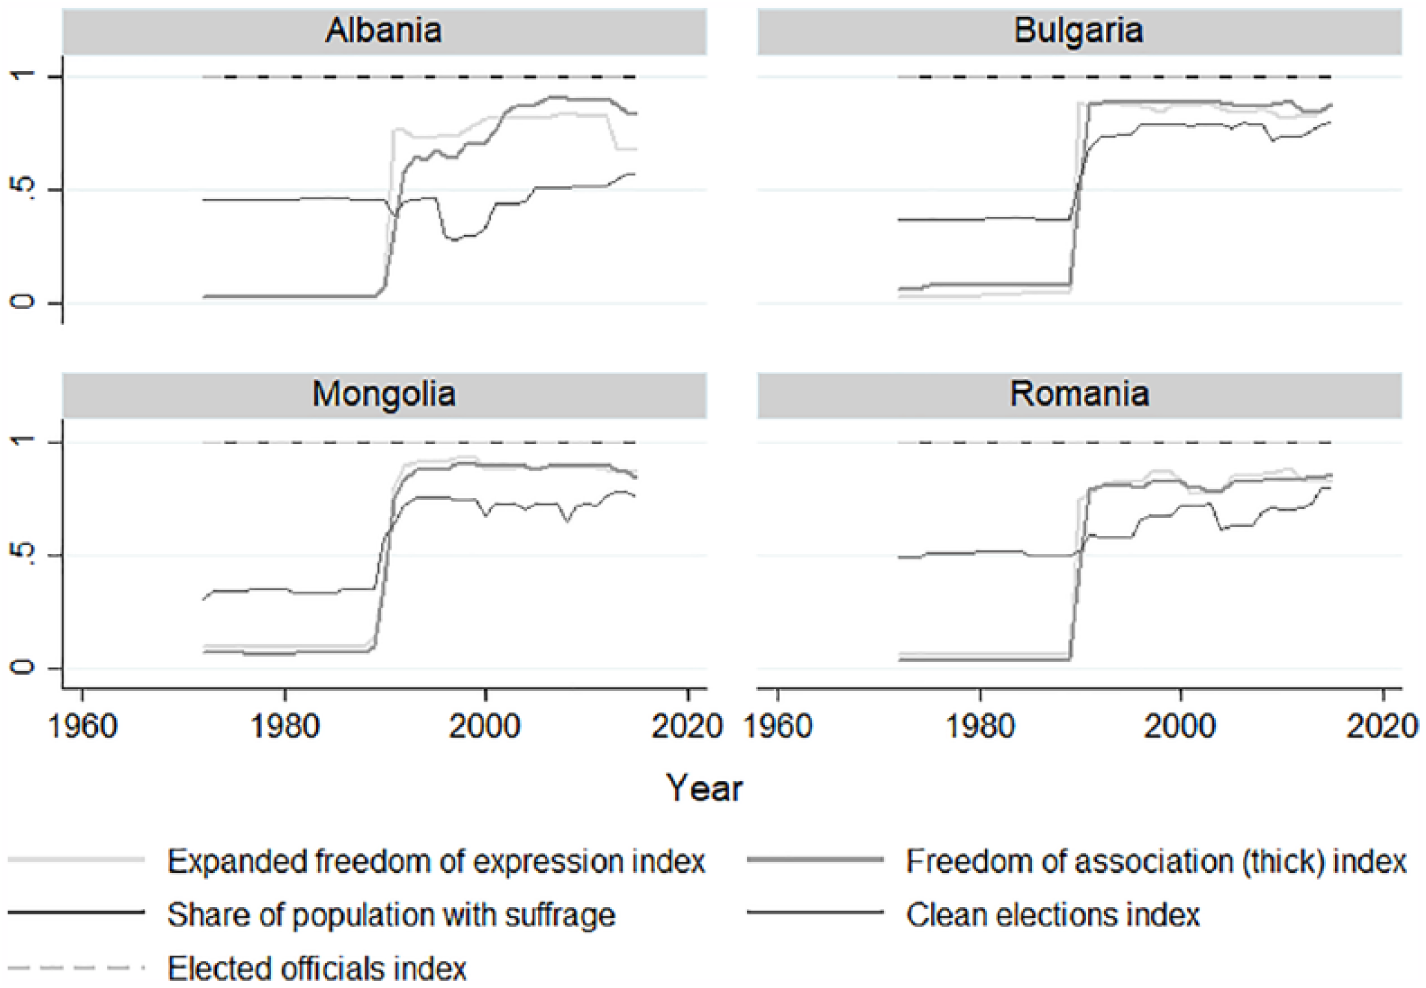
Components of Polyarchy for Albania, Bulgaria, Mongolia, and Romania.
The Online Appendix contains a section comparing the country ranking of each of the three democracy indices. It shows that the countries are ranked almost consistently across all regions except for EECA prior to 1990. The difference in the democracy definition covered (by the inclusion of suffrage) is a major driver behind the comparatively high values of Polyarchy at that time and in that region. It ultimately also leads to a different ranking for the corresponding countries. In conclusion, a closer examination of the EECA region demonstrates that differences in the underlying democracy definition can and do lead to differing country ratings. In applications covering time periods and regions such as EECA prior to 1990, this can potentially be a source of results varying with the democracy measure used.
United States of America
A closer examination of the time series of the United States (US) will illustrate differences in temporal variation, in ranking, and in the disaggregation possibilities between the three indices.
Figure 8 displays the democracy index values and yearly rankings of the US between 1972 and 2016. The US is coded as a perfect democracy, receiving the highest possible value throughout the entire time series by both Polity2 and FHI. This lack of variation in the two indices is also found in most highly democratic/autocratic countries. 105 In circumstances in which the research question at hand concerns such countries, this feature needs to be kept in mind.
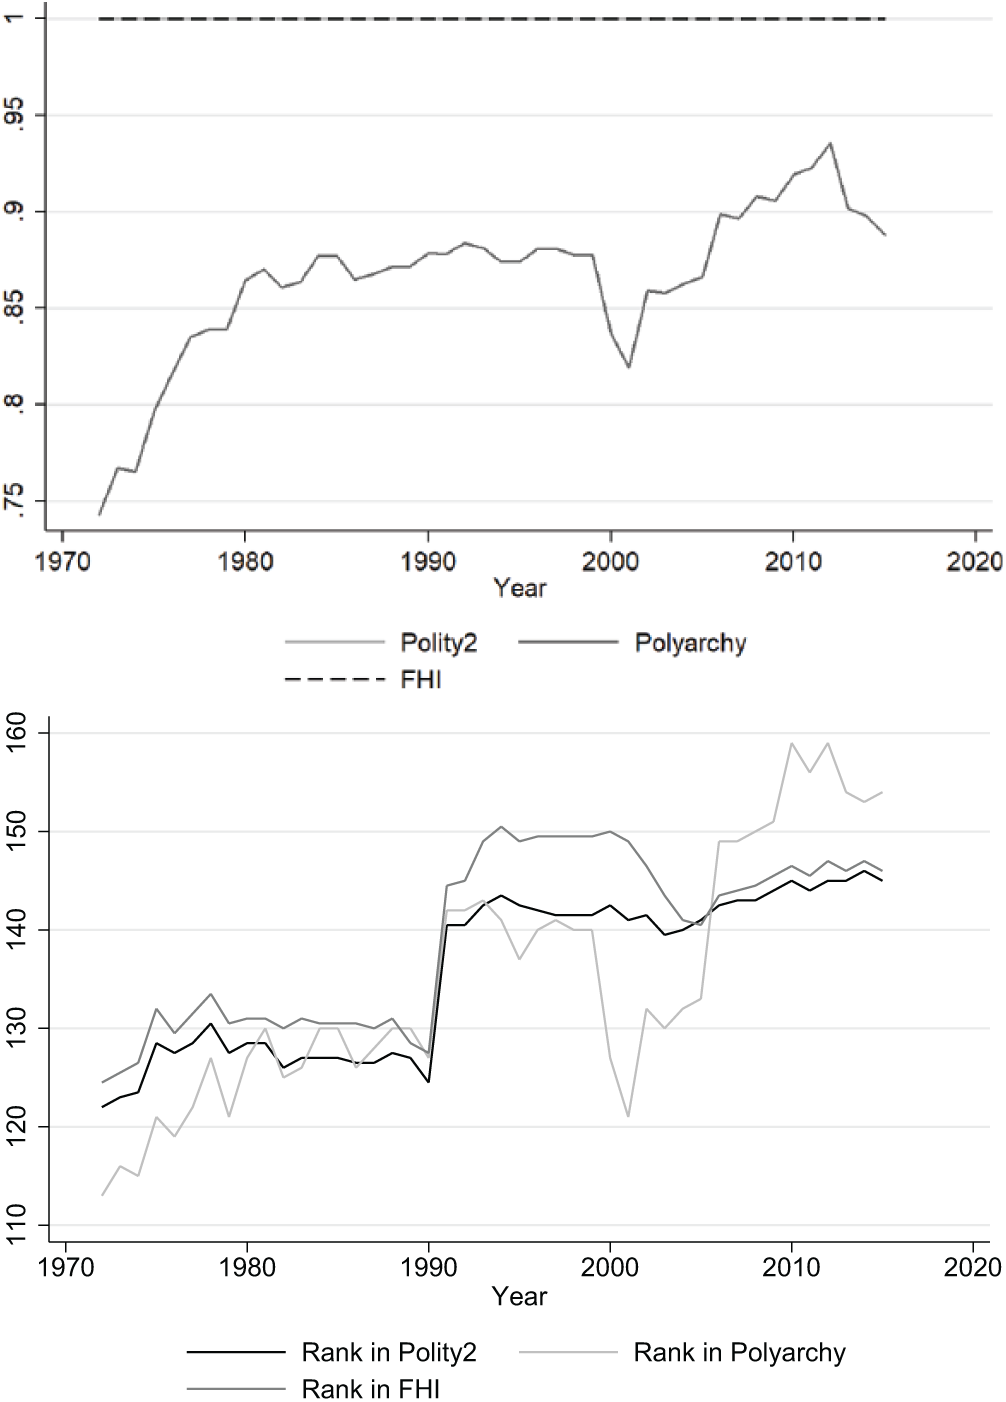
Democracy index values (top) and yearly rankings (bottom) for the United States of America from 1972–2016.
The differences in ranking between FHI and Polity2 are minor. However, the difference to Polyarchy is rather large. From 1999 to 2001 Polyarchy in the US drops by about 5.8%. What caused this sharp decrease? Plotting the components of Polyarchy for the US over time (see Figure 9) shows that the clean elections index, v2xel_frefair, 106 is the main driving factor behind it.
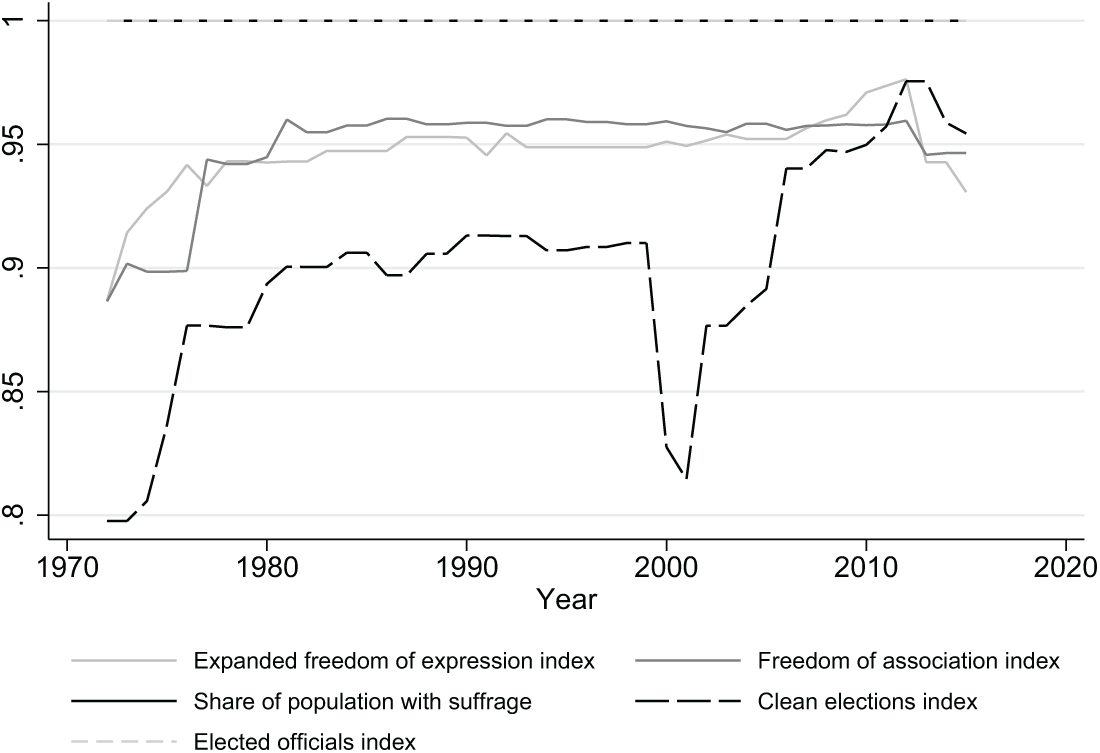
Components of Polyarchy for the US over time.
Further decomposing the clean elections index into its subcomponents 107 (see Figure 10) exposes election management body (EMB) autonomy (v2elembaut), 108 election voter registry (v2elrgstry), 109 election vote buying (v2elvotbuy), 110 election other voting irregularities (v2elirreg), 111 and election free and fair (v2elfrfair)” 112 as driving factors (see top graph Figure 10).
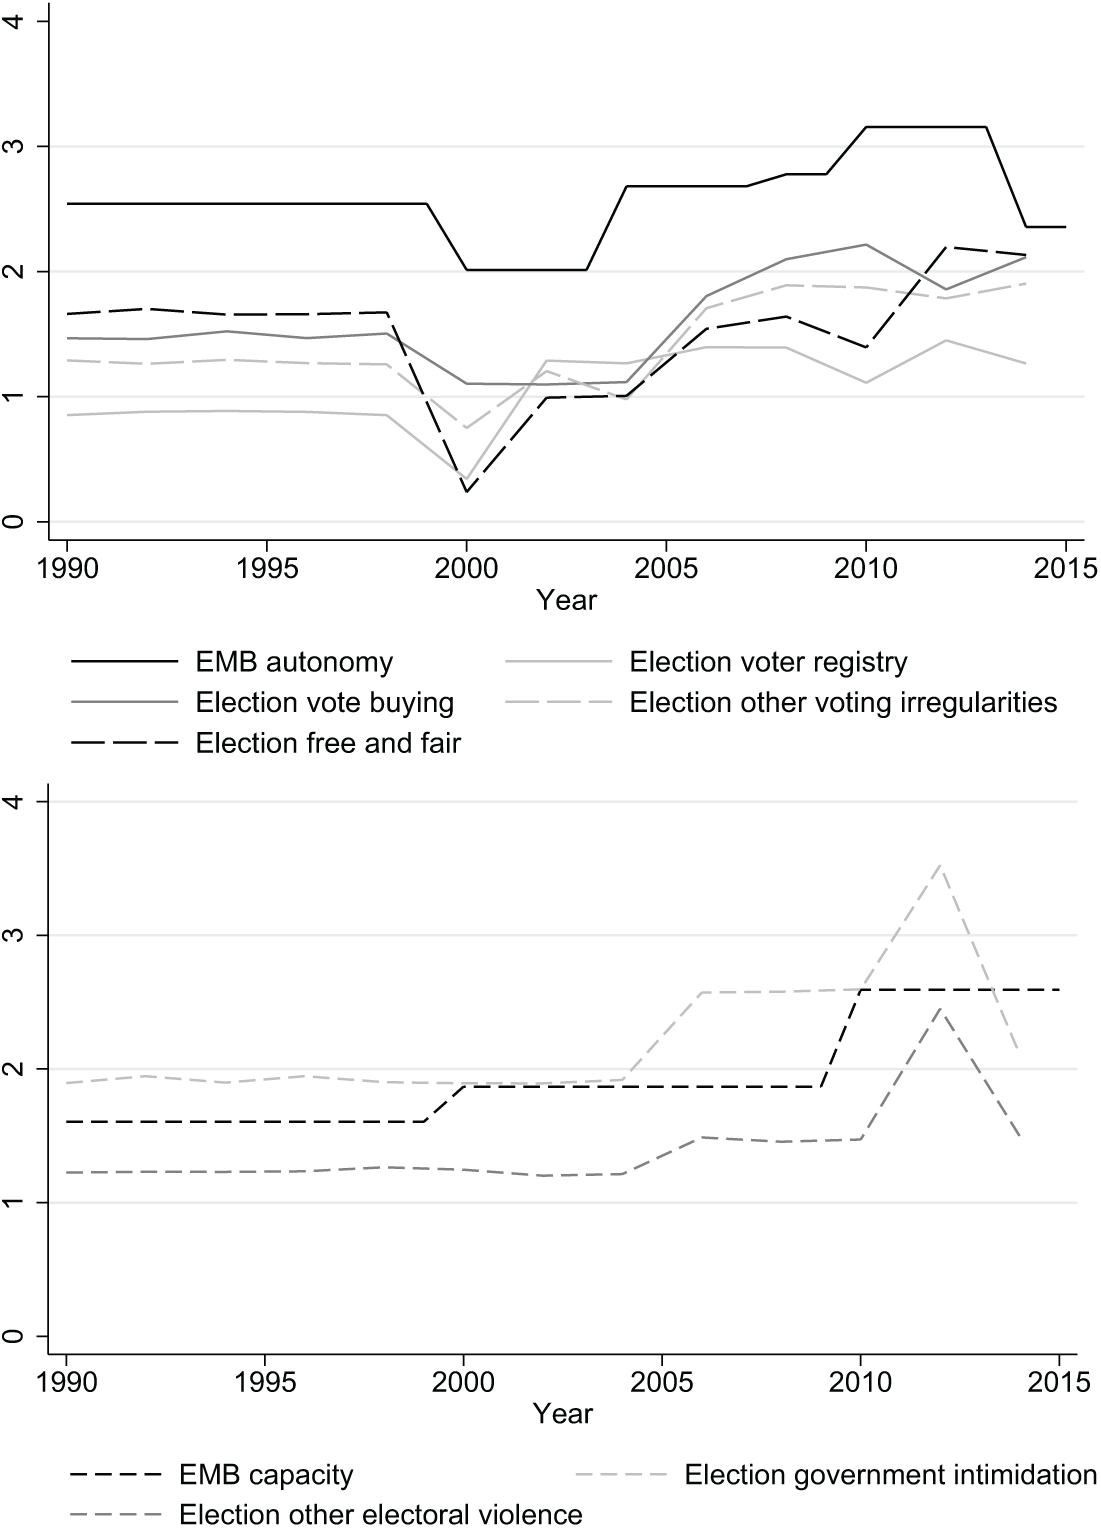
Subcomponents of the clean elections index for the US from 1990 to 2016.
In sum, the drop in Polyarchy (and subsequently in the ranking of the US in comparison with other countries in the year 2000) is due to the 2000 presidential election and is not captured by Polity2 or FHI. This difference in the US values and ranking for each of the indices illustrates how Polyarchy is more sensitive than Polity2 or FHI, which is both an advantage (higher variability, more information is included) as well as a (slight) flaw of the index. As discussed in the section V-Dem dataset, V-Dem does not provide a thorough discussion of the de facto and de jure elements included in the democracy measure. De facto (as opposed to de jure) indicators by nature rely more on judgment calls and inherently suffer from an increased bias. The indicators driving the decrease in US Polyarchy values address the de facto aspect of the US democracy in 2000. US Polyarchy drops from around 0.88 in 1999 to 0.84 in 2000. Whether this sharp decrease is an appropriate reflection of changes in US levels of democracy around the 2000 election or whether it might be influenced/amplified by ideological judgments inherent in de facto indicators can be debated. It comes down to the question: what share of the underlying democracy definition consists of de facto vs. de jure attributes of a polity? None of the three democracy measures properly address this question.
Nevertheless, Polyarchy still outperforms the other two measures with respect to all points discussed in the paper. Polyarchy’s increased sensitivity/variation (especially for highly democratic/autocratic) countries can be a large advantage in a time-series cross-country setting over the countries which are coded as 1/0 for decades by Polity2 or FHI. The one thing the V-Dem project could improve is to find a system of “checks and balances” for de facto attributes so as to not let this sensitivity get out of hand.
Discussion
The three democracy indices studied in this paper were introduced at different times and for different purposes. In the section Definition of democracy, the distinction between de facto and de jure attributes included in a democracy measure was discussed. It ties into the very definition of the underlying concept of democracy/authority patterns. The Polity data was created to examine the durability of institutional frameworks. Its aim was to capture the de jure framework. FHI, on the other hand, was originally designed as a measure of civil liberties and political rights. It is therefore more of a de facto measure. V-Dem’s Polyarchy is situated somewhat in between the two hypothetical de facto and de jure endpoints. There is no “optimal” partition of de facto and de jure elements to incorporate in a democracy measure. The research question of the project at hand and the corresponding perception of democracy should determine the levels of de facto and de jure attributes. None of the three democracy indices are “better” or “worse” because of their choice of partition. While the choice in itself does not affect the indices’ overall validity, it does affect the values coded. The country studies provided in the previous section show that the inclusion of more or less of such de facto and de jure elements leads to different country assessments by the three measures. The example of the coding of the US highlights how the inclusion of de facto attributes can be a main driver behind different ratings across indices. Empirical researchers planning to work with democracy measures hence need to contemplate what degree of de facto and de jure attributes is appropriate for their research.
Throughout the paper the loss of variation in particular for countries at the very top or bottom of the scales has been discussed. The two country studies in the previous section highlighted this for Polity2 and FHI in the US, as well as for the suffrage dimension in EEAC. The latter example raises the question of whether suffrage today is even an important indicator to include in a measure of democracy as there is little/no geographical variation. Figure 11 displays average shares of population with suffrage by region. The graphs show little or no variation in the last decade of the time series but a lot of variation in the first half of the 20th century. Thus the question posed above can be amplified in scope by asking: how should democracy measures adapt to the changing importance of certain dimensions of democracy over time? The share of population with suffrage has been an important dimension of democracy. It helped to distinguish between different kinds of regimes and to capture some extent of the people’s options to participate in the political process. Today, any new polity coming into existence will find it difficult to allocate suffrage to white adult males only, for example. The share of the population with suffrage is not as helpful in distinguishing between different polities today as it was 50 years ago. It goes well beyond the scope of this paper to provide a solution to the changing importance of certain democracy dimensions over time. Nevertheless, it is within the scope of this paper to point out that V-Dem excels at providing very precise and clear-cut distinctions between a large number of dimensions. By providing the disaggregate data it also gives the empirical researcher the opportunity to include or disregard dimensions as needed.
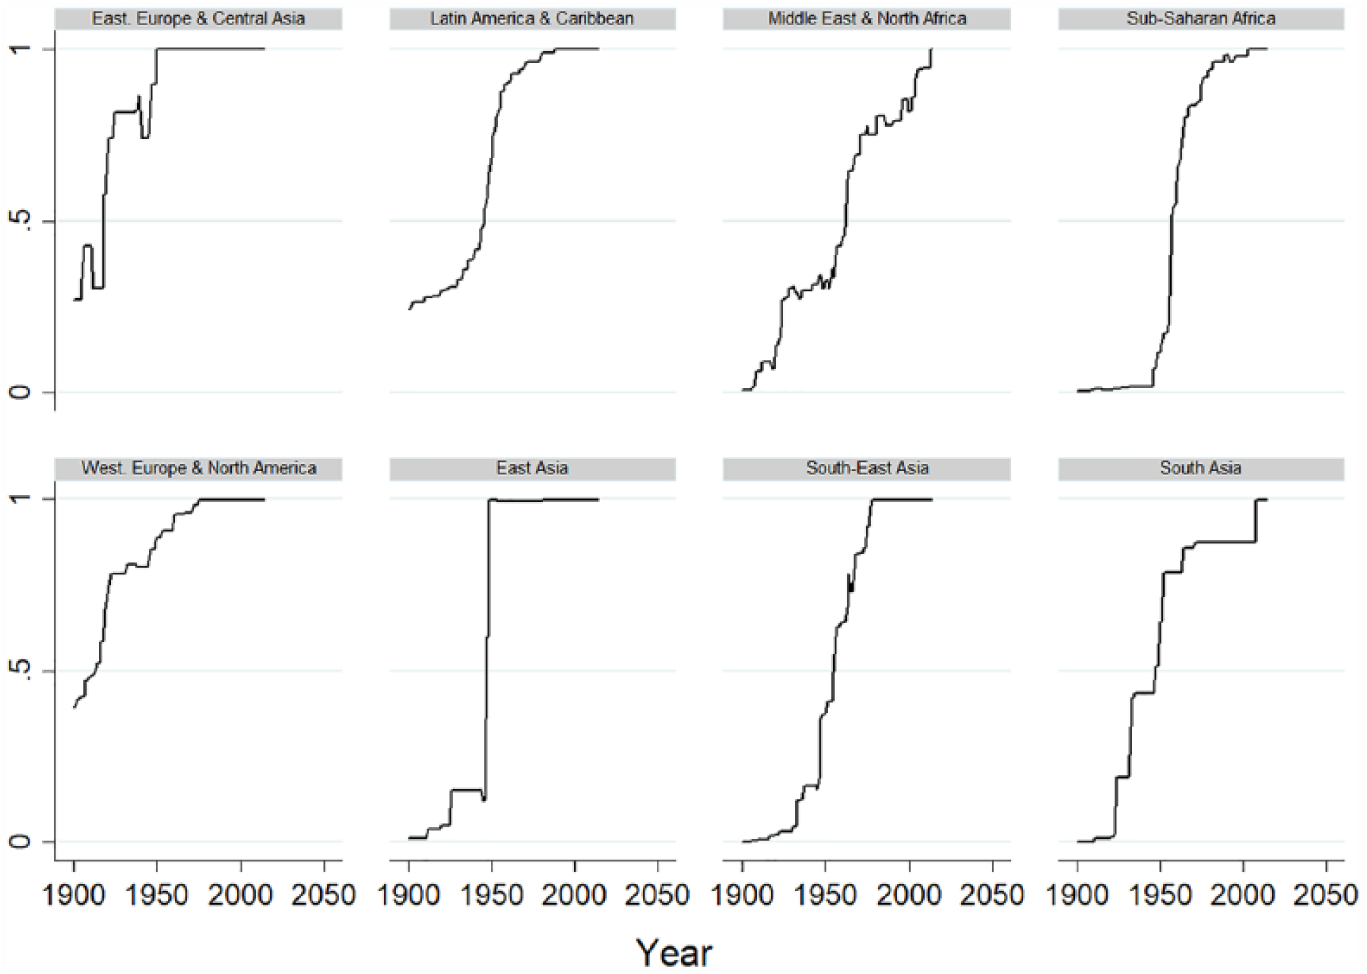
Average regional shares of population with suffrage, 1900–2016.
Conclusion
This paper compares the three most commonly used democracy datasets: PolityIV, Freedom House, and V-Dem. In a first step, it analyzes their respective democracy measures’ underlying definition, their measurement scale, their data collection, and the theoretical justification of their aggregation procedure to assess their validity and reliability. In addition, important strengths and weaknesses of each measure are discussed. The democracy indices from the V-Dem dataset surpass the other two democracy measures in all areas mentioned above. In a second step, this article compares the indices’ respective coding of those observations included in all three datasets. There is a relatively high level of agreement in the country coding as well as in the country ranking between the indices for these cases. In conclusion, the most substantial differences between the indices lie in their coverage, the availability of disaggregate data, and the above mentioned key areas. These are the central aspects for scholars to consider when choosing a democracy measure for their research.
Last but not least, the massive efforts undertaken and the equally enormous contributions of each of the three data projects discussed should be underlined. As stated in previous sections, each data project originated with quite different objectives and at different times. The first V-Dem dataset was released about 40 years after the first Polity and Freedom House data came out. In addition, it had been prepared by scholars familiar with the Polity and Freedom House data who knew the caveats and pitfalls of these datsets by heart. The V-Dem project was able to build its data on the foundations of scientific discourses about empirical democracy measurement since the introduction of Polity and Freedom House data. By offering extensive documentation, disaggregate data, and sensitivity to new information through the Bayesian item response models, the V-Dem data are optimally equipped to become the new standard in democracy measurement and to adapt to future challenges.
Supplemental Material
IAS815571_appendix – Supplemental material for How (not) to measure democracy
Supplemental material, IAS815571_appendix for How (not) to measure democracy by Vanessa A Boese in International Area Studies Review
Footnotes
Acknowledgements
I would like to thank two anonymous reviewers, and Scott Gates, Carl Henrik Knutsen, Håvard Strand, Katharina Lehmann-Uschner, Steffen Elstner, Karim Diebold, and the participants of the Oxford Development Economics Workshop 2017, as well as those of the DENeB discussion round 2017 for excellent comments and suggestions. All errors are my own.
Funding
The author obtained funding from the Cusanuswerk as well as from the Wirtschaftswissenschaftliche Gesellschaft of the School of Business and Economics of Humboldt-Universität zu Berlin.
Supplemental material
See the online appendix.
Notes
References
Supplementary Material
Please find the following supplemental material available below.
For Open Access articles published under a Creative Commons License, all supplemental material carries the same license as the article it is associated with.
For non-Open Access articles published, all supplemental material carries a non-exclusive license, and permission requests for re-use of supplemental material or any part of supplemental material shall be sent directly to the copyright owner as specified in the copyright notice associated with the article.