
Abstract
Existing literature focuses on the evaluation of the readability of annual reports of non-banking companies. However, banking companies’ opaque nature and a double motivation to abuse accounting discretion requires a separate study on the readability of banks’ annual reports in association with their performance. We, therefore, attempt to explore firm performance and readability of banking firms’ annual reports in India. Net interest margin (NIM) and Fog Index are used as performance and readability variables respectively. We find that management discussion and analysis (MD&A) of the Indian banks is difficult to read. However, when we compare it with existing literature, Indian banks’ MD&A is difficult but not unreadable. Panel data regression analysis shows that firm performance would have a negative impact on the Fog Index. Further analysis of good and weak performing banking firms shows that the effect of NIM on Fog Index is higher in the case of weak performing banks. Empirical results affirm that firms with weak performance would structure their annual reports to veil adverse information in unfavourable situations. Consistent with the opaque nature of banks and incomplete revelation, managers of banks make MD&A harder to read to cover up the causes of weak performance. Application of readability index in case of banking companies in an emerging economy in association with performance is the contribution of this paper. An assessment of the readability of annual reports is an interesting topic for research to better understand the recent negative developments in Indian banking industry such as high non-performing assets, continuously declining return on assets, sharp increase in banking frauds and poor governance.
Keywords
Introduction
The performance of banking companies and their financial condition usually indicates the financial health of an economy. Corporate disclosures along with financial statements are critical for investors, deposit holders and regulators to understand the financial performance and condition of banking companies. Corporate disclosures in annual reports are in the form of Chairman’s Statement, Directors’ Report, President’s Note, Management Discussion and Analysis (MD&A), audit report and footnotes to financial statements. However, in some cases, such disclosures are difficult to read. Warrant Buffet (SEC, 1998) notes, ‘… for more than forty years, I’ve studied the documents that public companies file. Too often, I’ve been unable to decipher just what is being said or, worse yet, had to conclude that nothing was being said’. Similarly, Arthur Levitte (SEC, 1998), then the SEC chairman, notes, ‘Because many investors are neither lawyers, accountants or investment bankers, we need to start writing disclosure documents in a language investor can understand’ (p.3). The analysis of the readability of corporates disclosures in annual reports thus becomes a key area of research. Readability refers to the ease of reading and understanding a written text (Harris & Hodges, 1995). A document with long sentences, passive voice, superfluous words and legal and financial jargon is difficult to read whereas a document with short sentences and easy to understand words is an easier document to read.
Using readability indices, the existing literature evaluates the readability of different corporate disclosures (Hrasky, Mason, & Wills, 2009; Jones & Shoemaker, 1994; Pashalian & Crissy, 1950; Soper & Dolphin, 1964). It also relates positive earnings with easier to read corporate disclosures and negative earnings with harder to read corporate disclosures (Bloomfield, 2002; Li, 2008). The readability of corporate disclosures in different industries could be diverse due to difference in the levels of complexity of products and services (Li, 2008). This paper aims to analyse the effect of banking companies’ earnings performance on the readability of their MD&A. We have selected the MD&A section of annual reports as it is the most read and frequently used disclosure in annual reports (Tavcar, 1998).
Unlike non-banking companies, banking companies have two motives to abuse accounting discretion. Banks abuse accounting discretion to meet the regulatory capital requirements or earnings thresholds or both (Beatty, Chamberlain, & Magliolo, 1995; Collins, Shackelford, & Wahlen, 1995). The opaque nature of banking companies and the two motives for abusing accounting discretion are the reasons for selecting banking companies for this study. The opaque nature (Dang, Gorton, Holmstr0m, & Ordonez, 2017; Howe & Haggard, 2012) is a unique feature of banks as compared to industrial companies. Consistent with the opaque nature of banks, banking companies were exempted from full disclosures of financial reports until 1974. The higher cost of improved transparency and quality of accounting information are causes of the opaque nature of banks. If banks were fully transparent, it would reduce the ability of banks to raise funds from deposit holders, thereby raising concerns over liquidity. This is in contrast with the positive effects of higher accounting quality and improved transparency in resolving the agency problem in non-banking companies. The opaque nature of banks may impact disclosures in the annual reports adversely, making annual reports difficult to read. The fact that such obscurity and secrecy is an acceptable attribute of banks, it may motivate the managers to write unreadable disclosures in annual reports. The present literature reveals the existence of earnings management practices in Indian banking industry (Kumari & Pattanayak, 2017). As documented by Kumari and Pattanayak (2015), accounting for bad loans and gains or losses on asset sales are two big items which depend on the managers’ discretion. Hence, they may indulge in writing difficult to read and sometimes, even unreadable disclosures in the annual report to hide such discretionary accounting judgments from the creditors (deposit holders), investors and other stakeholders of banks. We expect the readability of the MD&A of banking companies to be different as compared to that of industrial companies due to the opaque nature of banks and the double motive of earnings management.
We select the MD&A of banks to evaluate their readability because it is an important source of information in understanding the positive and negative developments of banks and the effect these developments have on the financial performance and financial condition of the banks. In India, the recent negative developments in banking industry include high non-performing assets (NPAs), continuous decline in return on assets, sharp increase in banking frauds and poor governance. India’s NPAs are some of the worst in the world, ranking 5th with 9.98 per cent loans according to International Monetary Fund. 1 According to a Report on Trend and Progress of Banking in India of Reserve Bank of India, the return on assets in banking industry was lowest among all emerging and developing countries and it has declined continuously during 2010 to 2017. 2 The report also warns about the sharp increase in the number of frauds in various banks in India from ₹101,708 million during 2013–14 to ₹411,677 million in 2017–18. One of the possible reasons for such high NPAs and banking frauds resulting in decline in the return on assets is the poor governance of banks. Discussion and understanding of such serious issues are vital to understanding the financial performance and financial condition of banks. As MD&A also discusses these issues, the assessment of readability of the MD&A of banking companies enables the regulator, the deposit holder and the investor to better evaluate the banks. Therefore, the evaluation of readability of annual reports of Indian banking companies is an interesting subject of research to improve the understandability of disclosures and to reduce asymmetric information in banking industry.
The readability analysis of MD&A in this paper is based on all 39 banking companies listed on National Stock Exchange (NSE) between 2013–14 and 2016–17. The list consists of 21 state-owned banks and 18 private banks. We applied Fog Index to measure the readability as used in recent studies (Li, 2008; Lim, Chalmers, & Hanlon, 2018; Lo, Ramos, & Rogo, 2017). We also applied Flesch Readability Ease Index (FREI) as an alternative measure of readability to check the robustness of the results. We use net interest margin (NIM) as the performance indicator. We ran panel data regression to analyse the impact of the current-year performance on the readability of MD&A of banking companies.
We find mean Fog Index and FREI as 15.87 and 37.26, respectively, indicating that Indian banking firms’ MD&A are difficult to read. However, when we compare these with firms from the USA and 42 other countries, which have a Fog Index above 18 (Lang & Stice-Lawrence, 2015; Li, 2008), Indian banking firms’ MD&A are difficult to understand but not unreadable. Secondly, we find that NIM has a significant negative effect on the Fog Index of readability (higher Fog Index means difficult to read). We also find that NIM has a significant positive effect on FREI (lower FREI means difficult to read). This means that disclosures of poor (good) performing banking companies are harder (easier) to read. We provide evidence to support that Fog Index is influenced by firm performance, and that firms structure their annual reports to veil adverse information in unfavourable situations. This is in line with incomplete revelation hypothesis (Bloomfield, 2002). This paper makes two contributions which are as follows:
First, understanding and exploring the relationship between readability of annual reports with firm performance, specifically in the context of the banking sector within a developing economy. Second, we ascertain that the readability of the annual reports of Indian banking companies is difficult but not unreadable. We suggest banking companies to reduce the difficulty level and improve the readability of these reports.
The remainder of the paper is as follows. We review the literature and propose two hypotheses in Section 2. Methodology is discussed in Section 3. Thereafter, we present and discuss the results in Section 4 and conclusions are in Section 5.
Literature Review
Research on the readability of disclosures in annual reports of firms has a long history. Pashalian and Crissy (1950), Soper and Dolphin (1964), Smith and Smith (1971), Dolphin and Wagely (1977), Adelberg (1979), Lewis, Parker, Pound and Sutcliffe (1986) and Jones and Shoemaker (1994) analysed the readability of corporate annual reports by undertaking analysis of the separate items of corporate annual reports such as Chairman’s Statement, Directors’ Report, President’s Note, MD&A, audit reports and footnotes to financial statements.
These disclosures in annual reports provide relevant information to the stakeholders of the companies in understanding the reasons for current-year financial performance and financial position of the company. The disclosures also guide them in estimating the future performance, financial position and cash flows at different levels of risk. A few important factors that influence Indian banks’ financial performance and financial condition are the global economic scenario, macro environment, Indian banking industry, performance with a focus on operating revenues and expenses, loans and advances, deposits, assets quality including non-performing assets, capital adequacy ratios, risk management and financial inclusiveness. The MD&A of banking companies contains a detailed discussion on these factors and their effect on the current-year performance and financial condition of banks. MD&A plays a vital role in better understanding the figures presented in the current---year income statement, cash flow statement and balance sheet as it is an important part of the annual report and its readability is essential for the deposit holders and investors. The evaluation of readability of annual reports is therefore vital in understanding the current and future financial performance and position of a bank.
Using Fog Index as a readability measure, Li (2008) related the readability of annual reports of a large sample of American companies to their earnings performance in the current and subsequent years. The Fog Index of a document states the number of years of formal education required for an average reader to understand the document in first reading. Li’s study finds a negative and significant impact of current-year earnings performance on the readability index of disclosures. It also finds a negative and significant impact of the current-year readability index of disclosures on the earnings performance of the subsequent year. It means that the annual reports from firms with lower earnings in the current year are difficult to read and these firms would have lower earnings in the subsequent year.
Prior to Li’s paper, Subramanian, Insley and Blackwell (1993) found that annual reports of profitable corporations are easier to read as compared to those of unprofitable corporations. A better quality of readability is also linked with greater capital investment efficiency (Biddle, Hilary, & Verdi, 2009), with higher trading of shares by small investors (Miller, 2010) and with higher investment holdings by retail investors (Lawrence, 2013). Chipalkatti (2005) relates more readable disclosures of Indian banking companies with a positive perception of investors.
Bloomfield (2002) related easier to read corporate annual reports during positive earnings and harder to read corporate annual reports during negative earnings with ‘incomplete revelation hypothesis (IRH).’ IRH predicts that managers attempt to manipulate market prices by emphasizing good news and tucking bad news in footnotes. It implies that managers hide bad news related to earnings performance of the current year and subsequent year in difficult to read footnotes to financial statements and the MD&A of annual reports. Consistent with IRH, managers make disclosures harder for the investors to uncover information if they do not want to affect their firms’ stock prices negatively. Such harder to read disclosures may relate to:
Managers’ decision to change the accounting methods to improve highly visible statistics such as reported profit-after-tax, earnings-per-share, return-on-assets, debt-to-equity ratio, leverage ratio, current ratio, etc. Managers’ decision to conceal the expenses, capitalized revenue expenses, provisions, contingencies and liabilities. Managers’ unreliable guidance about future sales orders, capital expenditure projects, cash flows, dividend, internal and external risk factors.
The major disclosures in a corporate annual report are MD&A, auditors’ report, notes to financial statements including significant accounting policies and corporate governance. Tavcar (1998) says that MD&A is arguably the most read and most important component of the financial section. Knutson (1993) and Rogers and Grant (1997) observed that sell-side financial analysts in the USA most frequently rely upon MD&A among all disclosure items of the annual report. Similarly, the concept notes of the USA’s Securities Exchange Commission (SEC) state:
3
The Commission has long recognized the need for a narrative explanation of the financial statements, because a numerical presentation and brief accompanying footnotes alone may be insufficient for an investor to judge the quality of earnings and the likelihood that past performance is indicative of future performance. MD&A is intended to give the investor an opportunity to look at the company through the eyes of management by providing both a short-term and long-term analysis of the business of the company. The item asks management to discuss the dynamics of the business and to analyse the financials.
This makes MD&A an important and useful disclosure for investment and credit decisions.
For this paper, we have considered the MD&A section of the annual reports of banks for a readability analysis. As per Securities and Exchange Board of India (Listing Obligations and Disclosure Requirements) Regulation, 2015, 4 the annual report shall contain MD&A as a separate item or part of Directors’ Report. There are many studies on the readability of different items of corporate annual reports in association with earnings performance based on developed markets. However, there is no literature on the analysis of readability of MD&A in association with earnings performance of banking companies, specifically in a developing economy.
Therefore, we propose to test the following two hypotheses:
H1: MD&A of banking companies is unreadable. H2: Earnings performance of the current year would have a negative impact on the readability index of the MD&A of the current year.
We expect the results to be different from the existing studies such as Li (2008) and Lang and Stice-Lawrence (2015) due to the opaque nature of banking companies and dual motives of earnings management.
Methodology
Sample Firms
The sample comprises of 39 banks, 21 state-owned and 18 private, which were listed on the National Stock Exchange (NSE) of India as of 31 March 2017. All these banks are considered for this study, which covers the period between 2013–14 and 2016–17.
Proxies of Readability
We use Fog Index to measure the readability of the MD&A of the annual reports of banks. The computation and interpretation of Fog Index are as follow:
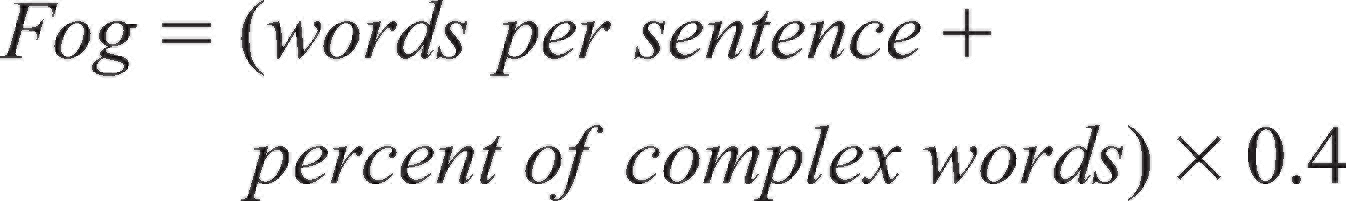
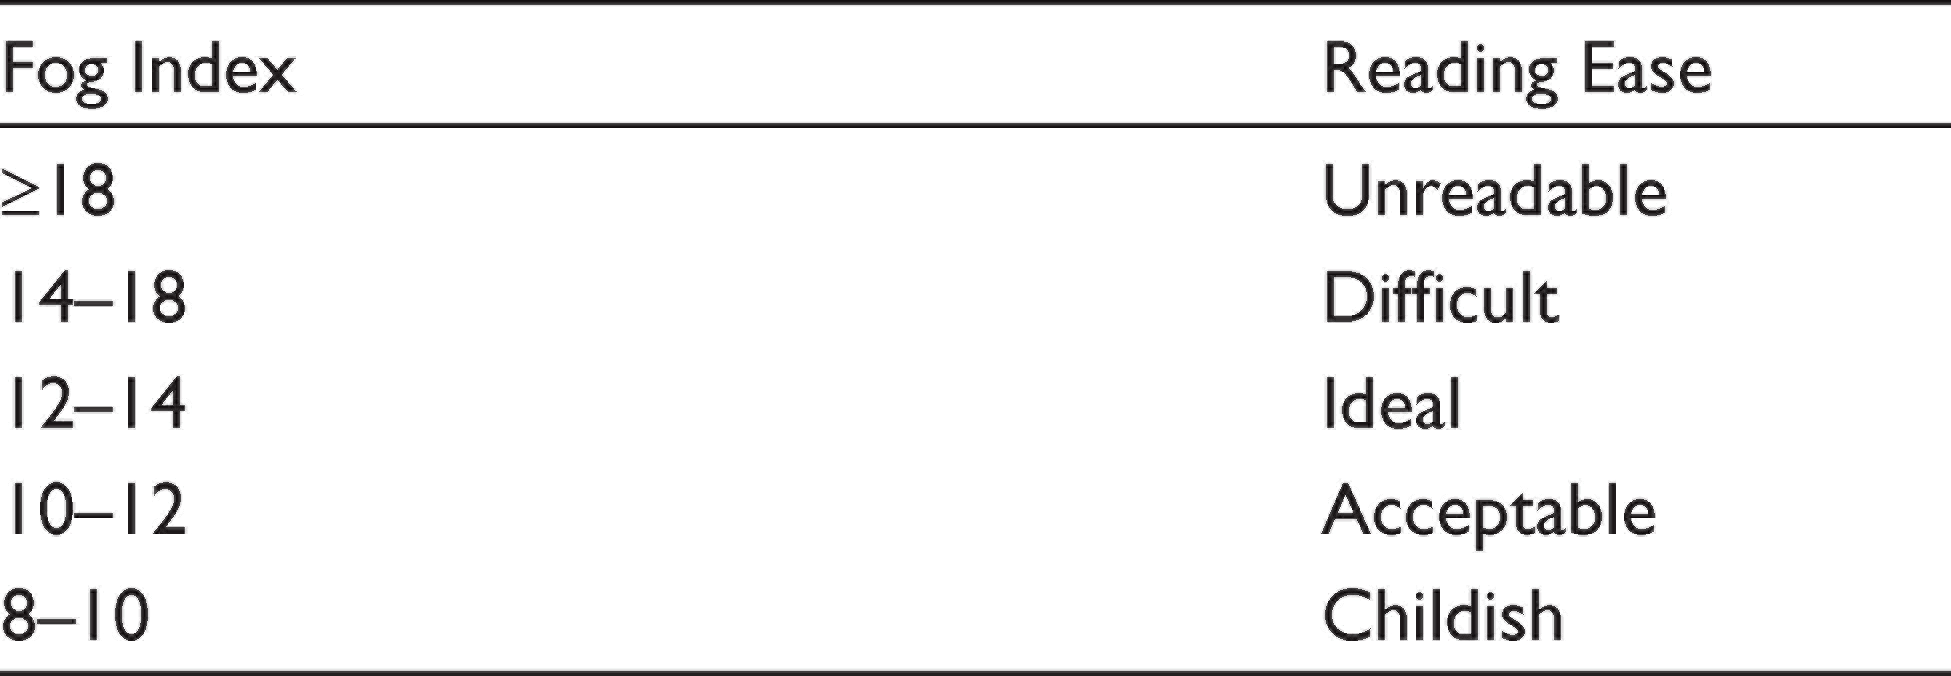
Fog is a composition of a number of words per sentence and the percentage of complex words in that sentence. More complex words and long sentences would mean the MD&A is difficult to read. The words per sentence are calculated as a proportion of total number of words to the number of sentences in MD&A. A word is complex if it has three or more syllables. Recent examples of studies using Fog Index for readability include Li (2008), Biddle et al. (2009), Miller (2010), Lehavy, Li and Merkley (2011), Dougal, Engelberg, Garcia and Parsons (2012), Lawrence (2013), Lo et al. (2017) and Lim et al. (2018). The interpretation of the Fog Index is presented in Table 1. We use Lingua Fathom software to calculate the readability scores.
Fog Index Description and Interpretation
Flesch Reading Ease Index Scores Description (FRES) and Interpretation
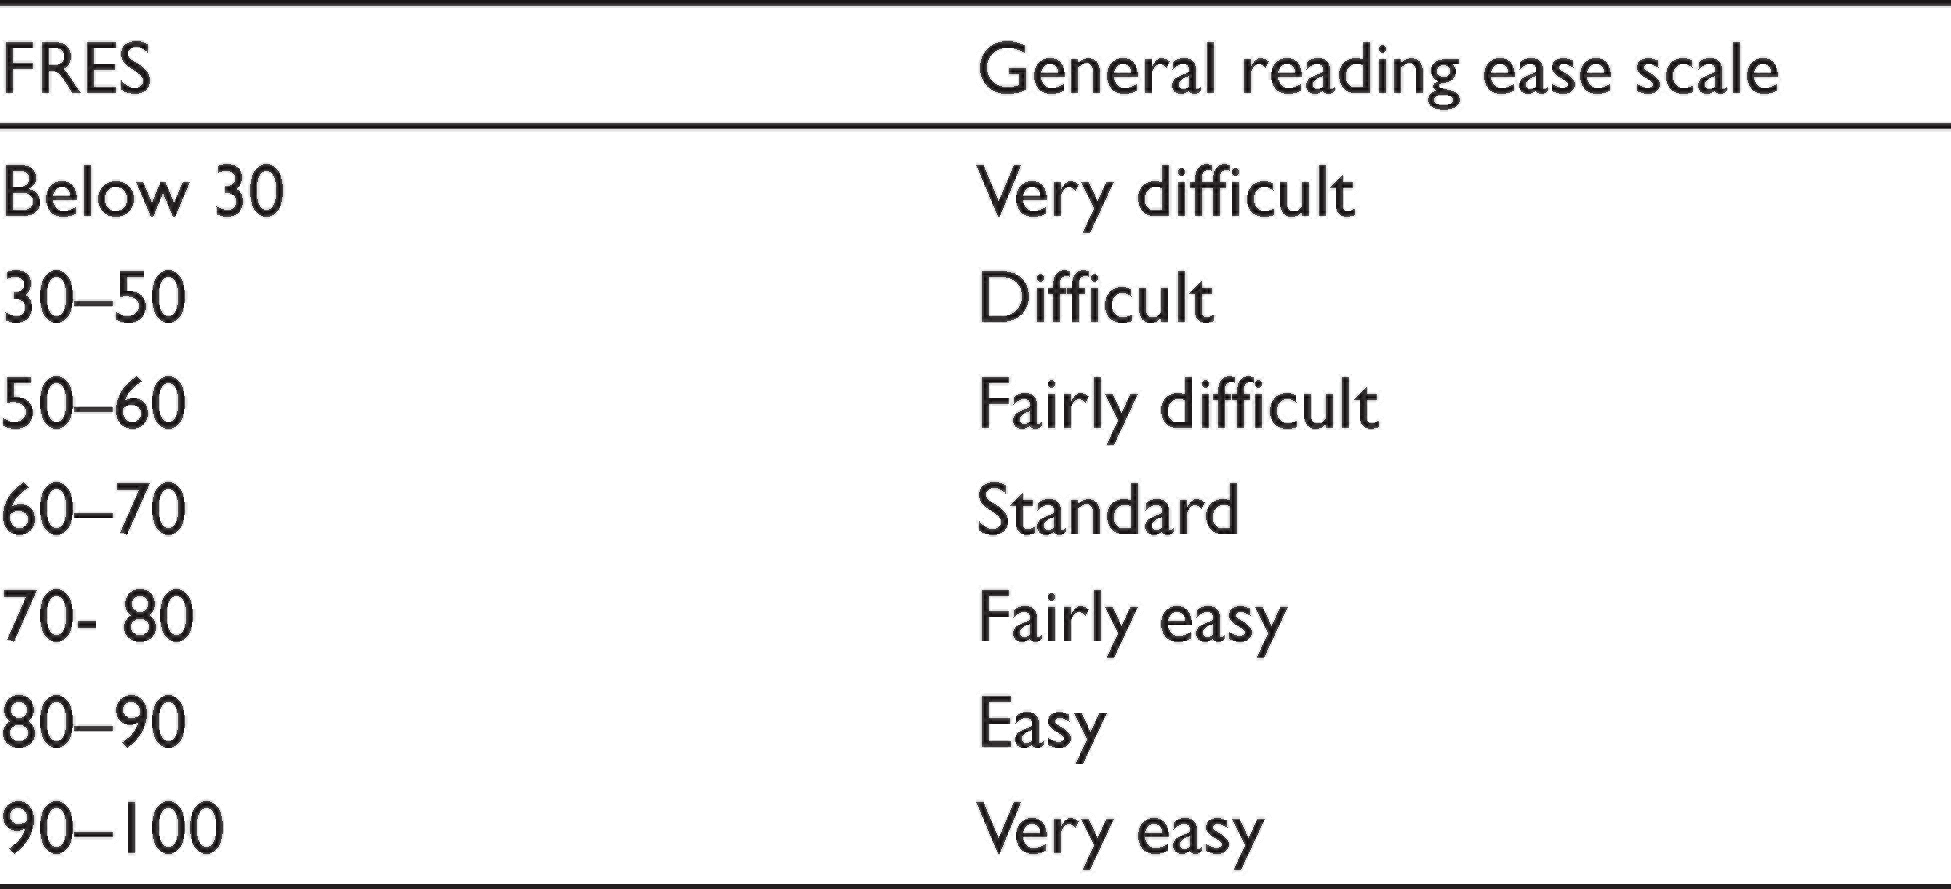
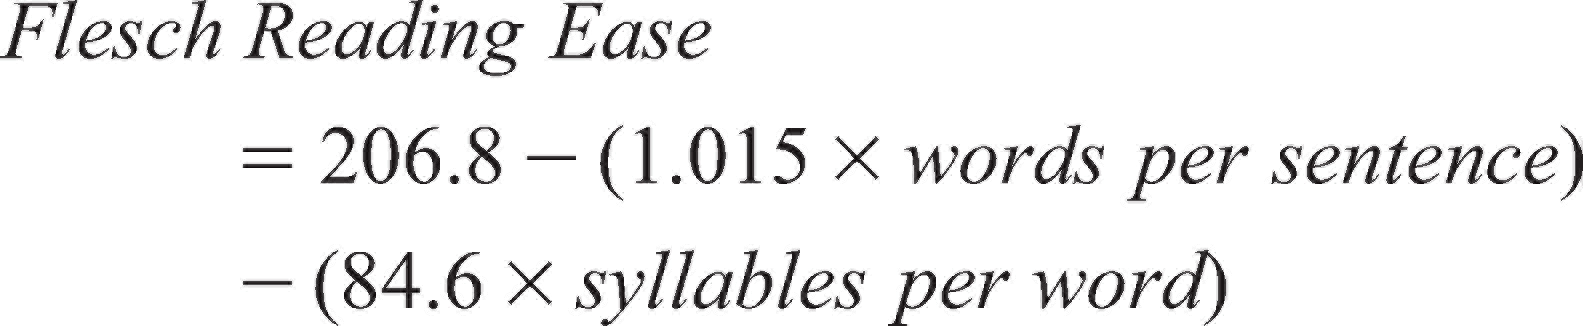
We used Flesch Reading Ease index (FREI) as an alternative measure of readability. The interpretation of FREI is presented in Table 2. FREI is calculated as follows:
The annual reports of the sample banking companies are downloaded from the websites of sample firms in PDF format and MD&A from each annual report has been converted into a word document. The word document of each sample firm-year has been then edited to remove all tables, figures, pictures, headers, footers, list of contents and abbreviations table from the MD&A before using the text for computation of readability score. The financial data of the sample was downloaded from the Prowess database of Centre for Monitoring Indian Economy (CMIE).
Net Interest Margin as Performance Indicator
We used NIM as a performance variable. NIM is the difference between interest income and interest expense as a percentage of the total assets in the beginning of the year. Several studies in India and abroad use NIM as a performance variable in banking literature (Boubakri, Cosset, Fischer, & Guedhami, 2005; Boyacioglu, Kara, & Baykan, 2009; Chantapong, 2005; Drakos, 2003; Kao & Liu, 2004; Saksonova, 2014; Saunders & Schumacher, 2000; Sensarma & Ghosh, 2004; Wong, 1997).
Other variables
Non-Interest Income Ratio: It is the ratio of non-interest income (NII) to the total income of a banking company. NII comes primarily through collection of fees for various services such as deposit account management services, credit-related services, financial leasing services, trade finance related services, payment and money transmission services, fund management services, financial consultancy and advisory services, underwriting services, clearing and settlement services, securities trading services and other financial services. In India, NII ratio is 28.973 per cent as per World Bank database. 5 It is a major source of income for the improvement of overall performance of banking companies. Pennathur, Subrahmanyam and Vishwasrao (2012) found that fee-based income significantly reduces risk in profitability and default risk of Indian banking companies. Thus, NII appears to benefit the banking companies. Based on incomplete revelation hypothesis, we predict that banking companies with lower (higher) NII ratio may make their MD&A difficult (easy) to read. Therefore, we predict a negative correlation between NII ratio and Fog Index of readability.
Non-Performing Loan Ratio: Non-performing loan (NPL) ratio is the ratio of gross non-performing loans to total gross loans. NPL is one of the biggest challenges of the banking sector in India and other emerging countries. Chief Economic Advisor Arvind Subramanian said, ‘the worsening problem of bad loans is India’s primary macroeconomic challenge’. 6 Bad loans are deducted from the total income of banking companies to arrive at the profit. Hence, increase in bad loans deteriorates the performance. Increase in bad loans and decrease in performance may make managers indulge in writing the MD&A in a difficult language to avoid the attention of the reader. Therefore, we predict a positive correlation between NPL and Fog Index of the MD&A.
Age: Age is defined as the number of years a sample company is operating from its incorporation. Older firms may present different MD&A because there is less information asymmetry and less information uncertainty. If investors are aware of the performance and financial condition of the banks from the available historical information, the MD&A of older banks will be easier to read. Therefore, we predict that the older (younger) the bank, the easier (harder) the MD&A would be to read.
Length: The length of MD&A is measured in the number of words it contains. According to Loughran and McDonald (2014), when a small sample of partners of major accounting firms are polled and asked how they would legally attempt to obscure some information whose disclosure is required, the partners immediately identified the strategy of burying the awkward revelation in an overwhelming amount of uninformative text and data. Loughran and McDonald (2014) find that documents which are harder to read are bigger and the documents which are easier to read are smaller in size. Therefore, we predict that lengthier MD&A would be difficult to read.
Panel Data Regression
We propose a panel data regression model to identify the impact of the current-year performance of banking companies on the readability of MD&A disclosed in their annual reports. We have initially set return on assets, NIM, efficiency ratio, NII ratio, provisions and contingencies, non-performing assets, capital adequacy, size, age and the number of words in the MD&A as explanatory variables for Fog and FREI indices of readability. However, when we checked for variance inflation factors, we found multicollinearity among the regressors. Therefore, certain variables had to be dropped from the model. Finally, we took NIM as a performance variable and NII ratio, NPL, age and number of words as explanatory variables in our panel data regression model.
Further, to examine if the impact of NIM on Fog is different for good performing banks and weak performing banks, we used stepwise regression. For this purpose, we divided our sample based on the median value of NIM. Banking firms with NIM above the median are considered good and NIM below the median are considered as weak performing firms.
Results and Discussion
Readability of MD&A of Banking Companies
We start our analysis with descriptive statistics, which are shown in Table 3. The mean of NIM is 2.44 per cent with a maximum and minimum of 7.95 and 0.015 per cent, respectively. The Fog Index of the sample banks has a mean value of 15.87 with a minimum value of 10.83 and a maximum value of 20.69. The median of Fog is 15.73. The general norm is if Fog Index is in the range of 14–18, the annual reports are difficult to read, whereas a Fog Index above 18 would mean the annual reports are unreadable. An average of 15.87 would mean that the MD&A disclosed in the annual reports is difficult to read. The mean and median Fog Index of MD&A of US companies is 18.23 and 17.28 respectively (Li, 2008). This indicates that the mean Fog Index of Indian banking companies is much lower as compared to those of US companies. The mean Fog Index of annual reports of non-US companies based on a large sample of 87,608 annual reports from 42 countries including India and other emerging countries is 19.520 (Lang & Stice-Lawrence, 2015). The Fog Index of the MD&A of Indian banking companies is lower and they are easier to read than those of the US and non-US companies.
Descriptive Statistics
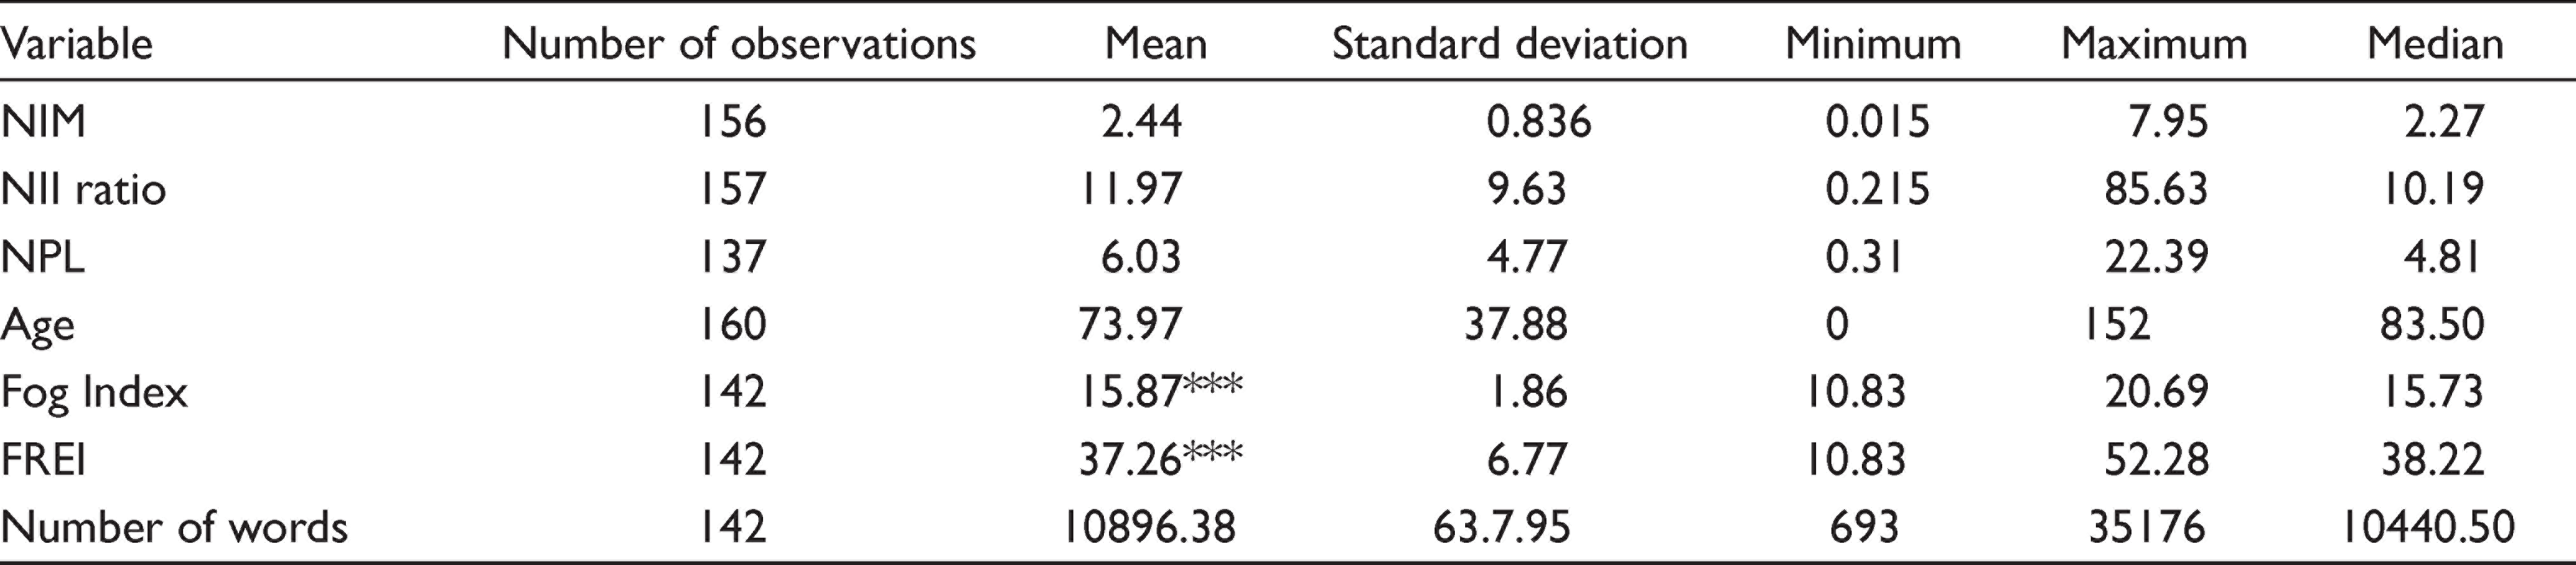
*** Significant at one per cent. For testing the significance of mean of Fog Index and FREI for less than 18 and more than 30.
The findings based on FREI, an alternative measure of readability, are also similar to the findings of Fog Index. We applied one sample t-test to examine whether the mean of Fog Index is significantly lower than 18 and whether the mean of FREI is significantly higher than 30. We observed that the mean of Fog Index of Indian banks is significantly less than 18 and the mean of FREI of Indian banks is significantly greater than 30. Thus, the readability of the MD&A of our sample banks is difficult but they are not unreadable. Therefore, we reject the first hypothesis (H1).
The possible reasons for a lower Fog Index and higher FREI of banking companies could be due to the comprehensive legal system. In India, banks are regulated by the Reserve Bank Act, 1934, Banking Regulation Act 1949, Banking Companies (Acquisition and Transfer of Undertakings) Act of 1970 and 1980, Prevention of Money Laundering Act, 2002, Securitization and Reconstruction of Financial Assets and Enforcement of Security Interest Act, 2002 in addition to the new Companies Act, 2013 and the guidelines of the Securities Exchange Board of India. Appointment of statutory auditors for banking companies and the requirement of Long Form Audit Report (LFAR) by the Reserve Bank of India could be other reasons for better readability of the MD&A of Indian banking companies.
Impact of Operating Performance on Readability of MD&A
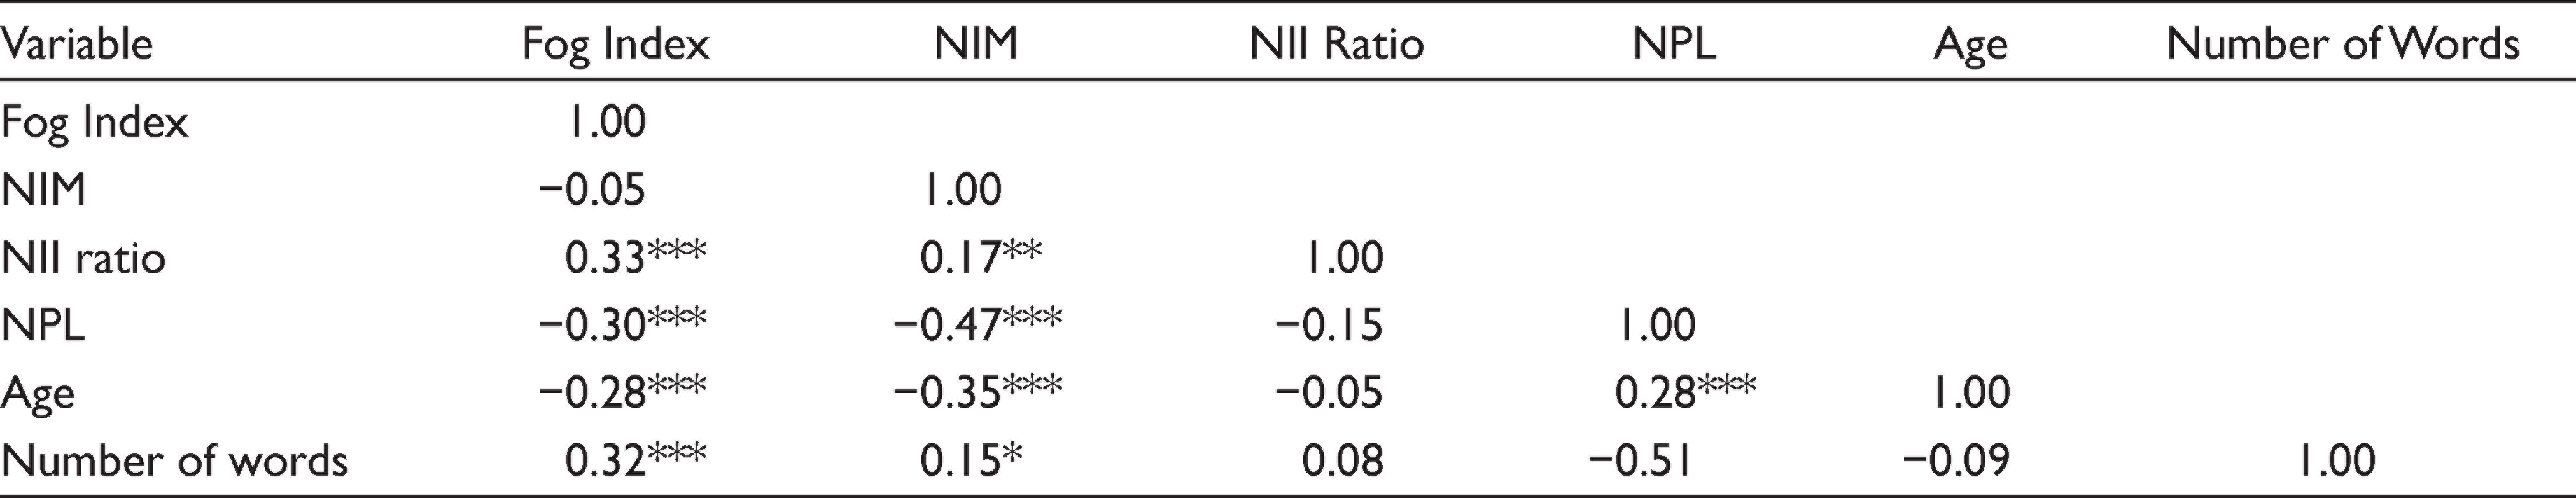
The correlation matrix as presented in Table 4 shows that NIM, NPL and age have a negative correlation with Fog Index. The correlation matrix also shows NII and the number of words in the MD&A have a positive correlation with Fog Index. This conveys that higher NII and higher number of words result in a harder to read MD&A.
Correlation of the Variables
We ran pooled regression to analyse the impact of the performance and other explanatory variables on Fog Index; the results are presented in Table 5. The p-values of the regression show that the model is a good fit. The results show that NIM has a negative impact on Fog Index of the MD&A of Indian banking companies, and it is significant at one per cent. It means that the MD&A of underperforming banking companies are harder to read, and the MD&A of better performing banking companies are easier to read. These results, based on statistics pertaining to Indian banking companies, are consistent with the findings of existing studies (Lang & Stice-Lawrence, 2015; Li, 2008). This also implies that when the performance of banks is low, banks indulge in obfuscation of data and its analysis, which results in a difficult to read MD&A in their annual reports. In contrast to this, better performing banks disclose a MD&A that is easier to read. This significant negative relation between performance and Fog Index is in line with the incomplete revelation hypothesis (Bloomfield, 2002). We have also used FREI as an alternative measure to check the robustness of our findings.
Fog Index and Firm Performance
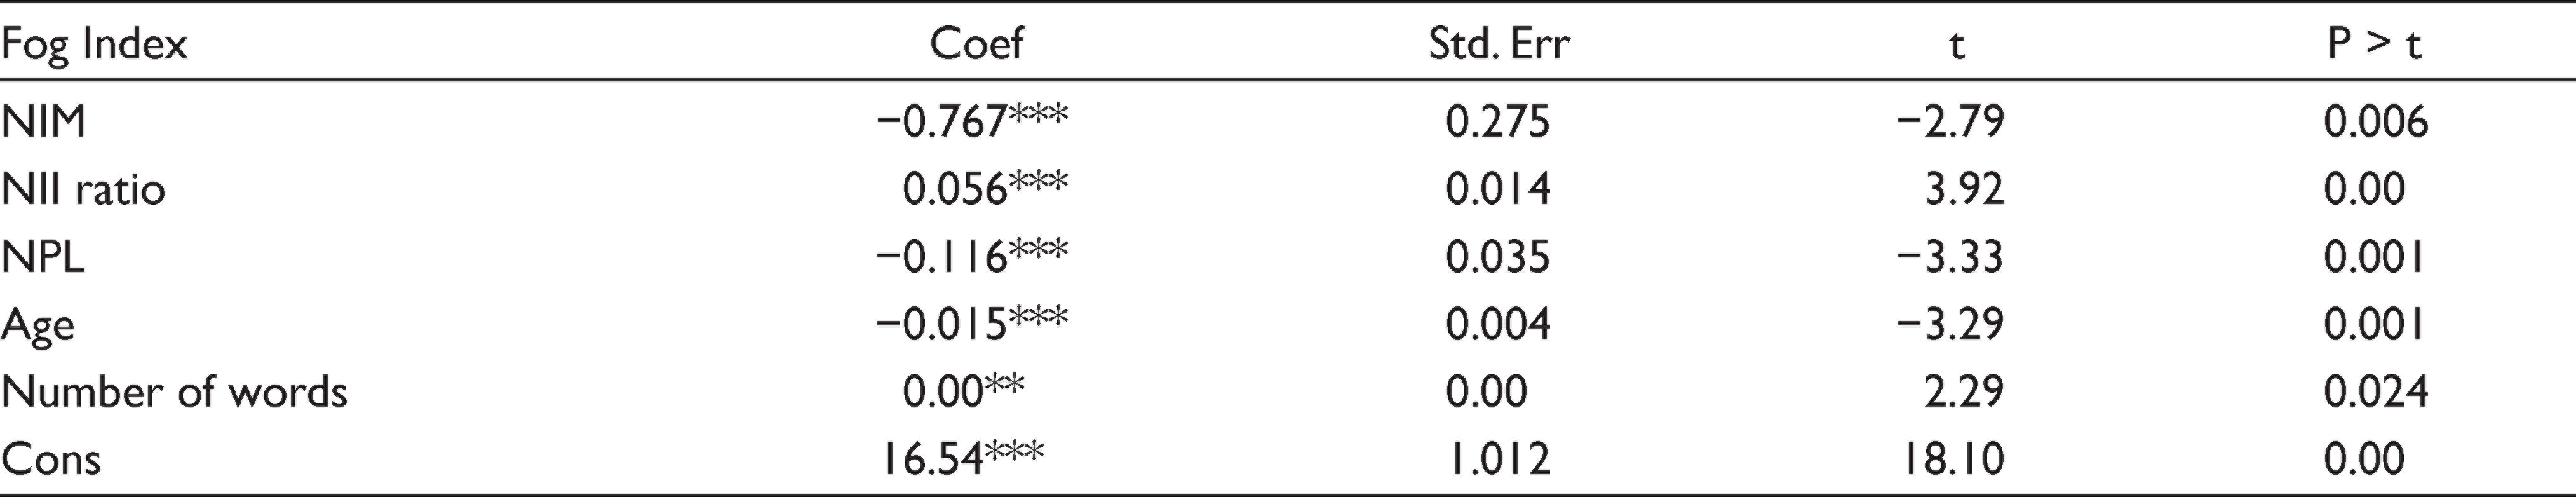
Number of observations: 123; F = 11.21; Prob > F = 0.00; R-squared = 0.3238; Adj. R-square = 0.2950
As predicted, we found negative impact of the age of banking companies on Fog Index and it is significant at one per cent. This means the MD&A of new firms are harder to read and less transparent. In other words, older banking companies present their MD&A in easier to read language and a more transparent format. In India, most of the older banks are public sector banks and most of the younger banks are private sector banks. Therefore, we could say that MD&A of public sector banks is presented in easy language. It may be due to the transparency of public sector banks, policies of the Reserve Bank of India and the compulsory audit conducted by the Comptroller and Auditor General of India, which are applicable only to the public sector banks.
Contrary to our prediction, we found a significant positive impact of NII ratio on Fog Index at one per cent. This indicates that the MD&A of banking companies with higher NII is harder to read and the MD&A of banking companies with lower NII is easier to read. Generally, the NII ratio would have many elements, hence, the readability would be difficult when compared to NIM, which includes interest received on loans and interest paid on deposits. As more fee-based services are offered, the technical terminology used in the annual reports may make them more difficult to read. Contrary to our prediction, we find a significant negative impact of NPL on Fog Index. It means that the MD&A of banking companies with lower NPL are harder to read and vice versa. We could not find any impact of number of words of MD&A on Fog Index as the coefficient is zero.
Although the regression results are significant, these results could be affected due to differences in composition of sample consisting of public sector and private sector banks. The Wilcoxon rank sum test showed that there is a significant difference in the medians of the Fog Index of private and public sector. The results are presented in Table 6. In the pooled regression, only the time variable is invariant, hence, we propose to control for differences in the groups and year effects by using fixed effects model. We also ran random effects model, which assumes that the error term is not correlated with the regressors and that the variation across entities is random. Later, we apply Hausman test to understand if the fixed effects model is or the random effects model is better; our test results indicate that the fixed effects model is better. The results of the fixed effects model are presented in Table 7. These results are also similar to the pooled regression presented in Table 5. In this model, too, we find NIM to be significant at one per cent. We further use FREI as an alternative measure to check the robustness of our findings. For FREI also our Hausman test results suggest that fixed effects model is better. As presented in Table 8, the findings based on FREI are also similar to Fog Index.
Wilcoxon Rank Sum Test

Significant at 1% z = −4.428; there is a significant difference in median of the Fog Index for public and private sector banks
Fog Index and Firm Performance Fixed Effects
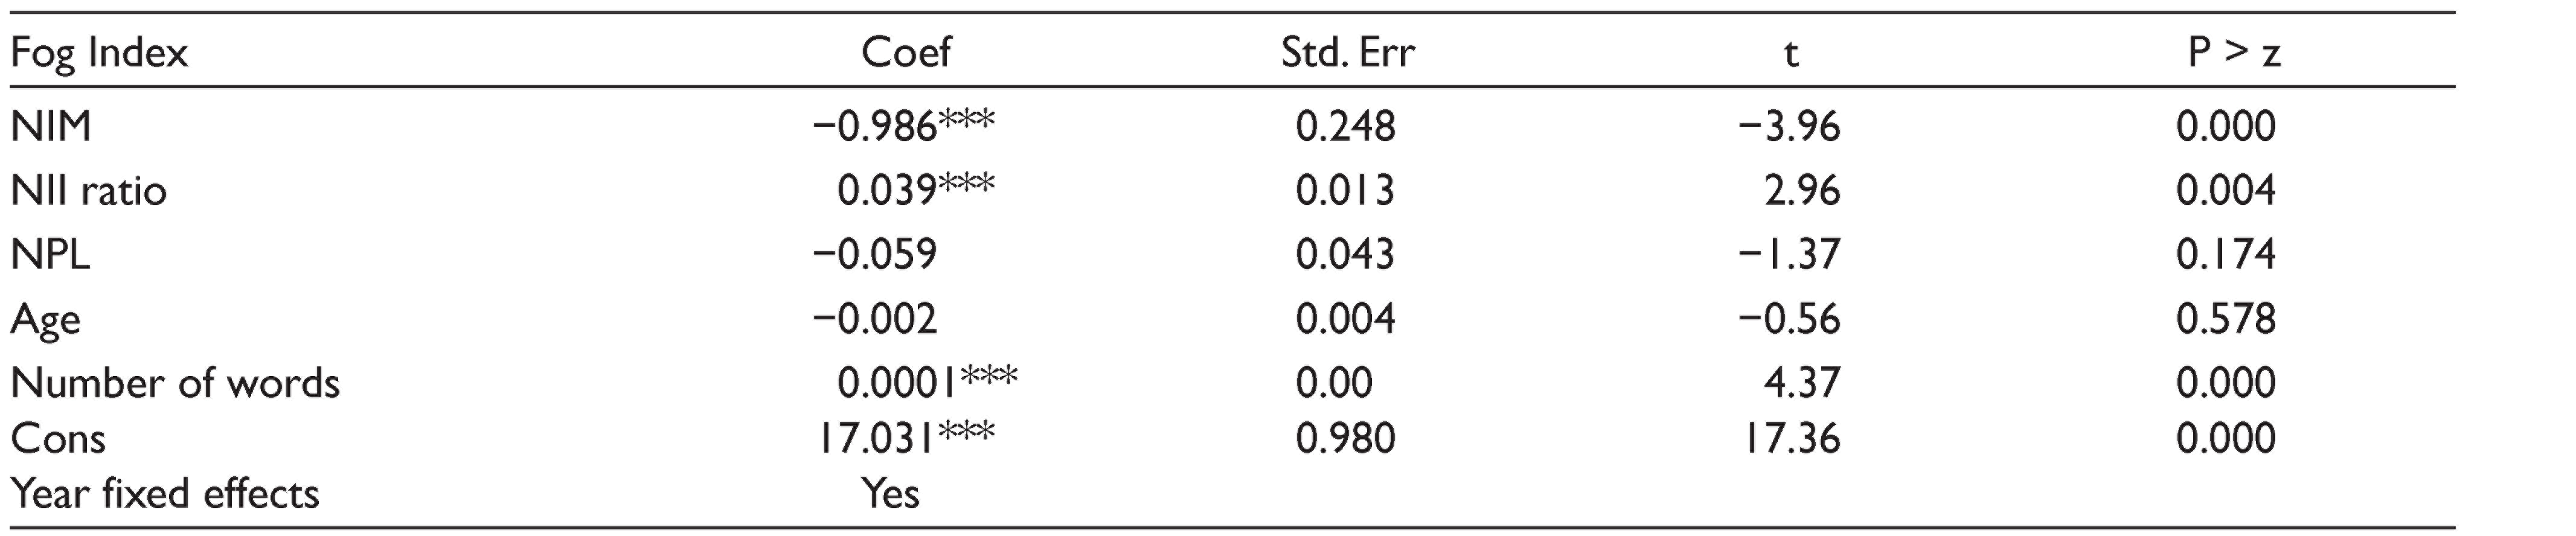
Number of observations = 123; R2 within groups = 0.3420; Number of Groups = 2; Between = 1.000; Overall = 0.1972; Prob > F = 0.000; Observations per group min = 52; Average = 61.5; Max = 71
Flesch Readability Ease Index and Firm Performance Fixed Effects
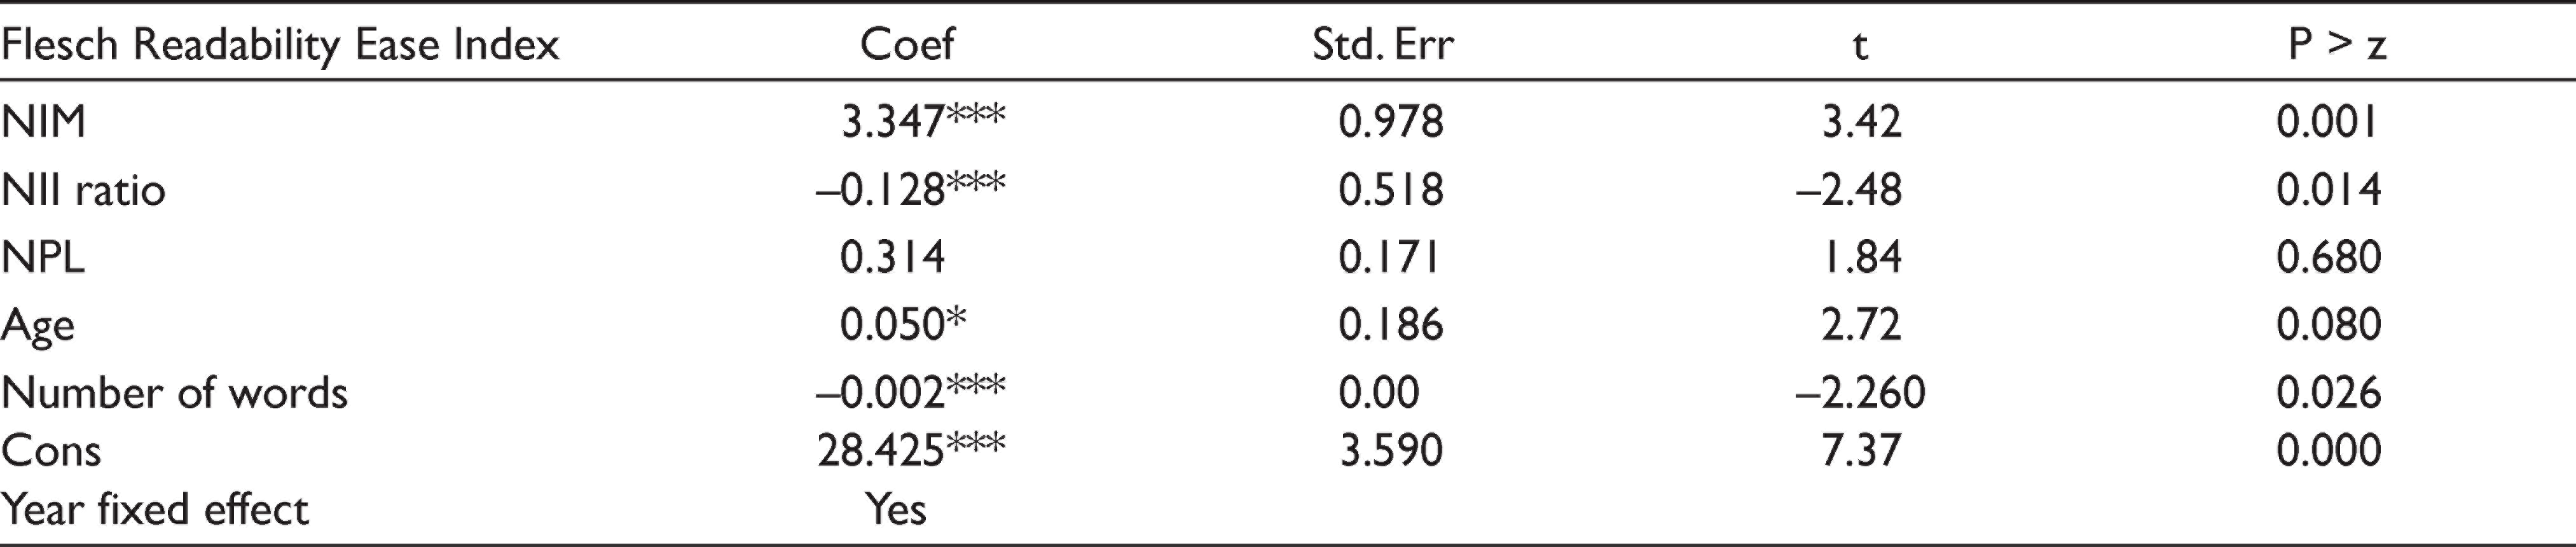
Number of observations = 123; R2 within groups = 0.2677; Number of groups = 2;
Between = 1.000; Overall = 0.2945; Prob > F = 0.000; Observations per group min = 52, Average = 61.5, Max = 71
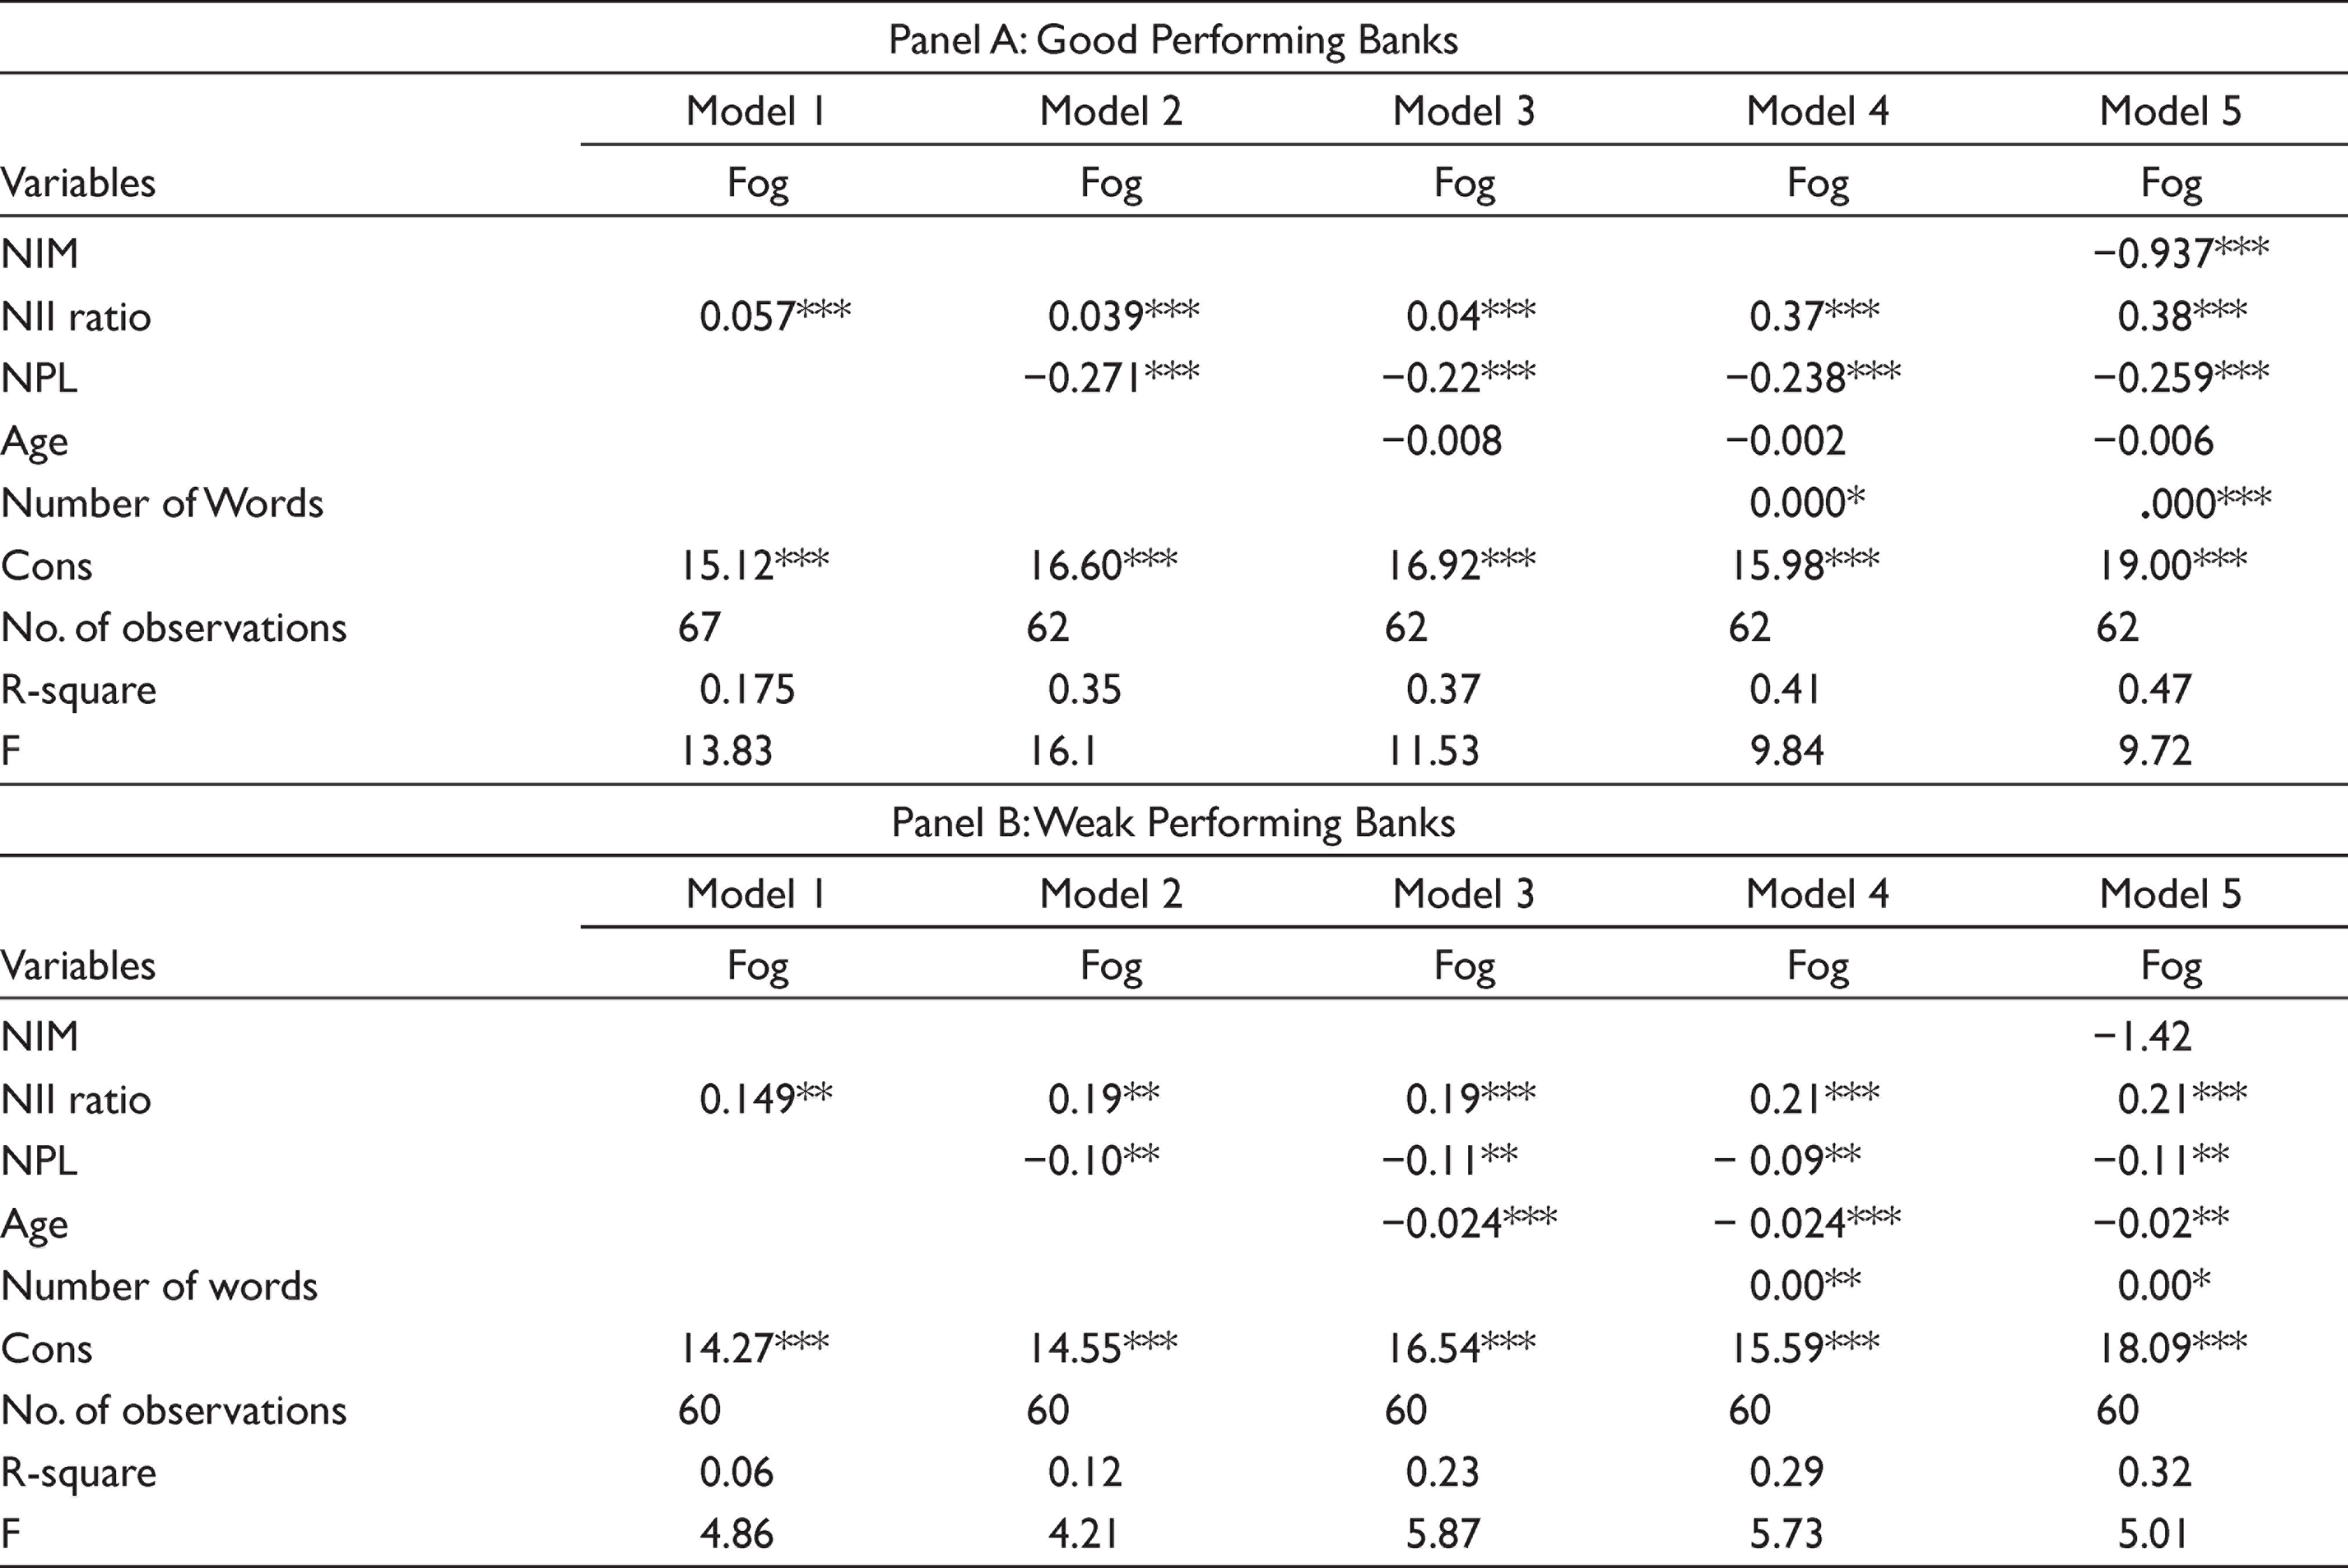
Further, to show the explanatory power of NIM for good and weak performing banks, we carried out stepwise regression. The results are in Table 9. We observe from the results that in the case of good performing firms, NIM shows a negative significant impact on Fog Index and we see an increase in the R-square from 0.41 to 0.47. In the case of weak performing firms, the effect of NIM is also negative and we observe an increase in the R-square from 0.29 to 0.32, showing that NIM can explain Fog index. We also observed that the beta of NIM of weak performing banks is higher than good performing banks. Hence, we conclude that NIM has a negative impact on Fog Index and the impact of NIM on weaker firms is higher.
Step Wise Regression of Good and Weak Performing Banks
Conclusion
This paper is the first study of the readability of MD&A and performance of the banking firms and determines that the performance variable influences the readability indices. We find that Indian banking firms’ MD&A are difficult to read. However, when we compare them with the MD&A of companies from the USA and 42 other countries, Indian banking firms’ MD&As are found difficult to read but not unreadable. Our results show that a firm’s performance influences the readability of its MD&A. The results are statistically significant, showing that firm performance would have a negative impact on Fog Index and a positive impact on the FREI of readability. Based on our results, we affirm that firms with poor performance would structure their annual reports to veil adverse information in unfavourable situations. The results support IRH and the opaque nature of banking companies. Application of readability index in case of banking companies of an emerging economy in association with their performance is the contribution of this paper to the existing literature.
Footnotes
Declaration of Conflicting Interests
The authors declared no potential conflicts of interest with respect to the research, authorship and/or publication of this article.
Funding
The authors received no financial support for the research, authorship, and/or publication of this article.