
Abstract
The study of social differentiation in the countryside is often dominated by the deployment of classical analytical frameworks. This article quantitatively explores social differentiation at the sub-national level (Chiredzi and Zvimba districts in Zimbabwe), through the use of the trimodal agrarian structure (TMAS) framework. It addresses the question of whether variables outlined in TMAS (land sizes, labor, and credit) stimulate social differentiation patterns across various settlement models, which emerged after Zimbabwe’s land reform program. If so, what groups or clusters emerge and what are the differentials at the local level? Through statistical factor and cluster analysis, this article reveals that the TMAS variables do explain social differentiation even at the sub-national level. Land sizes, access to capital, and ownership of cattle are key factors in explaining this differentiation. Beyond the variables presented by the TMAS, we argue that agroecological zones and crop type are also instrumental in shaping social differentiation. From the evidence presented, it is difficult to visualize inter-cluster mobility because of various reasons, which include state-based tenure.
Introduction and Background
Zimbabwe’s Fast Track Land Reform Program (FTRLP) foregrounded many patterns, while simultaneously calling for improved and more reality-oriented heuristics. This prompted the rise of various agrarian models and conceptualizations, as researchers and policymakers grappled to better understand the emergent reality. One of the unique models to have been conceptualized is the trimodal agrarian structure (hereinafter referred to as the TMAS). It takes an African-centered approach in explaining social differentiation in the agrarian sector not only in Zimbabwe but also in Africa, broadly. Within the context of Africa, the TMAS represents an attempt to better understand the mutation of agrarian structures in postcolonial Africa (see Jha et al., 2020). Situated within the idiosyncrasies of land reform, the model has been applied in studies conducted by Moyo and Yeros (2005), Moyo (2011, 2013, 2016), and Chambati (2011, 2017), which seek to understand the features and characteristics of the agrarian dynamics that emerge in response to land reform policies and practices.
The dominant classical frameworks, which have hitherto been used largely to understand agrarian dynamic have limitations when operationalized to understand the agrarian dynamics of contemporary Africa. Cognizant of these limitations, this article, by virtue of its geographic scope, which focuses on Zimbabwe, is grounded on the TMAS. The model is specifically employed in this study to understand how social differentiation manifests at localized levels. By focusing on the sub-national patterns of Chiredzi and Zvimba, the study specifically seeks to answer the question of whether the variables outlined in the trimodal framework such as land sizes, labor use, and access to credit, can explain differentiation across different settlement models, two decades after the FTLRP. If applicable, what groups or clusters emerge? Is there a possibility that the TMAS, as conceptualized and shown at the national level, is reproduced at sub-national levels? If so, what are the differentials at the local level? The article also interrogates production patterns, access to finance mechanisms, and accumulation trajectories in the two sub-national agrarian structures under study.
Before the TMAS, which is an outcome of the FTLRP in Zimbabwe, there was a bimodal agrarian structure (Moyo, 1995). This bimodal structure also existed in former settler colonies such as Kenya, Namibia, and South Africa. It was characterized by “extremely” large-scale commercial farms (LSCFs), on the one hand, and small-scale farms, on the other (Moyo, 1995, p. 302, 2011). A significant proportion of the peasantry acted as a labor provisioning class for the capitalist farmers. In Zimbabwe, the bimodal agrarian structure was composed of 6000 White farmers (and a limited number of agro estates) operating alongside an estimated 700,000 peasant farmers (Moyo & Nyoni, 2013, pp. 200, 201). The LSCFs dominated the agrarian landscape as a result of land ownership, capitalization, and access to state and private commercial credit. Peasant farming households, however, had smaller landholdings. They relied mainly on self-finance to resource their agricultural operations. Notably, 95,269 small-scale farmers constituting less than 10% of the peasant base nationally, were able to access formal agricultural bank credit from the Agricultural Finance Corporation (Chimedza, 1994, p. 328). A few peasant households located in agroecological zones I and II 1 produced horticultural crops for exports, through White commercial farmers and cooperative schemes supported by international agencies like the United States Agency for International Development—USAID (Moyo, 2000; Sachikonye, 1989). This phenomenon laid the basis for social differentiation within the peasantry. It must also be noted that differentiation within the peasantry during the first decade of Zimbabwe’s independence was partly driven by a cotton boom, which led to the emergence of successful farmers, “Hurudza” (Nyambara, 2003).
Apart from financing, labor-hiring patterns, and levels of capitalization, the peasantry and LSCF sectors, under the bimodal agrarian structure, were also differentiated by levels of education and production orientation (Moyo, 1995; Sachikonye, 1989). The LSCF sector mainly produced export crops, while the peasant sector produced crops for auto-consumption (Moyo, 2000). It is critical to highlight that the peasantry is not a homogenous group (Moyo, 2016; Yeros, 2002). Within this category, the “poor,” “middle,” and “rich” peasants were differentiated based on asset ownership, access to other forms of finance, labor utilization, production orientation, education, land size, and employment (Moyo, 2016; Sachikonye, 1989).
Post-FTLRP, there was an insertion of a TMAS (Moyo, 2013). This structure, it is argued, is characterized by various modes of accumulation and is largely manifested by accumulation from below (Moyo & Yeros, 2005; Moyo et al., 2009). The structure is composed of three categories, which are primarily a result of state policy, namely the peasantry (communal areas—CA,2 old resettlement—OR, 3and A14 farms); medium- to large-scale (A25) farms; and, lastly, agro estates (state or private owned) comprising agro conservancy and institutional estates (Moyo & Nyoni, 2013; Moyo & Yeros, 2013). The penetration of agrarian capital, in recent decades, driven by the intensification of neoliberalism, has reconfigured most agrarian structures in Africa to orient them toward trimodal structures characterized by the persistence of the peasantry (Moyo, 2008, 2016). While this phenomenon in former settler colonies is largely a product of a combination of colonial land dispossession and the recent wave of land grabs following the 2007–2008 energy and food crisis, in nonsettler Africa, the TMAS is an outcome of the renewed interest on Africa’s land by foreign corporates under neoliberalism (Moyo, 2008; Moyo et al., 2019). Thus, in Africa, as a consequence, TMAS is composed of the peasantry, who constitute the majority of the population; a nascent middle-capitalist farming class, which has been leveraging on land titling to purchase land under the neoliberal phase, taking advantage of land titling, and LSCFs that have been acquired under the ongoing wave of land grabs (Moyo, 2016). In the post-land reform Zimbabwe, emergent agrarian shifts and challenges include the land reconcentration by the state at the behest of capital and the semi-proletarianization of the land reform beneficiaries (Mazwi et al., 2019; Mudimu et al., 2020).
The TMAS has gained greater recognition in studies that focus on major agro-regions of Zimbabwe (Moyo et al., 2009). By extension, this model can also find application in localized studies (sub-national level, etc.) although there have been limited localized studies that have employed this approach. To gain a wider understanding of production, financing, labor utilization, capital formation, and social differentiation patterns among the three categories identified in the TMAS, this article draws from field research conducted from 2016 to 2020 in Chiredzi and Zvimba resettlement areas, in two settlement models. Quantitative data were collected through a household questionnaire from a sample of randomly selected 203 households. Of these, 89 were A1 and 114 were A2 households. The data were analyzed using SPSS version 25.
The rest of the article is structured as follows. It offers a broad discussion of the study area and then provides a conceptual discussion of the TMAS before the presentation of findings of the emergent classes in the study area. The article ends by providing some concluding remarks.
Study Area: Chiredzi and Zvimba
Zvimba, located in Mashonaland West Province, is in Natural Region II. The district has a total population of 263,020 (Zimstat, 2012). Agriculture is a major economic activity for many households in this district (WFP, 2016). Apart from agriculture, the extractive industry is key for the political economy of the district as it is located along the Great Dyke, which is rich in several minerals such as platinum, chrome, gold, and copper (WFP, 2016). The district is also favored with rich soils and high rainfall patterns (700–1050 mm), thus allowing the production of various crop commodities by all farming classes . The northern part of the district was previously an LSCF area, but it has since been converted into a resettlement area comprising A1 and A2 households (see Figure 1). The southern part of the district houses the majority of peasant households and is made up of CA, which were not directly affected by the FTLRP (Mazwi, 2019).
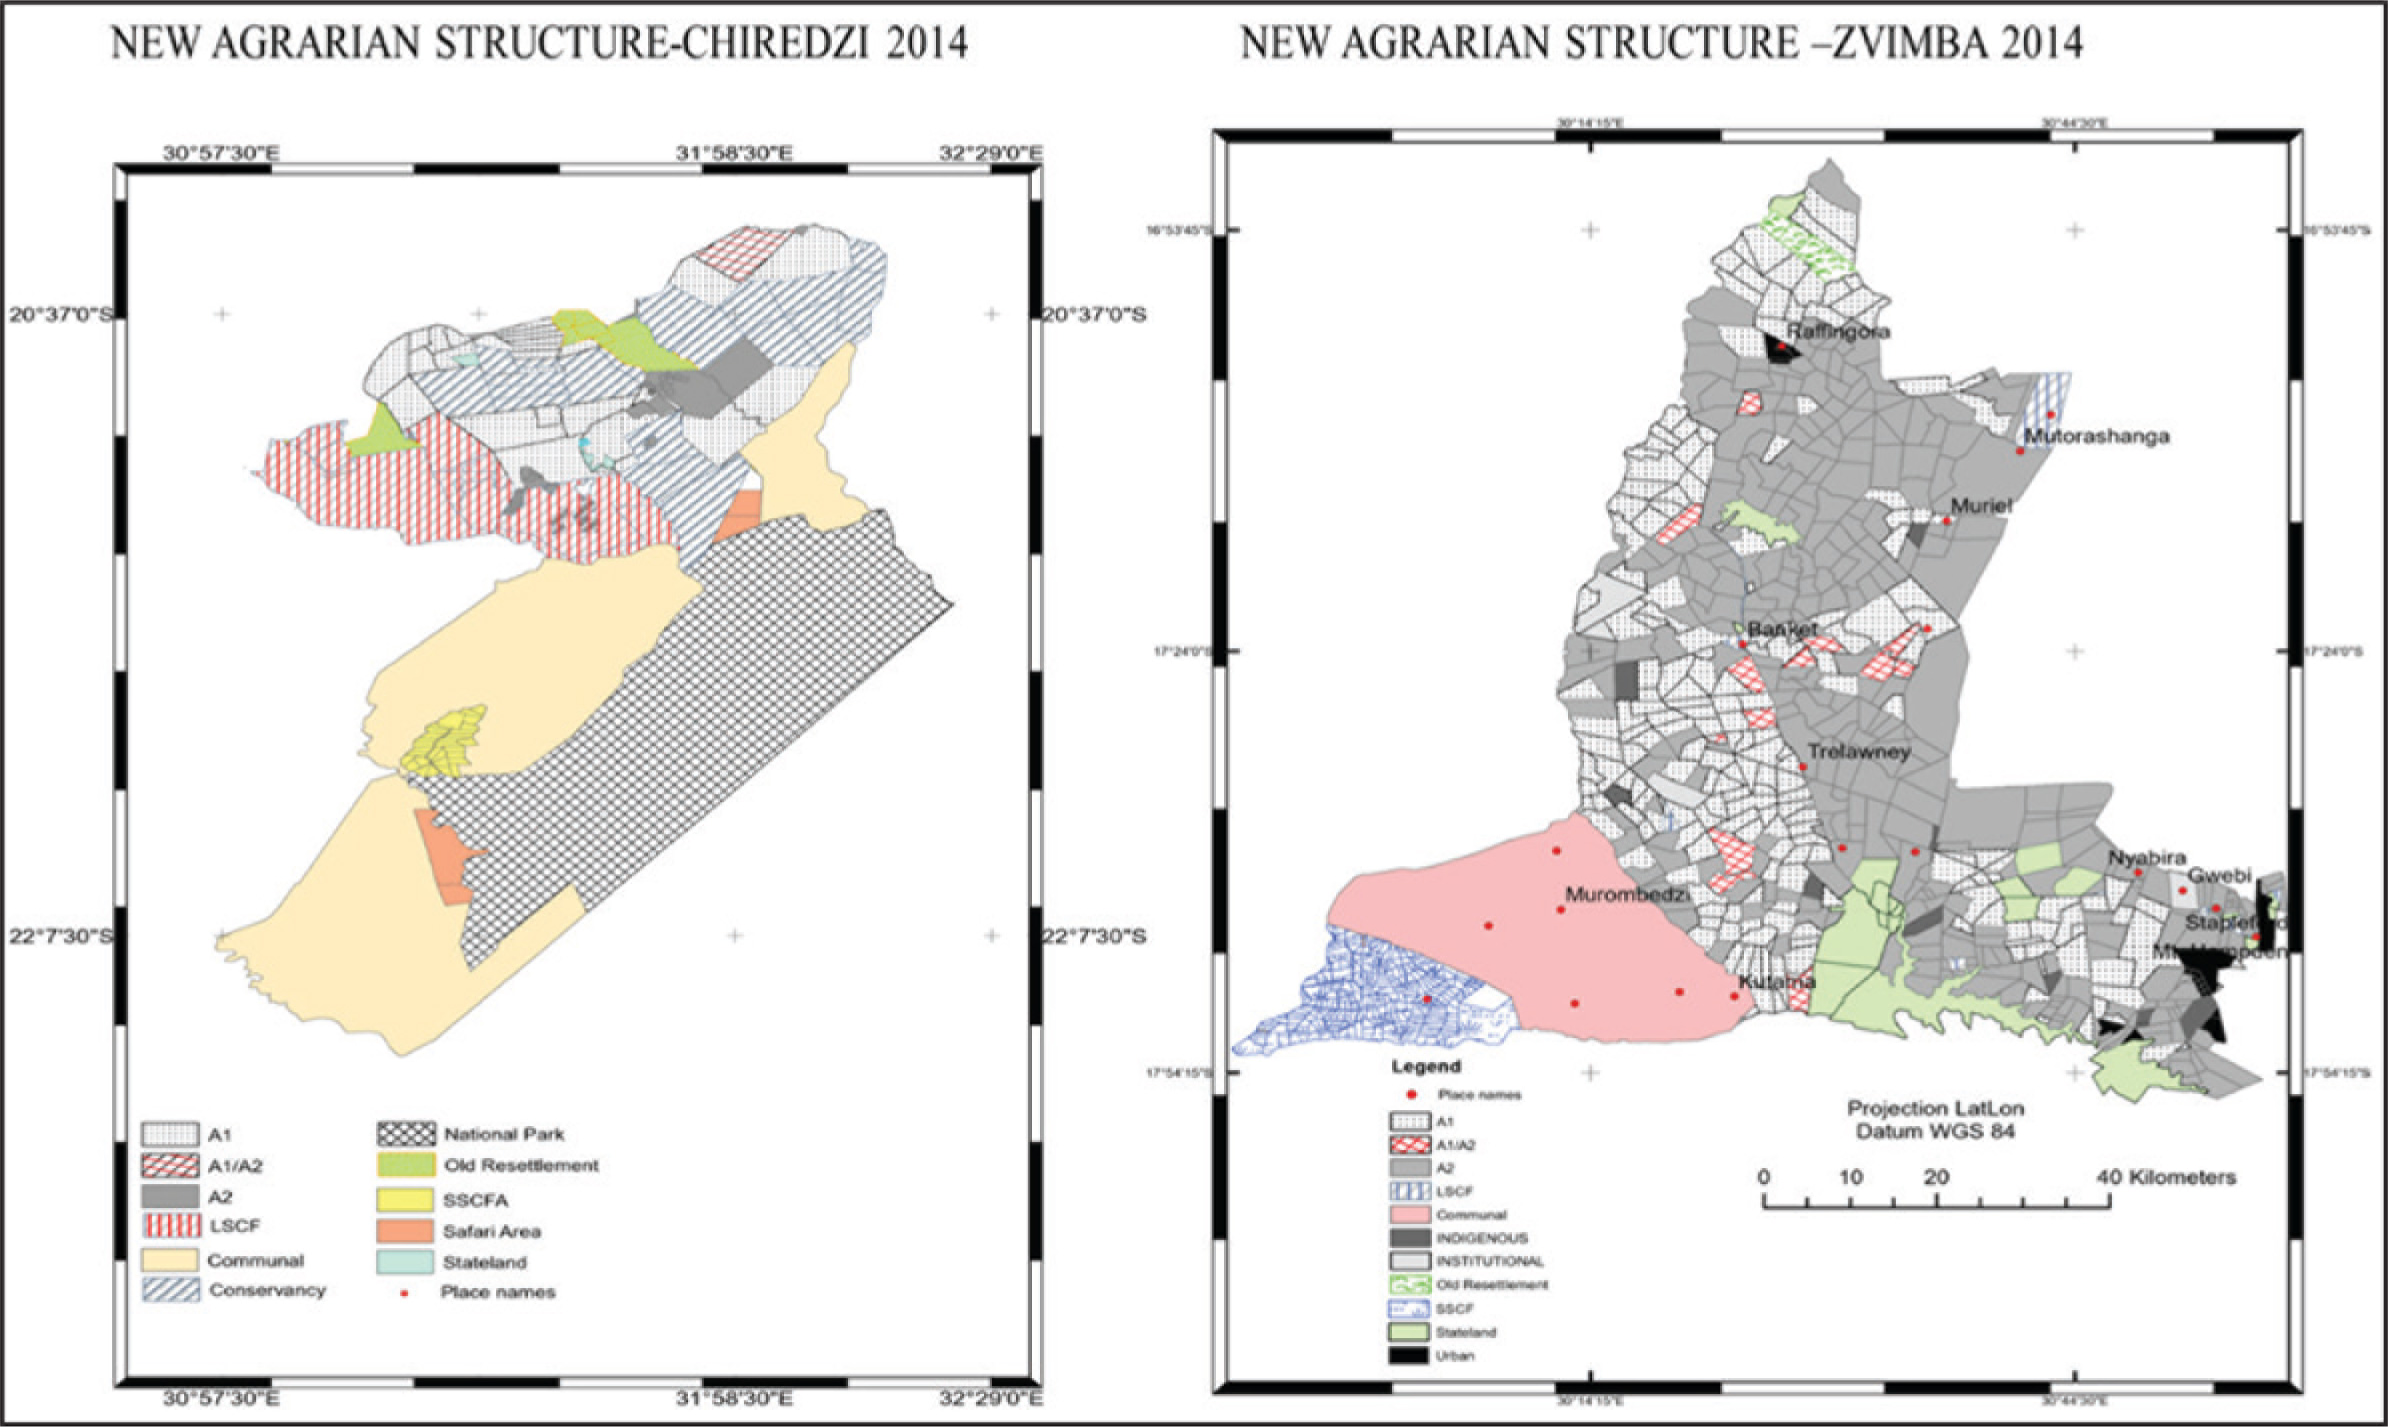
Chiredzi, bordering the Republic of South Africa and Zimbabwe’s Chivi, Zaka, Masvingo, Beitbridge, Chipinge, Mwenezi districts, is in the south-eastern Lowveld. The district is most suitable for sugarcane production because of its climate, which is characterized by frequent sunshine and temperatures ranging from 21°C to 38°C (Gukurume & Mushuku, 2012). Other dominant agricultural activities in the district are cattle, game ranching, wildlife conservancies, cotton, small grains, and citrus cultivation (Moyo et al., 2009). Chiredzi supports a significant amount of tourism owing to the presence of Gonarezhou wildlife park which accounts for more than 33% of total land (see Figure 1). Although the climate inhibits dryland farming, 79% of households in rural Chiredzi derive their livelihoods from agriculture, while 5.2% are engaged in the service provision sector (tourism and banking), with mining and construction being key sources of livelihoods for 1.4% of the inhabitants (Zimstat, 2012). Other key livelihood strategies are cross-border trading, employment in neighboring South Africa, and vending.
Social Differentiation and the Trimodal Agrarian Structure
Lenin (1964) propounded the theory of peasant differentiation. The theory outlines that peasants are not a homogenous entity and are segmented into various classes, namely the “rich,” “middle,” and the “poor”. As capitalism encroaches into the countryside, where peasants are concentrated, old relations become fragmented. Consequent to this is the emergence of class polarization, which gives rise to subclasses. Lenin (1971) divided the subclasses into the poor peasant, compirsing the landless, rural proletariat, and those with small landholdings; the middle peasants engaged in commodity production and employing, to a limited extent, wage laborers, and the rural bourgeoisie class encountering full integration into the market (Ferguson, 1976; Lenin, 1971). In accounting for this differentiation, the classical approach to social differentiation emphasizes on labor exploitation, landholding size, and the market integration of the peasantry, as the key determinants. Conversely, the TMAS, as explained in the foregoing, highlights how other factors, like education and agroecological factors, are also key determinants in the social differentiation process.
Peasants undergo a process of differentiation based on their production levels and access to capital (Lenin, 1964). Differentiation is a result of unequal control of land and capital (Neocosmos, 1986). There, however, is a need for primacy of class analysis in studying differentiation (Byres, 1996; Moyo & Yeros, 2007). A critical consideration of the factors that influence it can be conducted either qualitatively or quantitatively. Notably, class systems are indicative of social relations that characterize production and are identifiable through an assesment of how different constiuents of a community relate (Bernstein, 2010). According to Sargeson (2016), class can also be defined as a social formation that is predicated on property ownership, labor, and capital accumulation, all consolidated by economic, political, and cultural practices. Neocosmos (1986), on the other hand, argues that economic ownership and control are the basis of class differentiation.Having title to land alone, therefore, fails to provide sufficient rationale in accounting for differentiation. The ability to control land and determine how the products are shared sufficiently sets the stage for accumulation.
In engaging differentiation scholarship, Chayanov (1966) posits that social differentiation can be attributable to household demographic features (use of family labor or access to non-farm income), with little regard to land sizes. Furthermore, Chayanov argues that land sizes could be considered constant because uniform land would have been allocated to the peasants. This rationale suggests that smaller households and households with a higher proportion of aged people who are unable to have enough labor to work on the land eventually slide into precarity by virtue of limited or no capacity to advance capitalist production.
Contributions on heterogeneity and the social stratification of the peasantry in Africa have come mainly from Mamdani (1987), Bernstein (1977), Gibbon and Neocosmos (1985), Cousins et al. (1992), Sachikonye (1989), Moyo (2011, 2014, 2016), and Moyo et al. (2009). These studies are Marxist-oriented and draw on Lenin’s scholarship on The Development of Capitalism in Russia (1908–1960) and Karl Kauskty’s scholarship on The Agrarian Question (1988). Both argue that capitalist penetration leads to accumulation for some growers and impoverishment for others, deepening social disparities. The conversion of a proportion of agricultural producers to agrarian capitalists, as accompanied by the displacement of other peasants from their land, further accentuates heterogeneity and stratification, as evidenced in sugar growing in Kilombero in Tanzania, Maragra in Mozambique, and Busoga in Uganda (see Chambati et al., 2018; Martiniello, 2016, 2017; Sulle, 2016). Similar outcomes are highlighted by Oya (2007) and Cousins et al. (1992) in their case studies of Senegal and Zimbabwe, respectively.
With regard to gender dimensions, social differentiation is more variagated. Capitalism thrives on the exploitation of women’s work. This manifests as the nonrecognition or partial recognition of unpaid female labor and the normalization of gender-oriented social reproduction roles, like the provision of the labor (Naidu & Ossome, 2016; Tsikata, 2016). Concomitant to the acuteness of social differentiation, therefore, is the deepening of the exploitation of women. In rural India, for instance, women increased their working hours in domestic household chores amidst the deepening social differentiation, thus in a way subsidizing capital (ibid). This reflects the gendered nature of social relations that characterize production and reproduction, with women being exposed more to agrarian crises (Tsikata, 2015).Within this context, therefore, the TMAS adds on to classical social differentiation conceptualization and could be more relevant in understanding agrarian dynamics in Zimbabwe and other regions with similar patterns.
The Trimodal Agrarian Structure
To adequately understand social differentiation processes in Africa, it is critical to locate them in a historical, geographical, economic, and social context. Equally important is an understanding of the agrarian structure that exists in Africa and has a bearing on the social stratification process. Africa has a unique history, with differing patterns of land alienation and integration with world markets. The establishment of plantation enclaves was not uniform, and thus the character of the peasantry varied from one country to another (Mamdani, 1996; Moyo, 2008). Unlike in Europe, where landlordism dominated in the agrarian structure, the agrarian question for Africa assumed a different shape. It focused mainly on the oppressive and exploitative relations that existed between the colonial state and the peasantry (Neocosmos, 1993).
Under the TMAS, plantation estates and LSCFs operate alongside small- to middle-scale farms and a peasantry base (Moyo, 2016; Moyo & Yeros, 2005). Such a structure has persisted in postcolonial states and was cemented under structural adjustment programs. Within this broader structure, there is always an ongoing social differentiation process among and between the three broad categories, based on different access to the means of production, credit, utilization of labor, off-farm income, markets, and orientation of crop production (Moyo & Yeros, 2005). In nonsettler countries such as Zambia, Malawi, Botswana, Swaziland, and Tanzania—where LSCFs and plantation estates were not instituted by colonial regimes—the TMAS is a recent outcome of land policies that facilitate the acquisition of large-scale lands from the peasantry under a neoliberal policy regime (Moyo, 2016). The incidence of middle-scale farms in Zambia increased from the 2000s. In Malawi, there are 30,000 middle-scale farms that control 30% of the land (Zuka, 2013).
Within the TMAS, Moyo and Yeros (2005) contend that medium-scale capitalist farmers have better access to capital than the peasantry. This class of farmers relies on a combination of family and hired labor (Chambati, 2013; Moyo, 2013). Arable lands in the LSCF sector were significantly reduced during the FTLRP from 11.2 million ha (35.7%) in 2000 to 1.2 million ha(3.5%) by 2010. In the same period, the share of arable land owned by estates increased from 4.8% to 7.4% (Moyo, 2013). The data on estate landholdings that were not affected by the FTLRP indicate that the state has shielded large agro-industrial estates from expropriation. This arguably represents the state’s renegotiation with capital (Moyo, 2011).
According to post-FTLRP literature, the arable area held by the peasantry increased from 58.4% in 2000 to 73.4% of total arable land by 2010, confirming the redistributive character of the land reform program (Moyo et al., 2009). Landholdings for medium-scale farmers, which in 2000 accounted for 4.1% (1,400,000 ha) of the total arable land at a national level, had expanded to 13.3% (4,388,000 ha) by 2010 (Moyo, 2013). This outcome reflected a desire by the Government of Zimbabwe (GoZ) to retain and expand capitalist agriculture, while moving toward re-peasantization.
The broadly drawn profiles of land reform beneficiaries, which included not only communal area farmers and farm workers but also town and city dwellers, represented a wave of re-peasantization similar to that evidenced in parts of Asia and Latin America after the end of the Cold War (Moyo & Chambati, 2013; Moyo & Yeros, 2005). The iniquitous bimodal agrarian structure was thus replaced by a more inclusive trimodal structure, with an estimated increase of 170,000 A1 and A2 households having benefitted since 2000 (Moyo, 2013; Moyo et al., 2009). Notably, this evidence contradicts Bryceson’s (2000) assertion that sub-Saharan Africa has, in recent years, undergone a new wave of depeasantization. As argued by Moyo and Chambati (2013), Moyo and Yeros (2005), Zimbabwe’s example deconstructs the depeasantization thesis by proffering one that has an orientation toward re-peasantization. The next section discusses the findings of this study.
The Character of the Sub-national Agrarian Structures: Chiredzi and Zvimba
The Persistence and Perseverance of the Trimodal Agrarian Structure
The A1 and A2 households sampled in the districts of Chiredzi and Zvimba represent the peasantry and the middle- to large-scale sectors, respectively. These constitute two major elements of the TMAS. Statistical clustering was utilized to decipher key characteristics of each sub-sector, while also relating these to the TMAS conceptualization. Key variables used in the clustering process were adopted from Moyo and Yeros (2005) and Moyo (2013). These include, inter alia, land sizes, labor-hiring patterns, education, access to credit, capitalization, and access to contracts. The cluster analysis produced three distinct classes that emerge within the resettlement areas. A multivariate assessment began with factor Principal Component Analysis (PCA) is an exploratory analysis tool which reduces data dimensions by taking a linear combination of many variables, and identifying a few that can explain the rest of the variables. The few variables are then used to extract components for cluster/classification analysis (IBM-SPSS-V25, 2018).
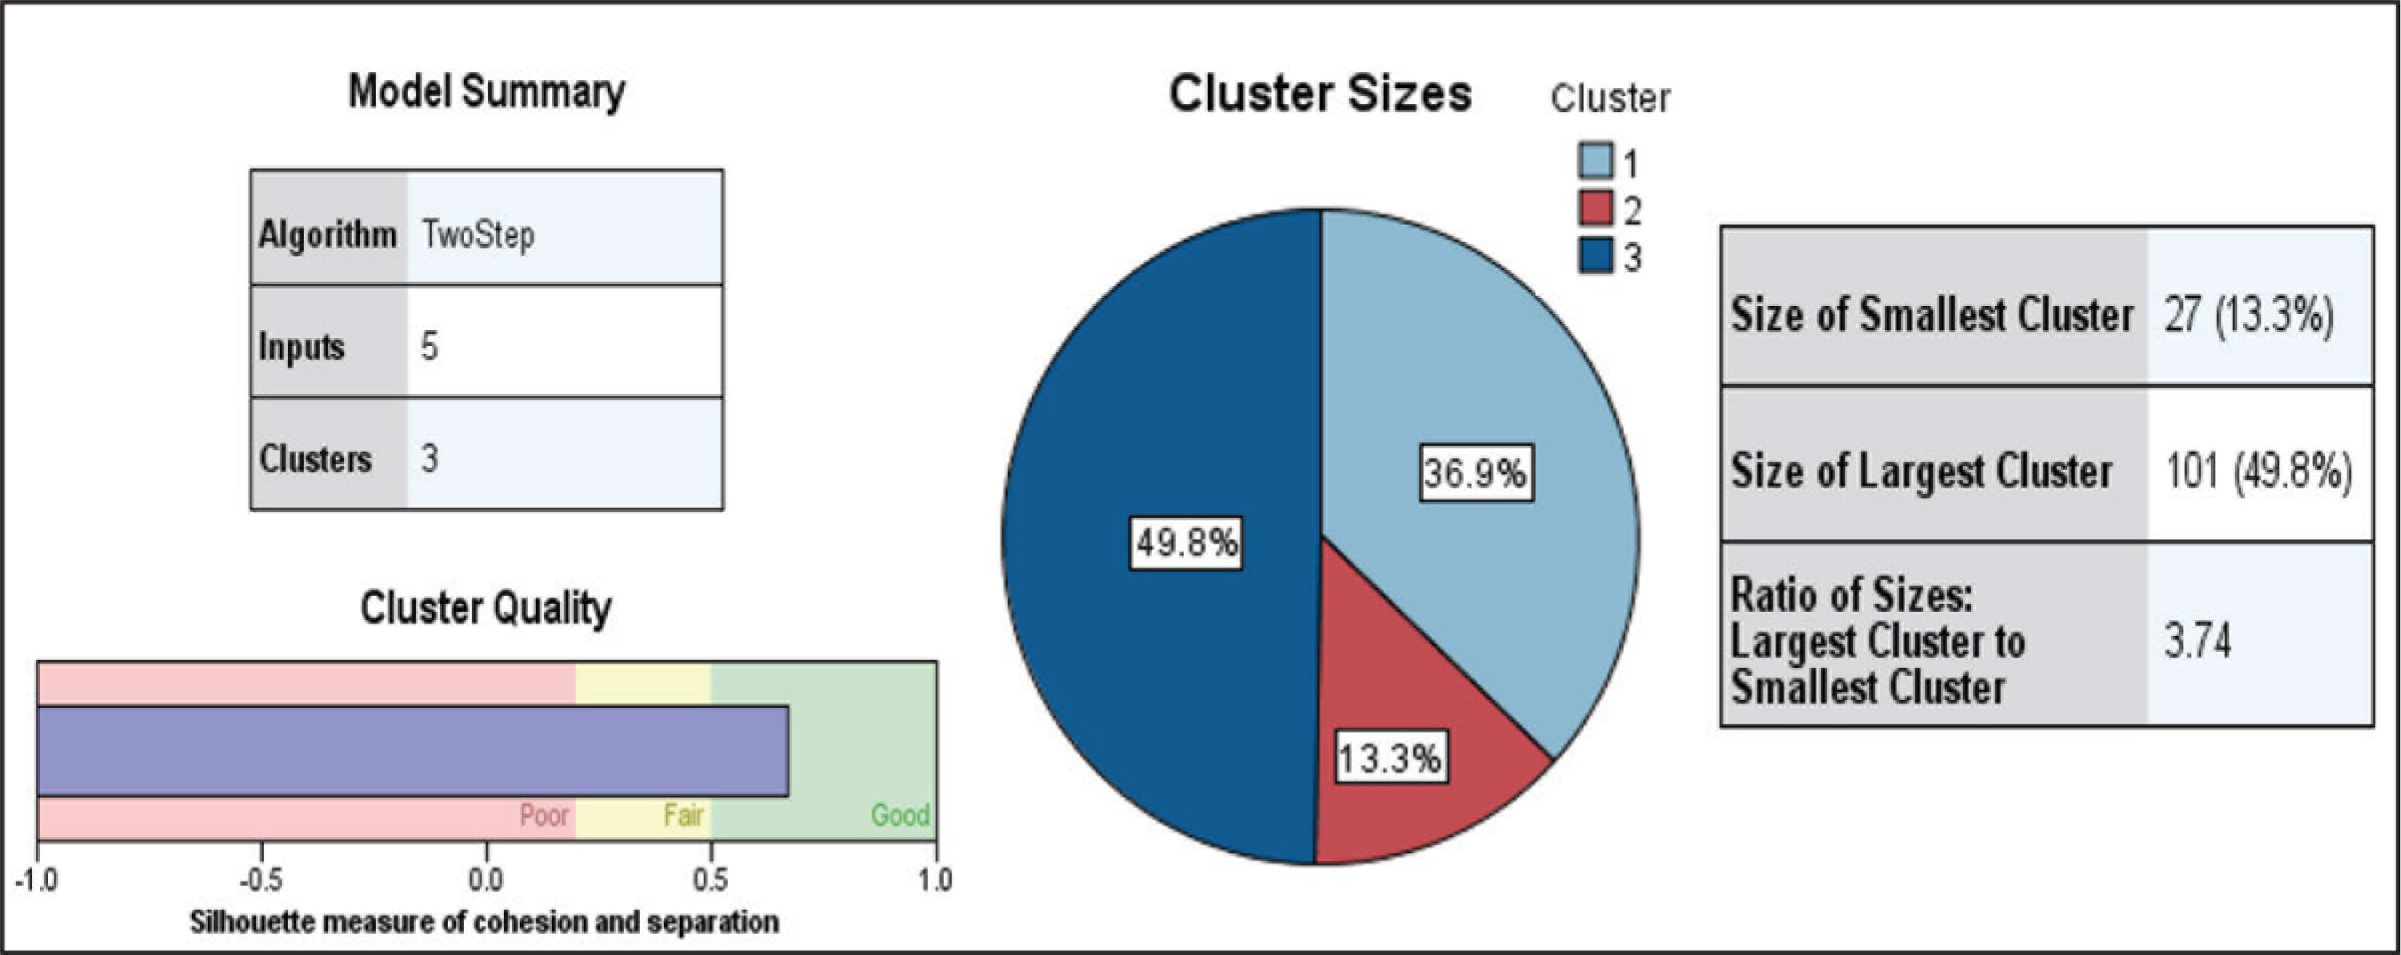
First, the Kaiser–Meyer–Olkin (KMO) and Bartlett’s test of sphericity assured sampling adequacy (N = 203). The study constituted 17 different variables into the PCA matrix, which identified five variables as explaining more than 77% of the variance of the total 17 variables. These main clustering variables were “cattle owned,” “casual labor hired,” ”access to bank credit,” “arable area owned,” and “total annual income outside farming,” in that sequence. The goal was to understand how these five variables clustered cases into different groups. A two-step cluster analysis algorithm was used to achieve this goal. The five variables (with a good Cronbach’s test of consistency score, i.e., α > 0.5) produced three classes, in alignment to the dictates on the TMAS.
The Silhouette measure of cohesion and separation for the five variables produced a very good cluster quality score, and the ratio of sizes for the largest cluster to the smallest cluster were acceptable. The cluster sizes, from cluster 1 to cluster 3, were 36.9%, 13.3%, and 49.8%, respectively (see Figure 2).
The most important step in cluster analysis is the description of the individual clusters to determine the characteristics of the farmers who are found in that particular cluster and then naming the cluster. The first cluster, which had 36.9% of the farmers, mainly grouped them based on investments in productive assets, ownership of cattle, and use of casual labor. The farmers in this cluster accessed fewer bank loans and had the least amount of money earned from sources outside agriculture. They represented the middle class and were named medium capitalist farmers. The second cluster consisted of farmers who had more access to bank loans and also owned cattle. Their use of casual labor was not as important as compared to the amount of income from outside agriculture sources. This group had approximately 13.3% of the farmers who represent the rich. This cluster was named highly capitalized farmers.
The third and final group was mainly clustered based on the amount of income received from sources outside agriculture, followed by the use of casual labor for agricultural activities. These farmers had less access to bank loans and owned a few cattle when compared to other groups and seemed to represent the poor class. These were named peasants. Although land was an important factor in clustering, it seemed to occupy the medium neutral factor in determining clusters. Key variables under the TMAS show that the largest cluster consisting of 49.8% of the sampled households in the districts fits into the peasants’ group under the TMAS, while the remaining two clusters fall into the second category of medium to capitalist group under the same framework (see Figure 2). A detailed description of each cluster and how it links to groupings under the TMAS is provided in the following sections.
Cluster 1: The Peasants
The peasant group constituted the largest of the three clusters, emerging from the clustering process, with about 49.8% of the households. As highlighted earlier, this group is considered to be the poor group akin to the peasant category in the TMAS. The majority under this cluster were A1 farmers (79.8%), with A2 farmers constituting the remaining 20.2%. This confirms the assertions by Moyo and Yeros (2005) and Moyo (2013) that the poor A1 and CA farmers dominate the peasant category in post-land-reform Zimbabwe. Also critical to note is that most of the farmers (97%) under this group are from Zvimba, a district that has little prospects for farmers to become highly capitalized due to the fact that crops grown do not attract higher prices in foreign and domestic markets (Mazwi, 2019). Furthermore, less than 3% of farmers in the district are capitalist oriented (Mazwi, 2019). The fact that only 3% of farmers under this cluster were from Chiredzi reinforces the position that agroecological zones play an important role in social differentiation (Moyo, 1995, 2013).
To highlight the class composition of this group, the social backgrounds of farmers under this cluster were considered. The majority of the heads of households in this cluster (86.1%) originated from CA, followed by former farmworkers who previously worked for former commercial White farmers (6.9%), and then urbanites (4%). Comparative to other groups, this cluster had the least number of farmers with tertiary education. These only constituted 3% of the cluster. Notably, the social backgrounds of farmers in this cluster strongly relate to those of the peasantry under the TMAS who are largely composed of the agrarian underclass mainly drawn from CA and former farmworkers (See Chambati, 2011; Moyo et al., 2009). In the TMAS, Moyo (2013) postulates that the peasant category has less formal educational qualifications when compared to capitalist farmers. Our study also found a positive correlation between low education attained and and the probability of a farmer to be found in the Peasant cluster. This impacts negatively on agricultural production and capital formation capabilities of this class.
Critical to point out is that only 2.5% of the farmers in this category were employed in lowly paying semi-skilled positions in the public and private sectors, while none were employed in managerial positions. Although lack of formal employment is now a generally accepted characteristic of the Zimbabwean economy, this feature tends to be more pronounced in the peasantry cluster, as shall be demonstrated in the following sections. Such economic positioning undermines the peasantry’s prospects for capitalist development.
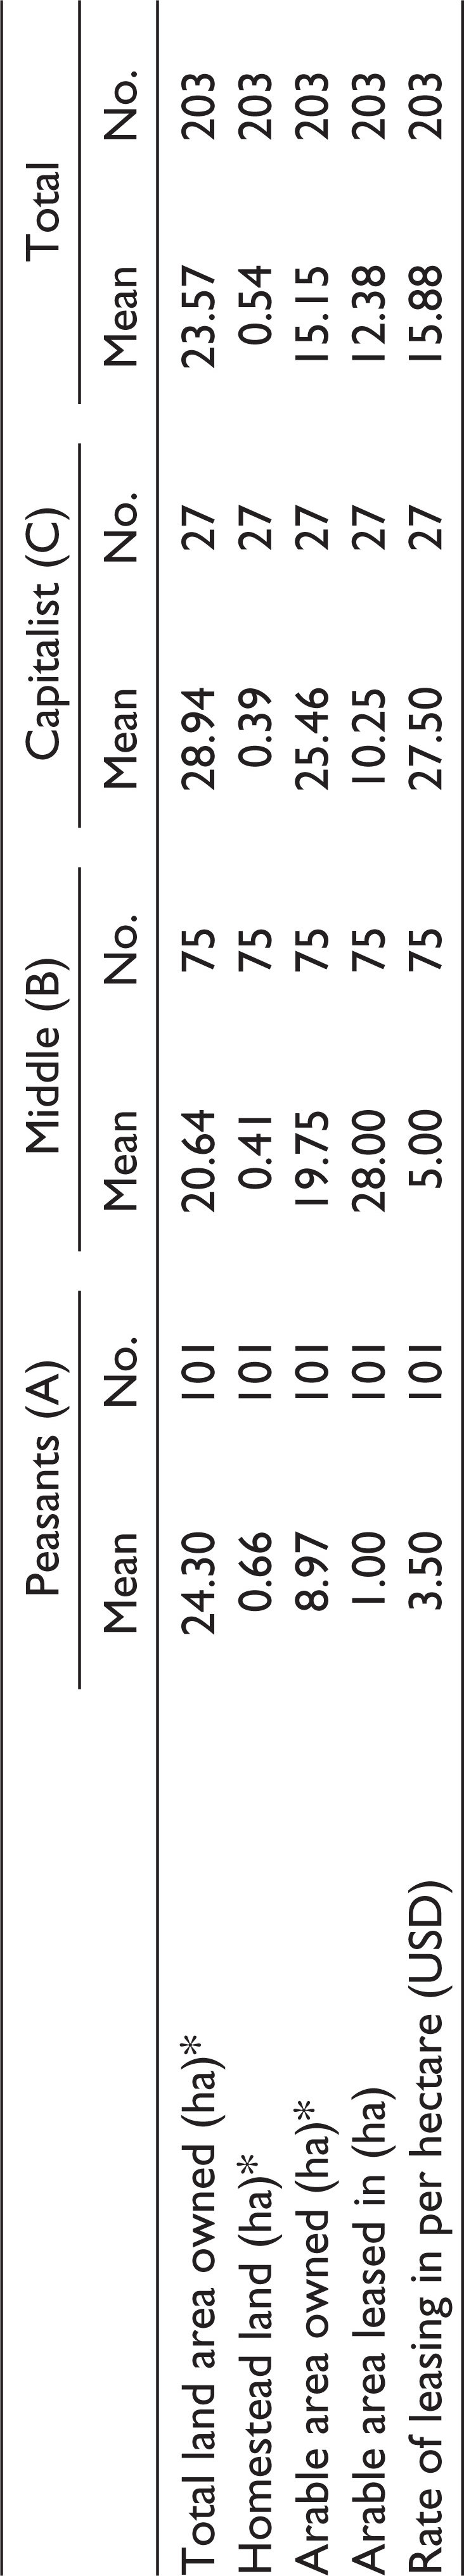
In the TMAS, land size also determines the class of farmers (Chambati, 2011; Moyo, 2016; Moyo & Yeros, 2005). The study did prove that farmers in the lower cluster had the least arable land sizes, comparative to the other two clusters, with each household tilling an average of 8.97 ha. Leasing of land was also lowest in this cluster. Alongside other variables such as access to capital and mechanization, land size and land leasing are also key in determining social differentiation in the countryside (Moyo, 2016). It is plausible that limited land size contributes to the immiseration of these farmers. Findings in this cluster also support assertions in the TMAS that the peasantry has smaller landholdings when compared to the other groups in the emergent agrarian structure (Moyo & Yeros, 2005).
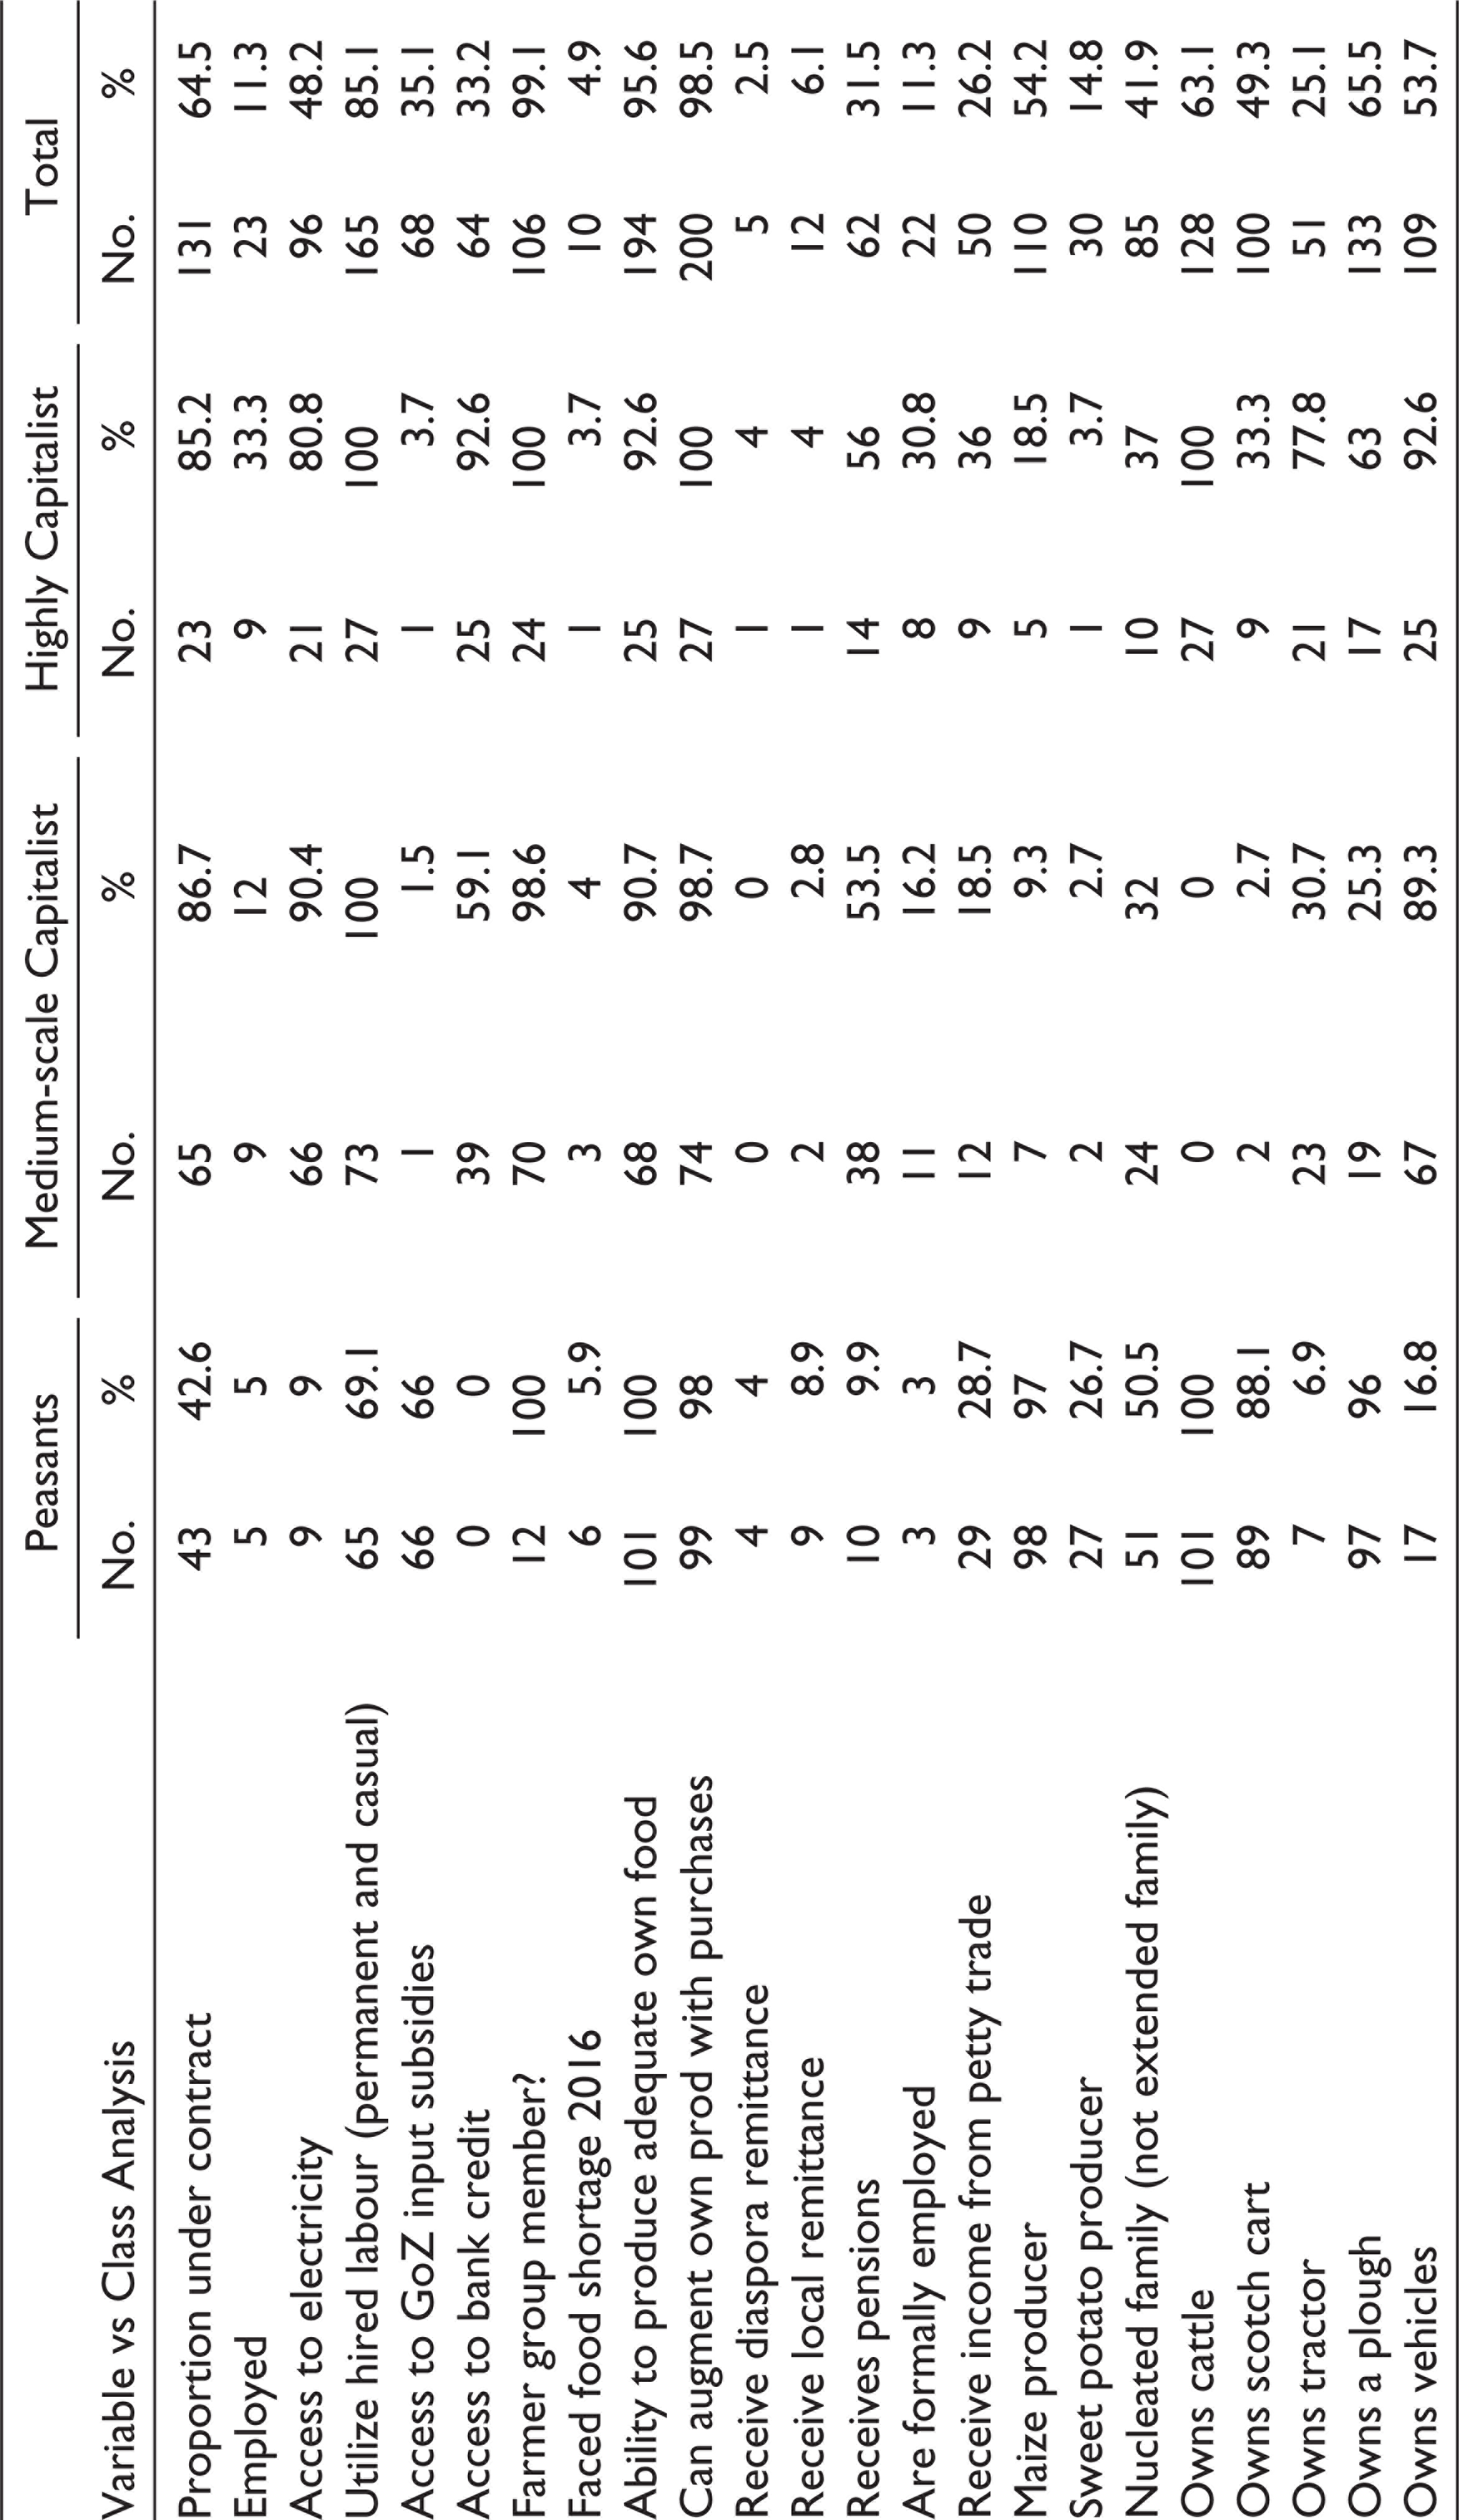
In alignment to conceptualizations of the trimodal by Moyo and Yeros (2005), the peasant category had the lowest proportion of farmers who received agricultural credit from commercial banks. Conversely, farmers from the middle and highly capitalized clusters were under contract farming arrangements (42.6%), a development which confirms assertions that medium- to large-scale capitalist farmers are more likely to produce under contracts when compared to peasant farmers (see Moyo, 2013). It is critical to point out that constrained access to agricultural credit has a significant bearing on capital formation and social stratification in the countryside, hence, a symbiotic link between the poorest cluster and low levels of agricultural financing. Post-FTLRP studies have demonstrated that the majority of farmers in the countryside have struggled to accumulate capital. This has largely been as a result of the radical nature of the land reform, which triggered capital flight and policy inconsistency (Mazwi, 2019; Moyo et al., 2009; Scoones et al., 2010). A corollary to this is that farmers in this cluster rely on the GoZ’s input subsidies. These subsidies, are often delivered late and in inadequate quantities (Mazwi et al., 2019; Mudimu et al., 2020a), are primarily targeted at the poor and vulnerable, with the intent to drive agricultural production. In an assessment of subsidy patterns, the study revealed that 66% of farmers under the peasant group received government-subsided inputs during the 2016–2017 agricultural season (Table 1). This percentage allocation is significantly higher than that of other clusters. Equally important to mention is that the majority of farmers in this group (91%) did not have access to electricity, a factor which not only reflects their poor status but their inability to engage in commercial agriculture, which requires electricity-powered irrigation systems.
Discriminate Analysis of Resulting Clusters
Higher unemployment rates and limited sources of income from other activities outside agriculture are also key features of the poor peasants. As shown in agrarian literature, a key characteristic of poor farmers is less income from formal employment and pensions (Moyo et al., 2009; Sachikonye, 1989). The study’s cluster analysis confirmed this to be true as only 3% of farmers in this group were in formal employment while 9.9% received pensions. These figures also explain why farmers in this group are poor and further validate assertions advanced in the TMAS that peasant farmers are disadvantaged as a consequence of unemployment (Moyo, 2013). It can be argued that lack of employment is an outcome of the worsening economic conditions in Zimbabwe, which emerged in the late 1980s, as a result of economic strangulation by Western countries and the suspension of the balance of payment support by Bretton Woods Institutions (Moyo et al., 2019). The nature of the selection of beneficiaries during the FTLRP, where farmers without any form of income were mainly considered under the A1 settlement model, has also tended to accentuate these differentials (Moyo et al., 2009).
Relating to food production, one key finding is that the peasant sector is more food self-sufficient when compared to the medium-scale and highly capitalized groups. A total of 97% of farmers in the peasant cluster were able to produce maize for auto-consumption, a figure which is significantly higher when compared to the other two clusters.
Cluster 2: Medium Capitalist Farmers
A second cluster that was noted was that of medium capitalist farmers whose average arable landholdings was 19.75 ha, significantly much higher than average arable land size owned by the peasantry group. About 36.9% of the sampled households fall under the medium capitalist cluster. The arable landholdings for this category were, however, much lower when compared to average landholdings that prevail under the national TMAS (133.9 ha). The difference underscores differential landholding sizes between the national trimodal and the sub-national agrarian structures that this study examined. Sub-national agrarian structures in drier agroecological zones show that farmers under this cluster own relatively large landholding sizes when compared to Chiredzi and Zvimba sites. Although Chiredzi district is located in a drier agroecological zone, the smaller arable land owned is attributed to high demand for land, owing to the lucrative nature of sugar production (Scoones et al., 2016).
Evidence shows that the majority of farmers (94.3%) under this group were drawn from A2 farmers, while only 5.7% were A1 farmers. This validates the TMAS, which asserts that medium capitalist farmers are largely determined by land sizes (see Moyo & Yeros, 2005). The fluidity and transition of A1 farmers from the peasant category to the medium capitalist sector are functions of various factors that include land transactions, which are shown by various studies to be on the rise (see Mazwi, 2020; Mudimu et al., 2020a). However, as it is argued, the degree of social differentiation tends to be inhibited by state-based tenure, which predominates Zimbabwe’s agrarian sector (Yan & Chen, 2016).
The social medium capitalist farmers were from a better-off background when compared to the first cluster. This group had more farmers who had completed advanced-level secondary education (5.3%), tertiary college (14.7%), and university education (9.3%). As has been argued, higher levels of education help farmers in decision-making and ultimately in asset accumulation (Sachikonye, 1989; Schultz, 1964; Weir, 1999). Equally important to note is that more farmers in this cluster originated from communal areas (80%). Those with urban backgrounds constituted 18.7% of the farmers, whereas only 4% of the farmers had urban backgrounds in the poor peasant cluster. Most urbanites have always been considered to be advantaged, in that they are more likely to become prosperous farmers (Sachikonye, 1989; Scoones et al., 2017). Therefore, the area of origin is a key consideration in analyzing the class character of social groups in the countryside, post-FTLRP in Zimbabwe.
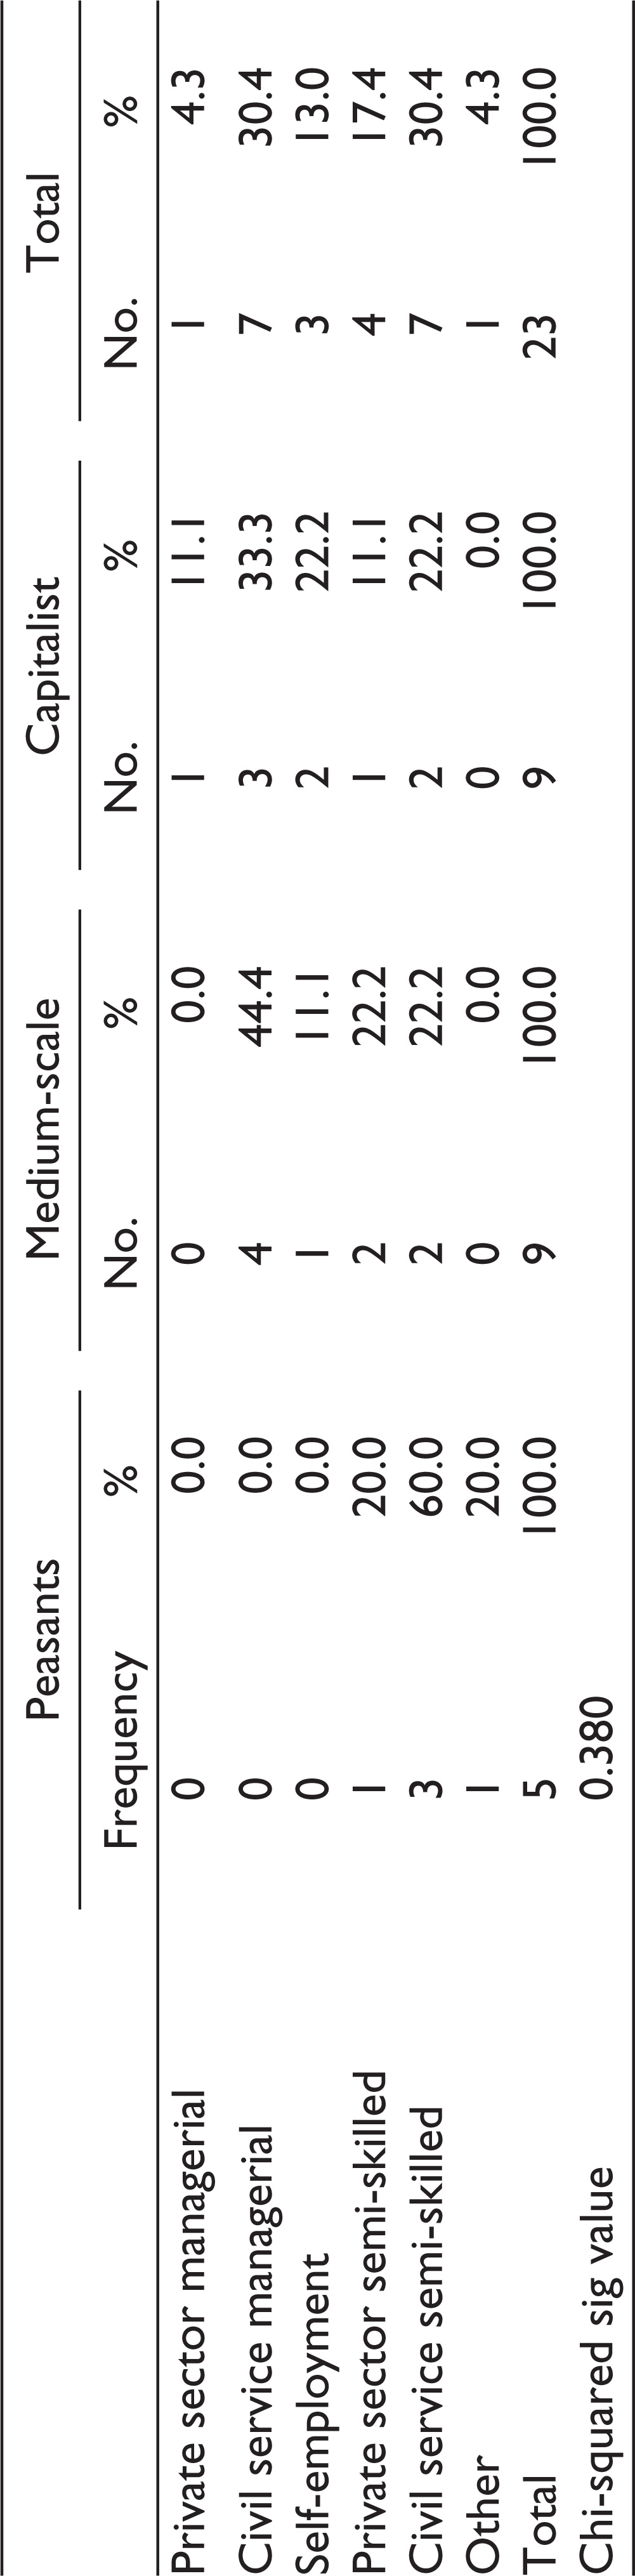
As presented in Table 1, 16.2% of farmers in this cluster were employed, and out of these, the majority share of the farmers (44.4%) was employed in civil service managerial positions, followed by the private sector semi-skilled (22.2%), civil service semi-skilled (22.2%), and self-employed (11.1%) (see Table 2).
Employment Status/Profession
Land Access
Farmers who received pensions were significantly higher (53.5%) when compared to the peasant cluster (9.9%). Interestingly, medium-scale capitalist farmers had better access to credit from private commercial banks (59.1%) and had a few farmers (1.5% ) who relied on GoZ’s input subsidies. These variables are indicative of how better off farmers in this category are when contrasted with those in the peasant cluster.
The ongoing differentiation in the countryside can be attributed to other factors such as access to finance, values attached to different crop commodities in different clusters, and land sizes, as already discussed. The majority of farmers (94.7%) who are in this cluster were located in the Chiredzi district and cultivated sugarcane, which is more lucrative. Comparatively, 97% of farmers in the peasant cluster were found in Zvimba district and engaged in tobacco products for the markets. Key to note is that tobacco output prices, which are tagged at US$626 per hectare, are far much lower when compared to those of sugarcane, which are at US$2662 per hectare.
In terms of capital-intensive assets like tractors and vehicles, the medium capitalist group accumulated more when compared to the peasant cluster, although the level of ownership was lower than the highly capitalized farmers. A total of 30.7% and 89.3% of medium capitalist farmers owned tractors and vehicles, respectively. Although it must be acknowledged that the purchase of these assets is a function of entrepreneurship outside farm production, it is equally important to note that the state, particularly in Chiredzi, has been used as a frontier to accumulate assets like tractors under the farm mechanization program (Mazwi & Muchetu, 2015). More than 50% of farmers in this group are former senior civil servants, and many of them instrumentalized their positions in the public service to access the tractors. However, these farmers were not better off in other spheres of capital formation. For instance, none of them owned cattle. Contrarily, 100% of the farmers in the peasant cluster owned livestock. In the Zimbabwean countryside, farmers consider livestock, and, in particular, cattle, as a great measure of success and a symbol of wealth (Moyo et al., 2009). The non-ownership of cattle by medium capitalist farmers can be explained by land-use patterns. Generally, livestock ownership is not evenly spread among sugar producers in Chiredzi, as grazing land is limited (Mlambo & Pangeti, 1996). As such, only the highly capitalized farmers sometimes rear cattle using pen-fattening methods.
One notable feature about the medium capitalist cluster is that 100% of the households hired casual and permanent labor, a proportion that is significantly higher than the peasant cluster (69.1%). For Patnaik (2001), the hiring of permanent labor is a key variable denoting a shift toward capitalist-oriented agriculture. Survey results show that in the 2015–2016 agricultural season, 63.3% medium capitalist farmers hired an average of two farmworkers. The remaining share of farmers under this cluster only hired one permanent farmworker. The share of farmers who hired permanent workers in this group was higher than the peasant cluster, which only had 3% of farmers who hired two or more permanent workers. Of particular note, the medium capitalist cluster had a limited deployment of family labor (13.3%) in contrast to the peasant cluster (93.1%). This finding, which has an orientation toward labor patterns, validates assertions that within the TMAS, medium capitalist farmers rely much on hired labor, while the peasant sector utilizes family labor to propel agricultural production (Moyo & Yeros, 2005). The reliance on family labor by the peasant sector is interpreted by analysts to be indicative of self-exploitation. When farmers are engaged in cash crops or export-oriented production, they tend to work beyond normal working hours, while, at the same time, compromising their health (see Shivji, 1992).
Cluster 3: Highly Capitalized Farmer Group
The third and last group to emerge from the study’s cluster analysis was named the highly capitalized farmer group, in accordance to its main features. The hiring of paid labor, alongside land sizes, access to private agricultural credit, and cattle ownership were key variables that determined the classification of farmers into this group. This cluster had the least share of farmers among the three groups. These constituted 13.3% of the sample. Notably, this is a subgroup of capitalist farmers together with medium-sized capitalist farmers under the TMAS (Moyo, 2013). The third group under the TMAS conceptualization of LSCF, state farms, agro-industrial estates, and plantation estates, which are usually over 2000 ha (with some being 40,000 ha), was not subjected to this analysis. The outcome of the cluster analysis, therefore, means that as with the TMAS, the capitalist group is subdivided into two, namely medium and highly capitalist-oriented farms.
Constituting this group are A2 landholders (85.2%) and A1 farmers (14.8%). A closer analysis of this cluster reveals that the A2 farmers are drawn from Chiredzi, while the A1 farmers are from Zvimba’s self-contained plots. The policy design of the A1 system during FTLRP divided this settlement model into the villagized system and self-contained plots (Utete, 2003). The latter are larger sized, and in some districts, these measure up to 30 ha (Muchetu, 2018, p. 78). Therefore, the policy design of land sizes in the A1 settlement model, where self-contained plots are larger, explains why A1 farmers who would ordinarily be classified under the peasant cluster now fall in the highly capitalized farmers’ cluster. This finding concurs with TMAS, which argues that with adequate financial resources, A1 self-contained farmers have a higher likelihood of transitioning into the capitalist category, and that land is a central feature in the trimodal framework. In short, these classes are not static (Mazwi & Mudimu, 2019).
In terms of arable land, the highly capitalized category held larger average landholdings (25.46 ha) when compared to both the peasant group (8.97 ha) and medium-sized capitalist cluster (19.75 ha). Again, this confirms the fact that land size is central in class formation (see Chambati, 2011; Moyo & Yeros, 2005; Lenin, 1971). Social profiles of farmers in this cluster show that the majority were, before the FTLRP, settled in urban areas (51.9%), followed by those who came from CA (29.6%), place of employment in another area (11.6%), and LSCFs (7.4%).
In terms of education, a significant proportion of farmers in this group attained tertiary education either at college or at university level (40.7%), while those who had not completed secondary education were only confined to 18%. The results further confirm a positive correlation between education and capital formation in the agrarian sector.
From a gender perspective, although the number of women who owned land was significantly lower than that of males across all farmer groups (based on the fact that few women accessed land in their name during the land reform), there were no statistically significant differences in gender proportions between these clusters. The highly capitalized farmer group had fewer females (7.4%), followed by the peasant cluster (14.9%) and the medium capitalist farmers (17.3%). Despite these differences, a statistical analysis showed that gender was not a clustering variable.
On labor use, the highly capitalized group hired more paid permanent labor (3 workers) and casual labor (11 workers) than the other two clusters, thus utilizing fewer family labor (4 members) for crop production purposes. The use of fewer members of the family for labor and the hiring of more permanent and casual workers denote a shift toward capitalist agriculture. Family labor for the highly capitalized farmer group was deployed to the fields for fewer labor-days annually (55 days) when compared to medium capitalist farmers and the peasantry who worked, an average, for 64 and 75 days, respectively.
Other key distinguishing features for this group were access to agricultural credit, cattle ownership, and ownership of productive assets. Almost all farmers in this cluster (92.6%) secured credit from banks. Access to this type of financing system enabled them to be more successful in agriculture. Of particular note, 100% of the farmers in this category owned cattle. Farmers in this cluster owned an average of 18 cattle, much higher than the peasant group that owned an average of 10 cattle. The ownership of cattle by highly capitalized farmers points to accumulativist diversification, which is concomitant to the process of accumulation. Studies indicate that rich households diversify on an accumulative mode, whereas poor households diversify on a survivalist mode (Ellis, 1998). Also, sugar out-growers and the plantation estate had diversified into cattle production as a strategy to navigate through volatile global markets (Mazwi, 2019; Sachikonye, 1989).
As Shivji (1992) argues, capitalist farmers or kulaks tend to invest in other enterprises like transport and retail as a sign of accumulation. As presented in Table 1 (page 13), in the highly capitalized group, 77.8% of the farmers owned tractors and 92.6% owned vehicles. Tractors are capital-intensive assets, which demonstrate a higher degree of capitalization. In all these variables, this cluster had accumulated more assets when compared to the other two groups. Interviews with leaders of producer associations revealed that most farmers in Chiredzi who were highly capitalized were involved in the transport industry and used most of the vehicles they acquired for this purpose. Again, this was one act of diversification into non-agricultural activities on an accumulation mode, further signifying the farmers’ transition to capitalist relations.
Concluding Remarks
This article focused on the social differentiation that occurs at the sub-national level in Zimbabwe. The article made use of the TMAS as an analytical framework. It can be observed that the national TMAS also finds expression in various sub-national agrarian structures although differences between sub-national structures were recorded. The TMAS framework with its key variables, such as land sizes, access to credit, asset ownership, employment, labor utilization patterns, is a useful entry point in analyzing social differentiation not only in Zimbabwe but also in Sub-Saharan Africa. This study validates assertions that land sizes and access to credit are key elements in the TMAS with a propensity to shape social stratification in rural communities. Beyond this, the study also added variables such as agroecological potential and the crop commodities produced to explain social differentiation patterns in Zimbabwe.
It is also quite evident that state-based tenure, which has been prevailing in Zimbabwe since the advent of the FTLRP, has been one of the factors that has stalled the transition of peasant farmers to either the medium-scale or the highly capitalized clusters. With state-based tenure, land transactions have been criminalized for close to two decades. This has constrained peasant farmers’ capacities to rent or purchase more land for agricultural purposes.
It is difficult, therefore, to visualize inter-cluster shifts since the majority of highly capitalized farmers had large land sizes (A2), while the peasantry cluster was made up of small-scale farmers (A1). However, some A1 self-contained farmers who had originally been classified under the peasantry within the TMAS mutate into medium-sized or highly capitalist farmers, given the right conditions like access to credit and land sizes. We argue that these should be considered medium capitalist farmers as opposed to peasants. Since the recent re-liberalization of the economy and the promotion of subletting and joint ventures, there is a surge in land rental markets (both formal and informal). The reliberalization of land and the economy is likely to accentuate differentiation in the countryside in the coming years. Public policy is thus a critical factor that must not be missed in any analysis of the TMAS and social differentiation patterns.
Footnotes
Declaration of Conflicting Interests
The authors declared no potential conflicts of interest with respect to the research, authorship, and/or publication of this article.
Funding
The authors received no financial support for the research, authorship, and/or publication of this article.