
Abstract
This research investigates the applicability of the random walk hypothesis in the context of the Dhaka Stock Exchange (DSE) and its benchmark DSE30 index, with a specific focus on evaluating the weak-form efficiency of Bangladesh’s capital market. Utilizing a diverse array of econometric techniques—such as the augmented Dickey–Fuller and Phillips–Perron unit root tests, autocorrelation analysis, Ljung–Box Q-statistics, runs test and the Brock–Dechert–Scheinkman test for nonlinear dependencies—the study explores return patterns across daily, weekly and monthly intervals spanning from 2013 to 2025. The analysis yields consistent evidence against the random walk hypothesis in daily and weekly returns, revealing serial correlation and deviations from weak-form market efficiency. In contrast, the findings for monthly data remain ambiguous, offering only limited support for randomness. These results suggest that past price movements retain some predictive power, thereby challenging the notion of informational efficiency in its weak form. Furthermore, the outcomes align with existing literature on developing markets, where structural inefficiencies, asymmetric information and regulatory shortcomings often impede full market efficiency. The study enriches the discourse on market dynamics within emerging economies by emphasizing persistent departures from theoretical efficiency assumptions.
Keywords
Introduction
The question of whether financial markets operate efficiently has been a key focus in financial economics for many years. The efficient market hypothesis (EMH), especially in its weak form, argues that asset prices fully incorporate all historical information, making it impossible for investors to consistently earn abnormal profits by studying past price trends (Fama, 1970). Under the weak-form EMH, market prices should follow the random walk hypothesis (RWH), meaning that price changes occur independently and follow the same probability distribution. According to the RWH, price changes are driven by new, unpredictable information, making historical patterns irrelevant for forecasting future prices. In such markets, technical analysis becomes ineffective and returns are unpredictable. Therefore, testing for a random walk in asset prices is critical for evaluating a market’s informational efficiency.
Emerging markets, however, often deviate from this ideal. Structural inefficiencies, limited information dissemination, regulatory shortcomings and behavioural biases can impair market efficiency. Previous empirical studies across various lower-middle income countries—including those by Urrutia (1995), Al-Jafari (2015) and Squalli (2006)—have frequently reported weak-form inefficiency, suggesting that investors in these markets may exploit historical trends to earn abnormal profits. For Bangladesh specifically, recent studies such as Rahman and Hossain (2021), Ahmed and Hossain (2019) and Haque and Dionisio (2021) have shown that the Dhaka Stock Exchange (DSE) fails to conform to weak-form efficiency.
The primary objective of this research is to evaluate the validity of the RWH within the context of the DSE and its principal index, the DSE30. To achieve this, the study employs a broad spectrum of statistical tools, incorporating both parametric and non-parametric approaches. The analysis is based on logarithmic return series observed at daily, weekly and monthly frequencies, covering the extensive period from 2013 to 2025. Unit root behaviour and stationarity characteristics of the data are examined using standard procedures, notably the augmented Dickey and Fuller (ADF, 1979) and Phillips and Perron (PP, 1988) tests. Additionally, autocorrelation functions and Ljung and Box (1978) Q-statistics are applied to detect linear dependencies, while the runs test serves to explore the randomness of return sequences from a non-parametric perspective. To capture potential nonlinear relationships or departures from the assumptions of independently and identically distributed (i.i.d.) returns, the Brock, Dechert and Scheinkman (BDS, 1987) test is also incorporated. By juxtaposing empirical return patterns with the theoretical expectations of the random walk framework, the study aims to provide a nuanced understanding of market efficiency in Bangladesh’s stock market. The findings offer practical implications for both market participants seeking to optimize investment decisions and regulatory bodies striving to foster greater transparency and stability in financial markets.
Although numerous prior studies have highlighted the inefficiency of emerging stock markets, including Bangladesh, much of this research has been constrained by short sample periods, limited testing techniques or analyses restricted to specific data frequencies. This study seeks to address these gaps and makes several distinct contributions to the existing body of literature. First, it expands the scope of weak-form EMH testing for the DSE by utilizing a rich data set comprising daily, weekly and monthly returns spanning the period from 2013 to 2025. Second, unlike many earlier investigations that rely predominantly on either parametric or non-parametric tools, this study adopts a more holistic methodological approach by combining unit root analyses, autocorrelation assessments, the Ljung–Box Q-statistic, runs tests and the BDS test for nonlinear dynamics. Third, the research delivers a more refined evaluation of market efficiency by revealing strong deviations from the RWH in daily and weekly returns, while also uncovering limited and mixed evidence of randomness in monthly observations. These findings provide deeper insights into the underlying mechanisms of return formation in the Bangladeshi equity market and contribute to the broader discourse on price predictability within frontier markets. The results hold practical significance for regulators, policymakers and investors by offering guidance for improving market integrity, refining regulatory structures and developing more informed investment strategies. This article is structured as follows: The second section reviews the literature on the RWH and weak-form efficiency with a focus on emerging markets. The third section details the data sources, variables and econometric methods employed in the analysis. The fourth section presents and interprets the empirical results, while the fifth section concludes with a summary of key findings, policy recommendations and avenues for further research.
Literature Review
The RWH and the broader concept of market efficiency have been central themes in financial economics for decades. The hypothesis, originally advanced by Fama (1965), suggests that stock price changes are independent and identically distributed, implying that future returns cannot be predicted from past price movements. This theoretical framework has motivated extensive empirical investigations across both developed and developing stock markets. The RWH has become increasingly prominent in the finance literature, with numerous studies examining its applicability to stock prices, exchange rates and other financial assets, often providing substantial support for the theory.
This study summarizes the empirical literature testing the RWH of stocks. The study systematically examines the methods used, data periods and results obtained. They are presented in Table 1, sorted from the past to the present. While the existing literature in Table 1 highlights several emerging and Asian markets, it is important to note that RWH is a universal concept that has been tested in both high-income and emerging economies. Seminal studies from developed markets such as the United States, the United Kingdom and Japan have provided important methodological benchmarks for testing RWH. In this way, methodological developments over time and findings on market efficiency are made more understandable.
Literature Studies.
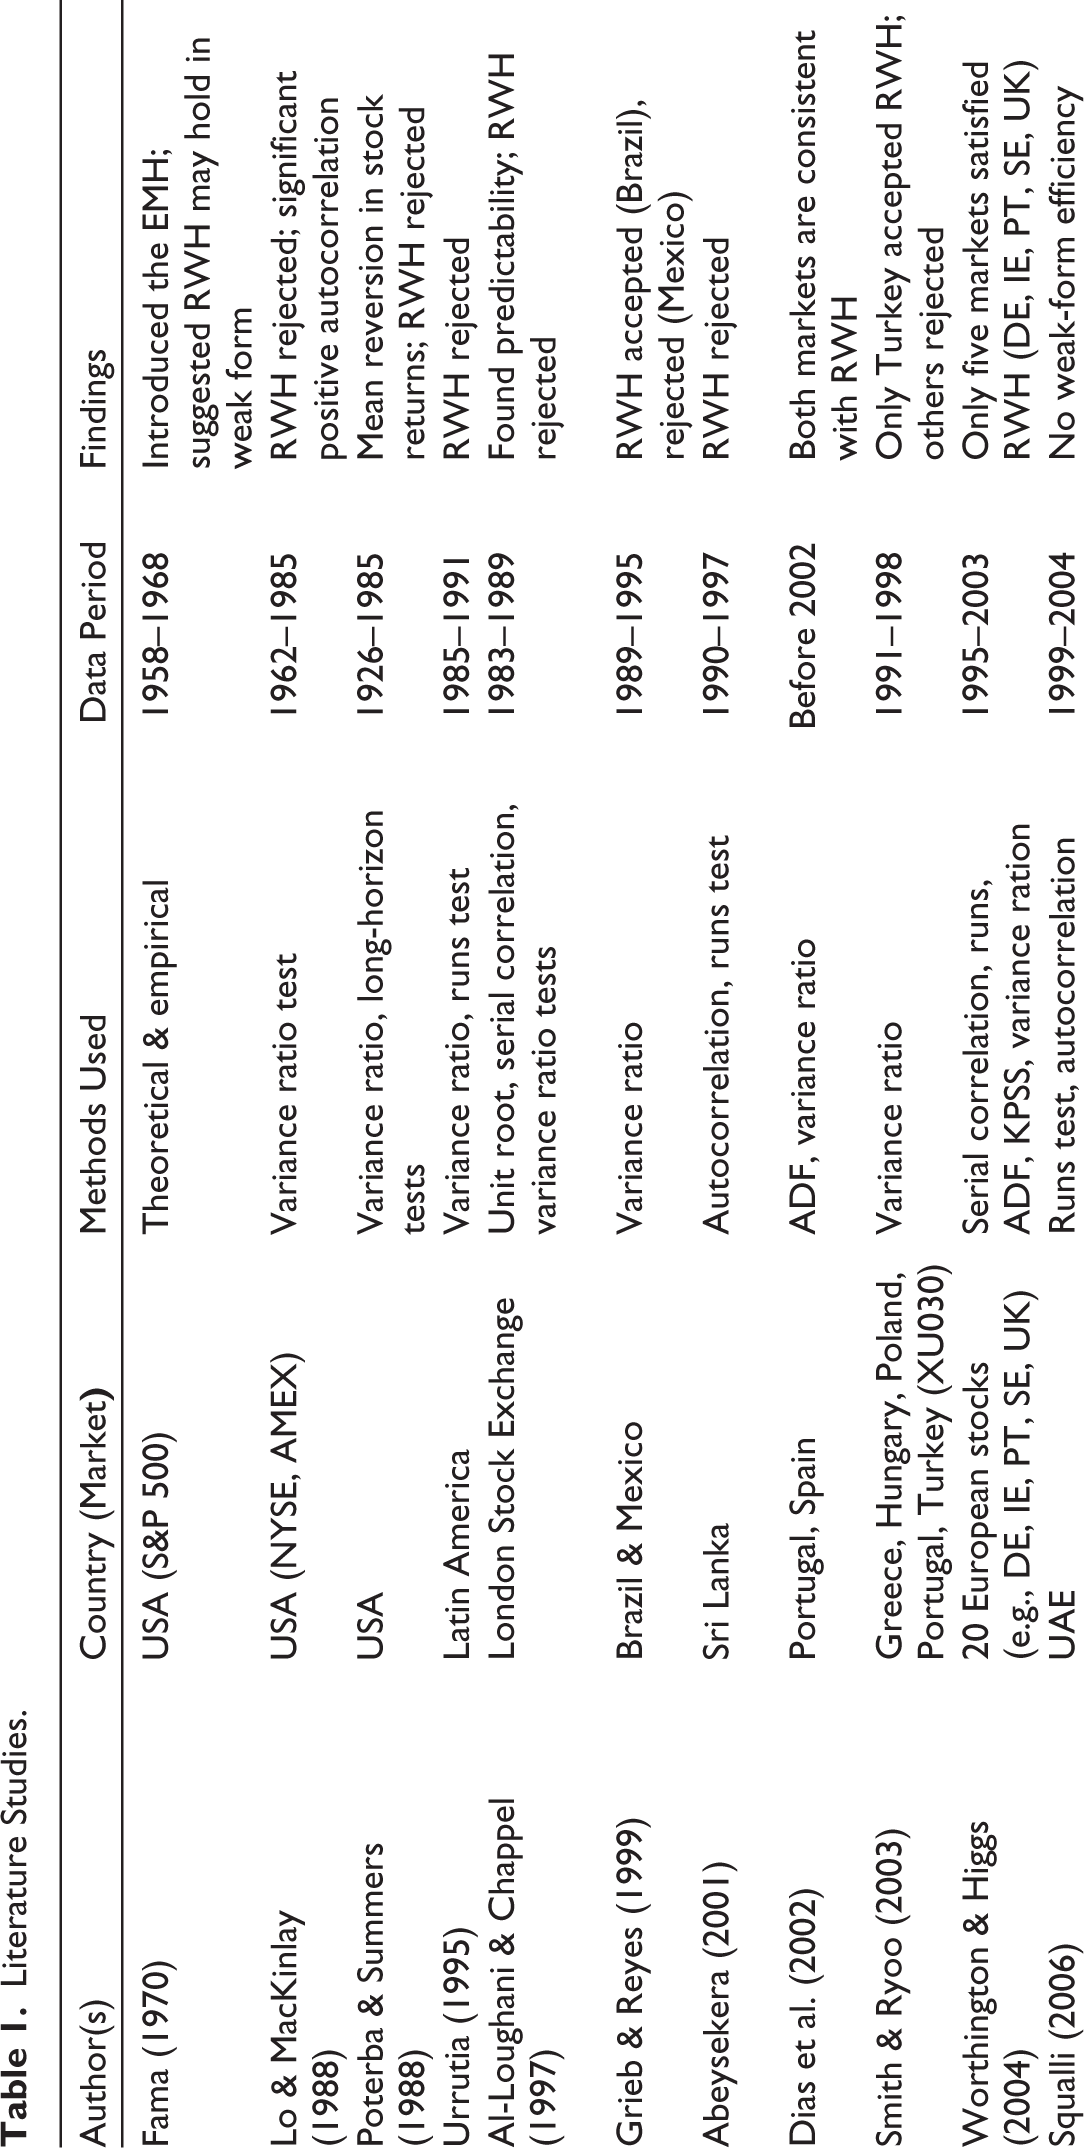
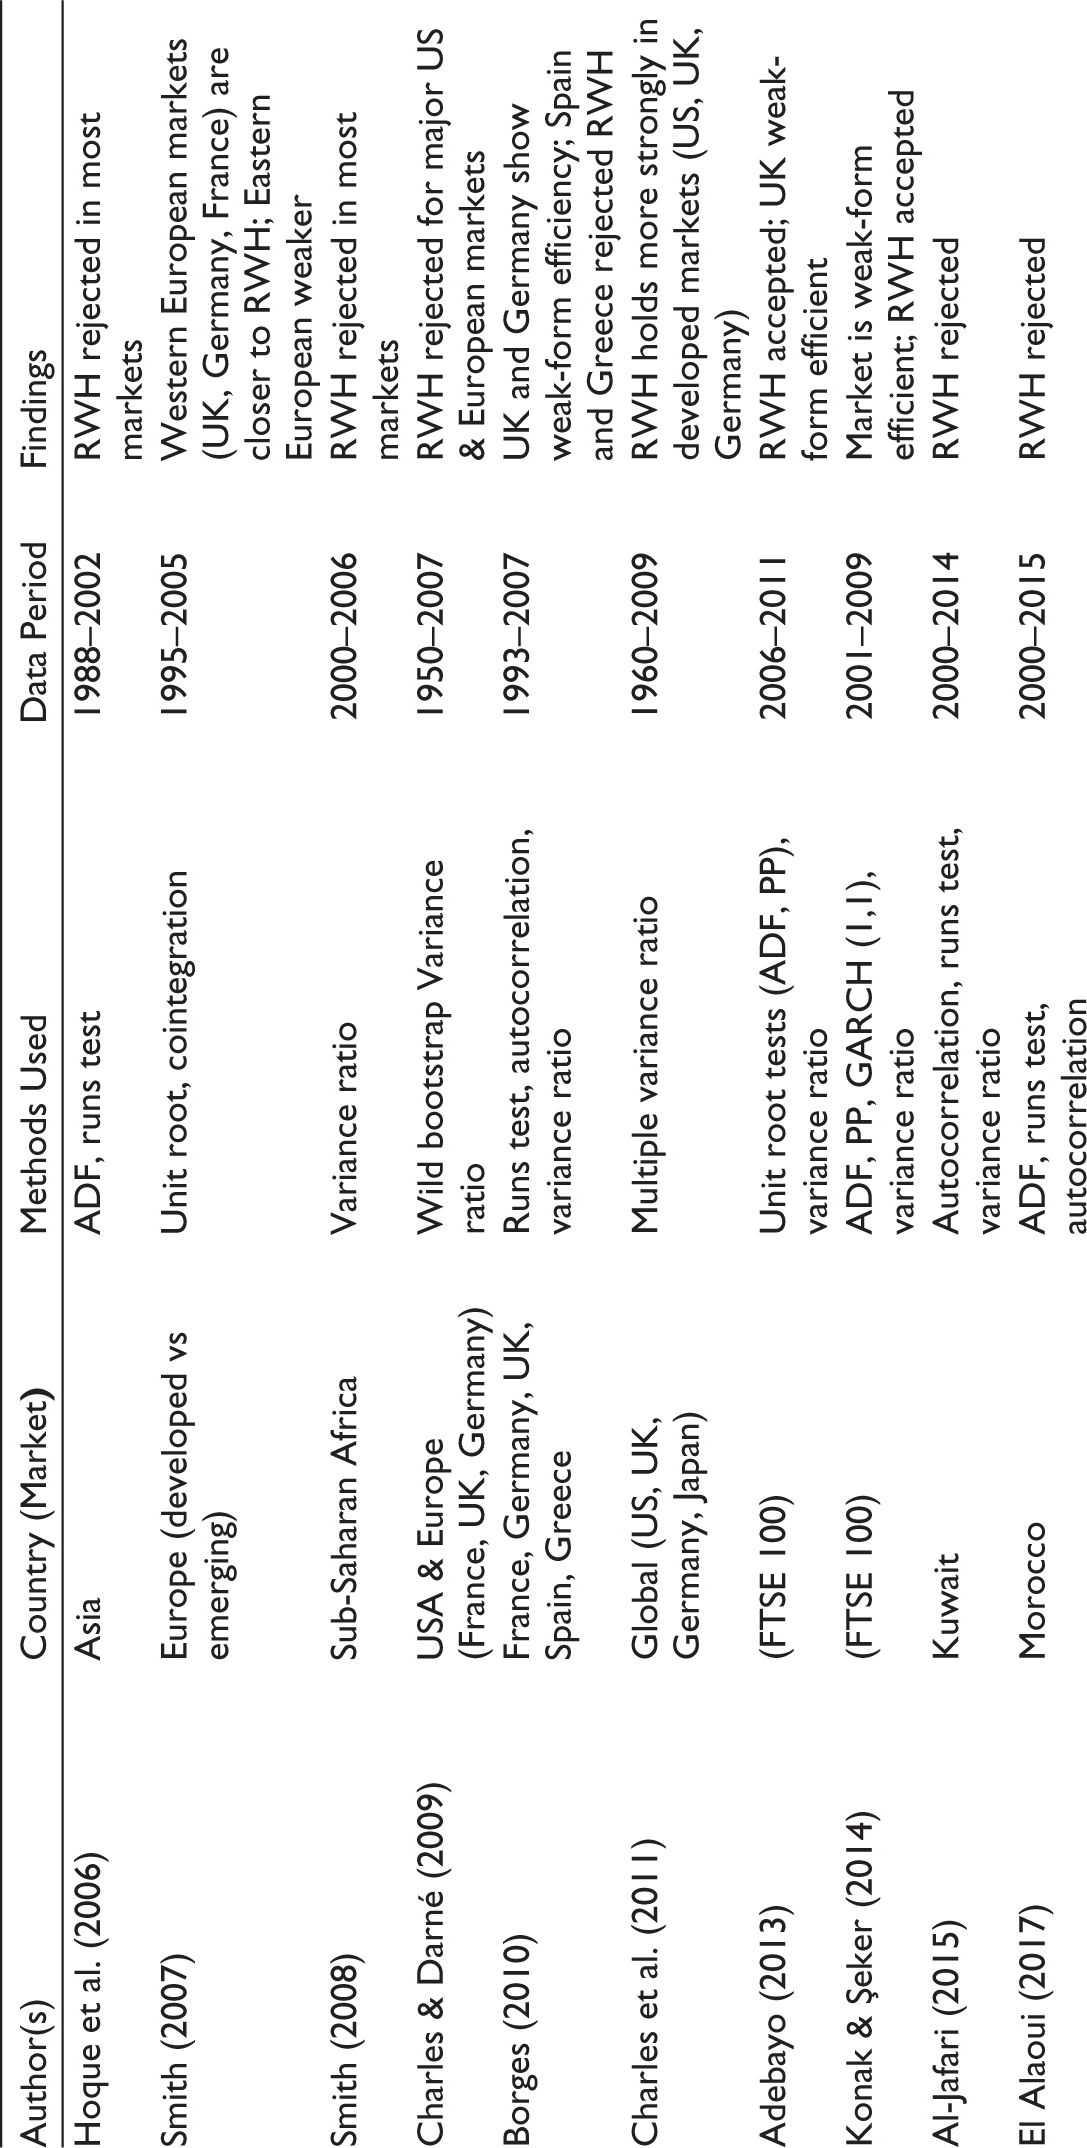
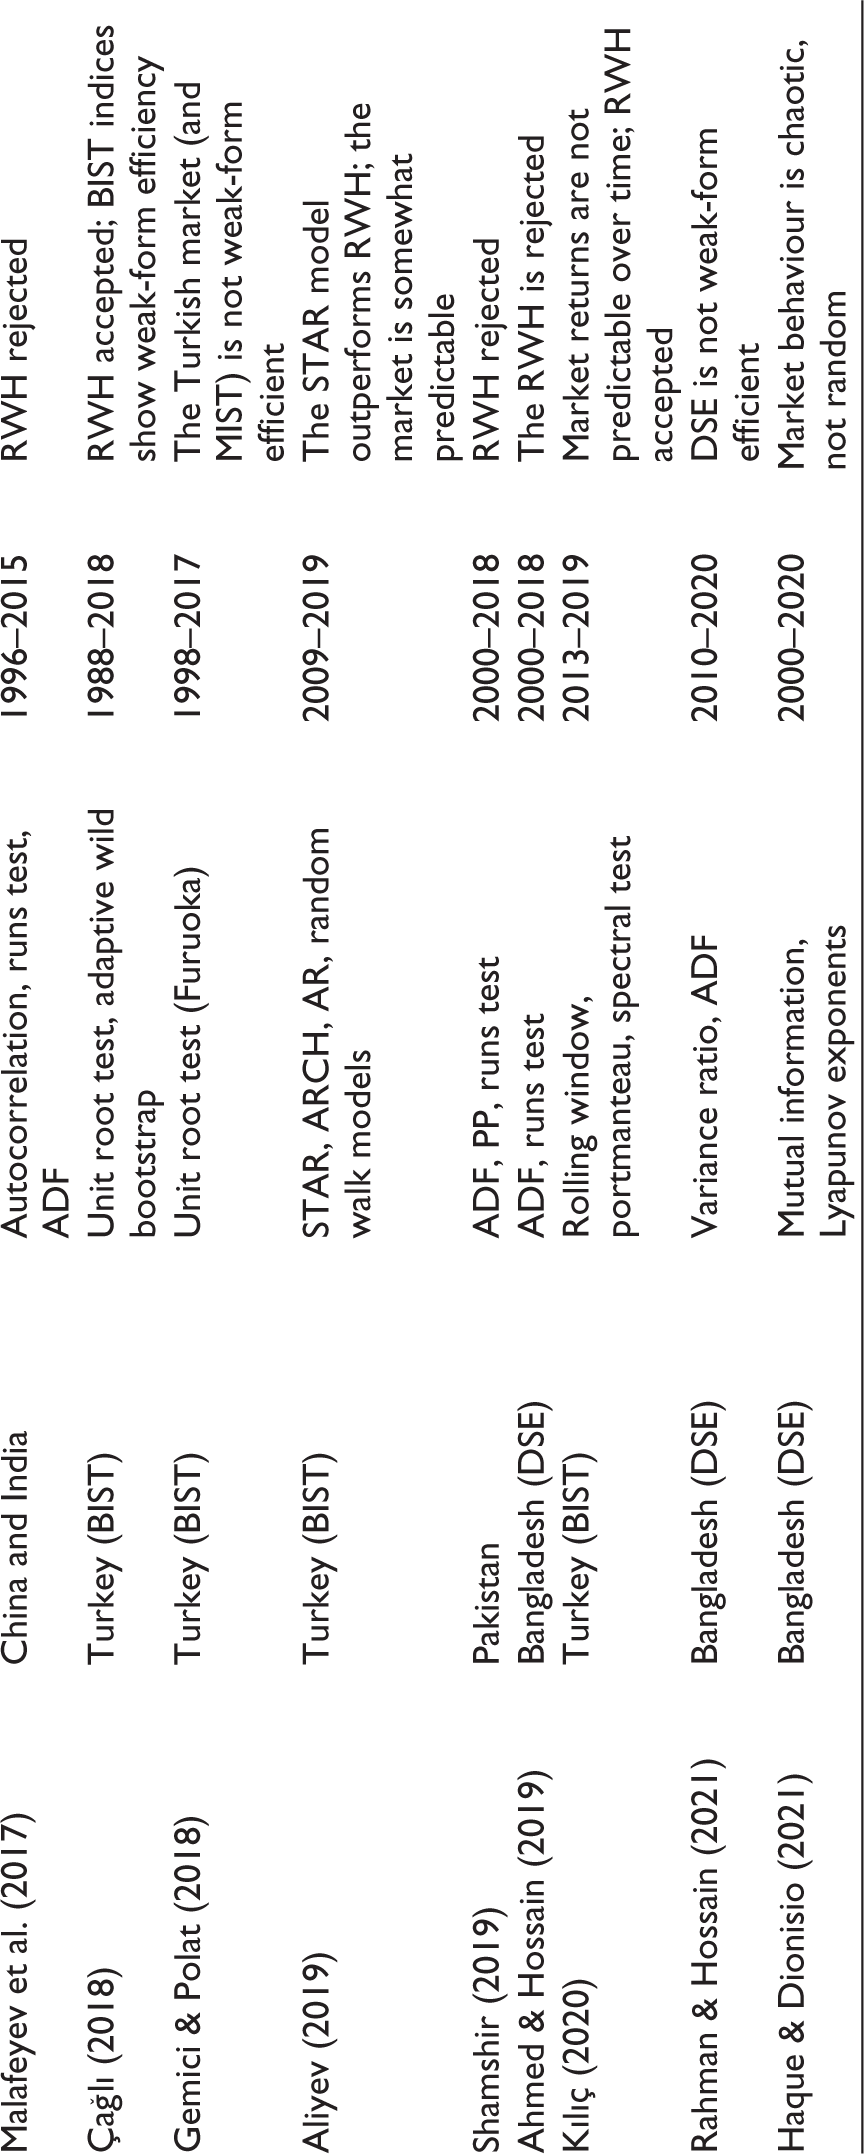
The RWH, which is central to the weak-form EMH, has been extensively tested across developed and emerging financial markets. Numerous empirical studies have aimed to verify whether stock prices move independently and are thus unpredictable or whether historical information can be used to forecast future price movements. Much of the early empirical work focused on advanced markets, particularly in the United States and Europe. Lo and MacKinlay (1988) provided one of the most influential critiques of the strict RWH by documenting short-term return predictability in US markets, while Campbell et al. (1997) further emphasized deviations from pure randomness due to market microstructure effects. Despite such anomalies, the consensus remains that advanced markets tend to exhibit strong-form or at least weak-form efficiency over longer horizons. In Europe, Worthington and Higgs (2004) tested a range of equity markets and found evidence of weak-form efficiency in several Western European countries, though not uniformly across all. Similarly, Smith and Ryoo (2003) examined the United Kingdom and found that stock returns generally follow a random walk, consistent with the market efficiency hypothesis. Studies on Japan (e.g., Narayan & Smyth, 2004) and other developed Asian markets reveal similar findings, suggesting that larger, more liquid markets tend to conform more closely to RWH.
A substantial body of research has investigated the weak-form efficiency of the UK stock market through various time series methodologies. For instance, Adebayo (2013) examined the FTSE100 index over the 2006–2011 period by employing unit root tests, including the ADF and PP procedures, alongside the variance ratio test. His findings supported the weak-form efficiency of the UK market, aligning with the principles of the RWH. Similarly, the study by Konak and Şeker (2014) utilized ADF, PP, GARCH (1,1) and variance ratio techniques for FTSE100 data covering 2001–2009, reaching comparable conclusions in favour of weak-form efficiency. However, earlier research conducted by Al-Loughani and Chappel (1997), which focused on the London Stock Exchange, presented contrasting results by uncovering evidence of return predictability, thereby refuting the RWH for that specific period. Collectively, these studies indicate that while more recent data for the UK stock market generally support the notion of market efficiency, earlier periods may have been characterized by inefficiencies and return predictability.
Several empirical studies have investigated the validity of the RWH in European stock markets using time series analysis. Dias et al. (2002) analysed the Portuguese and Spanish stock markets and found that both were consistent with the RWH using the ADF and the variance ratio tests. Smith and Ryoo (2003) applied the variance ratio test to several emerging European markets. They found that only the Turkish stock market followed the random walk, while the others (Greece, Hungary, Poland and Portugal) did not. Similarly, Worthington and Higgs (2004) tested 20 European stock markets using statistical methods, including serial correlation, ADF, KPSS and variance ratio tests. Their results showed that only a few markets (i.e., Germany, Ireland, Portugal, Sweden and the UK) were weak-form efficient. These findings suggest that market efficiency varies considerably across European countries.
In the context of South and East Asia, Malafeyev et al. (2017) investigated the Chinese and Indian equity markets using autocorrelation, the runs test and the ADF test. Their results rejected the RWH, indicating that returns were significantly autocorrelated and not independent over time. Similarly, Al-Jafari (2015) analysed the Kuwaiti market using similar methodologies and also found that the market was not weak-form efficient over the period 2000–2014. These findings underscore the structural and informational inefficiencies commonly observed in emerging markets.
Previous research, including Urrutia (1995), which focused on Latin American markets, employed variance ratio and runs tests to determine that stock returns in countries such as Argentina, Brazil and Mexico did not follow a random walk. Similar findings were reported by Squalli (2006) for the United Arab Emirates (UAE), who utilized non-parametric methods and found evidence against weak-form market efficiency in the UAE between 1999 and 2004.
Recent studies examining the RWH in the Turkish Stock Exchange (BIST) using time series methods provide mixed findings. Çağlı (2018) applied unit root tests and an adaptive wild bootstrap approach over a long period (1988–2018) and concluded that BIST indices are weak-form efficient. Conversely, Gemici and Polat (2018) found that the Turkish market and the MIST group do not follow a random walk using the Furuoka unit root test for 1998–2017. Aliyev (2019) used various nonlinear models, including STAR and ARCH, for the period 2009–2019 and found that the market exhibited some predictability, with the STAR model outperforming the RWH. In contrast, Kılıç (2020) used rolling window, portmanteau and spectral tests between 2013 and 2019 and found that market returns are unpredictable over time, supporting RWH. In general, it appears that the efficiency of the Turkish market is time-dependent and dependent on the methodology used.
The African continent has also been a subject of investigation. Smith (2008) applied variance ratio tests across Sub-Saharan African stock markets and found that most of these markets were inefficient in the weak form. Similarly, El Alaoui (2017) studied the Moroccan stock market over 15 years and rejected the RWH using ADF, runs and autocorrelation tests, pointing towards inefficient pricing behaviour and information asymmetry. Shamshir (2019) analysed the Pakistan Stock Exchange in South Asia and found significant autocorrelation and stationarity in return series, rejecting the RWH. Likewise, Abeysekera (2001) examined the Sri Lankan market using runs and autocorrelation tests and concluded that price changes were not independent, reinforcing the region’s inefficiency pattern. Grieb and Reyes (1999), a noteworthy exception in the literature, found divergent results: while the Brazilian stock market appeared to follow a random walk, the Mexican market did not. This result highlights that market efficiency can vary significantly even within similar economic contexts.
Several studies have specifically examined the DSE’s efficiency and broader emerging Asian markets. Rahman and Hossain (2021), using variance ratio and unit root tests, concluded that the DSE does not exhibit weak-form efficiency, a finding further supported by Ahmed and Hossain (2019), who noted that the DSE’s price behaviour allows for abnormal returns based on historical prices. Expanding on this perspective, Haque and Dionisio (2021) employed nonlinear methods, including mutual information and Lyapunov exponents, to detect chaotic patterns in market behaviour, suggesting that the Dhaka market is inefficient and structurally unstable. These observations align with broader regional studies; for instance, Hoque et al. (2006) tested several emerging Asian stock markets between 1988 and 2002 using ADF and runs tests and found that most did not follow random walk behaviour. These findings underscore that emerging markets, including Bangladesh, are prone to inefficiencies arising from institutional, behavioural and informational constraints.
The RWH, as a central pillar of the EMH, does not apply uniformly across markets. While it often holds in large, liquid and developed markets, it tends to break down in smaller, less liquid or emerging markets. This divergence is largely attributed to differences in market characteristics: larger and more liquid markets incorporate information more rapidly into prices; higher trading volumes and market depth reduce volatility and improve price discovery; and greater transparency mitigates information asymmetry. Conversely, shallow, illiquid and less-transparent markets are more prone to delayed adjustments, inefficiencies and predictable price patterns. Thus, whether RWH holds appears systematically linked to factors such as market size, liquidity, trading activity, depth and transparency (Urrutia, 1995). Recognizing these relationships not only clarifies why RWH is observed in some settings but also provides a theoretical anchor for examining its applicability in specific markets, such as Bangladesh, even if empirical testing is beyond the scope of this study.
Building on this theoretical framework, prior studies highlight notable differences between developed and developing markets regarding the validity of RWH. In high-income economies such as the United States, the United Kingdom and major European countries, strong regulatory frameworks, high liquidity, advanced trading technology and the prevalence of institutional investors enhance informational efficiency, allowing stock prices to quickly reflect new information (Karjaluoto et al., 2016). In contrast, developing markets often face weak regulatory enforcement, limited transparency, high transaction costs and a dominance of retail investors, fostering inefficiencies such as delayed information dissemination, overreactions and speculative trading (Alam et al., 2007). Macroeconomic instability and political uncertainty further exacerbate volatility, making purely random price movements less likely (Alam et al., 2011). Understanding these structural differences is crucial for assessing the efficiency of stock returns in Bangladesh, where deviations from a random walk could indicate inefficiencies that undermine investor confidence, hinder capital market development and spill over into the broader economy. Situating Bangladesh within this global context, therefore, provides a strong motivation for the present study.
In summary, the empirical literature strongly indicates that many emerging and frontier markets, including the DSE, do not conform to the weak-form EMH. The observed patterns of serial correlation, predictability and nonlinearity in return series challenge the assumption of market efficiency, suggesting that investors may exploit historical price information for profit. These findings provide both theoretical and practical motivation for further investigation of market dynamics in lower-middle income economies.
Data and Methods
In this study, data were taken from the Investing.com website to determine whether the EMH is weak-form efficient in the Dhaka stock market. In the study, both the Dhaka All Index (DSE) and the Dhaka 30 (DSE30) index data are taken on a daily (_D), weekly (_W) and monthly (_M) basis. The data cover the period between 2013 and 2025, when the Dhaka stock market started to be calculated.
There are both theoretical and empirical justifications for using logarithmic returns. Theoretically, they provide analytical convenience, particularly when aggregating returns over multiple periods. Empirically, logarithmic returns tend to exhibit a distribution closer to normality, which is a prerequisite for many standard statistical methods. Market log returns are employed as individual time series variables in most testing procedures. The market return (Rt) is derived from the index value using the following formula:
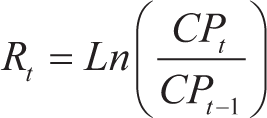
where Rt = market return in period t; CPt = close price at time t; CPt – 1 = the close price at time (t − 1) and Ln = natural logarithm. The descriptive statistics are calculated and presented in Table 2.
Descriptive Statistics.
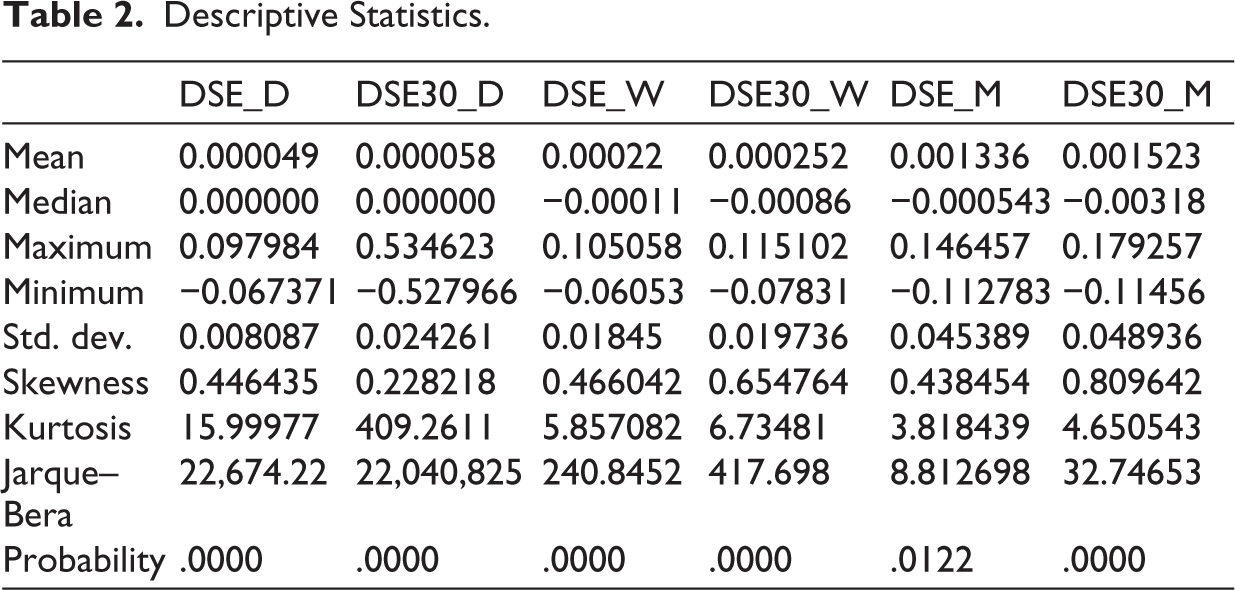
Descriptive statistics provide a quantitative summary of the key characteristics of the data. In the context of the random walk model, the return series is expected to follow a normal distribution. During the period, all series showed a positive average return. DSE_D has the lowest return with 0.000049. The highest return belongs to the DSE30_M series with 0.179257. DSE_W shows the highest median of −0.00011, and DSE30_M shows the highest standard deviation of 0.048936. Table 2 shows that the average returns increase as the measurement frequency approaches from daily to monthly frequency. A normally distributed series is characterized by a skewness of 0 and a kurtosis of 3. As illustrated in Table 2, the skewness and kurtosis values for all six indices diverge from the expected benchmarks of a normal distribution. To formally assess the normality of these return series, the Jarque–Bera (JB) test statistics, along with their associated p values, were evaluated. Given that each p value falls below the conventional .05 significance threshold, the null hypothesis of normality is decisively rejected across all indices. These results suggest that the return distributions for the examined market indices significantly deviate from normality, thereby contradicting one of the fundamental assumptions of the RWH. Accordingly, it can be inferred that none of the return series exhibit characteristics consistent with the random walk model, implying inefficiencies across the observed indices.
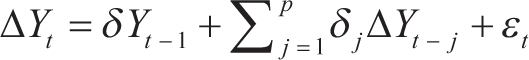
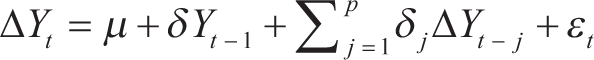
In time series studies, the series should first be tested to determine whether or not it is stationary. In simple terms, stationarity means that the effects of shocks occurring over time are temporary. In other words, in a stationary time series, the data generation process of the series does not change since the effects of shocks occurring over time disappear. On the contrary, when the shocks have a permanent effect on the series, the series will be non-stationary. The first formal test for testing stationarity is the ADF test. The ADF test is performed within the framework of three model structures. These model structures are shown as follows:

Phillips and Perron (1988) proposed a new test by introducing a more flexible restriction on the error term compared to the ADF test. The PP test corrects as follows:
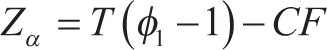
Where εt ~ IID (0, σ2) is the error term. In all models, the null hypothesis states that the series are non-stationary. Failure to reject the null hypothesis (H0: δ = 0) indicates that the series is non-stationary. On the contrary, if the null hypothesis is rejected, the series will be stationary.
The test for autocorrelation is one of the simplest ways to measure the randomness in a series. Autocorrelation coefficients reveal whether there is a relationship between current and past values of a return. For this purpose, the calculated autocorrelation coefficients are tested to determine whether they are statistically significant. The autocorrelations used in the test are calculated as follows:
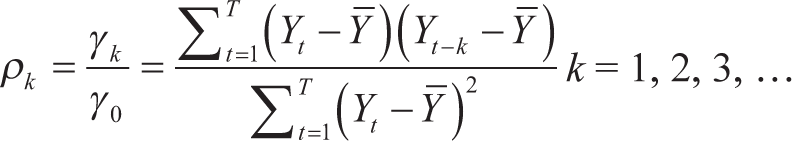
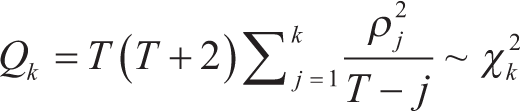
Where ρk is the autocorrelation coefficient between current (t) and k lagged (t − k) returns. γk is the autocovariance between t and t − k, and γ0 is the variance of returns. Q-statistics determine whether the calculated autocorrelation coefficients are jointly significant. The Ljung–Box (1978) Q-statistic, which is also robust in finite samples, is as follows. The Ljung–Box Q-statistic is tested with χ2 k degrees of freedom.
The runs test focuses on the ‘sign’ of return changes rather than their numerical values, allowing for the avoidance of negative effects from extreme values. A stock’s return can either increase (+), decrease (−) or remain unchanged (0) from one day to the next. In the ‘sign’ series thus created, successive identical signs are called a ‘run’. If the actual number of runs in a given ‘sign’ series is higher or lower than the expected number of runs, it is concluded that there is a correlation between the signs and the series is not random. The expected number of runs is calculated using the following formula:
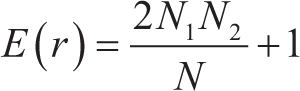
where E(r) is the expected number of runs of the related return, N is the total number of return changes (N1 + N2), N1 is the number of positive observations, N2 is the number of negative observations and r is the number of runs. The variance of the expected number of runs is calculated using the following equation:
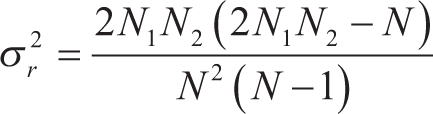
On the other hand, to test the statistical significance of the difference between the expected and observed conditions, it is necessary to calculate the standard variable.
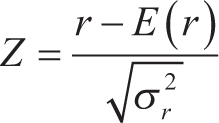
A significant difference between the observed and expected number of runs is obtained when the calculated values are greater than the critical value.
The BDS test, introduced in 1987, constitutes a robust and widely utilized statistical procedure aimed at detecting temporal dependence within a time series. Its principal function is to identify departures from the assumption of independence, encompassing a broad spectrum of dependence structures, including linear autocorrelation, nonlinear dependencies and even chaotic dynamics. This test is particularly instrumental in assessing whether a given return series adheres to the assumption of being i.i.d., a fundamental premise in many econometric and financial models. The core intuition behind the BDS test is straightforward yet powerful: it evaluates the spatial proximity of pairs of points within the reconstructed phase space of the series by defining a neighbourhood radius, denoted by epsilon (ε). Under the null hypothesis that the series observations are indeed i.i.d., the probability that the distance between any two randomly selected points falls within ε should be uniformly distributed across all possible pairs. Deviations from this uniformity signal the presence of dependence or structure in the data.
Mathematically, the BDS statistic is constructed by comparing the empirical correlation integrals of different embedding dimensions, allowing the test to capture complex forms of temporal dependence beyond linear correlations. The detailed mathematical formulation of the test statistic provides a rigorous basis for hypothesis testing, facilitating the detection of subtle dependencies that traditional tests might overlook.

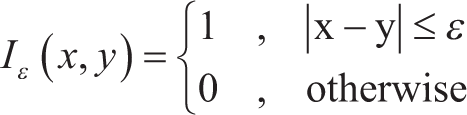
where Is is the indicator function and can be shown as follows:
The BDS test statistic to be calculated in this framework is as follows:
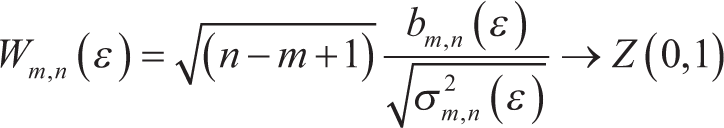
where
Empirical Results
In this section, a range of statistical procedures are employed to determine whether the Dhaka stock market exhibits characteristics of a random walk. To examine the weak-form efficiency of Bangladesh’s equity market, the analysis incorporates both parametric techniques, such as autocorrelation functions and Ljung–Box Q-statistics, and non-parametric approaches, including the runs test and the BDS test. Additionally, univariate unit root tests, namely the ADF and PP tests, are applied to assess the stationarity properties of the return series.
Unit Root Test
The random walk model fundamentally rests on the premise that a time series exhibits a random walk behaviour when it is non-stationary. To assess the stationarity properties of the observed series, the ADF test results are provided in Table 3. The findings indicate that the null hypothesis of non-stationarity for the price series is rejected at the 1% significance level, demonstrating that the price series is stationary. Conversely, the return series is found to be stationary at the same significance level. These outcomes suggest a deviation from the classical RWH, implying that market prices do not follow a pure random walk process. Consequently, this evidence points towards market inefficiency, as the presence of stationarity in returns indicates that investors may be able to exploit past price information to achieve abnormal returns, contradicting the weak form of market efficiency.
Unit Root Test Results.
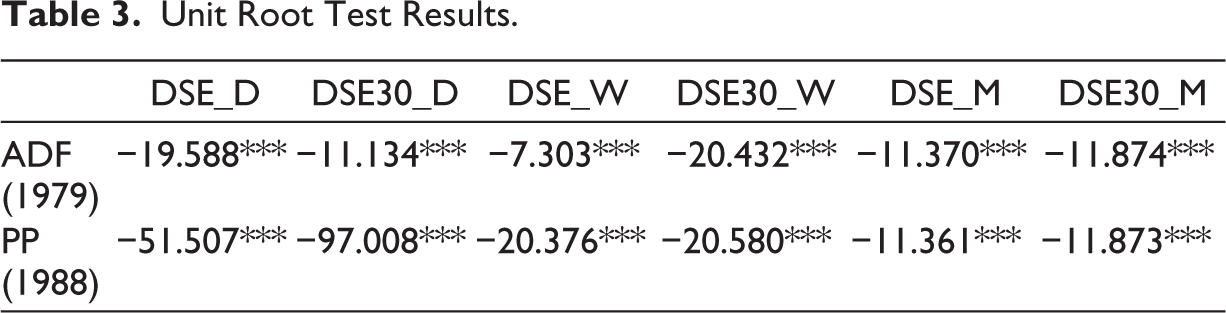
The results of both ADF and PP tests uniformly reject the null hypothesis of the presence of a unit root at the 1% significance level across all six stock indices examined. This statistical evidence strongly suggests that the return series of the Bangladesh stock market indices are stationary. Consequently, these findings imply that the Bangladesh equity market does not conform to the weak-form EMH, indicating the presence of weak-form inefficiency in the market dynamics.
Autocorrelation Test
If the autocorrelation coefficients calculated using the return series are not significant, the series follows a random walk, and investors cannot predict the future by looking at past price movements. In this case, there will be no correlation between price movements in period t and price movements in period t − 1. Table 4 presents the autocorrelation and Q-statistics results calculated for daily, weekly and monthly observations.
Autocorrelation and Q-statistics.
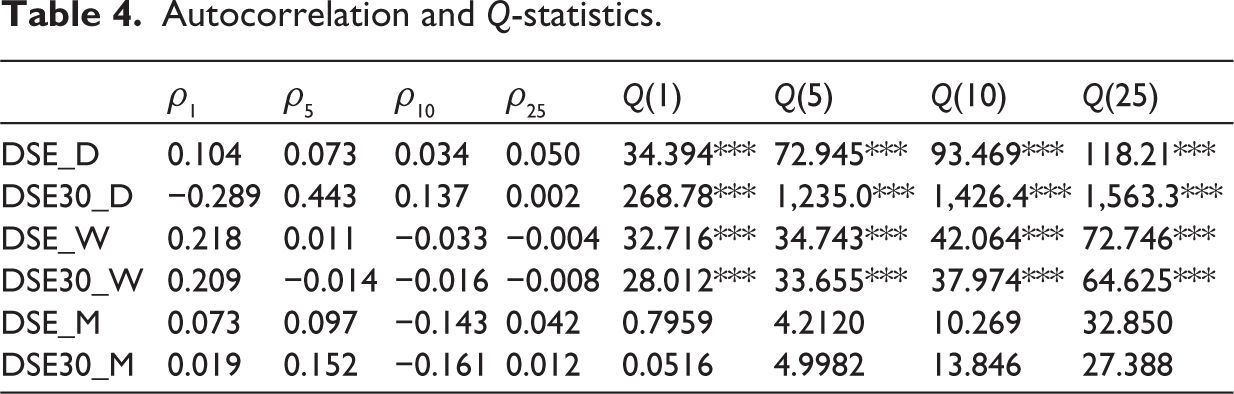
Q-statistics is a composite measure of autocorrelation for m lags. For all returns, autocorrelations seem to increase for all lags. All the Q-statistics measured are significant, mainly due to the high order of lag autocorrelation. The data appear to be strongly autocorrelated, and this relationship persists at higher degrees of autocorrelation. Therefore, the null hypothesis of no autocorrelation in the observed series is rejected for all return series. As shown in Table 4, this finding suggests that the market is inefficient. Security prices can be predicted using past prices, providing opportunities to earn excess returns by identifying undervalued stocks. In other words, there is a correlation between the return in period t and past return movements, and returns do not follow a random walk. In this case, investors can earn above normal returns.
Runs Test
The runs test is employed to assess the randomness (statistical independence) of the return series, and its results for all returns are presented in Table 5.
Results of the Runs Test.
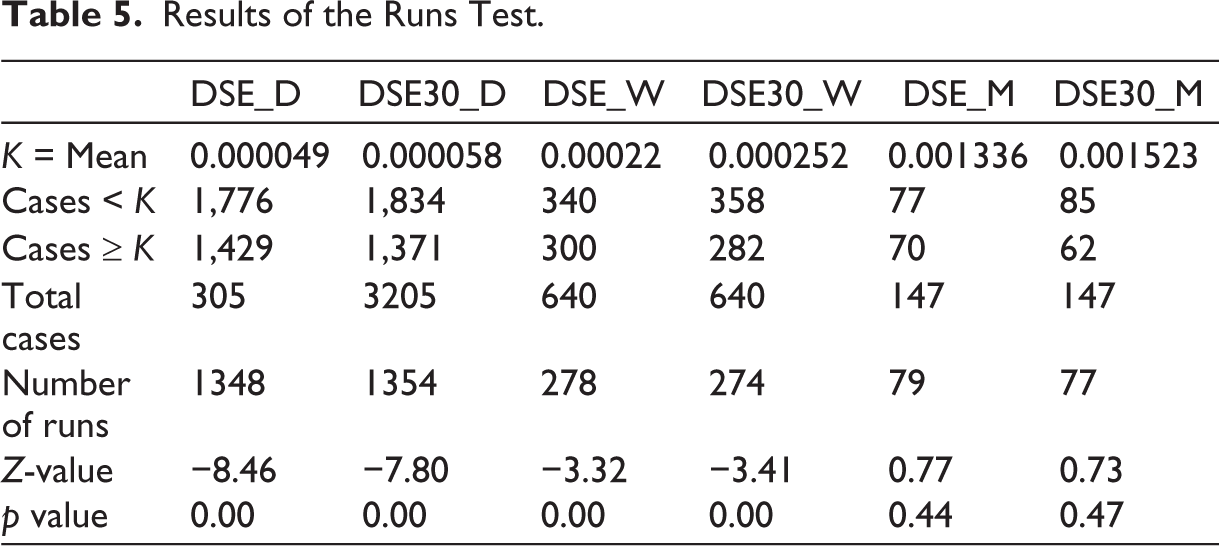
At the selected significance level, the series for DSE_M and DSE30_M are found to be independent; thus, the null hypothesis that successive return changes are independent cannot be rejected. This implies that these indices follow a random walk model, meaning investors cannot earn abnormal returns based on past information. In contrast, the p values for DSE_D, DSE30_D, DSE_W and DSE30_W are statistically significant, leading to the rejection of the null hypothesis for these markets. This suggests that return changes in these indices are dependent and do not follow a random pattern, indicating that investors may potentially earn abnormal returns using historical data.
BDS Test
This section analyses the randomness of investor expectations. In other words, in this section, the randomness of investor expectations and each piece of information entering the market is analysed using the BDS test. Table 6 presents the BDS test results for different dimensions for all returns.
Result of the BDS Test.
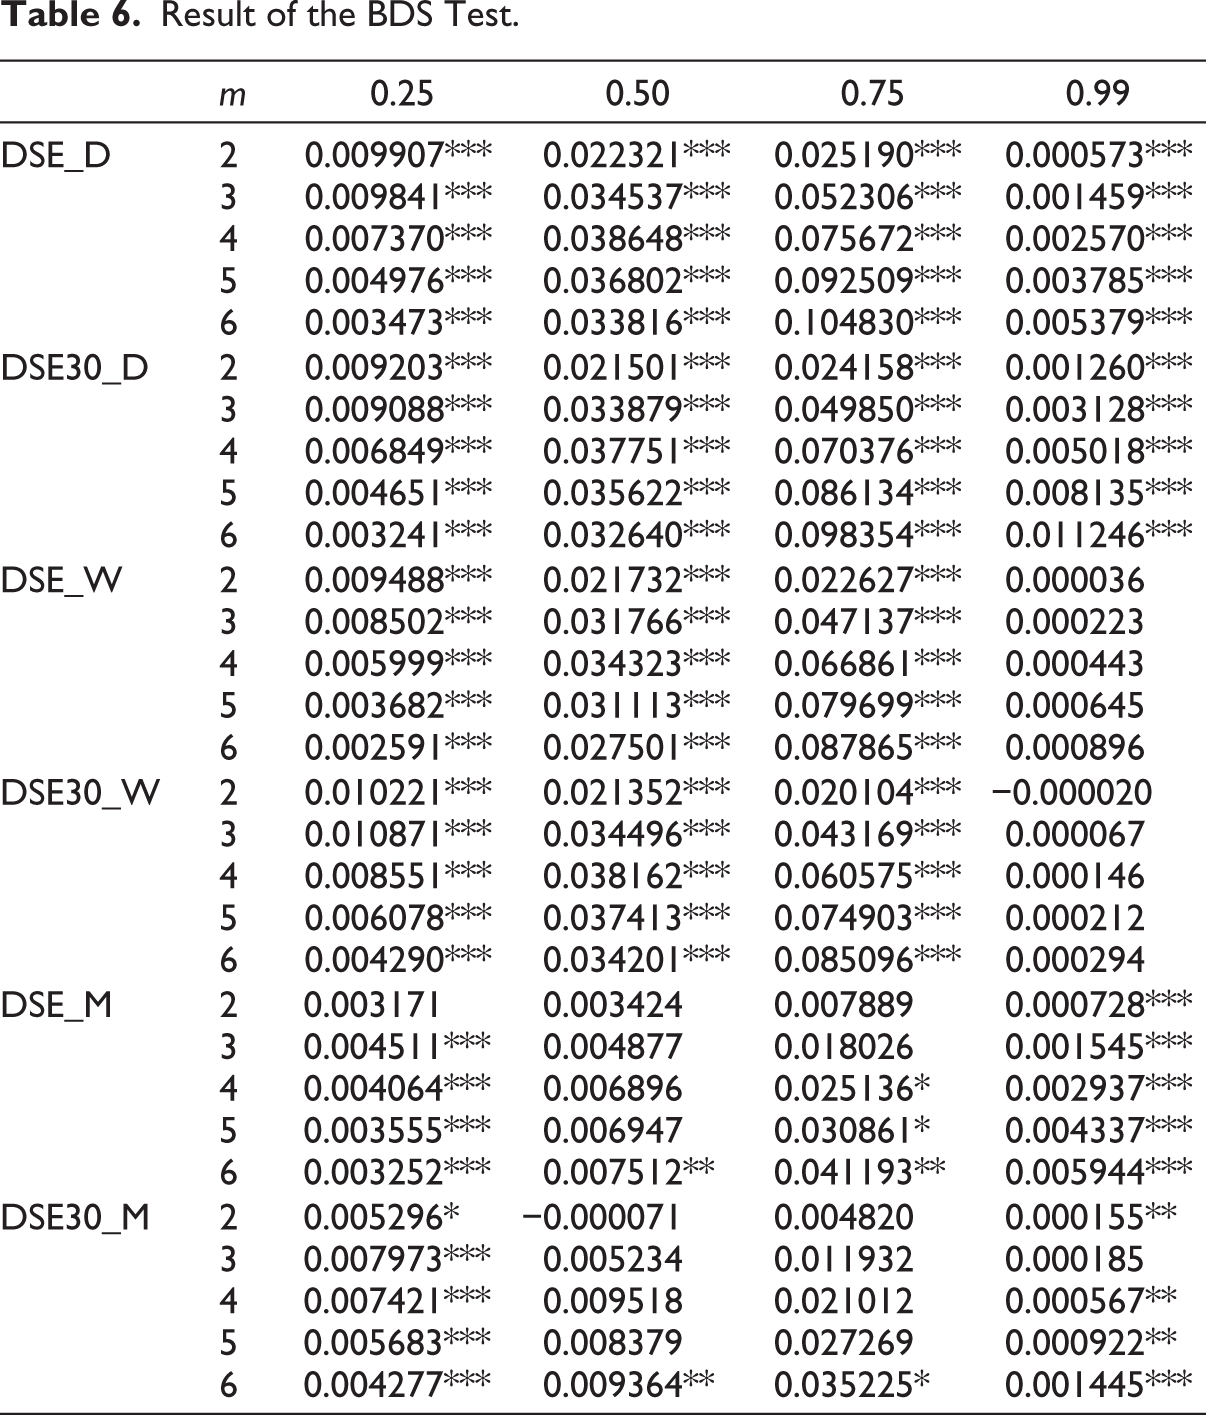
Table 6 shows the BDS test statistic values calculated in different dimensions for daily, weekly and monthly returns. The test results are generally statistically significant, and the null hypothesis that the error terms are independently distributed is rejected. This finding suggests that investor expectations and new information entering the market are not randomly distributed but dependently distributed. The result shows that the random walk process is not generally supported in the Dhaka stock market, especially in the daily and weekly contexts. In other words, according to the random walk model, the independence of return movements and investor expectations is rejected. Therefore, the non-randomness of both return movements and investor expectations and new information entering the market enable investors trading in the Bangladesh stock markets to earn above normal profits. In addition, with these findings, it can be said that the stock markets in Bangladesh are not efficient in the weak form.
Conclusion
This study empirically investigated whether the DSE and DSE30 indices demonstrate features consistent with the RWH, which is a key aspect of the weak-form EMH. The analysis employed a comprehensive methodological approach—including descriptive statistics, unit root tests (ADF and PP), autocorrelation and Q-statistics, runs test and BDS test—across daily, weekly and monthly return intervals from 2013 to 2025.
The empirical findings of this research provide robust evidence against the RWH, especially in daily and weekly return series. The descriptive statistics revealed significant deviations from normality, while unit root tests indicated that the return series are stationary. These findings suggest that historical price information may contain predictive content, contradicting the central premise of weak-form efficiency. Furthermore, the presence of statistically significant autocorrelations and the rejection of independence in the runs and BDS tests underscore the presence of both linear and nonlinear dependencies in return behaviour.
When compared to the existing literature, the findings are broadly consistent. Studies such as those by Rahman and Hossain (2021), Ahmed and Hossain (2019) and Haque and Dionisio (2021), focusing on the DSE, similarly reject weak-form efficiency, highlighting patterns of inefficiency and potential predictability. Moreover, the broader body of international research—including works by Al-Jafari (2015) for Kuwait, Malafeyev et al. (2017) for China and India, and Urrutia (1995) for Latin America—has also documented the rejection of RWH in various emerging markets. These studies converge on the view that, unlike mature markets, emerging economies often exhibit structural weaknesses, including limited liquidity, delayed information diffusion and behavioural anomalies, which may hinder the realization of market efficiency.
Interestingly, the results of this study demonstrate that while daily and weekly returns deviate significantly from randomness, monthly returns (particularly in the runs test) appear more consistent with a random walk process. This aligns with the findings of Grieb and Reyes (1999) for Brazil and with portions of Hoque et al. (2006), where higher aggregation intervals sometimes exhibit weaker signs of inefficiency, potentially due to noise reduction and lower frequency of speculative trading.
The BDS test results, in particular, highlight the existence of complex dependencies beyond linear autocorrelation, suggesting chaotic or nonlinear market dynamics. These results resonate with Haque and Dionisio (2021), who found evidence of chaotic behaviour in the Dhaka stock market using alternative nonlinear approaches.
In conclusion, the evidence overwhelmingly suggests that the Dhaka stock market does not conform to the assumptions of the RWH and is not weak-form efficient. Investors may, therefore, utilize historical price patterns and technical analysis strategies to gain abnormal returns, particularly in short-term horizons. From a policy perspective, these findings emphasize the need for enhanced regulatory oversight, improved transparency, better corporate governance and investor education to foster a more efficient capital market.
If the RWH holds for the Bangladesh stock market, it would indicate that the market is weakly efficient; historical price information provides no benefit for predicting future returns. This efficiency level means that prices promptly and accurately reflect new information, which would increase investor confidence and increase the market’s attractiveness to both domestic and international participants. However, even in situations of efficiency, policymakers need to maintain and strengthen this framework by promoting rapid information dissemination, strengthening corporate governance standards and increasing investor education to protect market integrity and participation. At the same time, it is essential to recognize the important buffering role of informal capital markets such as moneylenders, community-based lending and unregulated intermediaries in providing alternative financial channels and acting as a buffer during formal market disruptions. These informal systems often absorb shocks when volatility or inefficiency occurs in formal markets. As a result, the presence or absence of efficiency in formal stock markets can create spillover effects in informal markets. For example, increased volatility or inefficiency in formal exchanges can push investors, especially small-scale participants, towards informal alternatives. Conversely, improvements in efficiency and trust in formal markets can reduce demand for informal channels, creating the potential for their role in the broader financial ecosystem to be restructured. Therefore, any assessment of Bangladesh’s market structure and the design of regulatory interventions should consider the dynamic interplay between the formal and informal financial sectors, recognizing how changes in one can materially impact the other.
Future research should aim to validate these findings with high-frequency data, explore the semi-strong and strong forms of EMH and incorporate behavioural and institutional variables to better understand the inefficiencies observed in the Bangladesh stock market.
Footnotes
Acknowledgements
The authors would like to thank the anonymous reviewer for their valuable comments and suggestions, which helped improve the quality of this paper.
Declaration of Conflicting Interests
The authors declared no potential conflicts of interest with respect to the research, authorship and/or publication of this article.
Funding
The authors received no financial support for the research, authorship and/or publication of this article.