
Abstract
This study investigates herding behavior across various market conditions in the Nepalese stock market, illuminating the dynamic market atmosphere during uptrends and downtrends, as well as firm size. We analyze daily and monthly security prices, utilizing quantitative methods—cross-sectional standard deviation (CSSD) and cross-sectional absolute deviation (CSAD)—to assess herding behavior. Contrary to some established findings, evidence of herding is found during uptrends, while no such likelihood occurs in downtrends. Notably, both long-term and short-term herding tendencies are observed based on exclusively small-sized enterprises, revealing unique market psychology. The findings of this research are robust, even when separating the COVID-19 pandemic period observations. This research also demystifies the reasons behind herding behavior in specific market conditions in Nepal and offers practical insights for investors and regulators to mitigate the bias. Further studies could explore utilizing primary data to shed light on sustained herding mechanisms in small firms and consider sector-specific portfolios over extended periods for a deeper understanding of these market dynamics.
Keywords
Introduction
The efficient market hypothesis (EMH), introduced by Fama (1970), posits that assets are traded at their fair market value, incorporating all publicly available information, and eliminating arbitrage opportunities. This theory, however, does not account for behavioral biases such as herding, where investors tend to follow the crowd without necessarily evaluating fundamental factors. This tendency, disregarding the fundamental principles underlying asset prices, often leads to speculative bubbles and market crashes. Therefore, exploring the phenomenon of herding behavior is crucial as it significantly impacts market dynamics and stability, and challenges the conventional understanding of rational market behavior.
Though the multifaceted nature of herding behavior presents challenges in its definition and understanding, this bias in the domain of behavioral finance manifests in two distinct forms: Unintentional and intentional herding. Unintentional herding occurs when investors simultaneously buy or sell stocks in response to sudden market events or changes in fundamentals, reflecting a spontaneous collective reaction (Lakonishok et al., 1992). Conversely, intentional herding, as theorized by Bikhchandani et al. (1992), is driven by investors’ attempts to mimic others or by managers’ concerns about their reputations, leading to deliberate imitation of market actions. This study is focused on examining intentional herding as it unfolds how this bias impacts the individual portfolio as well as the market in overall.
The herding phenomenon has been the subject of extensive research across both developed and emerging markets worldwide. Prior studies have confirmed the existence of herding, particularly in emerging markets, where information asymmetry often plays a crucial role (Caporale et al., 2008; Chaffai & Medhioub, 2018). However, it is challenging to conclude that all emerging markets exhibit the presence of herding as every market attribute unique characteristic such as volatility, market stability, fragility, and investors’ literacy.
Despite the increasing significance of behavioral finance in elucidating market anomalies, empirical evidence about the presence and extent of herding behavior in the Nepalese stock market remains limited. The Nepalese stock market, with unique characteristics—such as low liquidity, dominance of retail investors, regulatory constraints, and sensitivity to external shock, to name a few—remains relatively unexplored to determine whether there is a presence of herd behavior among investors. Additionally, there has been a notable absence of herding behavior literature during various market conditions of Nepal, ascribing a gap in understanding of the behavioral bias aspect in the emerging Nepalese stock market. This study primarily seeks to bridge this gap and enhance the understanding of the herding behavior. Subsequently, this research is important due to a few other market-specific reasons as well. First, Nepal Stock Exchange (NEPSE), being the country’s only securities exchange, an emerging market of South Asia, characterized with high market concentration and developing in nature, creates a conducive environment to the emergence of short-term retail investors. The increasing presence of these investors, who are often prone to herd mentality, can profoundly affect market dynamics, shaping both short-term volatility and long-term trends (Christie & Huang, 1995). Second, the NEPSE has witnessed diverse ups and downs in recent years. Notably, in August 2021, the market index reached an all-time high at 3198.6, showcasing remarkable growth. However, this uptrend remained brief, and the market experienced subsequent fluctuations. These inconsistent patterns also motivate us to conduct this research to ascertain whether herding mentalities among investors had a significant role in driving these fluctuations.
Considering these critical factors, this research embarks on a comprehensive exploration of the intricate dynamics of herding behavior within the Nepalese stock market. The findings from this research shed light on various dimensions: its prevalence and impact. As a result, this study not only contributes to the academic discourse on investors’ behavior in the emerging markets but also provides valuable practical implications. These insights are poised to benefit investors, guiding them through the complexities of the Nepalese stock market. Furthermore, the study’s contribution extends to the broader financial community, enriching our understanding of investor behavior and market dynamics in emerging economies. The rest of the sections are organized into a literature review, research methodology, results and discussion, and the conclusion of the study.
Literature Review
In the social structure of the modern world, decision makers often tend to look at the decisions made by others in the same line of interest, which is rational for their viewpoint because these prior decisions are made based on some information important to them (Banerjee, 1992). This can also be termed as mimicking the actions of others or following the crowd. Further illustrating the idea of “herd externality”, Banerjee (1992) offers an example of customer behavior while deciding between two restaurants: they ignore the private signals and follow earlier customers’ choice at large. Likewise, confirming the existence of such tendencies in the securities market, Hirshleifer et al. (1994) clarify how late traders tend to follow the early ones as they leave some information about the pricing of the securities. This concept is, then, solidified with two polar views: rational and irrational herding (Devenow & Welch, 1996). The rational view posits that institutional investors might disrupt an investor’s optimal decision-making process despite access to information due to information cascade or to mitigate reputational risk and information costs (Banerjee, 1992; Stein & Scharfstein, 1990; Zwiebel, 1995). In other words, they elucidate the managers’ performance within the company, which is associated with the firm’s overall performance. If the manager delivers poor analysis, the firm’s performance results are not desirable, which may even lead to the firing of managers. Hence, to uphold their reputation, managers imitate the actions of others, placing full reliance on external cues and neglecting their own beliefs and analyses.
By contrast, the irrational perspective proposes that investors disregard their own information and analysis and follow the decision or action of others blindly. This concept is bifurcated between specific stocks and the overall market. In the herding toward a particular stock, investors tend to concentrate on that stock and ignore others that have the same fundamentals. For instance, Banerjee (1992) and Bikhchandani et al. (1992) employed a model where informational flow appears when investors make optimal decisions by mimicking the behavior of prior investors without knowing their personal information. Whereas herding the market highlights its implications, unlike the specific stock allocation, investors tend to shift their portfolios mimicking the entire market trends (Chang et al., 2000; Christie & Huang, 1995). Market-level herding behavior is measured on the equity return of the market employing the empirical approach for the first time (Christie & Huang, 1995). It introduced an empirical model that categorized the level of dispersion, contrary to the rational asset pricing theory, reduced level of dispersion indicates the presence of herding in extreme market movements, to test whether it differs significantly from the average level of dispersion excluding outermost market returns. Subsequently, Chang et al. (2000) argued with a more effective and sensitive model to examine herding behavior in the market. They utilized non-linear equations that measure the dispersion of individual return and market return in the form of absolute value, assuming that if the investor follows the movement of the market and ignores their own priors, the linear relationship between return and dispersion will no longer hold.
Christie and Huang (1995) tested the first empirical model in the US capital market’s daily stock returns data and obtained no evidence of herding. Similarly, Chang et al. (2000) investigated the herding behavior in different markets across the world, such as the USA, Hong Kong, Japan, South Korea, and Taiwan, and reported the presence of herding in developing markets only. Developed markets did not show the tendency of herding due to symmetrical information as well as the presence of educated investors (Chang et al., 2000). Conversely, in the developing market, the lack of information to the investors leads to the experience of herding.
Studies on herding behavior are conducted around the world in numerous stock markets and have outlined mixed results. Henker et al. (2006) and Cajueiro and Tabak (2009) stated the absence of herding behavior in the Australian equity market with the intraday data and the Japanese stock market, respectively. Chiang et al. (2010) examined herding behavior using the least square method in the Chinese A and B-share markets and found no evidence on the B-share markets, while herding was evident on the A-share market. Similarly, Javaira and Hassan (2015) studied the herd behavior in the Pakistani stock market and found non-existence of herding as well as the lack of support for the rational asset pricing model. However, this study also admitted that, during the liquidity crisis of March 2005, the Pakistani stock market experienced herding due to the information asymmetry among investors. Conversely, Chiang and Zheng (2010) examine the herd behavior in the global market and found herding evidence in the advanced stock market, including the Asian market. Authors also found persistence herding in the up and down-market trend. Similarly, Economou et al. (2011) examined the herding in Greek, Italian, Portuguese, and Spanish capital markets and came up with evidence of herding mainly in the Greek and Italian markets. They deduce that the herding had become more intense during the 2007–2008 financial crisis. Authors also tested whether the cross-sectional dispersion in one market affects the other market in the same region and provided evidence of a great degree of co-movement of cross-sectional returns dispersion across these markets. Likewise, Lao and Singh (2011) investigated the herding behavior in both the Chinese and Indian stock markets and provided evidence of herding in both markets, particularly when the market is falling and trading volume is high, as well as during upswings in market conditions. Their result corresponded with the previous literature that the developing markets, India and China, also exhibit the presence of herding. Similarly, in the study on herding behavior across nine Asian developing markets at the industry level, Zheng et al. (2017) asserted that herding exists among companies operating within industries, market capitalization, trading volume, and market trends, which further strengthened the idea of herding presence in developing markets. Likewise, Batmunkh et al. (2020) and Chaffai and Medhioub (2018) also investigated the herding behavior in Mongolian and Islamic Gulf Cooperation Council (GCC) stock markets in various market conditions—bull and bear markets and high and low volatility states of the market—and confirmed the presence of herding in all situations. More recently, Filip and Pochea (2023) studied the relationship between investors’ sentiments and herding behavior in the US and European stock markets and documented that herding is persistent in both developed markets. Subsequently, Bogdan et al. (2022) reviewed the developed, emerging, and frontier markets among European nations and proposed the presence of herding in emerging markets only. However, Ah Mand et al. (2023) reported the absence of herding in the conventional stock market in the Malaysian emerging market. To inquire broadly of this behavioral bias in various states of emerging markets, Adnan (2023) studied herding behavior in both bullish and bearish market trends in the Indonesian capital market and discovered the existence of herding during the bearish trend only. This study was further confirmed by the existence of herding during market stress. Ahn et al. (2024) explored the relationship between herding behavior and business cycle using US stock market data and concluded that there is stronger herding behavior during a recession than a market boom. The apparent reasons behind herding overall market stress were attributed to the low level of self-confidence, fear, and uncertainty. Conversely, the study conducted in emerging markets—Brazil, Chile, Colombia, and Mexico—detected the absence of herding in Brazil and Mexico, while Chile and Colombia were found to be consistent with rational asset pricing models (Lobão & Almeida, 2024). The absence of herding in those markets was attributed to the COVID-19 pandemic and extreme crude oil price movement.
Recent studies on the Asian market signify the prevalence and implications of herding behavior, particularly during market stress. Yasmin and Ferdaous (2023) investigated behavioral bias in the Bangladeshi stock market, revealing that investors often act irrationally, with herding instinct significantly influencing their decisions. Similarly, Loang and Ahmad (2024) found evidence of herding in the Malaysian stock market, especially during the bearish market trend, highlighting that stressful market conditions boost this behavior. The dynamics of herding appear to vary across various political and economic conditions as well. Charith and Azeez (2024) analyzed Sri Lankan stock market over pre-war, bubble, crash and post-war period and reported evolving patterns; exhibiting herding in pre-war conditions, followed by bubble and subsequent disappear in post-war period. In contrast, Ahmad and Wu (2022) documented excessive herding in the Pakistani stock market, which negatively impacted investors’ performance. A comparative study by Sheikh et al. (2025) further revealed a divergent pattern in the developing markets: the Chinese stock market exhibited conventional herding whereas, the Pakistani market displayed reverse herding during both periods of pessimism. The broader implication of herding behavior extends to market efficiency and financial stability. Loang (2025) studied the relationship between herding, market overreactions, and financial stability and concluded that herding exacerbated short-term market overreactions in developing markets of Brazil, Russia, India, and China (BRICS), whereas it had a negligible impact in developed markets. Additionally, studies by Aslam et al. (2022), Bharti and Kumar (2022), and Vidya et al. (2023) supported that herding was particularly strong during crises such as the COVID-19 pandemic among various prominent markets in Asia.
While herding behavior has been considerably studied across the global market, a limited yet growing body of literature examines this aspect in the context of the Nepalese stock market. Scholarly work addressing the Nepalese market context, Gurung et al. (2024), Karmacharya et al. (2022), and Lama et al. (2025) mainly focused on questionnaire-based survey methods to address behavioral tendencies. The scope of their study was primarily on other behavioral biases such as overconfidence, heuristics, anchoring, and prospects, with methodological limitations such as heavy dependence on self-reported data and absence of market-level empirical analysis. Although these studies present some preliminary insights into the local behavioral bias tendencies, there is no significant study that has been conducted to examine herding behavior using market-driven empirical analysis. The Nepalese stock market is characterized as one of the emerging markets from South Asia and possesses some characteristics such as high volatility, low liquidity, lack of advanced financial regulations, frequent government interventions and few institutional investors. Besides, previous studies claim that herding is more robust in emerging markets primarily due to information asymmetry, speculative investors, and few institutional investors. With the mixed findings across the world’s emerging markets, it is challenging to conclude that the Nepalese stock market also exhibits the same. With the considerable absence of empirical evidence of herding in the Nepalese stock market, this study seeks to contribute insights into the state of behavioral bias inherent to this market and its participants.
Data and Methodology
The population of this study consists of all the listed companies in NEPSE. The sample comprises daily and monthly stock price observations, incorporating 215 and 338 listed companies, respectively, spanning the period from January 2015 to December 2021. The variation in the number of selected firms resulted from the unavailability of complete data. Both daily and monthly stock prices, coupled with market capitalization data, are sourced from the NEPSE website (
This research largely adopts the methodology proposed by Christie and Huang (1995), Chang et al. (2000), Gleason et al. (2004), and Javaira and Hassan (2015). Notably, Christie and Huang (1995) and Chang et al. (2000) have proposed two methods: cross-sectional standard deviation (CSSD) and cross-sectional absolute deviation (CSAD) to examine the herding behavior by dispersion of the return of individual stock with respect to market in extreme and less extreme market movements, to enrich the understanding of relationships that might be overlooked by a singular method as advised by literature.
Following the previous studies, this article employed log returns because it encompasses the compounding effect of returns, and is shown in Equation (1) as:
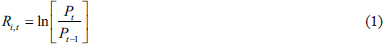
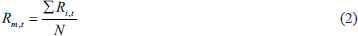
where, Ri,t is the log return of stock i at time t and Pt and Pt−1 are the closing prices of stock on time t and t−1. The market return Rm,t is computed averaging the cross-sectional of returns of stocks at time t, as shown in Equation (2).
To assess how closely individual stock returns align with the market return, the CSSD is computed using Equation (3):
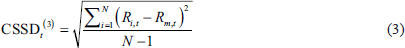
where, N is the number of stocks in the portfolio, Ri,t is the realized return of stock i at time t and Rm,t is the cross-sectional average of stock return at time t. The study results are derived from six distinct segments, each employing a different model that consists of Models 1–6.
Model 1: CSSD Linear Regression Framework for Extreme Market Movements
Model 1 follows the methodology proposed by Christie and Huang (1995). They argued that, unlike the asset pricing model, herding behavior implies a reduction in the dispersion of realized stock returns compared to market returns. This is because during market growth or stress, individual investors often imitate others and follow prevailing trends, leading to a herd mentality. This understanding forms the basis for this empirical design to investigate herding, which is structured in Equation (4) as:

where, DtU represents the dummy variable which is 1 if the aggregate market return of the portfolio for time t lies in the extreme upper tail of the overall return distribution, otherwise 0. Similarly, DtL represents 1 if the market return of the portfolio for time t lies in the extreme lower tail of the distribution, otherwise 0. The extreme upper and lower tails are identified with the aggregate market return threshold determined by identifying 95 and 90 percentiles of the overall market returns. Then the aggregate market return of the portfolio is separated with a calculated percentile threshold: if the return is more than or equal to the threshold, it is identified as the upper tail and vice versa. The extreme upper and lower tails of the overall market return distribution or the price volatility are determined with 5% and 10% criteria using 95th and 90th percentile thresholds, respectively. It is suggested that negative and statistically significant coefficients (β1 and β2) confirm the presence of herding in the market, and conversely, positive coefficients indicate otherwise.
Model 2: CSAD Non-linear Regression Framework
Model 2 is employed as an alternative model to analyze herding behavior from a different perspective to discern the best possible understanding that might be overshadowed by a single method (Chang et al., 2000). This model is devised as CSAD with the argument of being a more robust approach to determining herding. CSAD is the average of the aggregate difference between individual securities’ predicted returns and market returns, as shown in Equation (5). It claims that, as the rational asset pricing model suggests, the association between market return and CSAD is positive; however, this connection should be negative and non-linear if there is herding, since the absolute market return value grows while the CSAD declines or increases at a decreasing pace. The CSAD is examined and regressed against absolute market returns and the market return square, expressed in Equation (6):


The presence of statistically significant negative non-linear coefficient of λ2 in Equation (6) confirms the presence of herding.
Model 3: CSSD and CSAD Framework for Swapping Regression Approach
Gleason et al. (2004), in Model 3, suggested another approach to the non-linear relationship by swapping the dependent variables CSSD and CSAD to examine the investors’ tendency to follow the crowd. The rationale of testing the herding through two additional models is to obtain a more comprehensive analysis, as both dependent variables are primarily measures of dispersion (Gleason et al., 2004). It explores two additional models by interchanging the dependent variables used in earlier models, as expressed in Equations (7) and (8), respectively.


Negative and statistically significant coefficients β1 and β2 in CSAD Equation (7) and a negative statistically significant non-linear coefficient λ2 in CSSD Equation (8) confirm the presence of herding.
Model 4: CSAD Framework in Up and Down-market Trend
This study also examines the presence of herding behavior in both uptrends and downtrends of the market. Model 4 follows the herding regression approach, used by Javaira and Hassan (2015), to examine herding in the stock markets during upward and downward trends as indicated in Equations (9) and (10).


where the CSAD t Up is regressed if the Rm is more than 0 (Rm> 0) and similarly, CSAD t Down is regressed if the Rm is less than 0 (Rm < 0). In both models, the presence of statistically significant negative non-linear coefficients of y2 confirms the existence of herding.
Model 5: CSAD Framework for Firm Size
This model is introduced as a more granular breakdown of this research by separating the overall sample firms into two categories: large and small. This model investigates the presence of herding behavior across different company sizes listed on NEPSE, using Equations (11) and (12).


where CSAD t Big and CSAD t Small are regressed separately by large market capitalization firms and small market capitalization firms, respectively. The observation of large and small market capitalization is conducted by the calculation of the median market capitalization of the sample data on each trading day. The upper part of the median is considered large market-capitalized firms, and the lower half of the median is small market-capitalized firms. Consequently, in both models, a statistically significant y2 non-linear coefficient substantiates the herding behavior.
Model 6: Assessing Impact of COVID-19 within CSSD and CSAD Framework
Insaidoo et al. (2021) documented that the COVID-19 pandemic triggered stock market growth in developing markets. During the period of the COVID-19 pandemic, February 2020 to December 2021, especially after the lift of the nationwide lockdown, the Nepalese stock market also witnessed notable uptrends, reaching all-time high levels that had not been observed in any previous period. To ensure the reliability of this study, sample data are tested using all proposed models, excluding observations from the non-pandemic periods and including only those from the active COVID-19 pandemic period. This approach is essential to ensure that the major findings are not distorted by the sudden market growth during the pandemic.
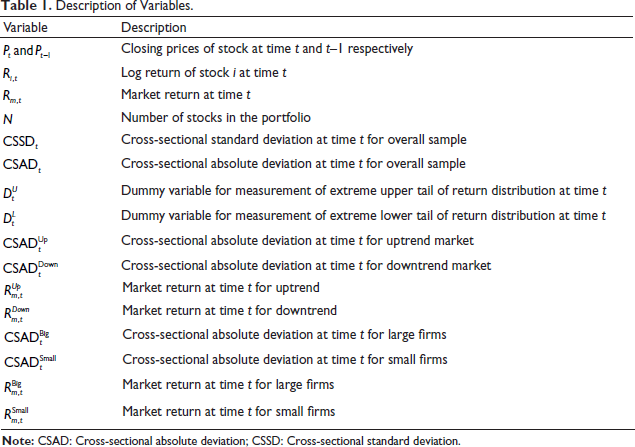
Table 1 illustrate the descriptions of the variables used in this paper.
Description of Variables.
Results
Descriptive Statistics
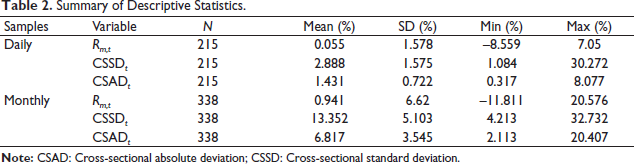
Table 2 provides an overview of the statistical summary average weighted portfolio return, variability, minimum, maximum, CSSD, and CSAD for daily and monthly data comprising January 2015 to December 2021. The number of stocks, which is denoted by N, for the daily and monthly samples included in this study is 215 and 338, respectively. It reports that the monthly average weighted portfolio return is greater than that of daily, which is obvious because the return dispersion becomes higher when there is an increment in time interval. Similarly, standard deviation (SD) is also higher in the monthly sample than in the daily sample because of the nature of return dispersion. It supports the results obtained by Granger and Ding (1995) as the average and variation in the daily CSSD and CSAD are lower than monthly.
Summary of Descriptive Statistics.
Regression Results for Extreme Market Movements
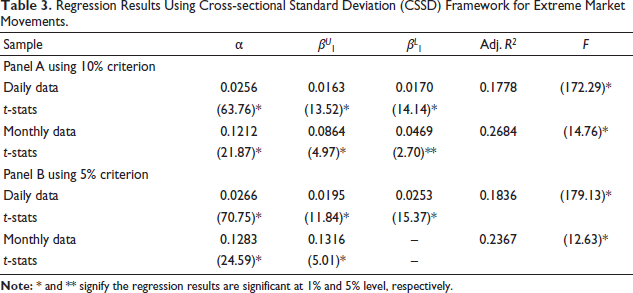
Table 3 presents the regression outcome during the severe market fluctuation in NEPSE, utilizing the CSSD framework in Model 1. The outcomes are provided for daily and monthly prices in Panels A and B. Panel A reports the regression coefficients for price volatility ranging up to 10%, while Panel B presents the regression results for price volatility limited to 5%. The findings show that coefficients β1 and β2 in both panels are positive and statistically significant, implying that there is no presence of herding during these extreme market movements in the sample period. The adjusted R2 value suggests a moderate level of explanatory power of the aggregate market return on the CSSD in the dataset presented in Panel A. While in Panel B, the adjusted R2 value demonstrated a relatively higher explanatory power compared to the results obtained in Panel A. The F-statistics exhibit high significance at the 1% level in both cases, indicating the overall significance of the regression model.
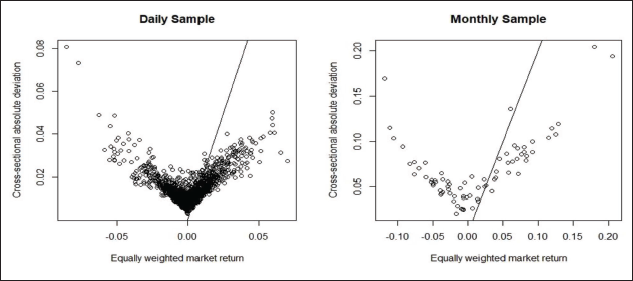
Figure 1 represents the relationship between daily and monthly cross-sectional standard deviation (CSSD) and market return for the sample period. Similarly, Figure 2 represents the relationship between daily and monthly cross-sectional absolute deviation (CSAD) and market return for the sample period.
Regression Results Using Cross-sectional Standard Deviation (CSSD) Framework for Extreme Market Movements.
Relationship Between Daily and Monthly Cross-sectional Standard Deviation (CSSD t ) and Corresponding Equally Weighted Market Return (Rm, t ) for Nepal Stock Exchange (NEPSE) (January 2015–December 2021).

Relationship Between Daily and Monthly Cross-sectional Absolute Deviation (CSAD t ) and Corresponding Equally Weighted Market Return (Rm, t ) for Nepal Stock Exchange (NEPSE) (January 2015–December 2021).
Non-linear Regression Results Using CSAD Framework
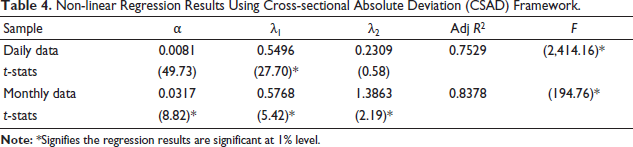
Table 4 presents the outcomes of a non-linear quadratic regression employed to assess the likelihood of non-linearity in returns based on changes in return dispersion under Model 2. In both the daily and monthly datasets, the higher adjusted R2 values signify the model’s effectiveness in capturing the variation within the dependent variable, demonstrating a strong fit to the data. Simultaneously, the notable significance of the F-statistics emphasized the model’s overall validity, reinforcing its robust explanatory power concerning the relationship between the independent and dependent variables of interest. Both coefficients, λ1 and λ2, portray a positive association between daily absolute average market return and cross-sectional absolute standard deviation across both daily and monthly datasets. However, only λ2, although positive, demonstrated an insignificant association. The output clearly indicates that the investors respond in a similar manner to market movements, aligning their decisions with the market’s direction. Thus, the patterns do not confirm the presence of herding behavior as previously hypothesized.
Non-linear Regression Results Using Cross-sectional Absolute Deviation (CSAD) Framework.
Non-linear Regression Results Using CSSD and CSAD Swapping Framework
Table 5 displays the outcomes of non-linear regression, where the dependent variable shifts from CSAD to CSSD. In the daily dataset, the adjusted R2 value reveals that the model explains approximately 38.72% of the variability in the dependent variable, while in the monthly dataset, this figure increases to 50.76%. Additionally, the F-statistics are significant in both datasets, implying the overall significance of the regression models. All coefficients exhibit positive values, and the coefficients of λ2 are statistically significant and positive at 1% level in both the daily and the monthly datasets. The positive coefficients observed in both daily and monthly data analysis convey that a rise in the market returns corresponds to a simultaneous increase in CSSD of market returns. This finding diverges from the anticipated negative values that would typically indicate the presence of herding behavior.
Non-linear Regression Results After Shifting Cross-sectional Absolute Deviation (CSAD) to Cross-sectional Standard Deviation (CSSD).
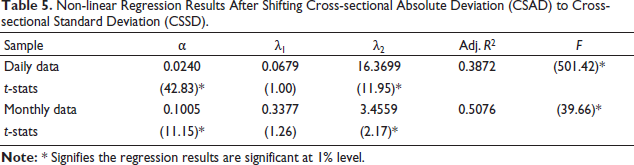
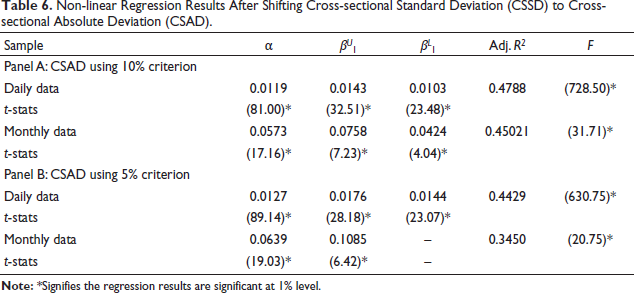
Table 6 communicates the outcomes of interchanging the CSSD dependent variable to CSAD, exploring herding behavior amidst extreme market fluctuations in daily and monthly datasets according to Model 3. Under the market return movements up to the 10% threshold, the daily dataset accounts for approximately 47.88% of the variance in the dependent variable, while the monthly dataset captures 45.02%. In the context of using 5% criterion of market return movement, the daily dataset explains approximately 44.29% of the variance in the dependent variable, while the monthly dataset reveals 34.50%. The F-statistic values exhibit consistent significance at the 1% level across all the models, highlighting the strong statistical significance of the results. The positive and highly significant regression coefficients confirm that during the severe market movements, the return dispersion (CSAD) tends to increase instead of decrease, thus providing evidence of rational asset pricing and disregarding the presence of herding. Additionally, scatter plot chart in Figure A1 present relationship between CSSD and CSAD in extreme low (5%) and extreme high (10%) criterion with daily and monthly samples. Similarly, Figure A2 shows non-linear relationship between CSSD and CSAD for daily and monthly samples.
Non-linear Regression Results After Shifting Cross-sectional Standard Deviation (CSSD) to Cross-sectional Absolute Deviation (CSAD).
Non-linear Regression Results Using CSAD Framework for Market Trends
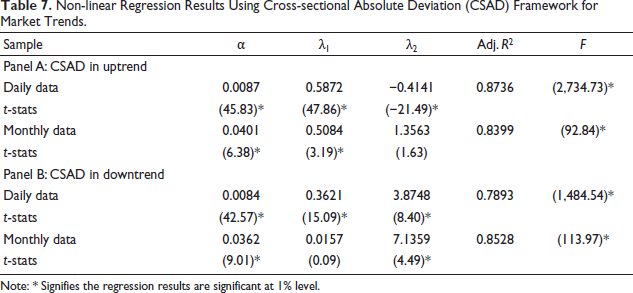
Table 7 presents the outcomes of regression analysis with CSAD as the dependent variable, examining both uptrend and downtrend markets, in accordance with the methodology proposed in Model 4 for daily and monthly datasets. The higher adjusted R2 values highlight the robust explanatory power of the models during the market experiencing up and downtrends. The F-statistic reports on the significance of the overall model. The analysis shows that the λ2 coefficient in the downward market trend is significantly positive, meaning that there is an absence of herding behavior during market declines. However, the finding reveals the statistically significant negative coefficient of λ2 in the up-market trend for daily stock prices, implying the presence of herding behavior in the market, particularly for a short period of time during an upward trend. Furthermore, scatter plot chart in Figure A3 depicts CSAD during uptrend and downtrend incorporating daily and monthly sample.
Non-linear Regression Results Using Cross-sectional Absolute Deviation (CSAD) Framework for Market Trends.
Non-linear Regression Results Using CSAD Framework for Firm Sizes
Table 8 presents the results obtained through non-linear regression using the CSAD framework (Model 5) for both large and small market capitalization firms in order to assess the herding behavior in the market based on company size. The remarkably high R2 values, ranging from 0.6163 to 0.9180, signify the models’ strong explanatory power. The significant F-statistics further validate the models’ overall significance. In addition, the adj. R2 values are progressively higher in the small market capitalization-based CSAD regression model which portrays that the data are best fitted in Panel B: CSAD in small market cap model.
Non-linear regression Results Using Cross-sectional Absolute Deviation (CSAD) Framework for Firm Sizes.
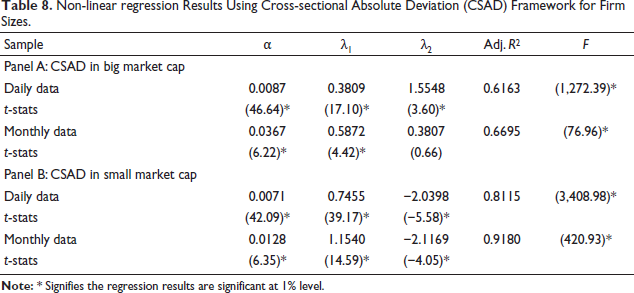
The coefficient λ2, representing the relationship between market returns and CSAD, is positive and statistically significant across all cases in big market capitalization companies, indicating a direct association: an increase in the market returns corresponds to a rise in the difference between the individual securities’ realized returns and market returns (CSAD) and vice versa. This alignment with the rational capital asset pricing model suggests that under normal circumstances, without herding. The negative and significant λ2 coefficients in both daily and monthly data for small-sized companies, however, confirm the presence of herding behavior in this market segment, while no such behavior is detected in the large market-capitalized companies. Figure A4 represents the relationship between CSAD and large and small size firms utilizing both daily and monthly samples.
Analyzing Robustness through Sub-sample Period: Adjustment of COVID-19 Period
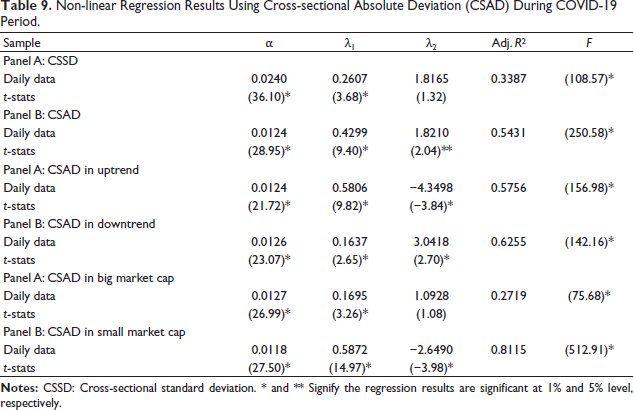
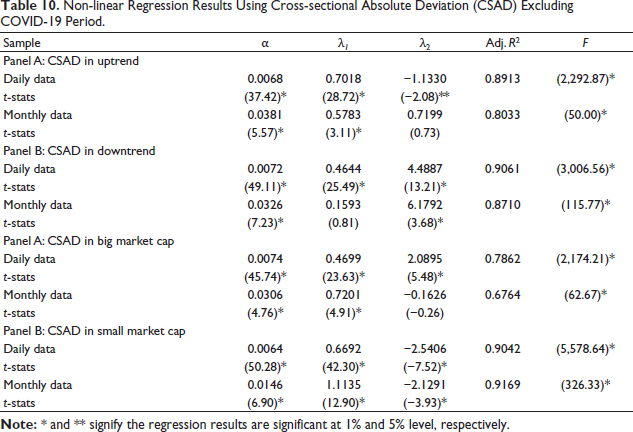
Table 9 presents the non-linear regression results using CSSD and CSAD during the COVID-19 pandemic periods. The results confirm with main findings that during the uptrend movement, the market experienced herding during the COVID-19 pandemic period alone and supports herding in small-capitalized firms in NEPSE. However, due to an insufficient number of observations during the COVID-19 period, the study is unable to present results based on monthly data. Similarly, Table 10 presents the results of the regression excluding the COVID-19 period. Similar to the main findings, it reveals that the herding behavior persisted, particularly during market uptrends and among small-capitalization companies, in both daily and monthly stock movements. Thus, the findings of this research are similar after adjusting for the different time frames in the sample period. Furthermore, Tables A1, A2, A3 and A4 represent the regression results using CSSD framework for extreme movements, non-linear regression outcome using CSAD approach, non-linear regression result after swapping between CSAD to CSSD and CSSD to CSAD respectively, excluding COVID-19 pandemic period from the sample.
Non-linear Regression Results Using Cross-sectional Absolute Deviation (CSAD) During COVID-19 Period.
Non-linear Regression Results Using Cross-sectional Absolute Deviation (CSAD) Excluding COVID-19 Period.
Discussions
The observed negative and statistically significant coefficient of λ2 during an uptrend market emphasizes the tendency of investors to align with market consensus, thereby providing evidence of herding behavior in the Nepalese stock market during uptrend market stages. In other words, the negative coefficient of λ2 implies the change in return of each stock from the return of the overall market during the period of stress in the Nepali stock market. These findings align with the conclusions drawn by Javaira and Hassan (2015) and Ah Mand et al. (2021), further supporting the prevalence of herding dynamics in similar market conditions. However, this finding contradicts the conclusion drawn by other scholars, including (Zheng et al., 2017), who argued that herding is more pronounced in down markets and markets with low trading volume across various contexts. Similarly, Ju (2020) identified herding behavior in down markets, while Yousaf et al. (2018) asserted that herding does not exist in either up or down markets. The presence of herding behavior in upward market trends in Nepal could be attributed to several factors. The primary driver is that the Nepalese stock market is largely controlled by retail investors who lack sophisticated stock analysis, which might have led to imitating the crowd. Secondarily, this market exhibits thin trading and low liquidity, where a small number of large trades unreasonably influence the prices, which could lead to herding. Subsequently, Nepal’s overall economy is unstable due to various economic and political uncertainties, and particularly in the COVID-19 pandemic period, there has been news of collective layoffs from various companies. Such a stressful economic situation impacts stock market return negatively for a short period (Kumar et al., 2023). This environment seems to have encouraged speculative herding among short-term investors, potentially inflating the intrinsic value of stock beyond fundamentals during recovery periods, and investors tend to be inclined toward collective behavior. Another potential reason could be the social influence in which a significant portion of investors rely on informal discussions over various social media platforms and decisions are often made with tips from friends, self-proclaimed pundits, and brokers rather than actual research. Additionally, investors from Nepal more often rely on trend chasing technical analysis, which fundamentally increases herding. Besides the other potential reasons for uptrend herding, such as fear of missing out (FOMO), optimism bias, and confirmation bias, Nepalese investors’ low level of financial literacy could have also played a crucial role in the herding in the uptrend market, as investment decisions are based on gossip and imitations, which lead to a herding mentality. Moreover, the lack of stringent market regulations allows market manipulators to influence the prices and create a bubble herding. These disparities highlight the complexity and variability of investor behavior across different market conditions, emphasizing multifaceted herding phenomena in the financial market of Nepal.
Furthermore, Nepalese investors exhibit a herding mentality in small firms, possibly due to the potential benefits associated with investing in these stocks. The presence of herding in small market-capitalized companies in Nepal also aligns with previous research, as demonstrated in the studies conducted by Benkraiem et al. (2021) and Zheng et al. (2017). There are several plausible reasons behind these tendencies in the Nepalese stock market. First, small capitalized firms in Nepal often have low liquidity, which bolsters the small traders to move prices and encourages them to chase the trend. Second, investors are prone to follow the crowd rather than conduct self-analysis, especially during these small enterprises’ less stable prices volatility. These companies are also vulnerable to syndicating trading strategies by small groups. Another strong reason could be the poor dissemination of stock-related information. Unlike the large-cap companies, small ones barely attract the media and analysts’ attention. Due to the lack of vision on long-term investment strategies, many cooperative limited of Nepal often pool money into the small-cap companies based on collective sentiments. Another possible reason behind herd mentality in small firms could be the results of small-capitalized companies offering significant upward growth potential, a characteristic less common among larger companies, and the institutional investors’ frequent choice to invest in small firms in the Nepali market. Additionally, active management in small-capitalized firms provides opportunities for passive investors to enhance their returns. The preference for small-sized companies might stem from the advantages arising from frequent mergers and acquisitions within the Nepali market segment as well.
Conclusion
The prime objective of this research is to examine the evidence of herding in the Nepalese stock market, where no previous empirical studies have been conducted. Using daily and monthly security price data, it investigates the herding through multiple empirical tests, especially in upward and downward market trends and firms’ size-based herding.
By contradicting the popular findings of Christie and Huang (1995), Chang et al. (2000), and Gleason et al. (2004), the result manifested the evidence of herding in the upward market trend of Nepal for the short period only. This could be the result of Nepalese investors’ optimism during upward market trends, driven by rising stock prices. Limited information, lack of sufficient stock news resources, social influences, and risk aversion might have led investors to follow the market crowd, intensifying the herding effect in the Nepalese stock market. In addition, the research reveals that investors’ herding tendencies toward the small-sized firms for a long and short period of time. The plausible explanation for herding mentality in small companies could be the rewards of investing in small-cap firms, which have higher potential for growth, and the benefits that arise from frequent mergers and acquisitions can help passive investors increase their returns in Nepal. The consistent results obtained from analyzing data both during the COVID-19 period and excluding it strongly confirm the presence of herding behavior during uptrend market movements and for small-sized companies in the Nepalese stock market. The robustness of results across different datasets emphasizes the prevalence of such behavior irrespective of the market conditions imposed by the pandemic. For the overall study period, the findings, however, suggest the absence of herding in the Nepalese security market. It implies that the overall market experiences the existence of rational asset pricing in NEPSE. Overall, this research contributes to the various spectra of knowledge of herding behavior in the Nepalese securities market, which is developing in nature.
This research advises the investors of Nepal, as practical implications of the findings of this study, to construct their optimal portfolios with a proportionate weight of small and large capitalized firms. Also, the investment decisions should be solely based on prior knowledge and analysis, especially during the extreme fluctuation of the market. Additionally, in a developing market like Nepal, investors should carefully evaluate the information over digital media and rumors, as misinformation can drive the crowd’s decision during the uptrend market. Rather, it is always advised to rely on the fundamentals of the companies with some technical knowledge of trading in the market before any investment decision is made. Moreover, Nepali investors can also consult with licensed investment advisors about investment planning, which could significantly reduce the risk of loss. This study also provides implications to the policymakers and regulators to curate and publish financial information transparently as well as correctly for the small-cap companies of Nepal, to the extent that the maximum number of investors can absorb the information. One of the major reasons for herding in small-sized companies in Nepal could be the lack of information symmetry. In this instance, policymakers and regulators should be more attentive to disseminating information via an accessible medium. Additionally, regulators might also supervise the transaction history during the uptrend market in Nepal, as the uptrend market is more likely to experience herding tendencies. Finally, this research also encourages academic researchers to explore this topic using comprehensive models that accommodate both qualitative and quantitative data, incorporating variables such as industry-level factors, varying market concentration levels, and different dividend yields, as this study is limited to quantitative data only. As this investigation also poses some limitations, such as not being able to capture the whole population to better understand the market with an extended period, extending the research over a longer timeframe will enable a comprehensive exploration of the subject matter, capturing its broader scope. More academic research and discourse could help to clarify the reasons behind the nature of herding in the Nepali market. Moreover, the future study may be conducted considering the sector-wise portfolios with an extended time frame for a better understanding of the nature of herding in the Nepali market.
Footnotes
Declaration of Conflicting Interests
The authors declare no potential conflicts of interest with respect to the research, authorship, and/or publication of this article.
Funding
The authors received no financial support for the research, authorship, and/or publication of this article.