
Abstract
Background
Catastrophic health expenditure (CHE) represents a critical barrier to universal health coverage, often pushing households into poverty and deepening financial hardship for vulnerable populations. This study examines determinants of CHE among patients attending public hospitals in the Northern Midlands and Mountainous areas of Vietnam.
Design and methods
A cross-sectional study was conducted from July to December 2021 among 706 patients recruited via multi-stage stratified sampling from 10 public hospitals across five provinces. Data were collected through structured face-to-face interviews. CHE was defined as out-of-pocket health expenditure exceeding 40% of non-food expenditure. Binary logistic regression was employed to identify determinants of CHE.
Findings
Among 706 participants, 147 (20.82%) experienced CHE. CHE cases were concentrated in the poorest income quintile (34.69%) and lowest in the richest (5.44%). Patients experiencing CHE were also disproportionately represented among those diagnosed with cancer (28.57% vs. 5.19% in the non-CHE group), reported higher rates of self-treatment (46.94%), and had more frequent inpatient visits. Key factors positively associated with CHE included cancer (OR = 6.438), self-treatment (OR = 2.798), treatment at provincial hospitals (OR = 2.099), inpatient visit frequency (OR = 1.160), and greater distance to health facilities. Factors negatively associated with CHE included health insurance coverage (OR = 0.579), Kinh ethnicity (OR = 0.319), and higher satisfaction with the availability (OR = 0.594) and quality of medicines (OR = 0.565).
Conclusions
The findings highlight the need to strengthen health insurance coverage for vulnerable households, improve district-level services, and reinforce primary healthcare, with relevance for other resource-constrained settings.
1. Introduction
The World Health Organization (WHO) promotes Universal Health Coverage (UHC) as a central strategy for ensuring access to essential health services while reducing reliance on out-of-pocket (OOP) payments through prepayment mechanisms such as health insurance. 1 A core objective of UHC is to protect households from financial hardship associated with healthcare utilization. Despite substantial progress, high OOP spending remains a major challenge in many low- and middle-income countries (LMICs), where it continues to undermine financial protection. Globally, an estimated 100 million people are pushed into poverty each year, and approximately 150 million face catastrophic health expenditure (CHE) due to excessive OOP payments.2–4
OOP health expenditures refer to direct payments made by individuals for healthcare services that are not reimbursed by insurance schemes. Such expenditures are considered catastrophic when they exceed a defined threshold of household resources and threaten a household’s standard of living. When these payments push households below the poverty line or further impoverish those who are already poor, they are classified as impoverishing health expenditures. These indicators are widely used to monitor financial protection and to assess progress toward the health-related Sustainable Development Goals (SDGs).3,5
Although the WHO recommends limiting OOP payments to 15–20% of total health spending, financial protection remains a global challenge. Wagstaff et al. (2018a) estimated that in 2010, over 800 million people experienced CHE at the 10% consumption threshold, and that the global incidence had increased over the preceding decade. 6 This burden is disproportionately concentrated in Asia and Africa, where OOP spending in low- and middle-income countries (LMICs) accounts for 20%–60% of total health expenditure, which is substantially higher than in high-income countries.2,6 As a result, high medical costs continue to push tens of millions of individuals into extreme poverty each year.3,7
Beyond its financial implications, CHE reflects broader challenges related to equity, access, and health system performance. At the household level, CHE can lead to delayed care, reduced consumption of essential goods, and long-term impoverishment. At the system level, persistent CHE signals gaps in financial protection and inefficiencies in service delivery, particularly in regions facing geographic and socioeconomic barriers. Addressing CHE is therefore central to achieving equitable and sustainable progress toward universal health coverage.
Vietnam has demonstrated a strong commitment to UHC. Social health insurance (SHI) coverage increased from 44% in 2008 to approximately 91% by 2022. 8 Despite this progress, the healthcare system remains heavily hospital-centered, with hospitals accounting for about 73% of total health expenditure. Patients frequently bypass lower-level facilities in favor of provincial or central hospitals, contributing to overcrowding and service concentration. In addition, the implementation of hospital financial autonomy policies, combined with a rapidly aging population, has increased financial and operational pressures on public hospitals. These dynamics raise concerns about equity and efficiency. They may also inadvertently shift a greater share of healthcare costs onto patients, even under high insurance coverage.8,9
The Northern Midlands and Mountainous areas of Vietnam comprise 14 provinces and are characterized by persistent socioeconomic disadvantages. Despite relatively strong aggregate economic growth between 2014 and 2021, average per capita income in the region remains below the national level. Poverty incidence also remains high in many localities, with several provinces reporting poverty rates well above the national average. 10 Healthcare utilization is heavily concentrated in public hospitals, particularly for inpatient services, among both urban and rural populations. Although nominal health insurance coverage in the region is high, effective utilization remains limited, especially for outpatient care. Only about 32.5% to 41.1% of insured individuals use their health insurance cards for outpatient services, particularly among poorer households. Consequently, the incidence of CHE in the region remains elevated, reaching 4.6% in 2020 above the national average of 3.3%, and disproportionately affecting low-income households. 11
Many studies worldwide and in Vietnam have examined catastrophic medical costs.11–20 However, most studies in Vietnam rely on secondary data such as the Vietnam Household Living Standards Survey (VHLSS), which lacks detailed clinical information and patient-level perspectives. Beyond financial and demographic determinants, recent international research has begun to incorporate subjective well-being and satisfaction into CHE analyses. For example, Chen et al. (2023) identified life satisfaction as an enabling factor in Andersen’s behavioral model and showed that higher life satisfaction reduced the odds of CHE among older adults in China. 21 Kim and Hong (2015) demonstrated that Korean households experiencing CHE reported significantly lower levels of life satisfaction, highlighting the link between financial burden and subjective well-being. 22 In the context of severe illness, Chino et al. (2014) found that cancer patients reporting heavier financial burdens were significantly less satisfied overall, particularly with technical quality and the financial aspects of care. 23 Similarly, Kang et al. (2018) showed that individuals experiencing CHE reported significantly lower health-related quality of life, with the negative impact being especially pronounced among those with multiple chronic conditions. 24 These studies underscore the importance of integrating satisfaction-related variables when analyzing CHE.
Although this emerging literature highlights potential links between subjective experiences and financial hardship, evidence remains limited on how disease type, healthcare utilization patterns, and patient-reported experiences jointly influence CHE risk. This gap is particularly important in socioeconomically disadvantaged and remote regions of Vietnam. Accordingly, this study aims to identify the socioeconomic, clinical, healthcare utilization, and patient-reported factors associated with CHE among patients attending public hospitals in the Northern Midlands and Mountainous areas of Vietnam.
In this context, the present study provides patient-level evidence on the incidence and determinants of CHE in one of Vietnam’s most disadvantaged regions. It focuses on the Northern Midlands and Mountainous areas, where geographic and economic barriers may constrain access to timely and appropriate care. The study makes three contributions. First, it uses primary patient survey data collected across multiple provinces. Second, it accounts for disease type when examining the determinants of CHE. Third, it incorporates patient-reported satisfaction with medicines and services to assess whether perceived service experiences are associated with CHE risk. Taken together, these contributions provide policy-relevant insights for strengthening financial protection and advancing progress toward UHC in Vietnam and comparable LMIC contexts.
2. Methods
2.1. Data collection and sampling
A cross-sectional study was conducted using a multi-stage sampling strategy to select hospitals and patients. In the first stage, five provinces in the Northern Midlands and Mountainous areas of Vietnam (Thai Nguyen, Bac Giang, Bac Kan, Yen Bai, and Phu Tho) were purposively selected to reflect the socioeconomic and ethnic diversity of the region. Within each province, one provincial hospital and one district hospital were randomly selected from the list of public hospitals provided by the provincial health authorities, resulting in a total of ten hospitals included in the study. In the second stage, patients were recruited using stratified sampling to ensure representation across hospital levels (provincial versus district), patient types (inpatient versus outpatient), and clinical departments (such as internal medicine, surgery, pediatrics, and obstetrics and gynecology). Within these strata, eligible patients were identified through hospital records during the survey period, and investigators approached them directly to invite them to participate.
The sample size was estimated using Cochran’s formula for determining a representative sample for proportions
25
:

The Cochran-based estimate was interpreted as the required number of completed and valid interviews. Given the on-site recruitment process, refusals or ineligible cases were replaced by the next eligible patient within the same sampling stratum, defined by hospital level, patient type, and clinical department, until the target number of completed questionnaires was obtained in each province. This approach was used to preserve the intended sample structure across the selected hospitals.
To ensure balanced geographic coverage, we surveyed 141 patients per province, resulting in a total of 706 respondents. For the sample size calculation, we used a conservative prevalence estimate of 10% based on Wagstaff et al. (2018a). 6 In the absence of specific regional data for the 40% capacity-to-pay threshold, this approach was deemed appropriate, as using a higher prevalence estimate yields a larger sample size than strictly required, thereby strengthening the validity of the analysis.
Inclusion criteria required participants to be at least 18 years of age, to have utilized healthcare services at the study hospitals during the survey period, and to provide informed consent. For inpatients, inclusion was restricted to those with a hospital stay of at least three days. This criterion was established to ensure sufficient exposure to inpatient care processes (e.g., diagnostics, medication regimens, and facility use) to allow for reliable reporting of costs and satisfaction; and a minimum level of clinical severity and resource utilization, distinguishing substantial inpatient episodes from short-term observation stays. In contrast, outpatients were interviewed immediately following their consultation to minimize recall bias, given that outpatient encounters are typically concluded within a single visit. Participants were excluded if they were under 18 years of age, declined or were unable to provide informed consent, or were too clinically unstable to participate in the interview. The survey was conducted between July and December 2021.
Data were collected exclusively through structured face-to-face interviews using a predesigned questionnaire. The structured questionnaire was developed based on a review of relevant literature11–24,26 and adapted from the conceptual framework of Kumara and Samaratunge (2016) to reflect the specific socioeconomic context of the region. 27 To ensure standardization and consistency in data collection, all interviewers received comprehensive training on the survey protocol and interview techniques prior to fieldwork. The instrument covered four main components: socio-demographic profiles (age, gender, ethnicity, marital status, household size, household composition, residential area, and distance to the nearest health facility), household socioeconomic conditions (income, household expenditure patterns, and OOP expenditures for outpatient and inpatient services), health-related information (self-reported illness, presence of chronic diseases, healthcare utilization patterns, and health insurance coverage), and patient satisfaction with the availability and quality of medicines and healthcare services. Before the main survey, the questionnaire was pilot-tested with a small group of patients to assess the clarity, feasibility, wording, sequencing, and appropriateness of the questions in the local context. Based on participants’ feedback, minor revisions were made to improve the clarity, comprehensibility, and contextual relevance of the questionnaire before formal data collection. For the patient satisfaction items measured on a 5-point Likert scale, internal consistency was also assessed using Cronbach’s alpha, which yielded a value of 0.75, indicating acceptable reliability.
Expenditure data were obtained entirely from self-reported information, as hospital billing records were not consistently available across facilities. To minimize recall bias, respondents were encouraged to cross-check their responses with any receipts or payment records they had retained. Only direct medical costs were considered, defined as all OOP payments made by patients at the hospital, including consultation fees, diagnostic tests, medical procedures, surgical fees, and pharmaceuticals prescribed by doctors during the previous 12 months. Indirect costs such as transportation, accommodation, and income lost were excluded.
Inpatient and outpatient costs were aggregated to estimate the total annual household health burden. Total direct medical costs were computed as the sum of OOP payments over the last 12 months. Although shorter recall periods are sometimes recommended to minimize bias for outpatient care, a 12-month period was employed to align with standard CHE measurement methodologies and to ensure capture of infrequent but high-cost episodes.6,28 Following the actual food spending method developed by the World Bank, as reviewed by Cylus et al. (2018), a household was classified as experiencing CHE when OOP health expenditures exceeded 40% of total household expenditure net of actual food spending. 29 This threshold is widely used in the financial protection literature and allows comparison with previous studies of CHE in Vietnam.11,13,14 It was considered appropriate for the present study because it reflects household capacity to pay after basic subsistence needs have been met, which is particularly relevant in a socioeconomically disadvantaged region.10,11 Although alternative thresholds have also been used in the literature, 6 the 40% criterion was adopted here to ensure comparability with commonly used approaches to CHE measurement. 4
2.2. Ethical approval
The research protocol was reviewed and approved for scientific and ethical compliance by Thai Nguyen University of Economics and Business Administration, Vietnam, as documented in the university’s official approval letter (Approval No. 68/ĐHKT&QTKD-KHCN, dated 21 May 2021). Participation was entirely voluntary, and written informed consent was obtained from all participants prior to data collection.
2.3. Measurements and variables
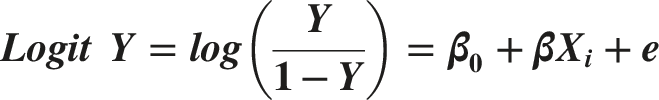
The study employed a Binary Logistic Regression model to identify the factors influencing CHE in the Northern Midlands and Mountainous areas. The following equation represents the model:
To guide the selection and classification of explanatory variables, a conceptual framework was developed (Figure 1). This framework was adapted from the conceptual framework of Kumara and Samaratunge (2016), which distinguishes between demand-side and supply-side determinants of financial burden.
27
Conceptual framework.
The measurement of independent variables is summarized as follows. Patient age was measured in years, while household size was recorded as the total number of household members and distance to the nearest health facility was measured in kilometres. Binary variables included gender, ethnicity, marital status, health insurance coverage, visits to private facilities, area of residence, and the presence of children under six years old or elderly household members (aged 60+). Self-treatment was defined as a binary variable, coded as 1 if the patient reported purchasing medicines or medical equipment on their own, without a doctor’s prescription or professional medical consultation, prior to the first hospital visit for the current illness, and 0 otherwise. Household economic status was classified into five income quintiles, ranging from the poorest (Q1) to the richest (Q5). Health-related variables included disease categories, healthcare utilization intensity (number of visits in the past 12 months), and level of health facility (district versus provincial). Finally, patient satisfaction was measured using 10 item-level indicators based on the conceptual dimensions of Kumara and Samaratunge (2016) and the empirical determinants identified by Akthar et al. (2023).26,27 Each item was assessed on a 5-point Likert scale ranging from 1 (“very dissatisfied”) to 5 (“very satisfied”). These items were included in the regression analysis as separate indicators. Detailed descriptions of the dimensions and corresponding survey items are provided in Appendix A.
The reporting of this study conforms to the STROBES statement guidelines for cross-sectional studies. 35
3. Results
3.1. Descriptive results
Figure 2 illustrates the distribution of OOP health expenditure relative to household capacity to pay, measured as non-food household expenditure, among patients and their households in the study population. The largest proportion of patients (30.30%) allocated between 5% and 10% of their household non-food budget to healthcare, while smaller shares spent between 10-15% or 15-25%. Notably, more than one-fifth of patients (20.82%) incurred OOP health expenditures exceeding 40% of non-food spending during the 12 months preceding the interview, indicating a substantial burden of CHE at the household level in this patient-based sample. Distribution of out-of-pocket health expenditure as a share of non-food household expenditure Source: Authors’ calculation based on survey data.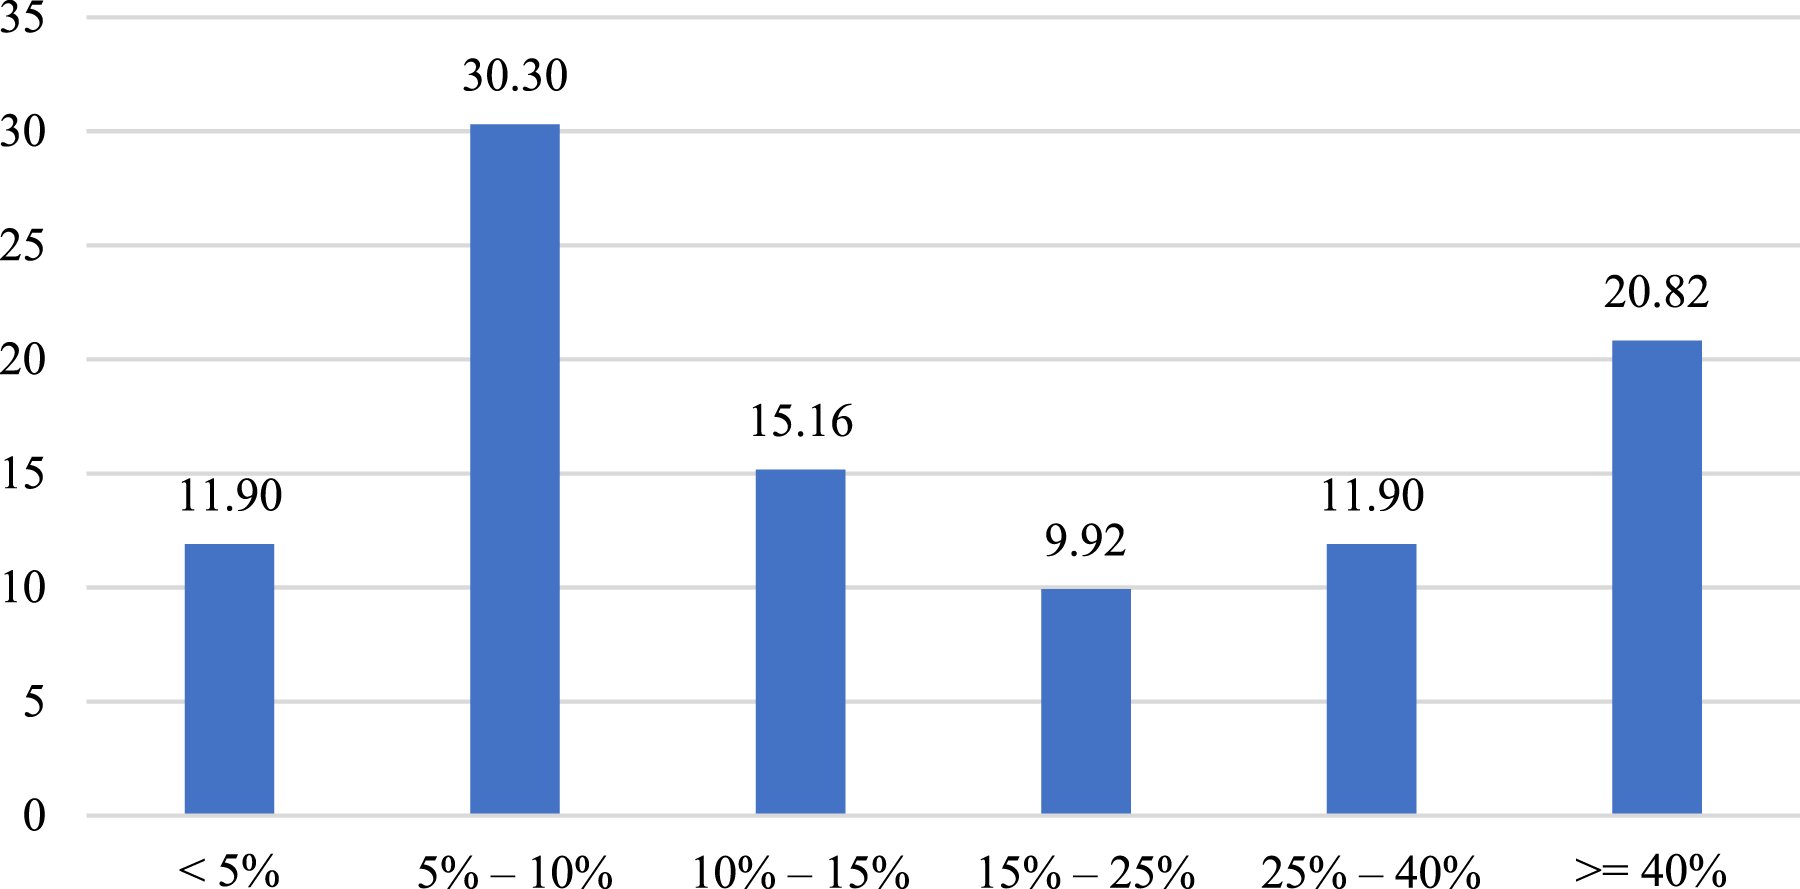
Social-demographic profile of patients.
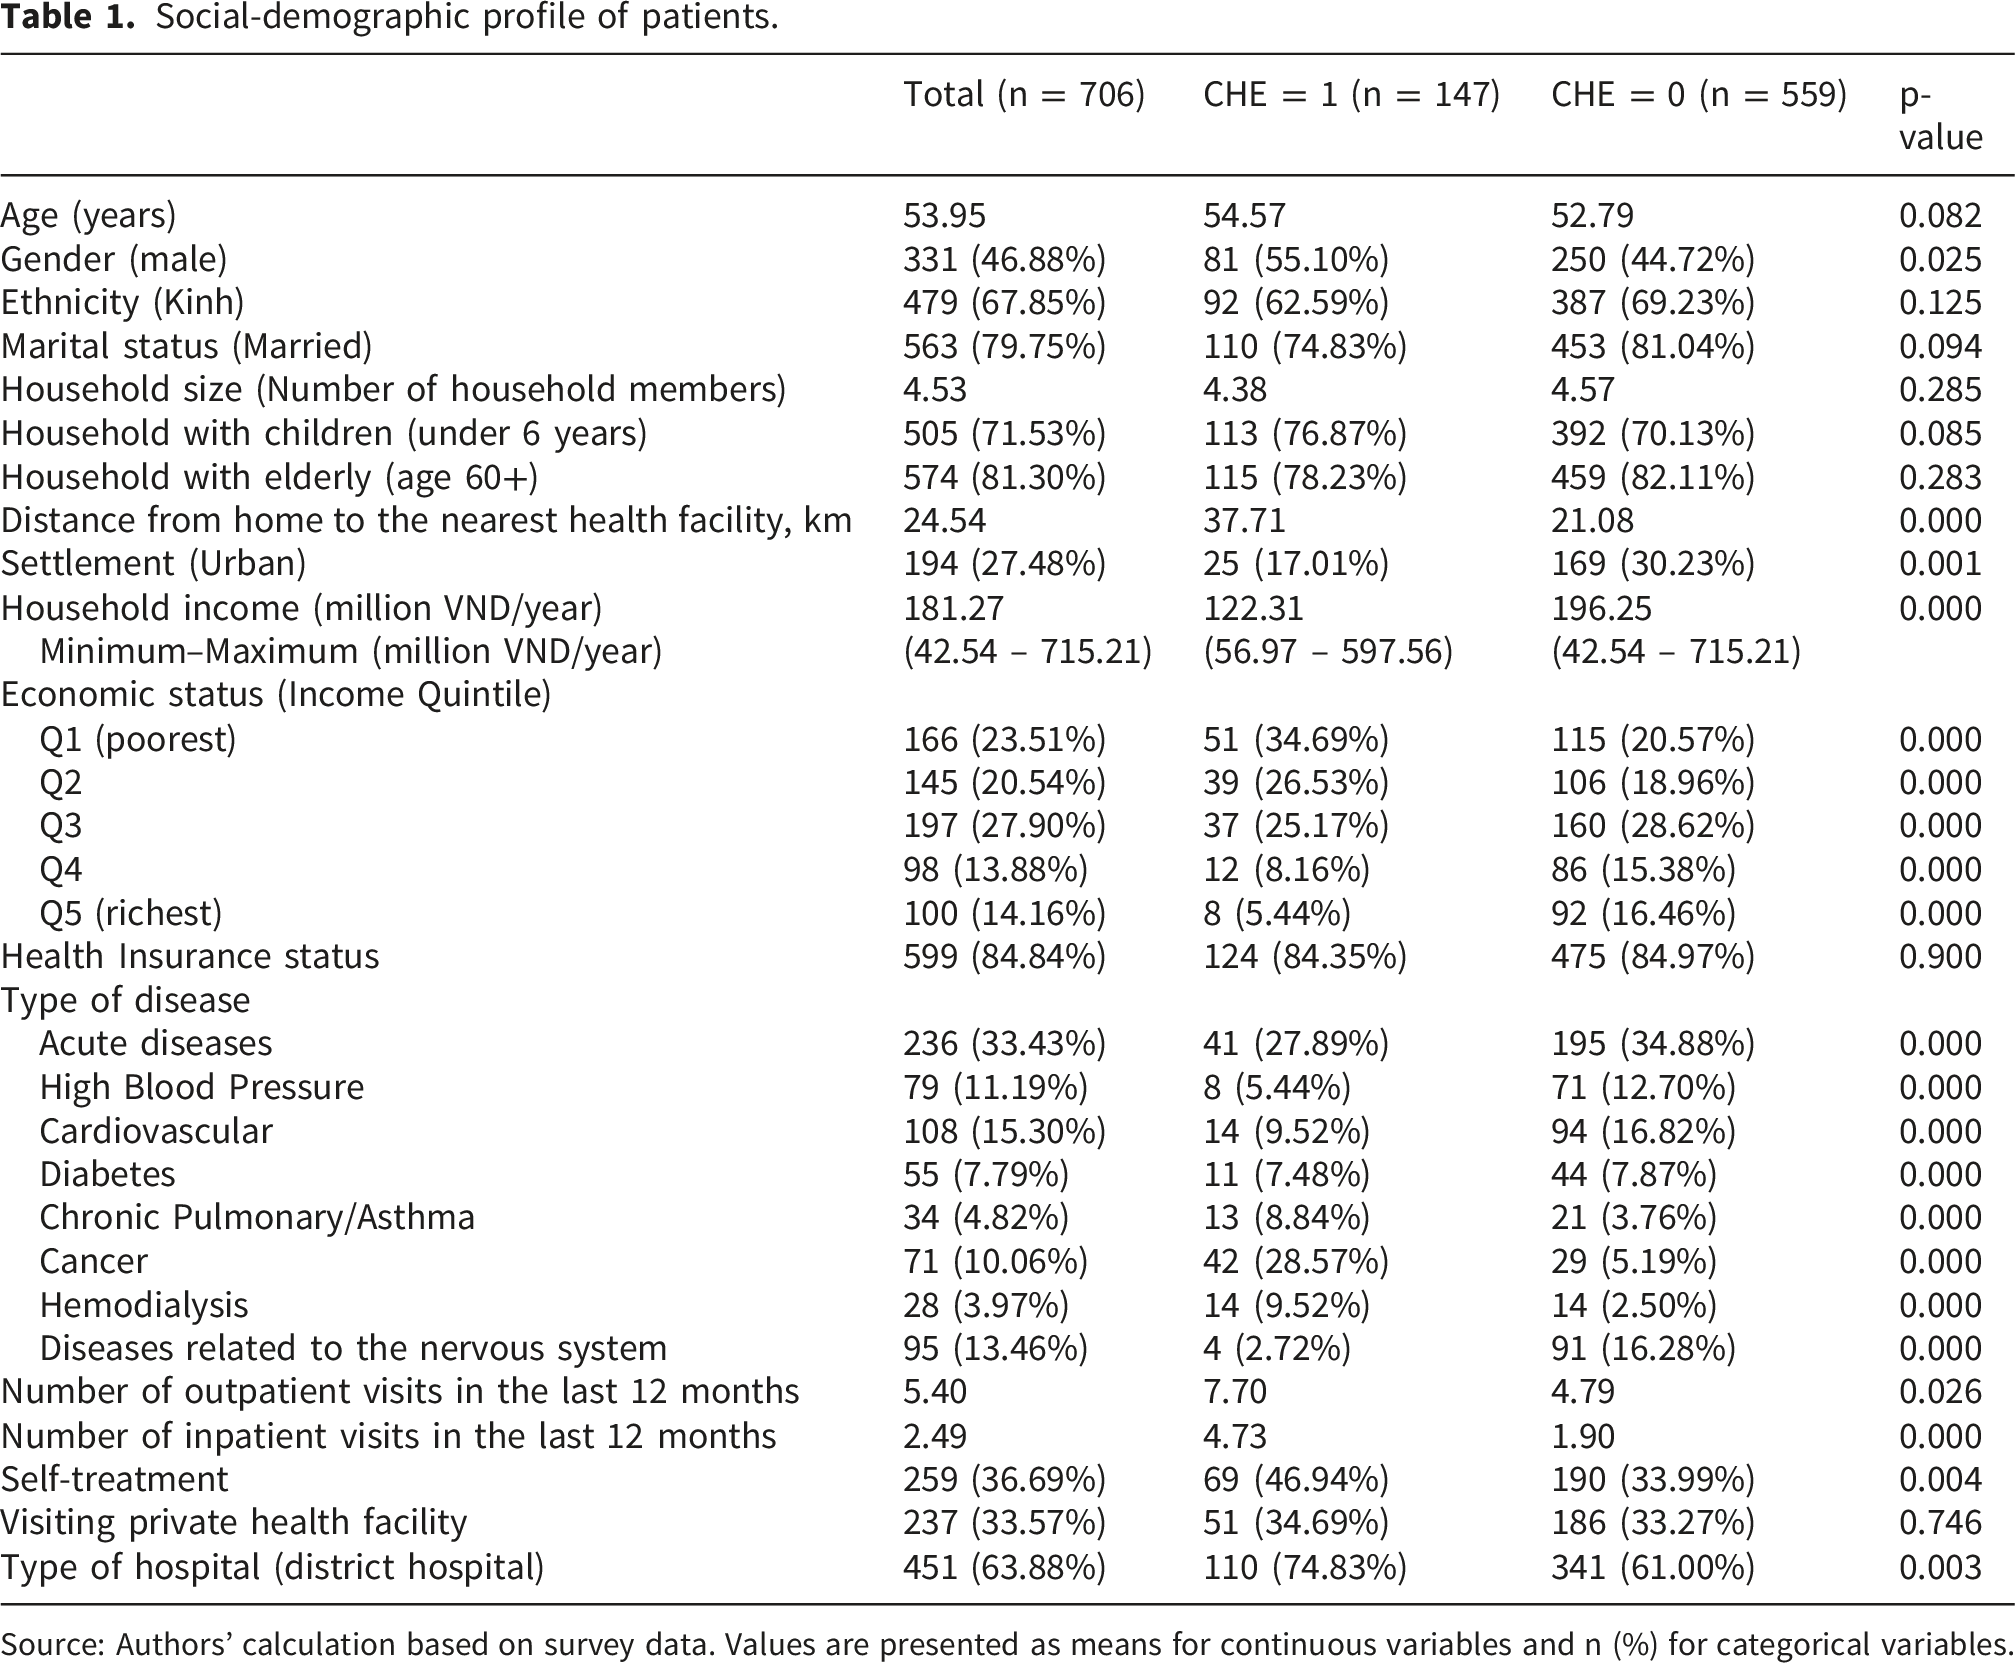
Source: Authors’ calculation based on survey data. Values are presented as means for continuous variables and n (%) for categorical variables.
Table 1 summarizes the socio-demographic and contextual characteristics of the 706 participants. The mean age was 53.95 years, 46.88% of participants were male, and 67.85% belonged to the Kinh ethnic group. Most patients were recruited from district hospitals (63.88%) and lived in rural areas (72.52%). The average annual household income was 181.3 million VND, with the largest proportion of households in the third income quintile (27.90%). Participants were predominantly married (79.75%), with an average household size of 4.53 members; many households included elderly members (81.30%) and children under six years of age (71.53%). Health insurance coverage was high (84.84%). Acute diseases were the most common diagnoses (33.43%), followed by cardiovascular conditions (15.30%). On average, participants lived 24.54 km from the nearest health facility and reported 5.40 outpatient visits and 2.49 inpatient admissions in the previous year; 36.69% also reported self-treatment.
The results in Table 1 show that patients who experienced CHE in the 12 months prior to the survey were, on average, older than those who did not (54.57 vs. 52.79 years). The CHE group also had a higher proportion of male patients (55.10% vs. 44.72%) and households with children under six years of age (76.87% vs. 70.13%). In contrast, a smaller proportion of patients in the CHE group lived in urban areas compared with the non-CHE group (17.01% vs. 30.23%). Geographic accessibility and hospital level also differed between the two groups. Patients with CHE lived substantially farther from the nearest health facility than those without CHE (37.71 km vs. 21.08 km), and the type of hospital attended was also associated with CHE status. Marked socioeconomic differences were also observed. CHE was more concentrated among poorer households: 34.69% of patients in the CHE group belonged to the poorest quintile, compared with only 5.44% in the richest quintile. In the non-CHE group, the corresponding shares were 20.57% and 16.46%, respectively. Figure 3 indicates that the income disparity between the richest and poorest groups was substantially larger in the CHE group than in the non-CHE group, at 29.25 and 4.11 percentage points, respectively. By contrast, health insurance coverage was similarly high in both groups, with only a marginal difference between patients with CHE and those without CHE (84.35% vs. 84.97%). Difference between the poorest and richest income quintiles by CHE status, %. Source: Authors’ calculation based on survey data.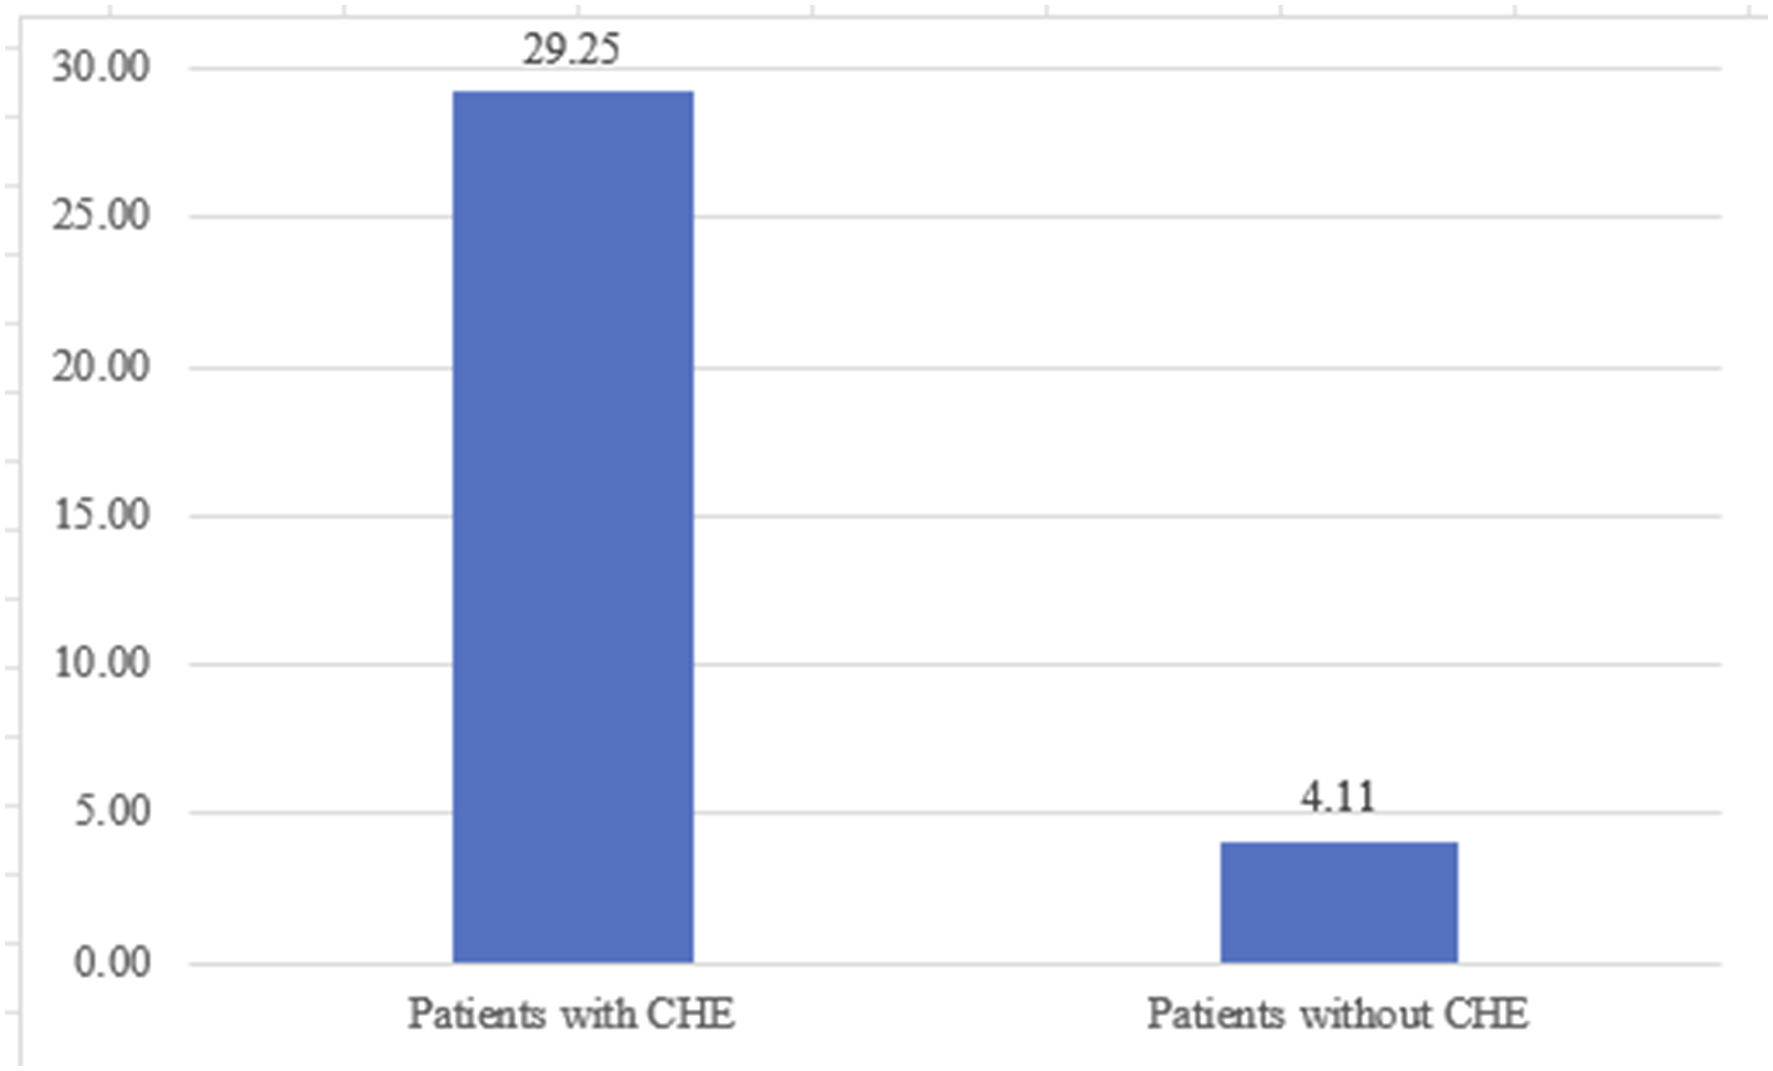
The prevalence of acute illness was lower among patients experiencing CHE than among those without CHE (27.89% vs. 34.88%). Similarly, conditions such as cardiovascular disease, hypertension, diabetes, and neurological disorders were less common in the CHE group. In contrast, cancer and hemodialysis were more prevalent among CHE patients (28.57% vs. 5.19% and 9.52% vs. 2.50%, respectively). Patients with CHE also reported more frequent outpatient visits and inpatient admissions during the past 12 months (7.70 vs. 4.79 and 4.73 vs. 1.90 times per year, respectively). Additionally, the rate of purchasing medicines or medical equipment for self-treatment was higher among CHE patients, at 46.94% compared with 33.99% among non-CHE patients (Table 1).
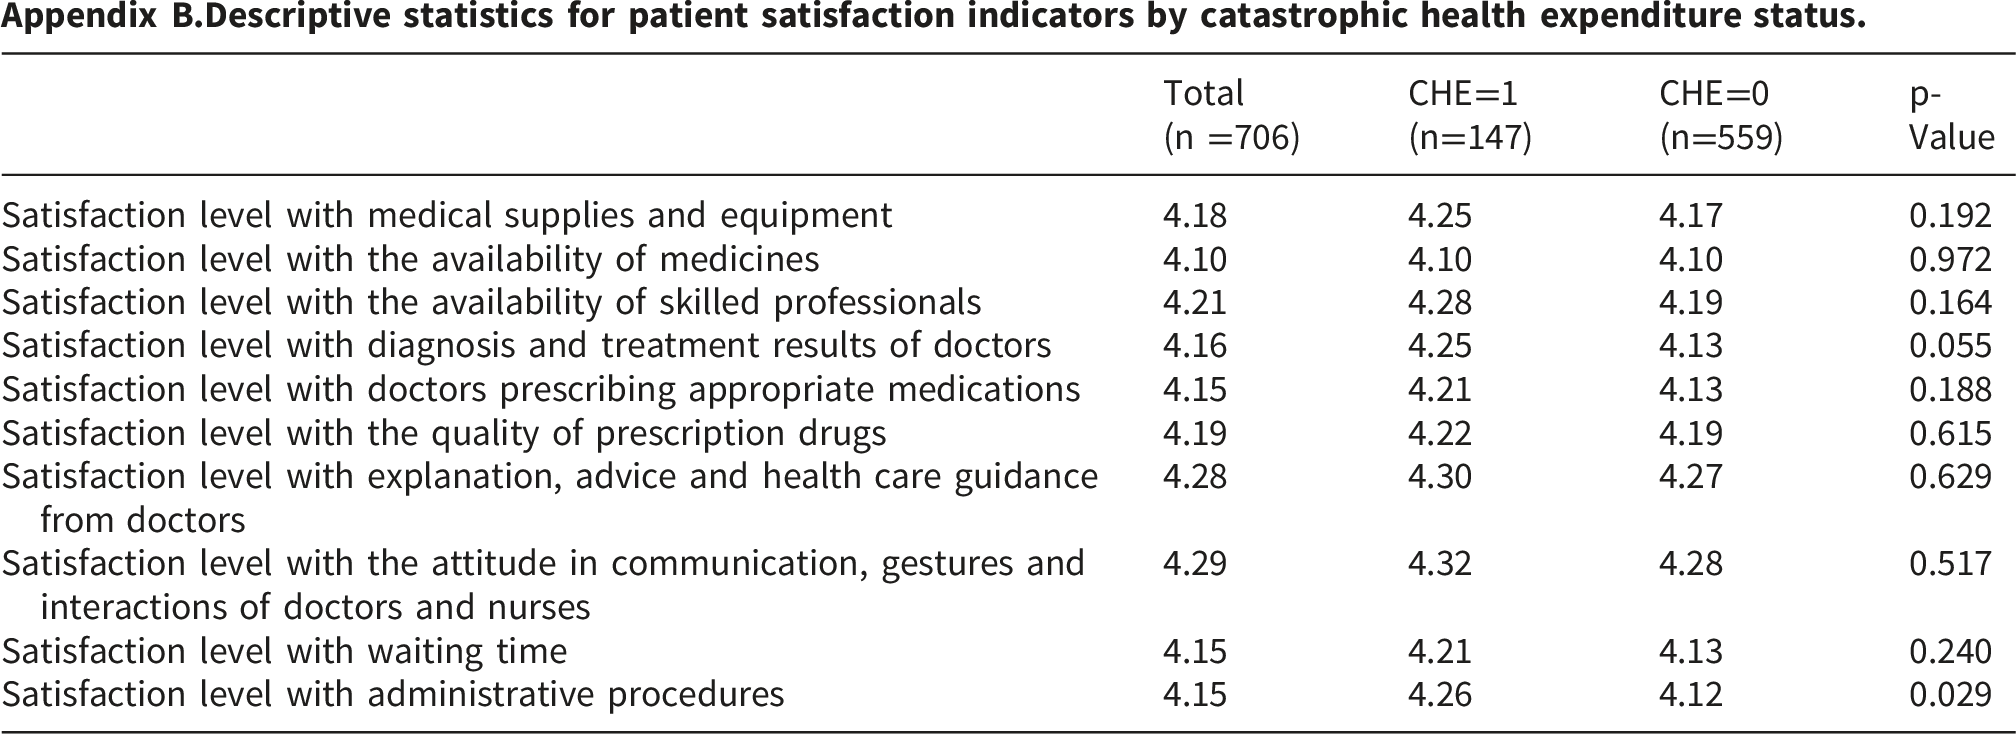
Detailed descriptive statistics for patient satisfaction indicators are presented in Appendix B. Overall, satisfaction levels were relatively similar between the CHE and non-CHE groups, although some differences were observed for diagnosis and treatment results and administrative procedures.
Urban–rural distribution of out-of-pocket spending and catastrophic health expenditure by income quintile.

The data reveal a clear contrast between absolute spending levels and financial burden. While higher-income households (Q5) in both rural and urban areas tended to incur absolute OOP expenditures that were higher than or comparable to those of poorer households (Q1), the relative financial burden was disproportionately concentrated among the poor. In rural areas, households in the lowest income quintile spent, on average, 77.49% of their non-food expenditure on healthcare, compared with only 13.54% among the richest quintile. A similar pattern of vertical inequity was observed in urban settings, where the OOP share among the poorest households (72.80%) was substantially higher than that of the richest group (12.13%). Correspondingly, the incidence of CHE was highest among the poorest households and declined progressively with rising income, highlighting pronounced socioeconomic disparities in financial protection.
Taken together, the descriptive findings indicate that the burden of CHE in the Northern Midlands and Mountainous areas is unequally distributed. It is disproportionately concentrated among socioeconomically vulnerable populations, particularly those facing low income, severe chronic conditions, geographical barriers, and intensive healthcare needs. Notably, the observation that CHE persists despite high health insurance coverage suggests that while enrollment is widespread, the depth of financial protection could be further strengthened. This is particularly relevant for vulnerable groups requiring repeated inpatient care or specialized treatment at higher-level facilities. These descriptive patterns provide an important empirical foundation for the multivariate analysis that follows, highlighting the interaction between socioeconomic disadvantage, disease severity, and health system characteristics in shaping financial risk.
3.2. Determinants of catastrophic health expenditure
Determinants of catastrophic health expenditure for patients at health facilities in Northern Midlands and Mountainous areas of Vietnam.
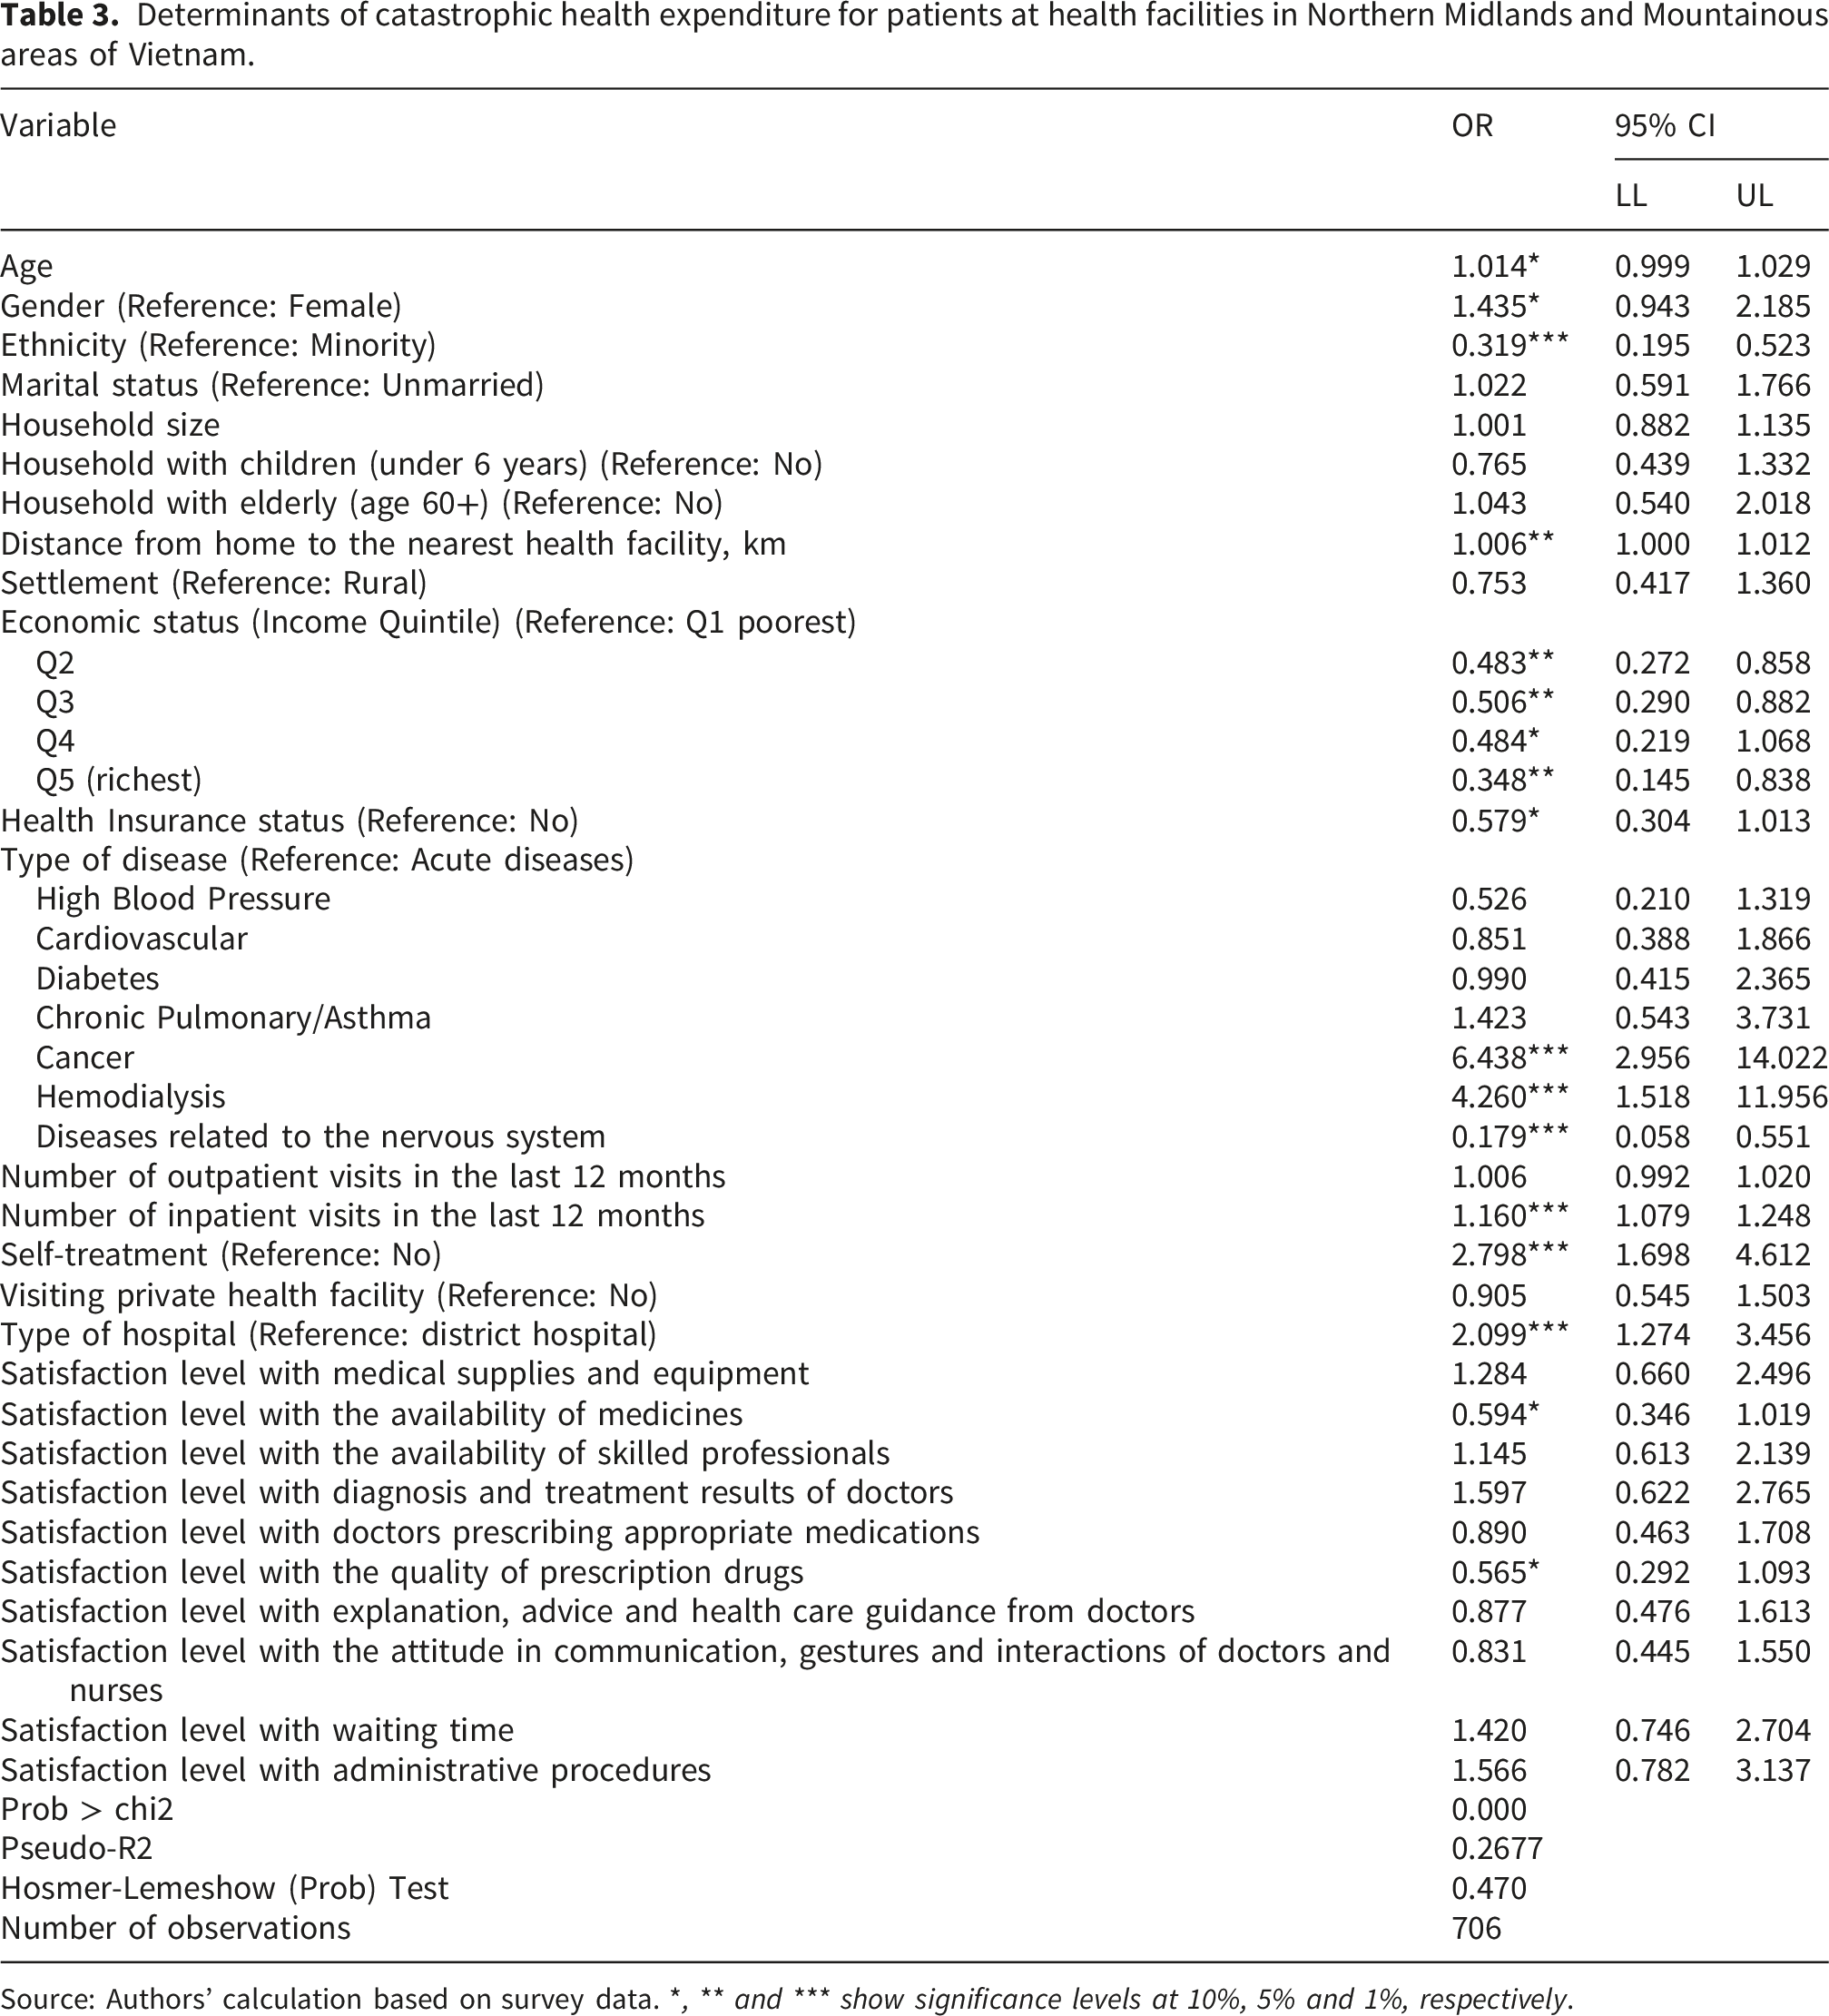
Source: Authors’ calculation based on survey data. *, ** and *** show significance levels at 10%, 5% and 1%, respectively.
The results indicate that several factors were associated with CHE. These included age, gender, ethnicity, distance from home to the nearest health facility, household economic status, health insurance status, disease category, number of inpatient visits, self-treatment, type of hospital, and satisfaction with the availability and quality of prescribed drugs (Table 3).
For every one-year increase in age, the odds of experiencing CHE increased by 1.014 times (OR = 1.014; 95% CI: 0.999–1.029). Male patients were more likely to experience CHE than female patients (OR = 1.435; 95% CI: 0.943–2.185). Patients of Kinh ethnicity were less likely to experience CHE than ethnic minority patients (OR = 0.319; 95% CI: 0.195–0.523). Distance to the nearest health facility was positively associated with CHE, with each additional kilometre slightly increasing the odds (OR = 1.006; 95% CI: 1.000–1.012).
Household economic status showed a protective factor. Compared with patients from the poorest households, those in the second, third, fourth, and richest quintiles had lower odds of CHE, with ORs of 0.483 (95% CI: 0.272–0.858), 0.506 (95% CI: 0.290–0.882), 0.484 (95% CI: 0.219–1.068), and 0.348 (95% CI: 0.145–0.838), respectively. Similarly, health insurance played a protective role in reducing the risk of CHE associated with medical examination and treatment. Compared with patients without health insurance, those with health insurance were less likely to experience CHE, with OR = 0.579; 95% CI: 0.304-1.013.
In the regression model, disease status was represented by specific disease categories, with acute diseases as the reference group. The results indicated that patients with diseases related to the nervous system were significantly less likely to experience CHE than those with acute diseases, with OR = 0.179; 95% CI: 0.058-0.551. In contrast, patients with cancer and those undergoing hemodialysis were found to be at a significantly higher risk of experiencing CHE compared with patients with acute diseases. The odds ratios for these groups were OR = 6.438 (95% CI: 2.956-14.022) for cancer patients and OR = 4.260 (95% CI: 1.518-11.956) for those receiving hemodialysis.
Healthcare utilization was also important. The frequency of inpatient treatments significantly increased the likelihood of patients experiencing CHE. Specifically, for each additional treatment received in the 12 months prior to the survey, the odds of experiencing CHE increased by 1.16 (OR = 1.160; 95% CI: 1.079–1.248). Moreover, patients who reported self-medicating or purchasing medical equipment for their illness were at a much higher risk of experiencing CHE than those who did not (OR = 2.798; 95% CI: 1.698–4.612). Additionally, our findings indicate that patients who sought treatment at provincial hospitals had a higher risk of experiencing CHE compared with those who received care at the district level, with OR = 2.099; 95% CI: 1.274-3.456.
Among the patient satisfaction variables, two variables were significantly associated with CHE. The estimation results showed that higher satisfaction with the availability of medicines was associated with lower odds of CHE (OR = 0.594; 95% CI: 0.346–1.019), and higher satisfaction with the quality of prescribed drugs was also associated with lower odds of CHE (OR = 0.565; 95% CI: 0.292–1.093).
4. Discussion
This study provides patient-level evidence on the determinants of CHE among patients attending public hospitals in the Northern Midlands and Mountainous areas of Vietnam. The findings show that CHE was more likely among older patients, men, ethnic minorities, those living farther from health facilities, poorer households, patients without health insurance, those with cancer or those undergoing hemodialysis, those with more inpatient admissions, those reporting self-treatment, and those treated at provincial hospitals. By contrast, Kinh ethnicity, higher household income, health insurance coverage, and higher satisfaction with the availability and quality of medicines were associated with lower odds of CHE.
The positive association between age and CHE suggests that older patients may face greater financial vulnerability because they often require more frequent healthcare and more intensive treatment. This result is consistent with the findings of Bedado et al. (2022). 2 Male patients also showed a higher risk of CHE than female patients. This can be explained by the fact that men may be more exposed to risk factors such as alcohol and tobacco use, which increase the likelihood of developing severe chronic diseases. It is important to note that this finding differs from the findings of Thuong et al. (2022), who found that female-headed households were more likely to experience CHE. 11 This discrepancy likely reflects the differences in the unit of analysis. The earlier study focused on household heads, whereas the present study focuses on individual patients. At the patient level, our finding aligns with the results of Fu and Chen (2022), 36 who also reported a higher probability of CHE among male patients.
Kinh ethnicity appeared to be protective relative to ethnic minority status. This may be explained by several contextual factors. Ethnic minorities often live in remote areas with difficult socio-economic conditions and may need to travel long distances to access medical care. These areas may also lack adequate medical infrastructure, including facilities, equipment, medical personnel, and essential medicines. Such limitations can affect both the quality and effectiveness of care. As a result, when patients from these communities seek treatment at higher-level facilities, such as district or provincial hospitals, their conditions may already have worsened, resulting in higher treatment costs and a greater likelihood of CHE.
Distance to the nearest health facility was positively associated with CHE. This finding is consistent with Masiye et al. (2016) who reported that greater distance to health facilities increased the odds of CHE for households in Zambia by 1.015. 37 Distance is an important indicator of healthcare accessibility and may shape treatment-seeking behavior. When facilities are far away, patients may delay seeking care and present with more severe conditions. Consequently, they may require more intensive treatment, longer hospital stays, and more expensive medicines. This can substantially increase direct medical expenditures and the likelihood of CHE. In mountainous and geographically isolated settings, this finding underscores that improving access to care is not only a matter of service availability but also of financial protection.
Household economic status was an important determinant of CHE, with wealth acting as a protective factor for patients and their households. These findings align with previous studies, which also demonstrated that wealthier households are less vulnerable to CHE.31,32,38 The sharp contrast between the poorest and richest quintiles underscores the continuing importance of income-related inequality in financial protection. Health insurance was negatively associated with CHE, suggesting that insurance coverage plays an important protective role against financial hardship. This finding is consistent with previous research. 39 In line with this, Gheinali et al. (2023) reported a comparable protective effect among hospitalized patients, showing that those with adequate insurance coverage were significantly less likely to incur catastrophic expenditures than those without such financial protection. 40
Disease category was strongly associated with CHE. Compared with acute diseases, cancer and hemodialysis showed particularly large positive associations with catastrophic spending, whereas diseases related to the nervous system were associated with lower odds. These findings are consistent with those of Minh and Bach (2012), who reported that households with members suffering from non-communicable diseases in Vo Nhai district, Thai Nguyen province, had 3.2 times higher odds of experiencing CHE than other households. 41 Similarly, Lee et al. (2019) found that in Quoc Oai district, Ha Tay province, the risk of CHE increased with the number of household members suffering from chronic diseases, with an OR of 1.16. 42 Our results are also in line with those of Giang et al. (2020) in Hanoi, Dien Bien, and Dong Thap provinces. 43 In addition, Yadav et al. (2021) showed that the likelihood of impoverishment due to health expenditures was significantly higher among hospitalized cancer patients in India, with an OR of 7.670. 44
Recent international findings further reinforce the link between severe health conditions and financial hardship. Meshkat et al. (2024) highlighted that non-communicable diseases significantly drive catastrophic expenditures, especially among older populations. 45 Likewise, Dehaghi et al. (2025) found that severe conditions such as ischemic heart disease place a heavy financial burden on households. 46 These studies collectively highlight the substantial financial burden associated with chronic diseases, particularly when treatment is long term and intensive. The elevated odds ratios observed for cancer and hemodialysis underscore the pronounced financial vulnerability associated with these conditions in the study region. For these patients, long-term management, frequent travel to provincial hospitals, and the costs of specialized care can place substantial strain on household resources. These findings suggest that while health insurance provides a baseline of support, gaps may remain in the level of financial protection available for households facing high-cost chronic illnesses.
Inpatient utilization was another strong predictor of CHE. This vulnerability among hospitalized patients is consistent with recent observations by Gheinali et al. (2023) and Jafaei et al. (2025), who identified substantial rates of CHE in hospitalized cohorts for COVID-19 and maternal care, respectively.40,47 Hospital admission generally involves higher direct costs and may also indicate greater disease severity. Both factors can increase the likelihood of CHE. Self-treatment was also associated with markedly higher odds of CHE. One possible explanation is that patients may initially try to manage illness on their own in order to avoid immediate care costs, especially in resource-constrained and remote settings. However, delayed formal treatment may allow conditions to worsen and eventually require more intensive and costly care. This pattern is consistent with health-seeking behaviors observed in remote Vietnamese settings. 48 The finding suggests that early diagnosis, timely care-seeking, and stronger primary healthcare outreach may play an important role in reducing financial risk.
Patients treated at provincial hospitals were more likely to experience CHE than those treated at district hospitals. This result is consistent with Lee et al. (2019), who showed that greater use of higher-level health facilities was associated with a higher likelihood of CHE, with an OR of 1.22. 42 One explanation may relate to differences in insurance coverage and treatment-related costs across hospital levels. At the district level, patients with health insurance typically have a co-payment rate of 0%, and shorter travel distances further reduce additional expenses. However, at the provincial level, patients may encounter higher co-payments for treatments not fully covered by health insurance, along with increased indirect costs such as travel, food, and accommodation for accompanying family members. Together, these costs can increase the overall financial burden and heighten the risk of CHE. This finding underscores the financial vulnerability associated with accessing higher-level healthcare services, particularly in contexts where insurance coverage and healthcare costs vary substantially across levels of care.
Among the satisfaction variables, higher satisfaction with the availability and quality of medicines was associated with lower odds of CHE. This finding is consistent with Haakenstad et al. (2022), who suggested that reducing expenditures on medicines purchased from private pharmacies could significantly lower the incidence of CHE in India. 49 These results highlight the importance of medicine availability and perceived quality at healthcare facilities. When medicines are unavailable or perceived as low quality, patients may purchase them out of pocket from external sources or outside the scope of insurance coverage. In Vietnam, where medicine prices can exceed international averages and self-medication accounts for a notable share of OOP health expenditures (up to 35%), 50 these dynamics may further increase the financial burden on patients.
This study has several limitations that should be considered when interpreting the findings. First, the cross-sectional design does not permit causal interpretation, and the hospital-based sample from five provinces may limit generalizability, particularly to patients using private facilities or those not seeking care. In addition, reverse causality cannot be ruled out, especially for patient satisfaction and self-treatment variables, which may both influence and be influenced by financial burden. Second, the measurement of OOP spending relied on patient self-reports over the past 12 months, which may be subject to recall bias, particularly for outpatient visits and medication costs. This may have resulted in under- or over-reporting of healthcare expenditures and, consequently, may have affected the precision of the CHE estimates. Only direct medical costs were included, while indirect costs such as transportation, accommodation, caregiver expenses, and lost income were excluded. As a result, the incidence of CHE may have been underestimated, particularly in geographically isolated and mountainous areas. In addition, inpatient and outpatient expenditures were aggregated into a single annual measure; while consistent with standard CHE measurement, this aggregation may obscure differences in their respective contributions to financial risk. Third, because refusals or ineligible cases were replaced by the next eligible patient within the same sampling stratum, some potential for selection bias may remain. Fourth, medicine-related variables were captured through patient satisfaction measures rather than objective assessments of drug prices or stock availability, and face-to-face interviews may have introduced response bias. Despite these limitations, this study provides valuable patient-level evidence on the determinants of CHE in a disadvantaged region of Vietnam and offers insights that may be relevant for other low- and middle-income countries or settings with similar health system characteristics. Future studies using longitudinal or panel data would strengthen causal inference by clarifying the temporal ordering between predictors and CHE and by tracking changes in healthcare use and financial burden over time. Additionally, incorporating qualitative methods (such as in-depth interviews) could provide deeper insights into patient coping strategies and the specific reasons behind self-medication behaviors.
5. Conclusion
The study identified the factors influencing CHE among patients visiting medical facilities in the Northern Midlands and Mountainous areas. The results showed that older age, male gender, greater distance to health facilities, cancer, hemodialysis, more inpatient visits, self-treatment, and treatment at provincial hospitals were associated with higher odds of CHE. By contrast, the study found that certain variables were associated with lower odds of CHE, including being of Kinh ethnicity, higher household income, having health insurance, and greater satisfaction with the availability of drugs, and satisfaction with the quality of prescribed drugs.
Based on the findings of the study, several recommendations can be made to mitigate the risk of CHE for patients in the Northern Midlands and Mountainous areas. First, strengthening financial protection remains essential, particularly through expanding effective health insurance coverage for vulnerable households. Second, because self-treatment and intensive healthcare use were associated with greater financial risk, strengthening primary healthcare, preventive care, and early management of chronic conditions is important to encourage timely use of formal services. Third, improving both the availability of essential medicines and the quality of prescribed drugs at public hospitals may help reduce additional OOP spending. Finally, the effect of distance to health facilities highlights the importance of geographic access in shaping CHE risk. Improving the functional capacity and service quality of district hospitals may reduce referrals to higher-level facilities and help lower the risk of CHE, especially in remote and mountainous areas.
Footnotes
Acknowledgement
We gratefully thank the Ministry of Education and Training of Vietnam, Thai Nguyen University (TNU), and Thai Nguyen University of Economics and Business Administration for their support in facilitating this research.
Ethical considerations
The research protocol was reviewed and approved for scientific and ethical compliance by Thai Nguyen University of Economics and Business Administration, Vietnam, as documented in the university’s official approval letter (Approval No. 68/ĐHKT&QTKD-KHCN, dated 21 May 2021). Participation was entirely voluntary, and written informed consent was obtained from all participants prior to data collection.
Author contributions
Thuong Nguyen Thi Thu was responsible for conceptualization, formal analysis, data curation, writing – original draft, and writing – review & editing. Linh Dinh Hong contributed to data curation, supervision, and validation. Nhu Dinh Vien was in charge of methodology, data curation, and visualization.
Funding
The authors received no financial support for the research, authorship, and/or publication of this article.
Declaration of conflicting interests
The authors declared no potential conflicts of interest with respect to the research, authorship, and/or publication of this article.
Data Availability Statement
Data are available upon request from the corresponding author.
Appendix
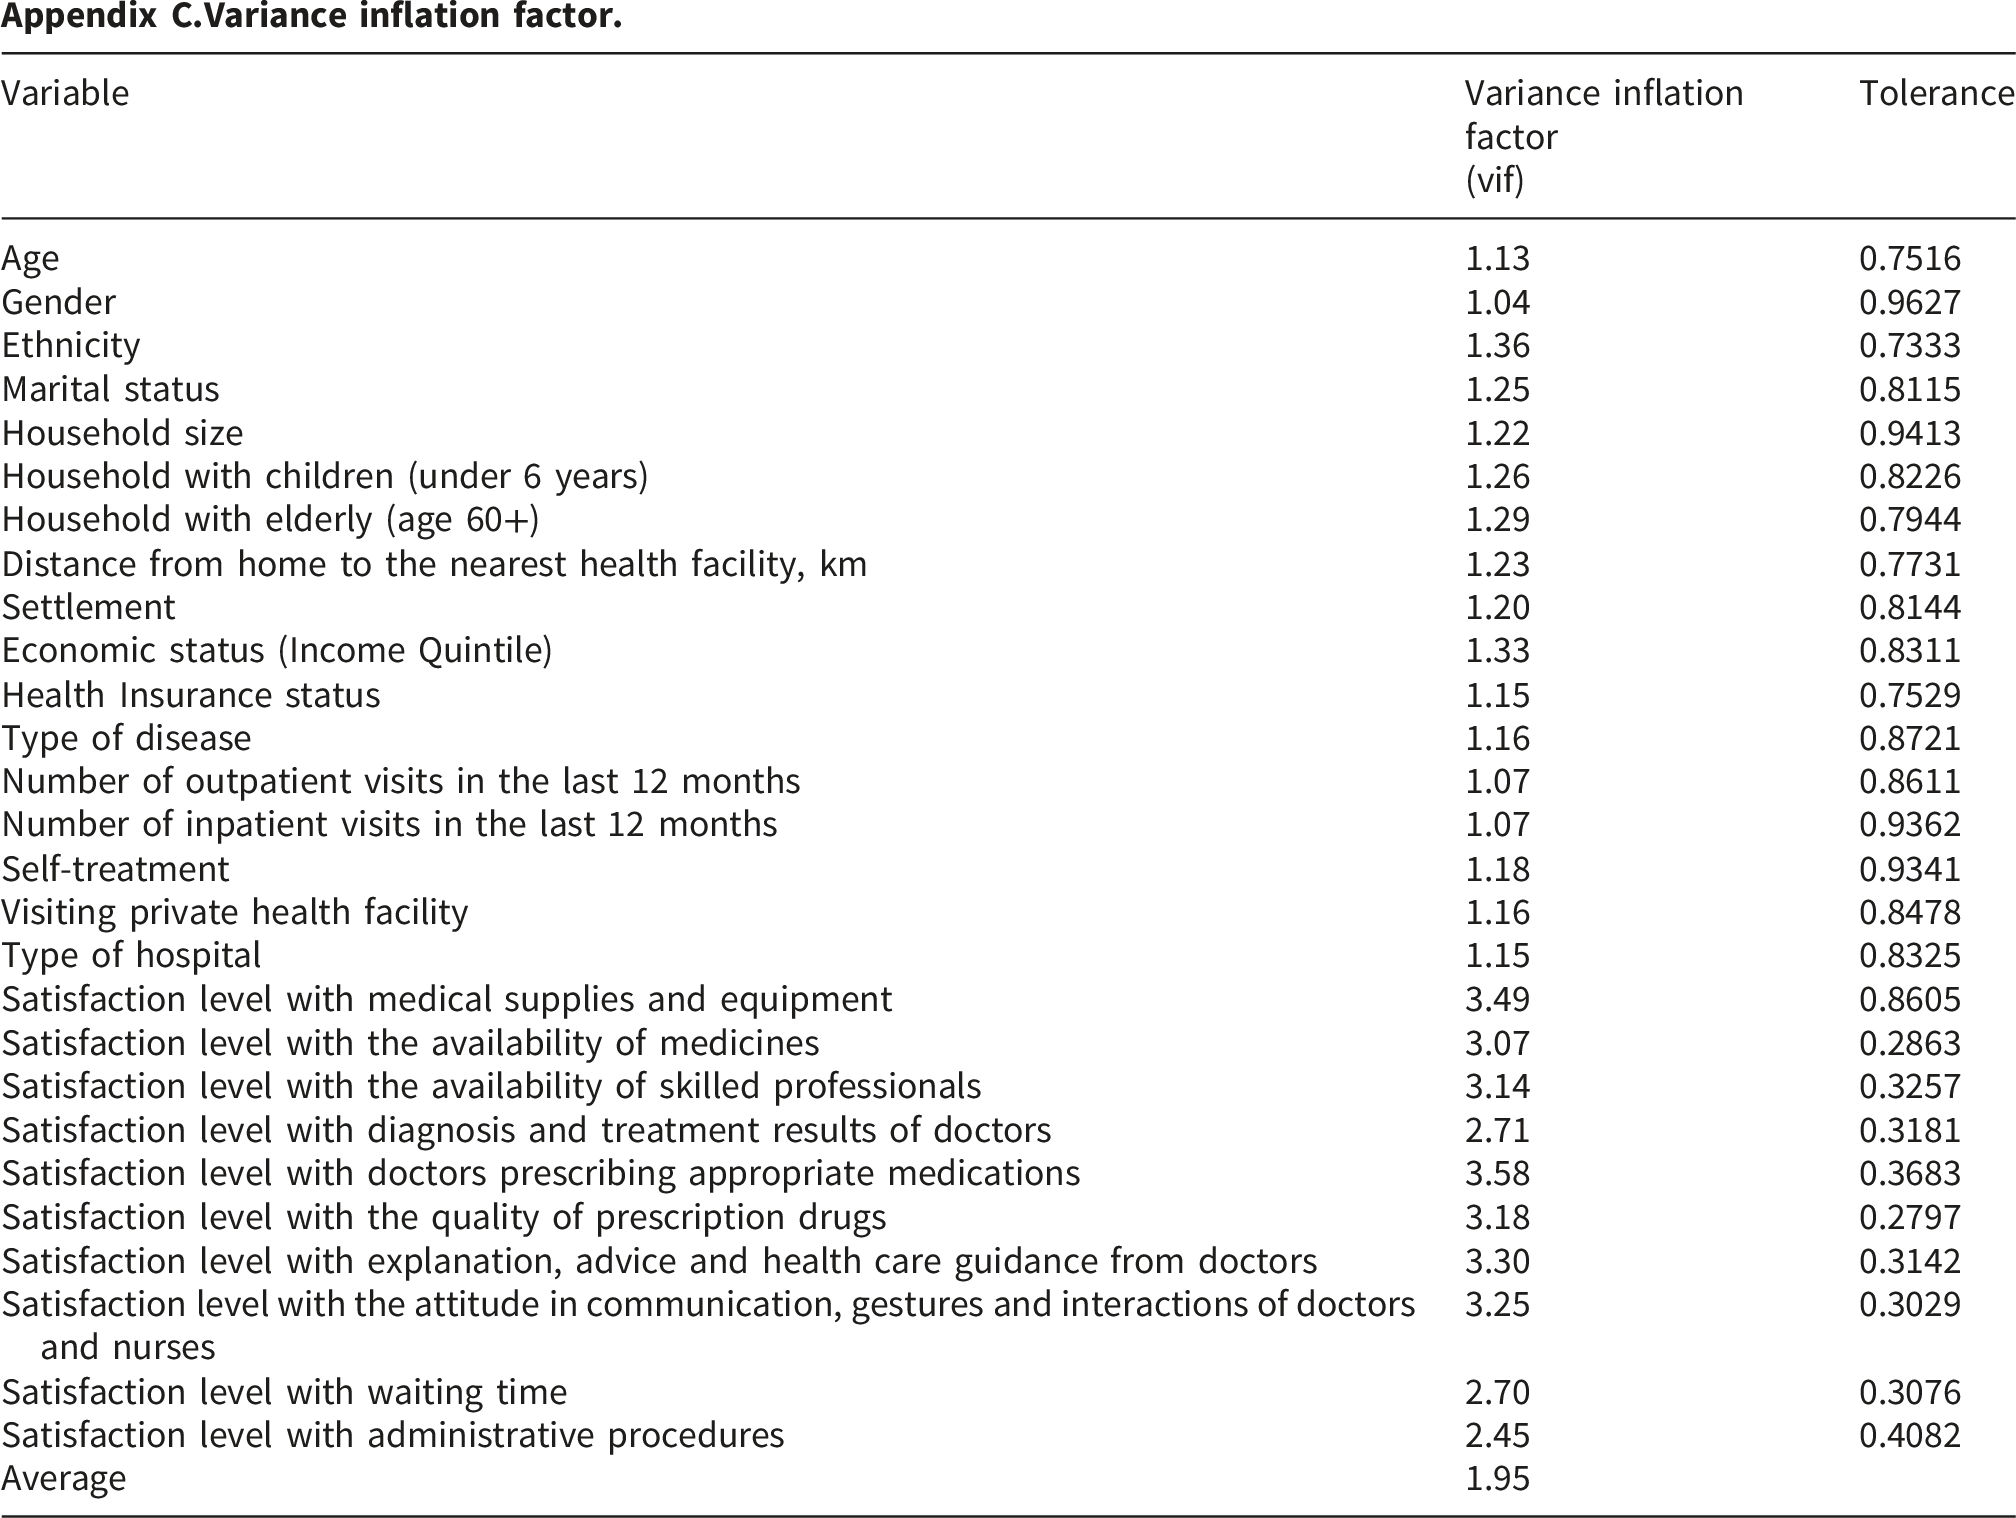
Measurement scale for patient satisfaction. The satisfaction scale comprises 10 items adapted from the conceptual dimensions of Kumara and Samaratunge (2016) and the empirical determinants identified by Akthar et al. (2023). Items were measured on a 5-point Likert scale (1 = Very Dissatisfied to 5 = Very Satisfied). Descriptive statistics for patient satisfaction indicators by catastrophic health expenditure status. Variance inflation factor.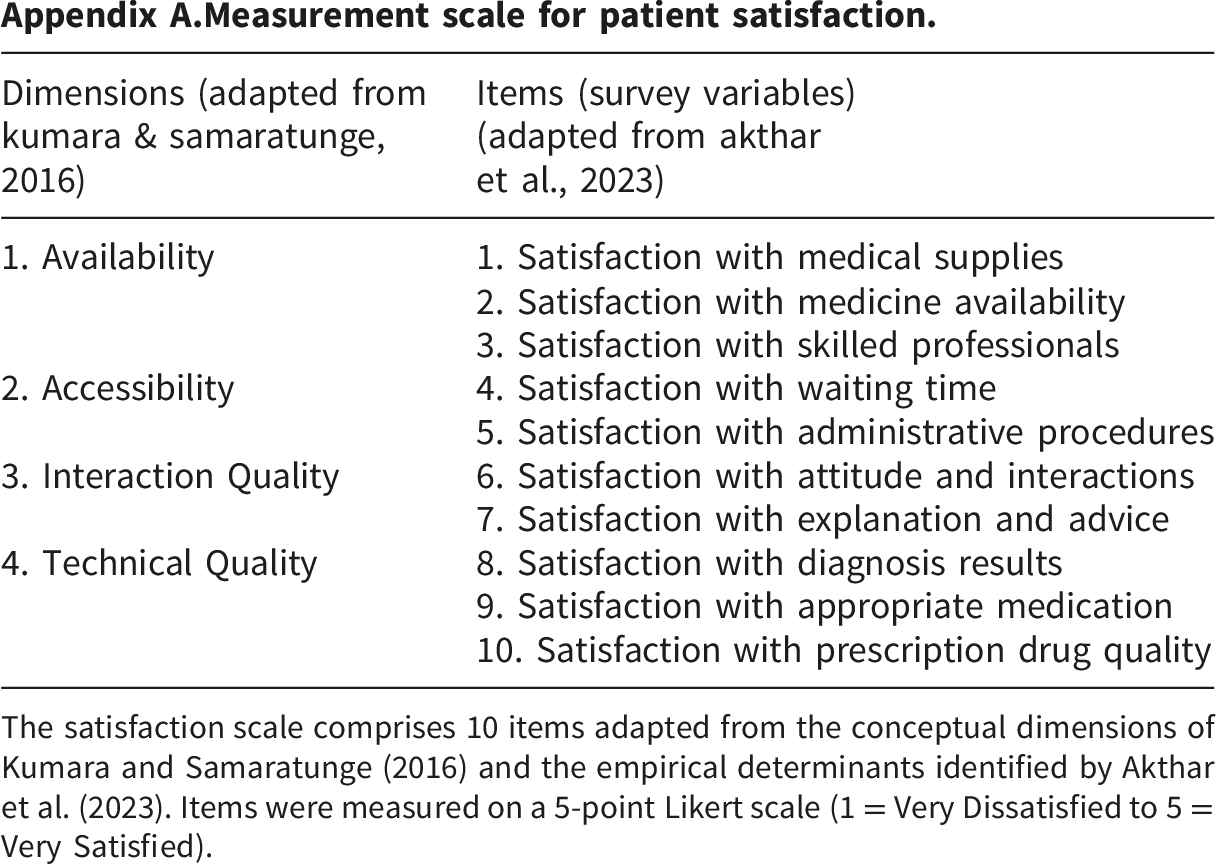
Dimensions (adapted from kumara & samaratunge, 2016)
Items (survey variables) (adapted from akthar et al., 2023)
1. Availability
1. Satisfaction with medical supplies
2. Satisfaction with medicine availability
3. Satisfaction with skilled professionals
2. Accessibility
4. Satisfaction with waiting time
5. Satisfaction with administrative procedures
3. Interaction Quality
6. Satisfaction with attitude and interactions
7. Satisfaction with explanation and advice
4. Technical Quality
8. Satisfaction with diagnosis results
9. Satisfaction with appropriate medication
10. Satisfaction with prescription drug quality
Total (n =706)
CHE=1 (n=147)
CHE=0 (n=559)
p-Value
Satisfaction level with medical supplies and equipment
4.18
4.25
4.17
0.192
Satisfaction level with the availability of medicines
4.10
4.10
4.10
0.972
Satisfaction level with the availability of skilled professionals
4.21
4.28
4.19
0.164
Satisfaction level with diagnosis and treatment results of doctors
4.16
4.25
4.13
0.055
Satisfaction level with doctors prescribing appropriate medications
4.15
4.21
4.13
0.188
Satisfaction level with the quality of prescription drugs
4.19
4.22
4.19
0.615
Satisfaction level with explanation, advice and health care guidance from doctors
4.28
4.30
4.27
0.629
Satisfaction level with the attitude in communication, gestures and interactions of doctors and nurses
4.29
4.32
4.28
0.517
Satisfaction level with waiting time
4.15
4.21
4.13
0.240
Satisfaction level with administrative procedures
4.15
4.26
4.12
0.029
Variable
Variance inflation factor (vif)
Tolerance
Age
1.13
0.7516
Gender
1.04
0.9627
Ethnicity
1.36
0.7333
Marital status
1.25
0.8115
Household size
1.22
0.9413
Household with children (under 6 years)
1.26
0.8226
Household with elderly (age 60+)
1.29
0.7944
Distance from home to the nearest health facility, km
1.23
0.7731
Settlement
1.20
0.8144
Economic status (Income Quintile)
1.33
0.8311
Health Insurance status
1.15
0.7529
Type of disease
1.16
0.8721
Number of outpatient visits in the last 12 months
1.07
0.8611
Number of inpatient visits in the last 12 months
1.07
0.9362
Self-treatment
1.18
0.9341
Visiting private health facility
1.16
0.8478
Type of hospital
1.15
0.8325
Satisfaction level with medical supplies and equipment
3.49
0.8605
Satisfaction level with the availability of medicines
3.07
0.2863
Satisfaction level with the availability of skilled professionals
3.14
0.3257
Satisfaction level with diagnosis and treatment results of doctors
2.71
0.3181
Satisfaction level with doctors prescribing appropriate medications
3.58
0.3683
Satisfaction level with the quality of prescription drugs
3.18
0.2797
Satisfaction level with explanation, advice and health care guidance from doctors
3.30
0.3142
Satisfaction level with the attitude in communication, gestures and interactions of doctors and nurses
3.25
0.3029
Satisfaction level with waiting time
2.70
0.3076
Satisfaction level with administrative procedures
2.45
0.4082
Average
1.95