
Abstract
Markowitz’s mean-variance efficiency theory brought tremendous opportunities for portfolio managers, as now they are able to understand deeply the relationship between expected risk and return of the portfolios. Several models were developed based on mean-variance framework, but all of them suffered on account of either parameter estimation problem or psychological biasness in favour of simple portfolio strategies like naïve diversification. Much of the research evidence has proved that naïve diversification has either outperformed or not significantly underperformed as compared to mean-variance framework. In the present study, we compared the mean-variant efficient portfolios with stock portfolios on the basis of naïve diversification for the 15-year period and across all market capitalisation stock sets. Performance-wise naïve diversified portfolios dominated, although not statistically, the mean-variant portfolios especially in mid cap and small cap stock sets. Similar results were obtained for return per unit of risk. The study adds the role played by market capitalisation in already existing literature on naïve diversification.
Introduction
Portfolio composition in the context of portfolio management and performance has always been a subject of study among both researchers and practitioners. In fact, the concept of portfolio formation and composition thereof has developed since the sharing of risk surfaced in human consciousness. Both practitioners and researchers opt for either active or passive strategies in generating portfolio performance. For example, one of the active portfolio strategy deals in return-based momentum strategy that buys recent winner stocks and sells short recent losers (Jegadeesh & Titman, 1993, 2001). The extensive evidence of this strategy in generating positive alpha using either capital asset pricing model or multifactor model has been well documented (for example, see Avramov & Chordia, 2006; Fama & French, 1993; Liu & Zhang, 2008; Sagi & Seasholes, 2007; etc.). The results remain true even after controlling for transaction costs (Korajczyk & Sadka, 2004). Portfolio managers applied different active strategies extensively and this practice gained momentum with the advent of modern portfolio theory (Markowitz, 1952, 1959) which stated that portfolio should strike an optimal balance between expected return and possible risk and further this decision is based on risk preference of the investor. Markowitz’s (1952) mean-variance theory is still practically used in asset allocation and active management strategies (for example, see Grinold & Kahn, 1999; Litterman, 2003; Meucci, 2005 etc.).
Mean-variance framework changed the entire outlook by which investment managers used to see portfolio composition. This led to widespread adoption of this framework and development of large number of its extensions but the true model parameters have to be estimated from data since they are unknown, which leads to estimation error or parameter uncertainty problem thus making the estimated model substantially different from the true optimal one (Tu & Zhou, 2004). Nevertheless, meanvariance framework continued to have considerable importance and significant influence on the portfolio construction strategies.
On the other hand of the spectrum, passive strategies are also widely adopted by the portfolio managers. One of the important and widely followed (Banerjee & Hung, 2013) passive investment strategy is equally weighted stock portfolio commonly known in financial literature as uniform investment strategy or 1/n heuristic or 1/n diversification rule or naïve diversification, etc.
The naïve 1/n diversification is the strategy in which a fraction 1/n of wealth is allocated to each of the N assets available for investment. In comparison, meanvariance framework suggests giving more weight to those assets that contribute to higher mean-variance efficiency. In addition, 1/n diversification strategy is easy in implementation and there is no requirement of estimation of moments of asset returns.
The subject of naïve diversification strategy gained parallel importance particularly for two reasons—first, much of the research evidence has demonstrated that it is difficult to outperform naïve diversification as an investment strategy and second, evidences from the field of behavioural finance experiments have shown that naïve diversification strategy is applied by many agents in different situations. This may be attributed to inherent psychological biasness or may be due to some inherent uncertainty in the decision model (like mean-variance framework) which may make naïve diversification strategy as a rational decision to undertake. The latter may be followed more by risk-averse investors as they face model uncertainty (Pflug, Pichler & Wozabal, 2012) who have argued that if the true model remains ambiguous, homogeneous distribution strategy may outperform more sophisticated strategies.
Several studies have demonstrated that 1/n diversification strategy actually outperforms or at least does not significantly underperform mean-variance framework (for example, see Bloomfield, Leftwich & Long, 1977; Brown, 1976; Jobson & Korkie, 1980; Jorion, 1991 etc.) and this is true especially in out-of-sample tests. To the extent, Michaud (1998) further noted that ‘an equally weighted portfolio may often be substantially closer to the true mean-variance optimality than an optimized portfolio’. This is mainly attributed to estimation error in the optimal portfolio strategy as in the optimal portfolio strategy, large history of returns is required to obtain an accurate estimate of expected returns (Merton, 1980) or estimation of variance–covariance matrix in optimal portfolio strategy is poorly estimated (for example, see Green & Hollifield, 1992; Jagannathan & Ma, 2003 etc.). Because of these estimation errors, extreme weights that fluctuate heavily over time are produced in the optimal portfolio strategy, which leads to poor out-of-sample performance. To reduce this estimation error, several researchers have introduced various extensions of Markowitz’s model 1 with the goal of improving mean-variance efficiency. The considerable effort put within various models to improve mean-variance framework still suffered from the weakness of not outperforming 1/n diversification strategy (DeMiguel, Garlappi, Nogales & Uppal, 2009a). The results are true for both the individual stocks and diversified portfolios (Brown, Hwang & In, 2013) and the outperformance of naïve diversification strategy is mainly attributed not only to the estimation errors in optimal portfolio strategy but also to the increased tail risk in naïve diversification strategy due to increase in the number of stocks (Brown et al., 2013). Researchers also combined theory-based models of mean-variance framework with non-theory-based models of 1/n heuristic (Tu & Zhou, 2011) based on the ideas of combining portfolio strategies as given by Brandt, Santa-Clara and Valkanov (2009). The authors have found that the combination strategies work better in comparison to either mean-variance framework strategy or 1/n heuristic.
The interest in naïve diversification strategy further developed from the research paper of DeMiguel, Garlappi and Uppal (2009b) who used 1/n strategy as a benchmark in rolling performance setting and compared the returns of naïve diversification strategy with several portfolio optimisation strategies, primarily Markowitz’s meanvariance framework and its several extensions. The results pointed towards outperformance of 1/n rule as compared to other strategies in the study. Similar results were evident from the studies performed by several other researchers (for example, see Chan, Karceski & Lakonishok, 1999; Jagannathan & Ma, 2003 etc.). As a result of this observation, several researchers have incorporated this result in their portfolio selection framework (for example, see DeMiguel et al., 2009a; Tu & Zhou, 2011 etc.).
In several studies involving behavioural experimental studies, respondents or investors have shown natural psychological bias towards 1/n strategy (for example, see Benartzi & Thaler, 2001; Huberman & Jiang, 2006 etc.) as significant percentage of investors use 1/n rule in selecting their choices among financial assets. This decision making can be interpreted as a cognitive bias in the behavioural context (see Kahneman, 2003; Tversky & Kahneman, 1981 etc.). Similar studies using alternative names of naïve diversification like diversification heuristic, variety seeking and diversification bias arrive at similar conclusions. The findings are true for both the set-ups involving multiple decisions on future consumption (Simonson, 1990) and simultaneous decisions on future consumption (for example, see Read & Loewenstein, 1995; Simonson & Winer, 1992 etc.).
As mentioned before, the choice of naïve diversification follows from two main cited reasons—inherent psychological biasness and/or presence of some inherent uncertainty about decision making. Although a rational investor diversifies by making portfolio of assets with uncertain returns to minimise his risk, the exact distribution of expected returns is not exactly known to him. So in addition to uncertainty of returns, there is an additional layer of model uncertainty (referred to as an ambiguity 2 ). Researchers have cited this ambiguity as a reason to follow 1/n heuristic rule (for example, see DeMiguel et al., 2009a; Simonson, 1990 etc.). Given the available information, investor deals with this ambiguity by adopting worst-case risk minimisation under all plausible distributions or ambiguity set (Ben-Tal, Ghaoui & Nemirovski, 2009) and under these circumstances, evidence from the field of mathematical statistics or operational research sciences 3 shows that optimal decisions approach portfolio which follows 1/n rule as quantum of uncertainty or ambiguity in the alternative model increases.
Research Methodology
In order to achieve the objectives of the study, secondary data were collected. The population of the study consisted of all the stocks listed on National Stock Exchange (NSE) and Bombay Stock Exchange (BSE). The sample of the study was chosen from stocks belonging to NSE Nifty index (representative of large cap stocks), from NSE Nifty Midcap 50 index (representative of mid cap stocks) and from BSE Small Cap index (representative of small cap stocks). At the time of the study, NSE Nifty and NSE Nifty Midcap 50 indices consisted of 50 stocks each and BSE Small Cap index consisted of 483 stocks. Out of each selected index, 10 stocks were selected randomly to form the sample of the study. Monthly opening and closing stock prices were collected for the sample of 30 stocks from the period starting from 1 January 1998 to 31 December 2013. The prices were collected from
Monthly returns for the 15-year period for each stock in the sample were calculated using opening price of the month as the beginning value and closing price of the month as the ending value. The data collected for the year 1998 and subsequently the monthly returns were used as the input for calculating the weights of the efficient frontier 4 for the year 1999. Such calculations were rolled over, as an example, for the construction of portfolios in 2000; the monthly returns of the year 1999 were taken for calculating the weights of the efficient frontier.
For the calculation of efficient frontier, covariance 5 matrix was formed. The equally weighted portfolio was used as a benchmark against which efficient portfolios were evaluated. Initially, the variance of the portfolio was calculated for the equally weighted portfolio. Using Excel Solver, the variance of this portfolio was minimised. Solver made use of three constraints namely sum of weights of the portfolio (equal to 1.0), equality of portfolio return with the mean target return and individual weights of the portfolio components greater than 0. Using these constraints, Excel Solver calculated the varying weights of the portfolio components and this formed the basis of efficient frontier. This portfolio thus formed after optimisation was mean-variant portfolio with the same mean return but having different weights of portfolio components.
Thus at the start of each year, two portfolios were formed from each index. One of the portfolios was based on mean-variance framework, using efficient frontier and based on past year’s data. The other portfolio was based on 1/n heuristic where each of the components of the portfolio had the weight of 1/10th.Two portfolios in such a way were compared with each other for their performance on monthly basis for the year under consideration. The monthly return performance of the two constructed portfolios was compared using ‘t test’. The null hypothesis for the study is that there is no significant difference between the return of the portfolio based on mean-variance framework and return of the portfolio based on 1/n heuristic. The results 6 of the same have been depicted using p-values.
Results and Discussion
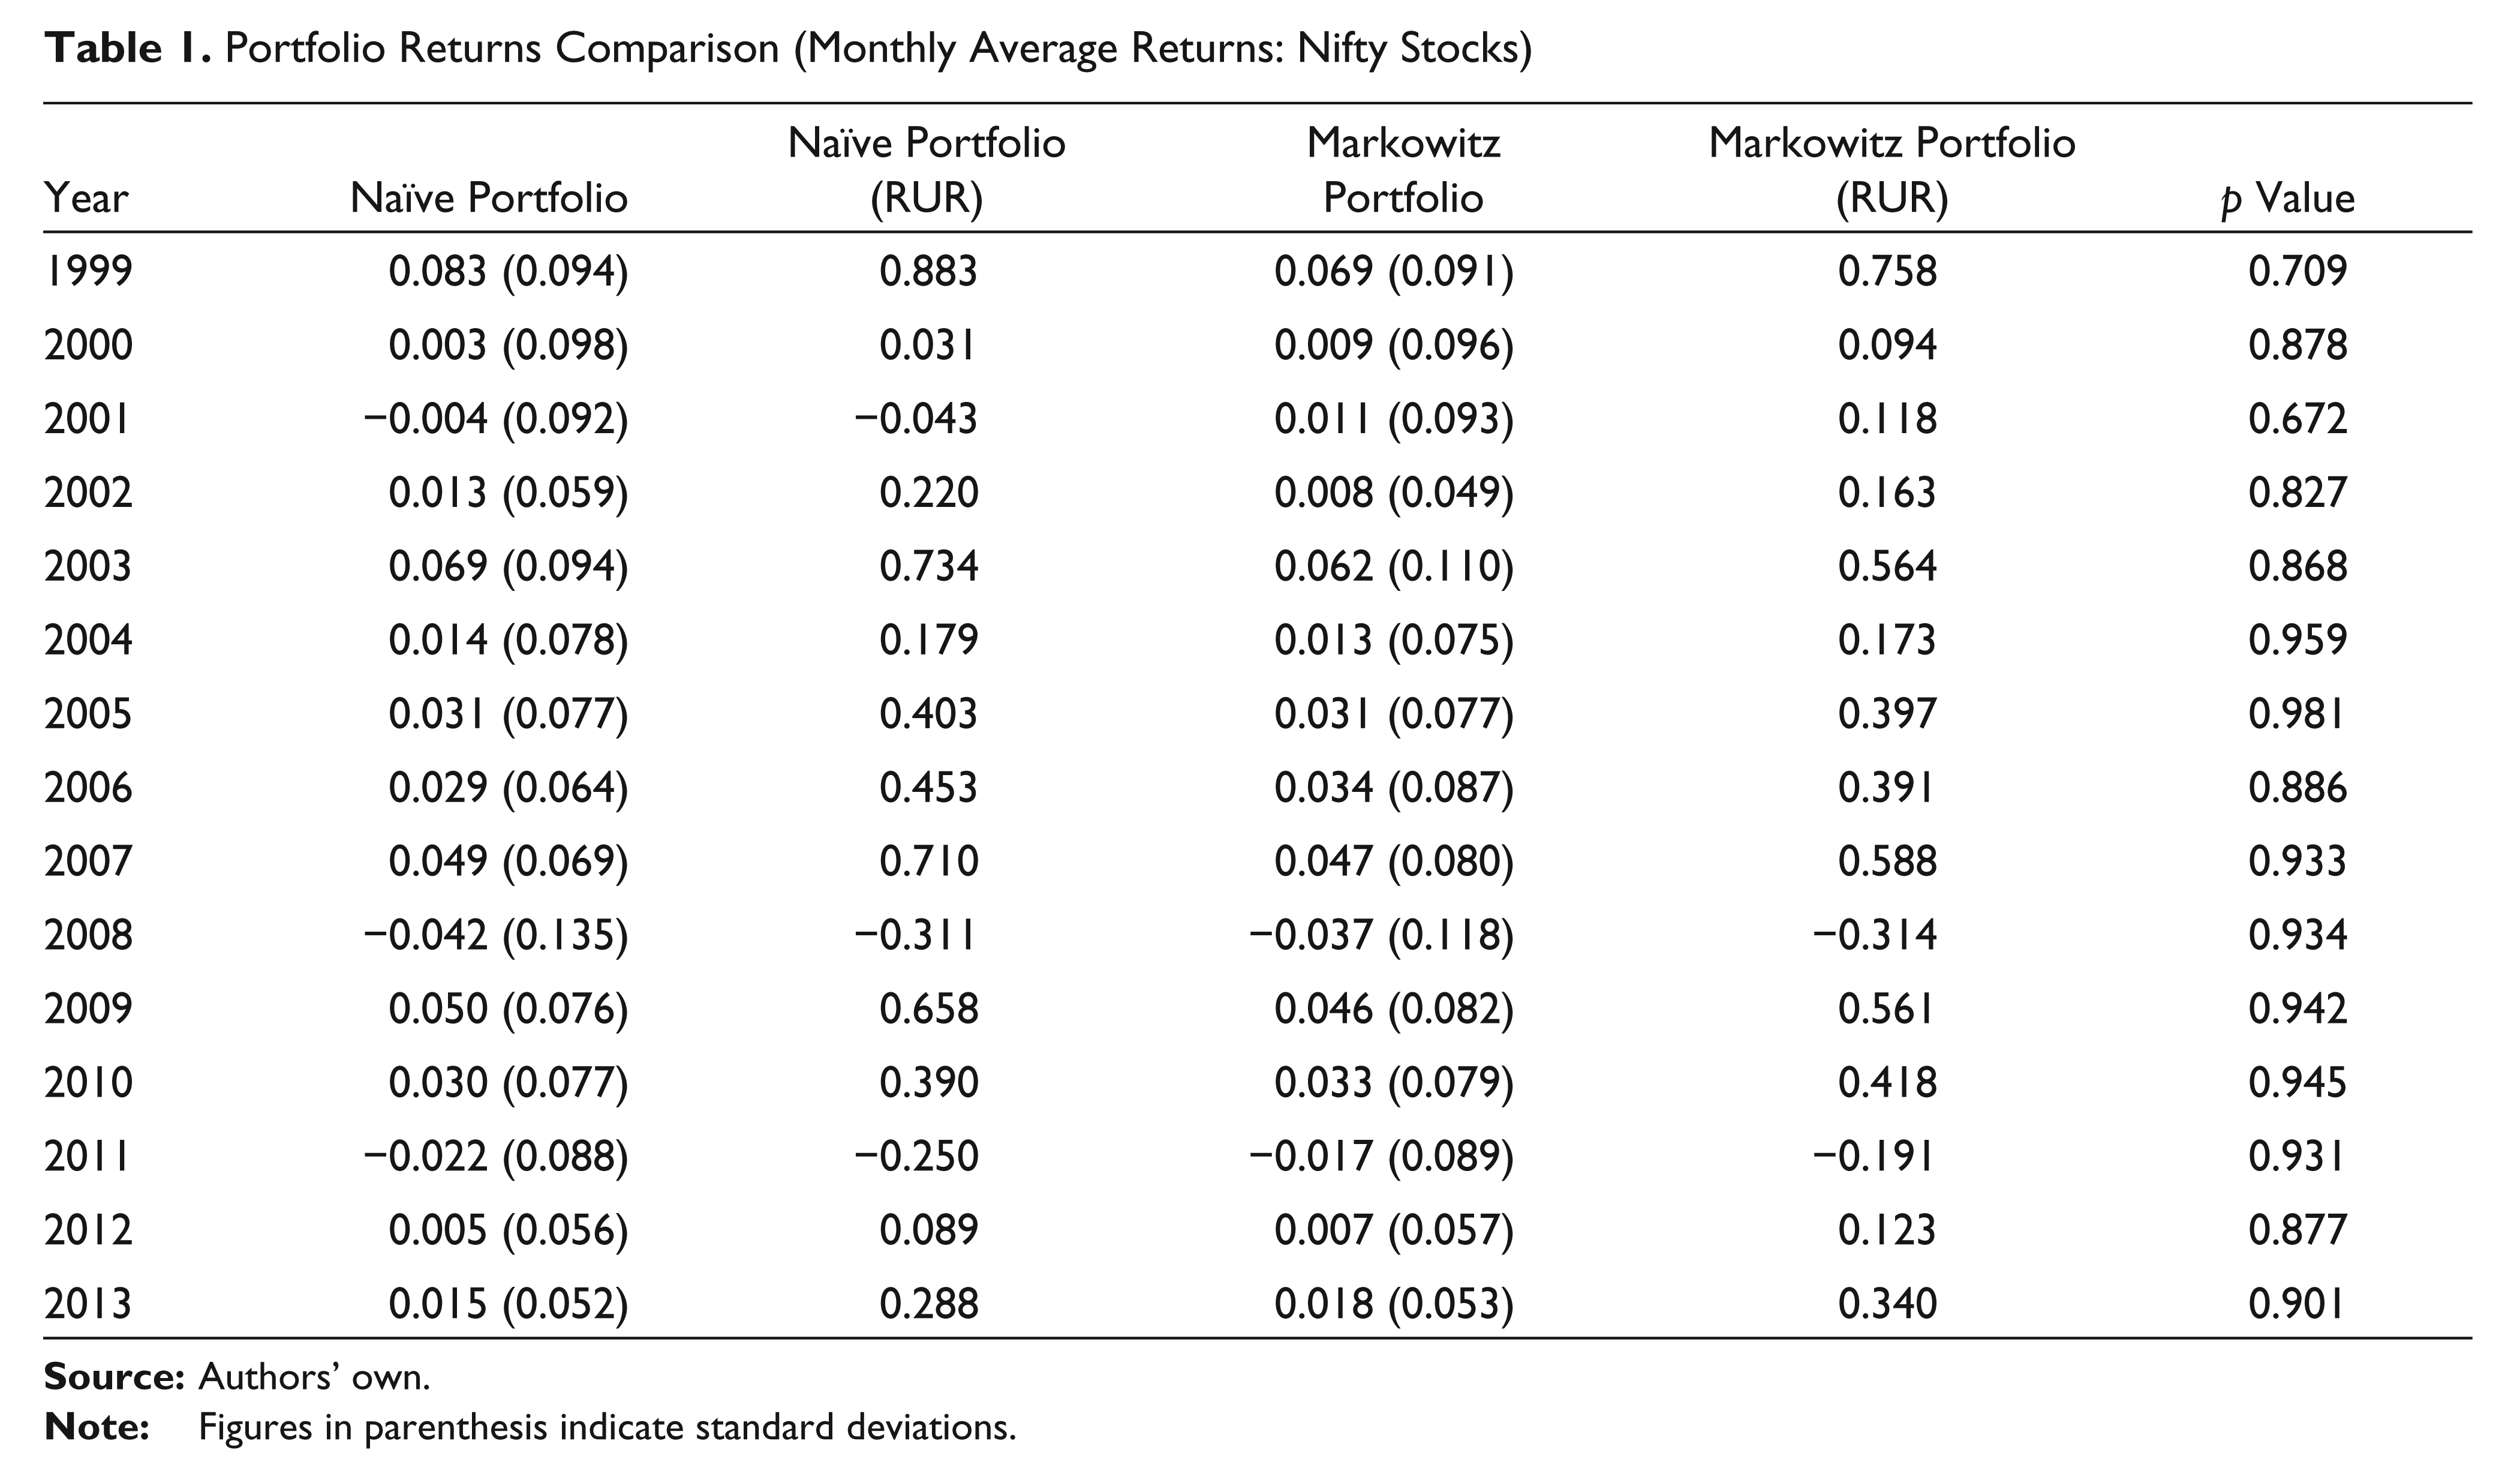
Table 1 reflects the year-wise comparison of monthly average return of two portfolios based on mean-variance framework and 1/n heuristic (naïve diversification) for the large cap stocks from Nifty index. Out of 15 years, for 8 years (53.3 per cent), portfolio based on meanvariance framework dominated the portfolio based on 1/n heuristic. For year 2005, no difference in the returns was found between the two portfolios and during the rest of the 6 years, the portfolio based on naïve diversification dominated the other portfolio on the basis of the return. The comparison on the basis of return per unit of risk (RUR) was different as for 9 years (60.0 per cent), the portfolios based on mean-variance framework dominated the portfolios based on naïve diversification. Statistically at 5 per cent level of significance, no difference was found between the returns of naïve portfolios and returns of Markowitz portfolios for any year during the 15-year study period.
Table 2 reflects the year-wise comparison of monthly average returns of two portfolios based on mean-variance framework and 1/n heuristic (naïve diversification) for the mid cap stocks from Nifty Midcap 50 index. Out of 15 years, for 12 years (80.0 per cent), portfolio based on 1/n heuristic or naïve diversification dominated the portfolio based on mean-variance framework. The comparison on the basis of RUR was almost identical as for 11 years (73.3 per cent), the equally weighted portfolios based on 1/n heuristic dominated the portfolios based on mean-variance framework. Statistically at 5 per cent level of significance, no difference was found between the returns of naïve portfolios and returns of Markowitz portfolios for any year during the 15-year study period.
Portfolio Returns Comparison (Monthly Average Returns: Nifty Stocks)
Portfolio Returns Comparison (Monthly Average Returns: Nifty Midcap Stocks)
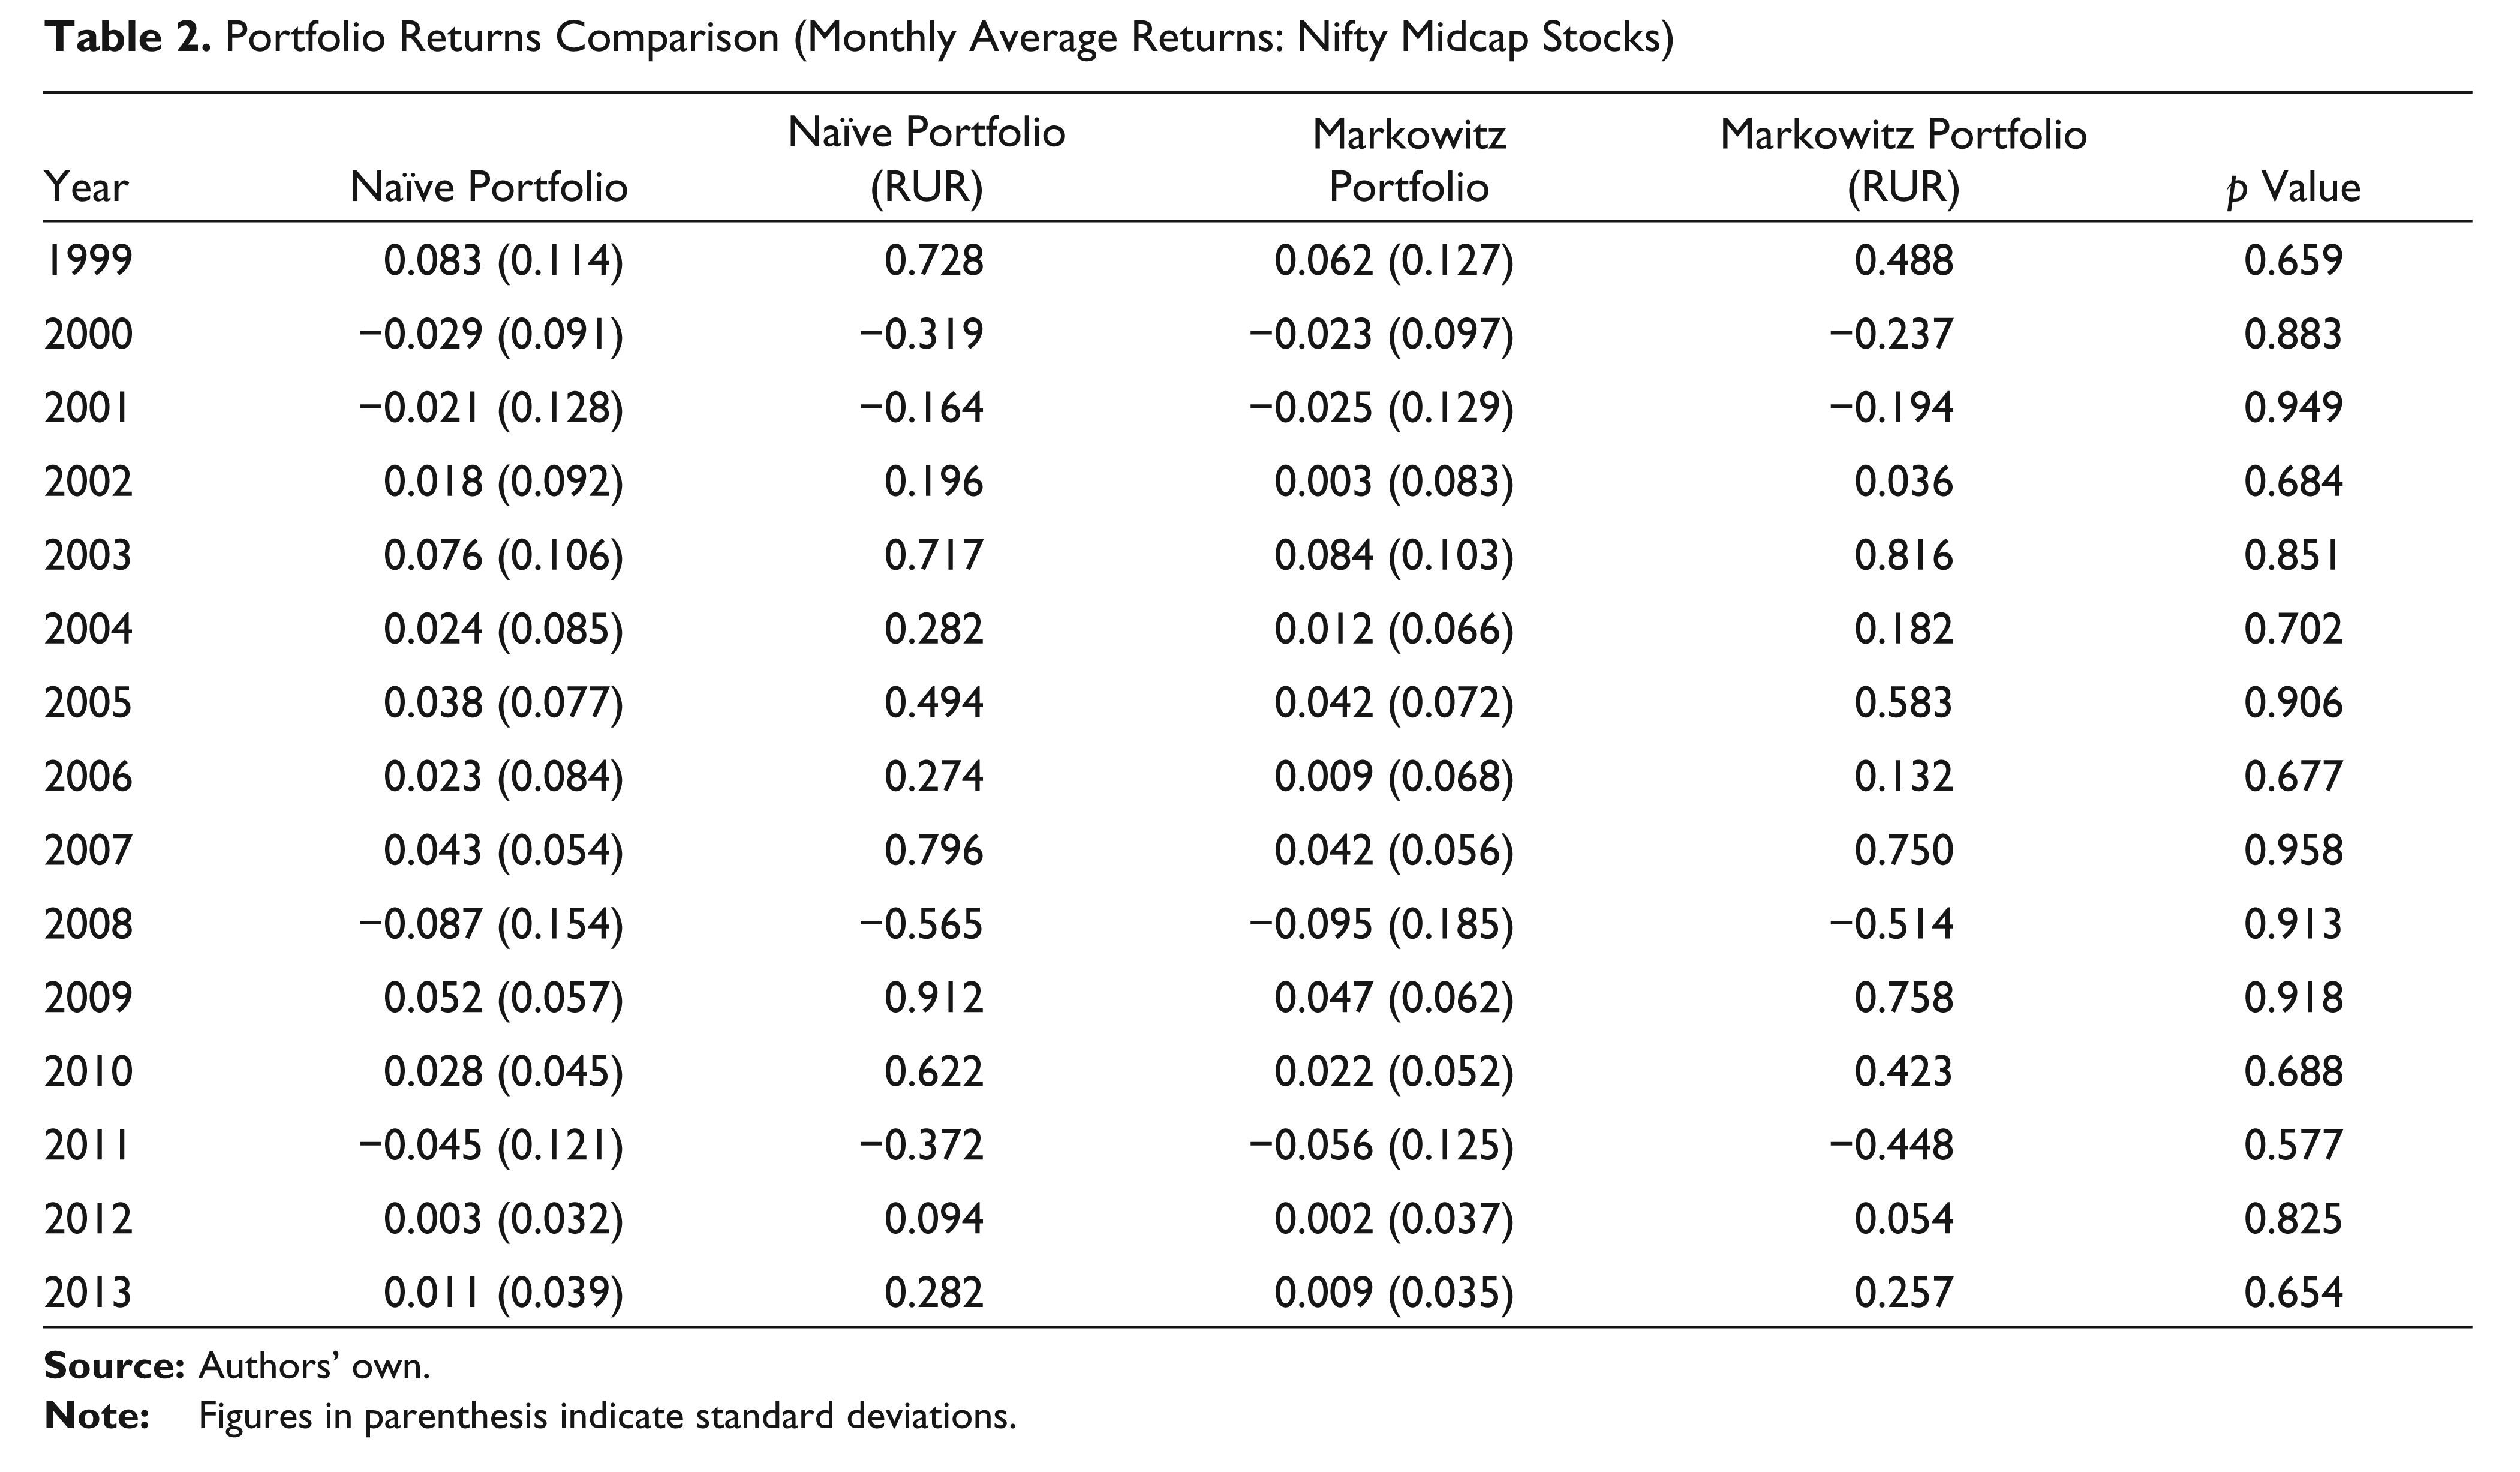
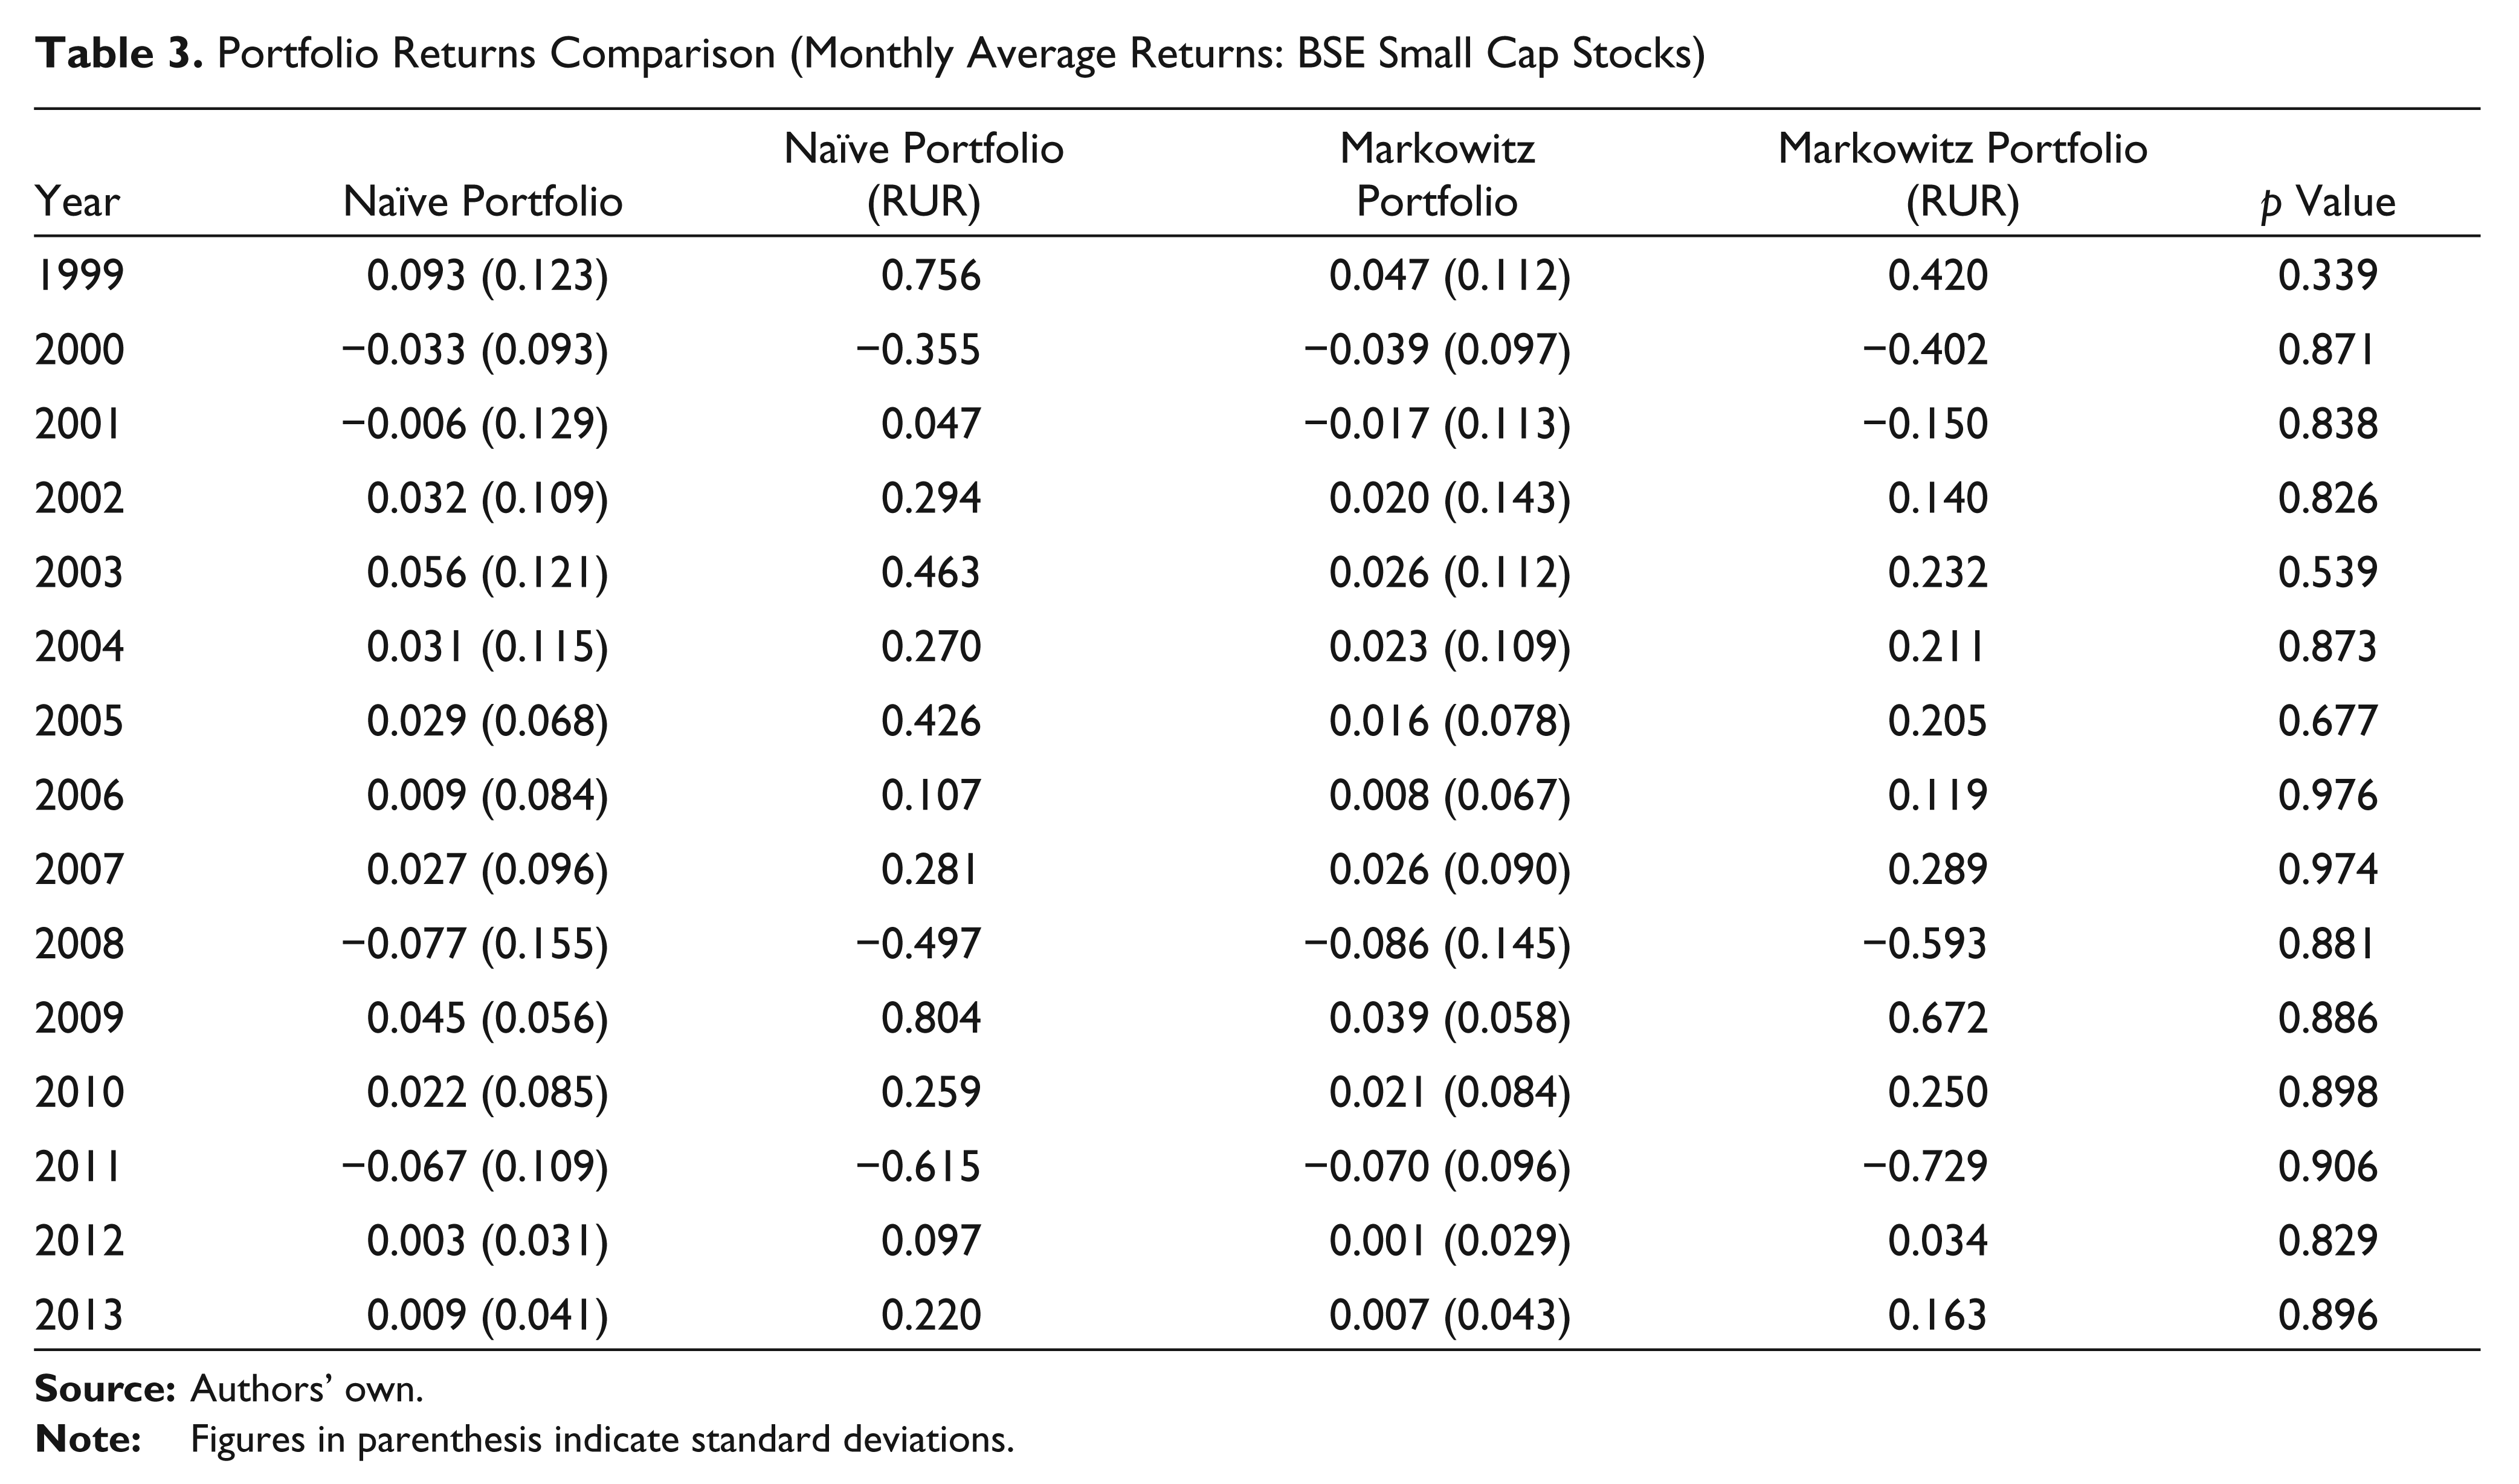
Table 3 reflects the year-wise comparison of monthly average returns of two portfolios based on mean-variance framework and 1/n heuristic (naïve diversification) including the small cap stocks from BSE Small Cap index. For all 15 years, portfolio based on 1/n heuristic or naïve diversification dominated the portfolio based on meanvariance framework. The comparison on the basis of RUR was almost identical as for 13 years (86.6 per cent), the equally weighted portfolios based on 1/n heuristic dominated the portfolios based on mean-variance framework. Even after complete dominance, no statistical significant difference at 5 per cent level of significance was found between the returns of naïve portfolios and returns of Markowitz portfolios for any year during the 15-year study period.
Portfolio Returns Comparison (Monthly Average Returns: BSE Small Cap Stocks)
If we combine all the three indices, in 34 out of 45 comparisons (75.5 per cent) although portfolios based on naïve diversification dominated portfolios based on mean-variant framework, yet no statistical significant difference was seen in the comparisons. Similar results were also observed for RUR.
Conclusion
The present study assessed the relative performance of the portfolios designed on principles of naïve diversification with the portfolios designed on the basis of mean-variance framework. Mean-variant portfolios were designed on the basis of efficient frontier weights, calculated using past year’s performance. Once the weights were calculated, portfolios were constructed and these were compared with the equally weighted portfolios. Comparisons were made for a 15-year period starting from 1999 to 2013 and across three capitalisation (large, mid and small) set of stocks. Although for mid and small cap stocks portfolios based on 1/n heuristic dominated portfolios based on mean-variant framework, no statistically significant differences were found. Similar results were obtained for RUR. This reiterates the pervious findings made by several researchers in favour of comparatively better performance by portfolios based on naïve diversification as compared to the portfolios based on mean-variant framework. The study further adds that comparatively better performance of portfolios based on naïve diversification becomes more evident when one goes from large to small cap stock portfolio.