
Abstract
Recently, many organisations have recognised that development of supplier and buyer relationship improvement is becoming necessary to establish strong and mutually beneficial long-term relationships in improving performance across the supply chain, generating greater cost efficiency and enabling the business to grow and develop. The current study proposes a framework for buyer–supplier relationship improvement (BSRI) strategy and tests the same using structural equation modelling (SEM). Result indicates that BSRI can be improved under the condition of supplier development practices (SDP) and buyer–supplier relationship practices (BSRP). SDP are further driven by productive measure (PM) and competitive pressure (CP), whereas the impact of customer uncertainty (CU) turned out insignificant. The study results demonstrate that profitability (PR) can be improved by achieving competitive advantages (CA) through BSRI. CA includes operational effectiveness, innovation (INV), technology adaption (TAD) and risk minimisation (RIM). A survey response of 512 different manufacturing firms of India was used for data analysis. Initially, exploratory factor analysis (EFA) is performed for exploring the factor followed by confirmatory factor analysis (CFA), for confirmation and construct validity. Findings from the study revealed that linking of SDP with BSRI is necessary from buyer side along with consideration of supplier’s perspective to achieve CA, which will lead towards enhanced PR.
Keywords
Introduction
Nowadays, to remain competitive in the market, it is necessary for buyer to develop its supplier base and make it self-efficient, which can be achieved by developing the supplier base, continuously (Hahn, Watts, & Kim, 1990; Li et al., 2007). Traditional approaches of focusing on quality and cost have been limited within an enterprise for being competitive due to increasing competition. Continuous efforts for supplier development along with cooperation with suppliers will not only develop the supplier base but will also increase the commitment and trust (TR) resulting in long-term relationship, which will contribute to make supplier more efficient and thus enable goods to be purchased at lower prices, simultaneously allowing buyer to focus on their core competencies to remain competitive (Lau, 2011; Routroy & Pradhan, 2014). The focus of supplier develop-ment and relationship improvement is towards the improve-ment in performance with respect to improved cost, quality, delivery time and building long-term relationship that will lead to achieve CA and PR (Li et al., 2007) and that is the reason SDP and BSRP are emerging as significant factors for a firm to remain competitive and to improve the performance of supply chain (Aslan et al., 2011; Lee et al., 2013).
Review of Literature
With the ever-increasing demand of products, a buyer can either outsource the product or can manufacture it in-house. Mostly, in such situation buyers opt for outsourcing the product which is beneficial for them, but there is always risk associated with it in terms of the quality of the product from the supplier. To improve the quality of product and other parameters such as cost and delivery time, it is necessary to have efficient and capable supplier. The capability of supplier with the above-mentioned parameters can be strongly influenced by implementing appropriate SDP. The first step towards development of supplier is evaluation of supplier and providing necessary training, wherever it is required for improvement in the performance. Mostly supplier development is categorised as indirect/shortterm supplier development which focuses on short-term goals and the required changes such as direct/long-term supplier development focuses on improvement of supplier capabilities (Aslan et al., 2011). Further, as the customers are demanding divergent product with change in demand continuously, it is necessary to make supply chain both responsive and efficient which can be achieved through supplier development (Rosell, Lakemond, & Wasti, 2014; Routroy & Pradhan, 2014). First seven factors that deal with SDP and last three factors that deal with BSRP are discussed briefly in the subsequent subsections.
Factors Identification
Supplier Evaluation (SE)
SE is the first step towards supplier development. It is expected from buyer to have different sets of parameters for proper evaluation of supplier based on the type and complexity of the product. After doing a systematic evaluation of supplier, buyer can identify the weak areas of supplier where improvement is essential. Evaluation of supplier helps to find the exact cause of problem, that is, whether the problem is in selection of material or in manufacturing process or in design or in handling of machines and tool or in workmanship (Cormican & Cunningham, 2007; Krause, Handfield, & Tyler, 2007). Continuous evaluation of the supplier base helps them to identify their weak areas and to sharpen the performance, leading to make product as more competitive (Hald & Ellegaard, 2011).
Training and Education (TE)
Systematic and continuous evaluation of the supplier base will lead to identify the necessary improvement factors of supplier. For an example, supplier may need training in setting of process control parameters or quality check parameters or standard operating procedure, etc. This will lead to trace out which type of TE is necessary for a respective supplier lacking in a respective area and such identified type of training could then lead to increase in performance of the supplier (Modi & Mabert, 2007). Such type of TE programmes require assistance from buyer to improve the capabilities of supplier in a respective area. It is observed that such trainings are more beneficial to improve the technical knowledge and capabilities of supplier, which is primarily important to make buyer more competent (Kadir, Tam, & Ali, 2011).
Reward (RE)
After proper evaluation of suppliers, it is essential to recognise efficiently performing suppliers by giving REs to them. Such an activity can serve as an incentive for improved supplier performance (Krause et al., 2007). Such incentives and awards develop a positive working attitude in suppliers and they work for betterment in their performance continuously. Such practices will encourage the supplier to maintain the momentum of continuous improvement in performance and its implementation. Further, REs can also be incorporated with promises of increased and future businesses, if supplier performance improves (Handfield et al., 2006; Krause et al., 2007).
Effective Communication (EC) Improper communication between buyer and supplier leads to misunderstanding, causing higher bullwhip effect. Thus, proper EC is necessary for transformation of trustful and required information to supplier for having clarity of goal. Buyer-to-supplier information sharing, buyer-to-supplier performance feedback and buyer investment in inter-organisational information technology are the key enablers of buyer-to-supplier communication openness (Sanders, Autry, & Gligor, 2011). Frequent and open communication between buyer and supplier bridges the gap between them and brings them closer, which also motivates supplier for betterment in performance. Such effectiveness in communication leads to strengthening of relationship between them, leading to mutual benefits (Chidambaranathan, Muralidharan, & Deshmukh, 2009; Routroy & Pradhan, 2013).
Asset Specificity (AS)
To be competent in the market with higher responsiveness, AS is key enabler for it. Such efforts from buyer for the development of supplier increase the relationship between them and makes him/her as a preferred buyer from supplier’s perspective (Corsten & Kumar, 2005; Li et al., 2007). AS, with respect to dedicated investments for supplier, crates the mindset of supplier that the buyer is taking care for supplier growth and it increases the TR on buyer with improvement in relationship (Rokkan, Heide, & Wathne, 2003).
Joint Action (JA)
The concept of JA with early involvement of suppliers gives additional advantage to supplier’s innovativeness to buyer and reduces time for the development of product (McIvor & Humphreys, 2004; Song & Benedetto, 2008). To achieve better results of JAs, supplier should be capable, committed and faithful. JA can also be referred as early involvement of supplier, which directly benefits not only in saving of cost and time but also improves the quality of product and process (Eisto et al., 2010).
Top Management Support (TMS)
For initiating the SDP for identified supplier base, TMS plays a vital role for the initiation of programme and it is expected as key for further planning (Leenders & Blenkhorn, 1988). For making successful implementation of supplier development programme, continuous follow up from top management side increases the importance of it and leads to its success (Handfield et al., 2006; Kannan, Kannan, & Noorul Haq, 2010).
Trust (TR)
Many researchers have quoted that TR plays a vital role in relationship building between buyer and supplier and it leads to satisfaction of relationship between them. TR refers to the extent to which relationship partners perceive each other as credible and benevolent and it leads to PR of supply chain (Gullett et al., 2009). For resultoriented process and long-term relationship building, TR is a necessary element between buyer and supplier (Akrout, 2015; Wagner, Coley, & Lindemann, 2011). To be competitive, there should be knowledge sharing and integration between buyer and supplier and TR acts like a key element for it. Such successful knowledge sharing with long-term relationship leads to success of product development (Rosell et al., 2014).
Long-term Commitment (LTC)
For continuous development of the supplier base there should be long-term strategy which relates to LTC from both the parties for betterment of product, process and services. LTC is nothing but is a long-term cooperative effort between a buying firm and its suppliers for continuous improvement in the supplier’s technical, quality, delivery and cost capabilities and to foster ongoing improvements (Handfield et al., 2006). Continuous efforts towards building LTC lead to bringing quality attitudes in workers and management and continuously focus on quality in design, production and performance (Aslan et al., 2011). LTC helps to improve supplier’s capabilities and the knowledge transfer from the buyer to the supplier. It is recommended from buyer side to sort out suppliers based on evaluation parameters for determining which suppliers would benefit an organisation’s strategy and long-term goals (Kumar, Clemens, & Keller, 2014).
Suppliers Perspective for Buyer–Supplier Relationship (SPBSR)
Considering the perspective of supplier in terms of long-term contracts and attractive prices, supplier shows readiness for investing in quality, labour and technology (Puma, 2012). Perspective of supplier mainly focuses on long-term contract and profitable pricing and buyer should think of it in rising price conditions of raw material (Roloff & Aßländer, 2010). Typical mistakes made by buyers in partnerships are too narrow focus on cost-cutting and micromanaging suppliers with an approach that is too prescriptive and too controlling. A supportive environment with consideration of supplier’s perspective improves the performance of supplier.
Buyer–Supplier Relationship Improvement (BSRI)
Implementing SDP with support from top management with continuous follow up leads to not only development of supplier but also opens the door for relationship building. SDP and relationship practices together improve the relationship between buyer and supplier (Lambert & Schwieterman, 2012; Lee et al., 2013). To remain competitive in market, there should be a focused strategy for INV and its implementation which can be achieved through improved relationship with suppliers (Abd Rahman & Bennett, 2009; Jajja et al., 2014; Miguel et al., 2014). Improvement in relationship between buyer and supplier brings them closer for betterment of product, process and service to end user with increase in profit (Jack & Powers, 2015).
Competitive Advantages (CA)
The current study focuses on CA as TAD, operational excellence, INV and RIM.
Technology Adaption (TAD)
There is always some problem during the initial phases of TAD and its implementation, which can be resolved through effective relationship with supplier. The reason for such problems during the initial phases of TAD is mostly due to lack of support from the supplier base and mindset which can be improved by relationship practices (Baldwin & Lin, 2002). It is recommended from supplier to adopt new technologies to remain competitive (Abd Rahman & Bennett, 2009).
Innovation (INV)
To give diversified and new range of products to the end user, there should be continuous INV in the product or process. INV from the supplier base in the product range endorse positive impacts on manufacturer’s performance across multiple dimensions for making buyer more competent (Mao, 2007; Wang & Ahmed, 2004). INV, discussed here, is incremental INV and is related mostly to technical capability of supplier. Technical capability of supplier affects greatly on INV and makes buyer more competent (Schiele, Veldman, & Hüttinger, 2011). Investment from buyer in the assets for enriching capability of supplier, sharing of knowledge, TR and LTC leads to continuous INV (Charterina & Landeta, 2010). The improvement in buyer–supplier relationship bridges the gap between buyer and supplier and plays a significant role in INV (Inemek & Matthyssens, 2013; Kim, Choi, & Skilton, 2015).
Operational Excellence (OE)
Excellence in operations refers to improvement in quality, advancement in technical features and functions, improvement in cost and on-time delivery and improvement in technical capability of supplier, which makes a product more reliable. It also includes new product introduction and change in process or product with cost effectiveness by the supplier itself, continuously (Collis, 1994). As a customer is interested in new and diversified range of products, it is expected that the supplier base should have excellence in the above-mentioned parameters for the satisfaction of end user (Slack, Lewis, & Bates, 2004). Continuous development of the supplier base and implementing relationship practices increase the confidence of supplier for giving excellence in operations and performance (Thatte, Rao, & Ragu-Nathan, 2013).
Risk Minimisation (RIM)
During the process of supplier development, there is risk associated with supplier switching and knowledge leakage. For strategic and critical products, there is always risk of dependability on supplier for a respective quantity and quality. It is recommended for buyer that they should not totally depend upon a single supplier to fulfil the market demand. Based on the type of product, its features and the type of relationship with its respective supplier, firms need to choose different management mechanisms for their respective suppliers (Zu & Kaynak, 2012). As discussed above, if there is no effective management for critical and strategic components, it may lead to supply chain disruption and may cause serious damage to its operation and its business performance (Hendricks & Singhal, 2008). Relationship building and TR are the key factors to overcome such problems. Improvement in TR and relationship between buyer and supplier bridges the gap between them and minimises risk of supply chain disruption, knowledge leakage and supplier switching (Yeung, 2008). Minimisation of the above-mentioned risk, not only brings them closer but also makes each other as a preferred resource which befits the whole supply chain, provided there should be LTC from both the side (Kaynak & Hartley, 2008). Risks for buyer, discussed here, are switching of supplier after his development and leakage of data/technology from the supplier after or during the stage of development.
Profitability (PR)
Higher PR can be achieved through long-term relationships. Efforts of supplier development and relationship building lead to building a competent supplier base which increases the PR of supply chain and the increased PR brings the partner closer with openness between suppliers and buyers. This openness has a great impact on knowledge sharing, future planning and appreciation of each other’s contribution to the relationship improvement (Corsten & Kumar, 2005). Long-term relationship with TR leads to creation of value and profit. Profitable project, especially from the supplier’s perspective, leads to satisfaction and future business growth (Mao, Lee, & Deng, 2008).
RESEARCH FRAMEWORK AND HYPOTHESES
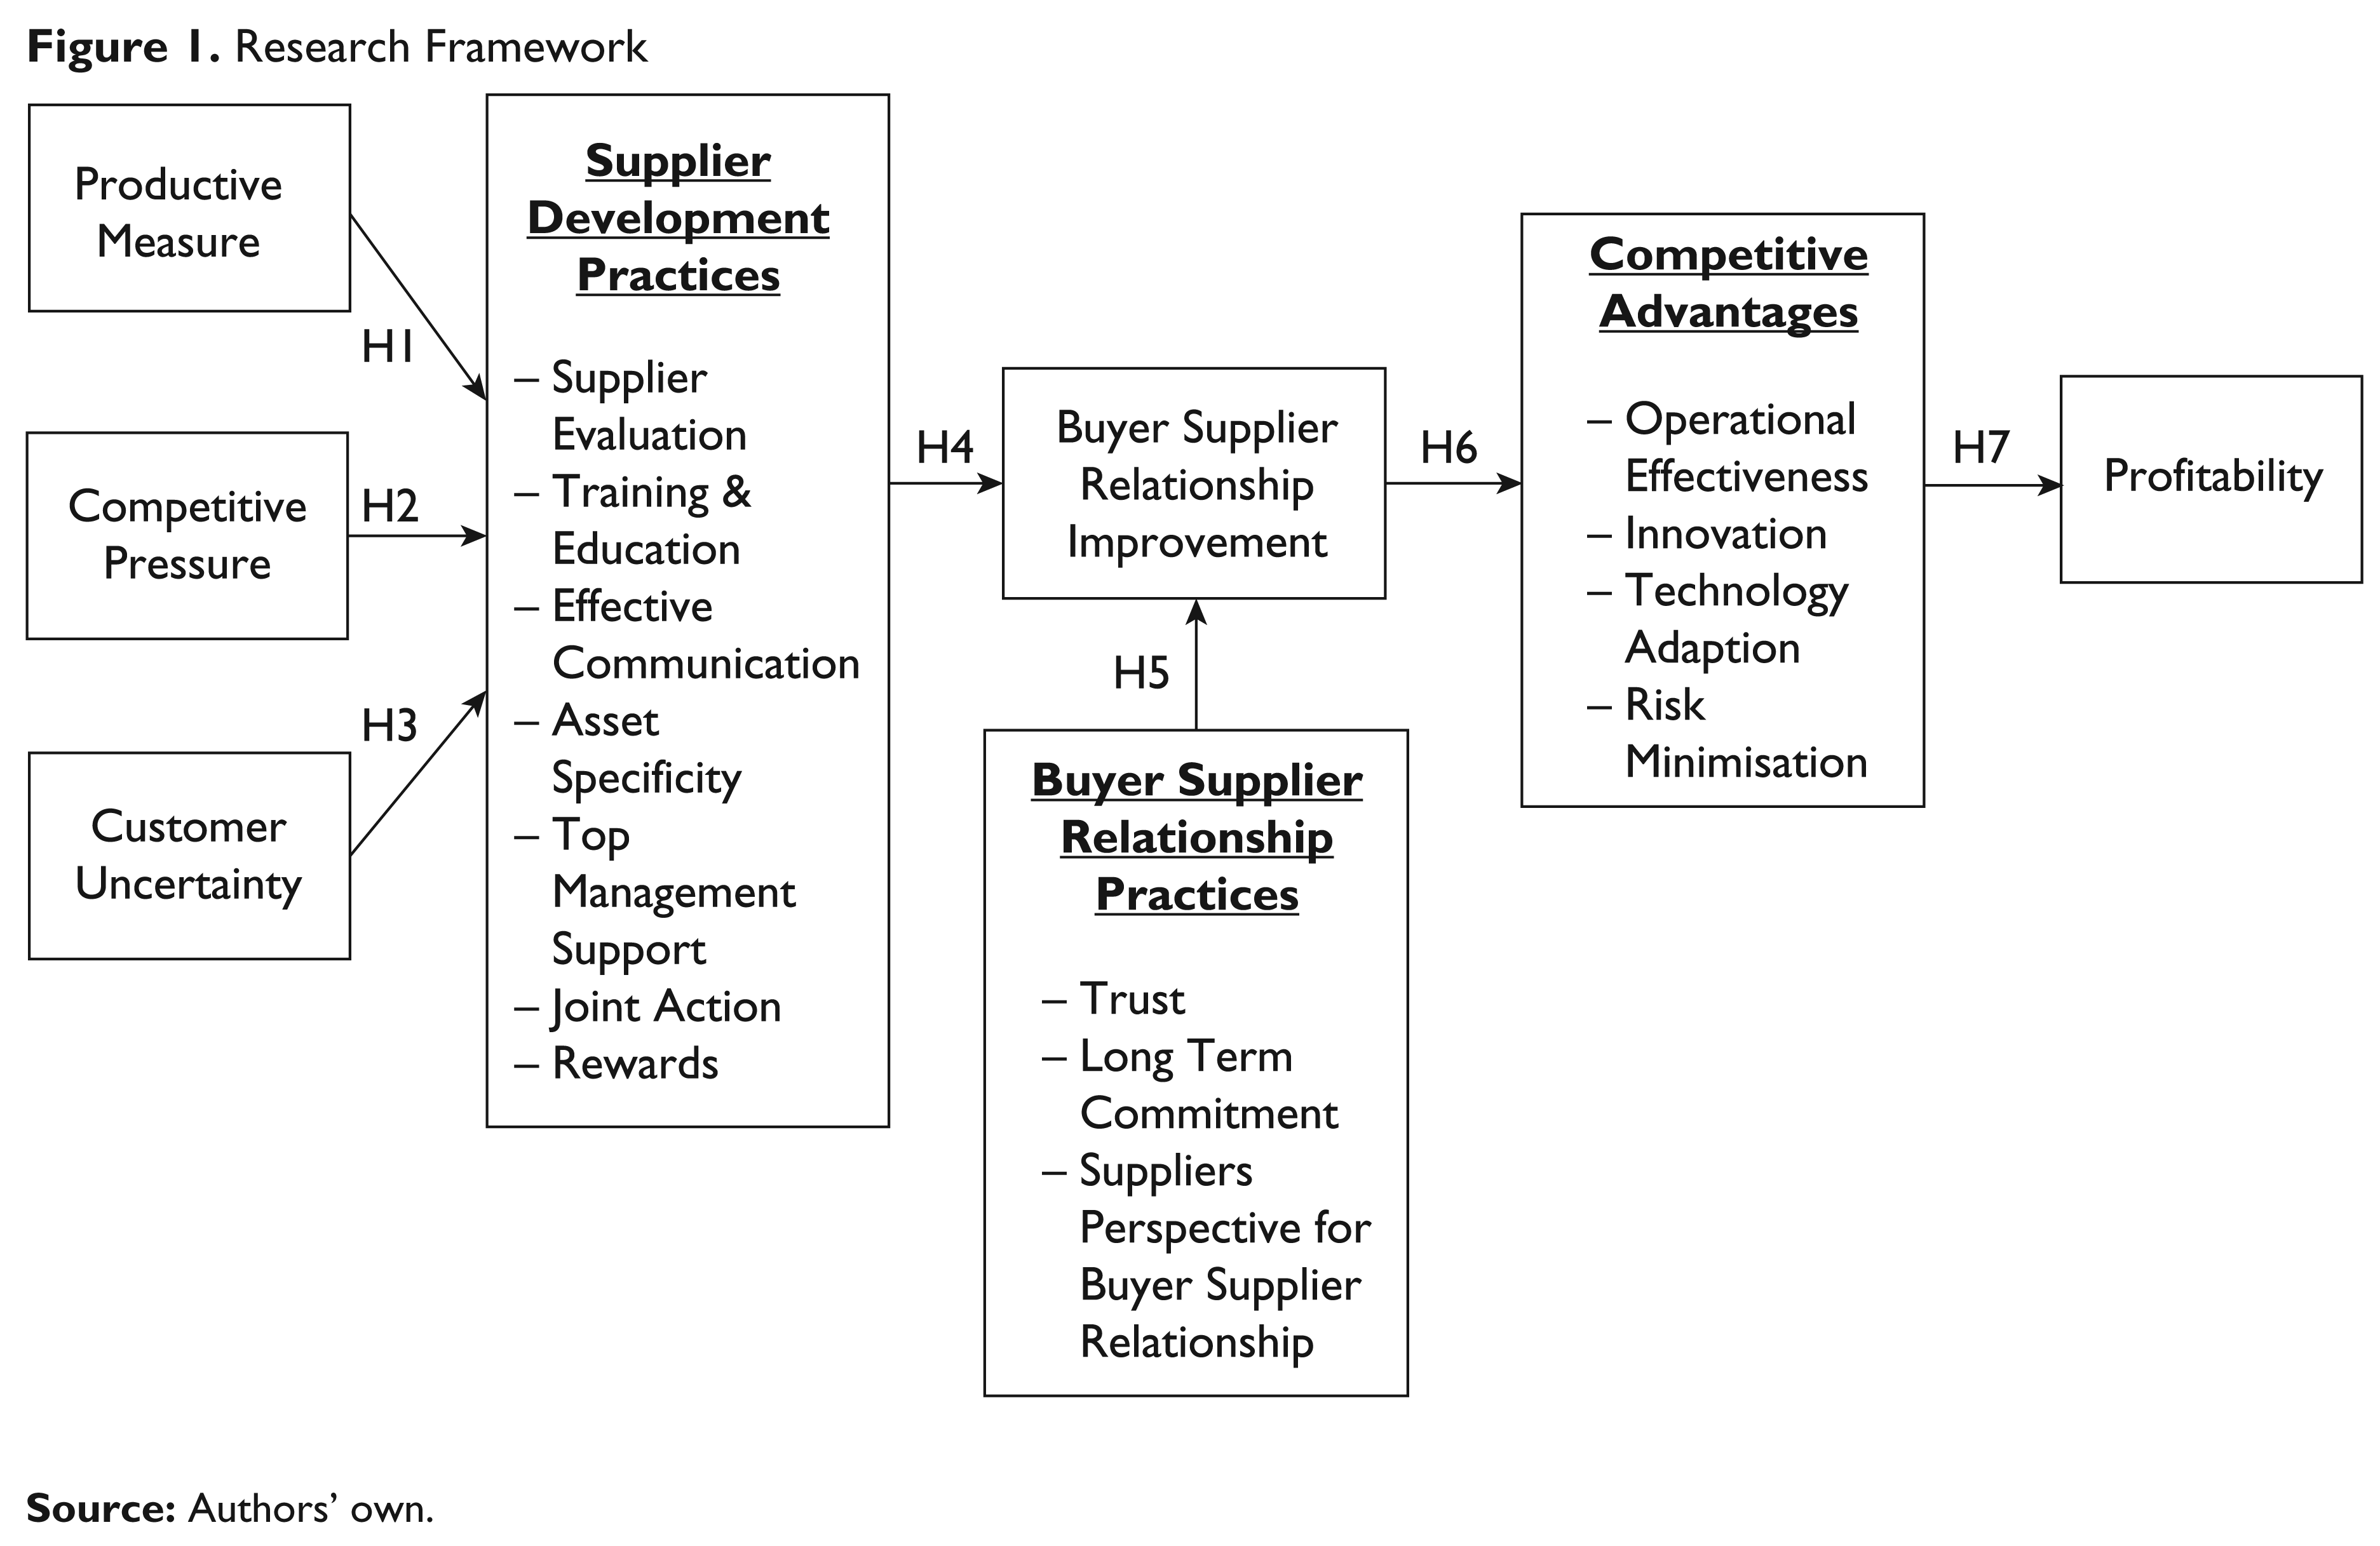
This section summarises the theoretical framework (Figure 1) and hypotheses. Work is classified in six parts as: (1) Drivers for SDP; (2) SDP; (3) BSRP; (4) BSRI; (5) CA; and (6) PR. Drivers include PM, CP and CU. SDP includes SE, TE, EC, AS, TMS, JA and RE. BSRP includes TR, LTC and SPBSR. CA includes Operational Excellence (OE), INV, TAD and RIM. Framework ends with PR, which can be achieved through CA under the condition of BSRI. BSRI can be achieved by SDP and BSRP together. Drivers, BSRI and PR are the first order construct and SDP, BSRP and CA are the second order construct.
For the current study, seven hypotheses were proposed and tested empirically, these are as follows;
H1: Significant relationship exists between PM and SDP. H2: Significant relationship exists between CP and SDP. H3: Significant relationship exists between CU and SDP. H4: Significant relationship exists between SDP and BSRI. H5: Significant relationship exists between BSRP and BSRI. H6: Significant relationship exists between BSRI and CA. H7: Significant relationship exists between CA and PR.
The above hypotheses taken together support the research framework presented in Figure 1.
Research Methodology
Research methodology is treated as the central part of the study which helps and gives direction to researchers to achieve research questions and objectives. The current study employed three-phase methodology to achieve the proposed objectives: (1) factor selection with their respective item; (2) conduction of pilot study for reliability and validity of scale; and (3) collection of large-scale data and its analysis.
Phase I
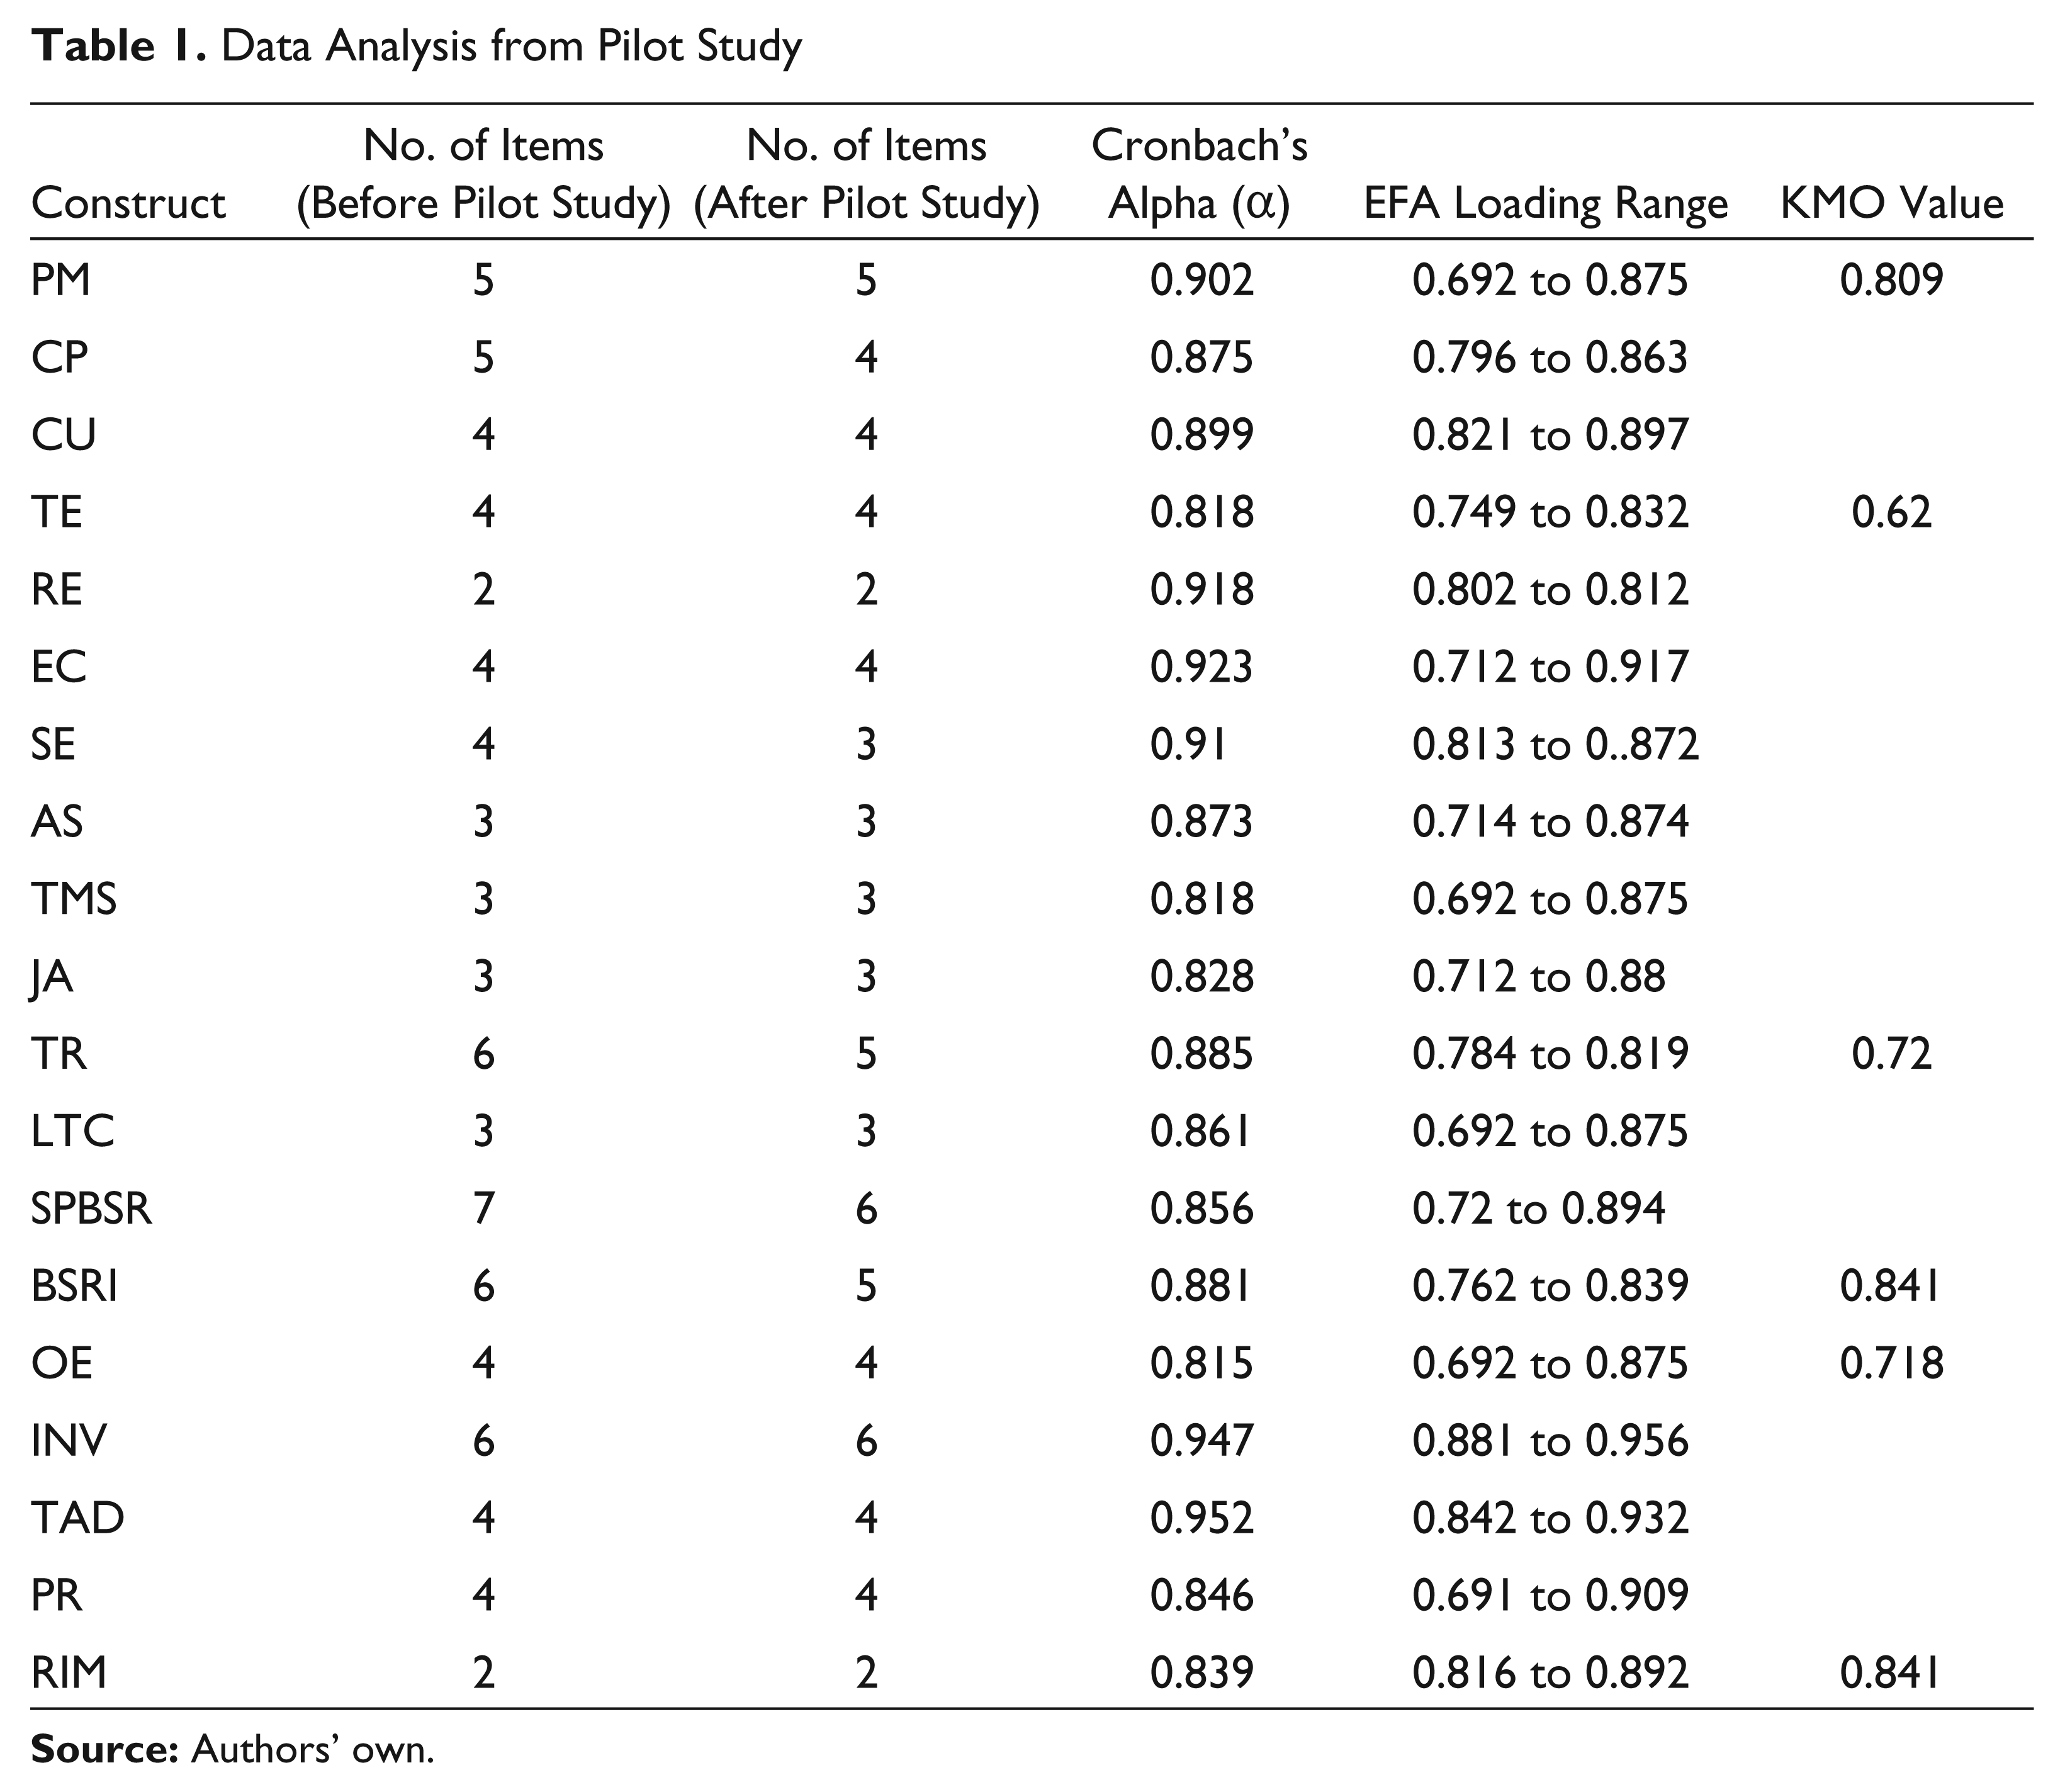
First step was to construct a questionnaire through extensive literature review. From literature six basic constructs, namely, drivers for SDP, SDP, BSRP, BSRI, CA and PR, were identified. After this, sub-constructs and their respective items were selected having reliability and validity from literature. For establishing the face and content validity, it was discussed with industry practitioners and academicians on the applicability of these variables in the Indian context. Content validity represents the sufficiency with which a specific domain of content (construct) was sampled (Churchill Jr, 1979; Nunnally, 1978). The selected respondents for face validity were mainly academic experts and industry practitioners. For pilot study, 19 constructs with 79 items were finalised. The scale used was 5-point Likert scale.
Phase II
To collect sufficient information from the respondents, for making statistical inference purposive, sampling technique is supposed to be better, which was employed in the current study (Talavera, 2004). Initially 102 respondents were approached, out of which 91 agreed. Out of 91 responses, 4 responses were incomplete, so data from 87 respondents from different manufacturing industries were considered for the initial analysis. Out of 79 items, 5 items (CP5, SE4, TR6, SPBSR7 and BSRI6) were deleted after conduction of EFA due to cross-loading and their least importance in questionnaire for respective construct.
Reliability Analysis
After collection of data to refine the scale, reliability analysis is supposed to be the first step and is done by computing coefficient alpha, that is, Cronbach’s alpha (Churchill Jr, 1979). Based on given responses by respondents, Cronbach’s alpha measures the reliability of the instrument and the constancy of it. The cut-off value mentioned for Cronbach’s alpha is at least 60 and the scale becomes more reliable when the value increases (Nunnally, 1978).
Exploratory Factor Analysis (EFA)
After performing reliability analysis, it is necessary to explore the structure between the latent and observed variables and this is done by performing EFA. For extraction of factors, the current study used SPSS 20.0 software, where principal component analysis (PCA) using varimax rotation was selected (Costello & Osborne, 2011). For analysis and to delete the items of a respective construct, following cut-off values were considered: factor loadings (> 0.50) (Karatepe, Yavas, & Babakus, 2005), cross-loadings (< 0.40) or communalities (< 0.30) (Hair et al., 2010). Along with this, the Kaiser–Meyer–Olkin (KMO) and Bartlett’s test of sphericity were used for analysis. KMO is a measure of sampling adequacy and is an index used to examine the appropriateness of factor analysis with a value of at least 0.6 and Bartlett’s test of sphericity is a test statistic used to examine the hypothesis that the variables are uncorrelated in the population (Tabachnick & Linda, 2012). For all analyses, 95 per cent confidence level is maintained. CFA is done in the third phase on large data rather than data in the pilot study.
From the result of pilot study (Table 1), the validated questionnaire was further used for large-scale data collection.
Data Analysis from Pilot Study
Phase III
Data Collection
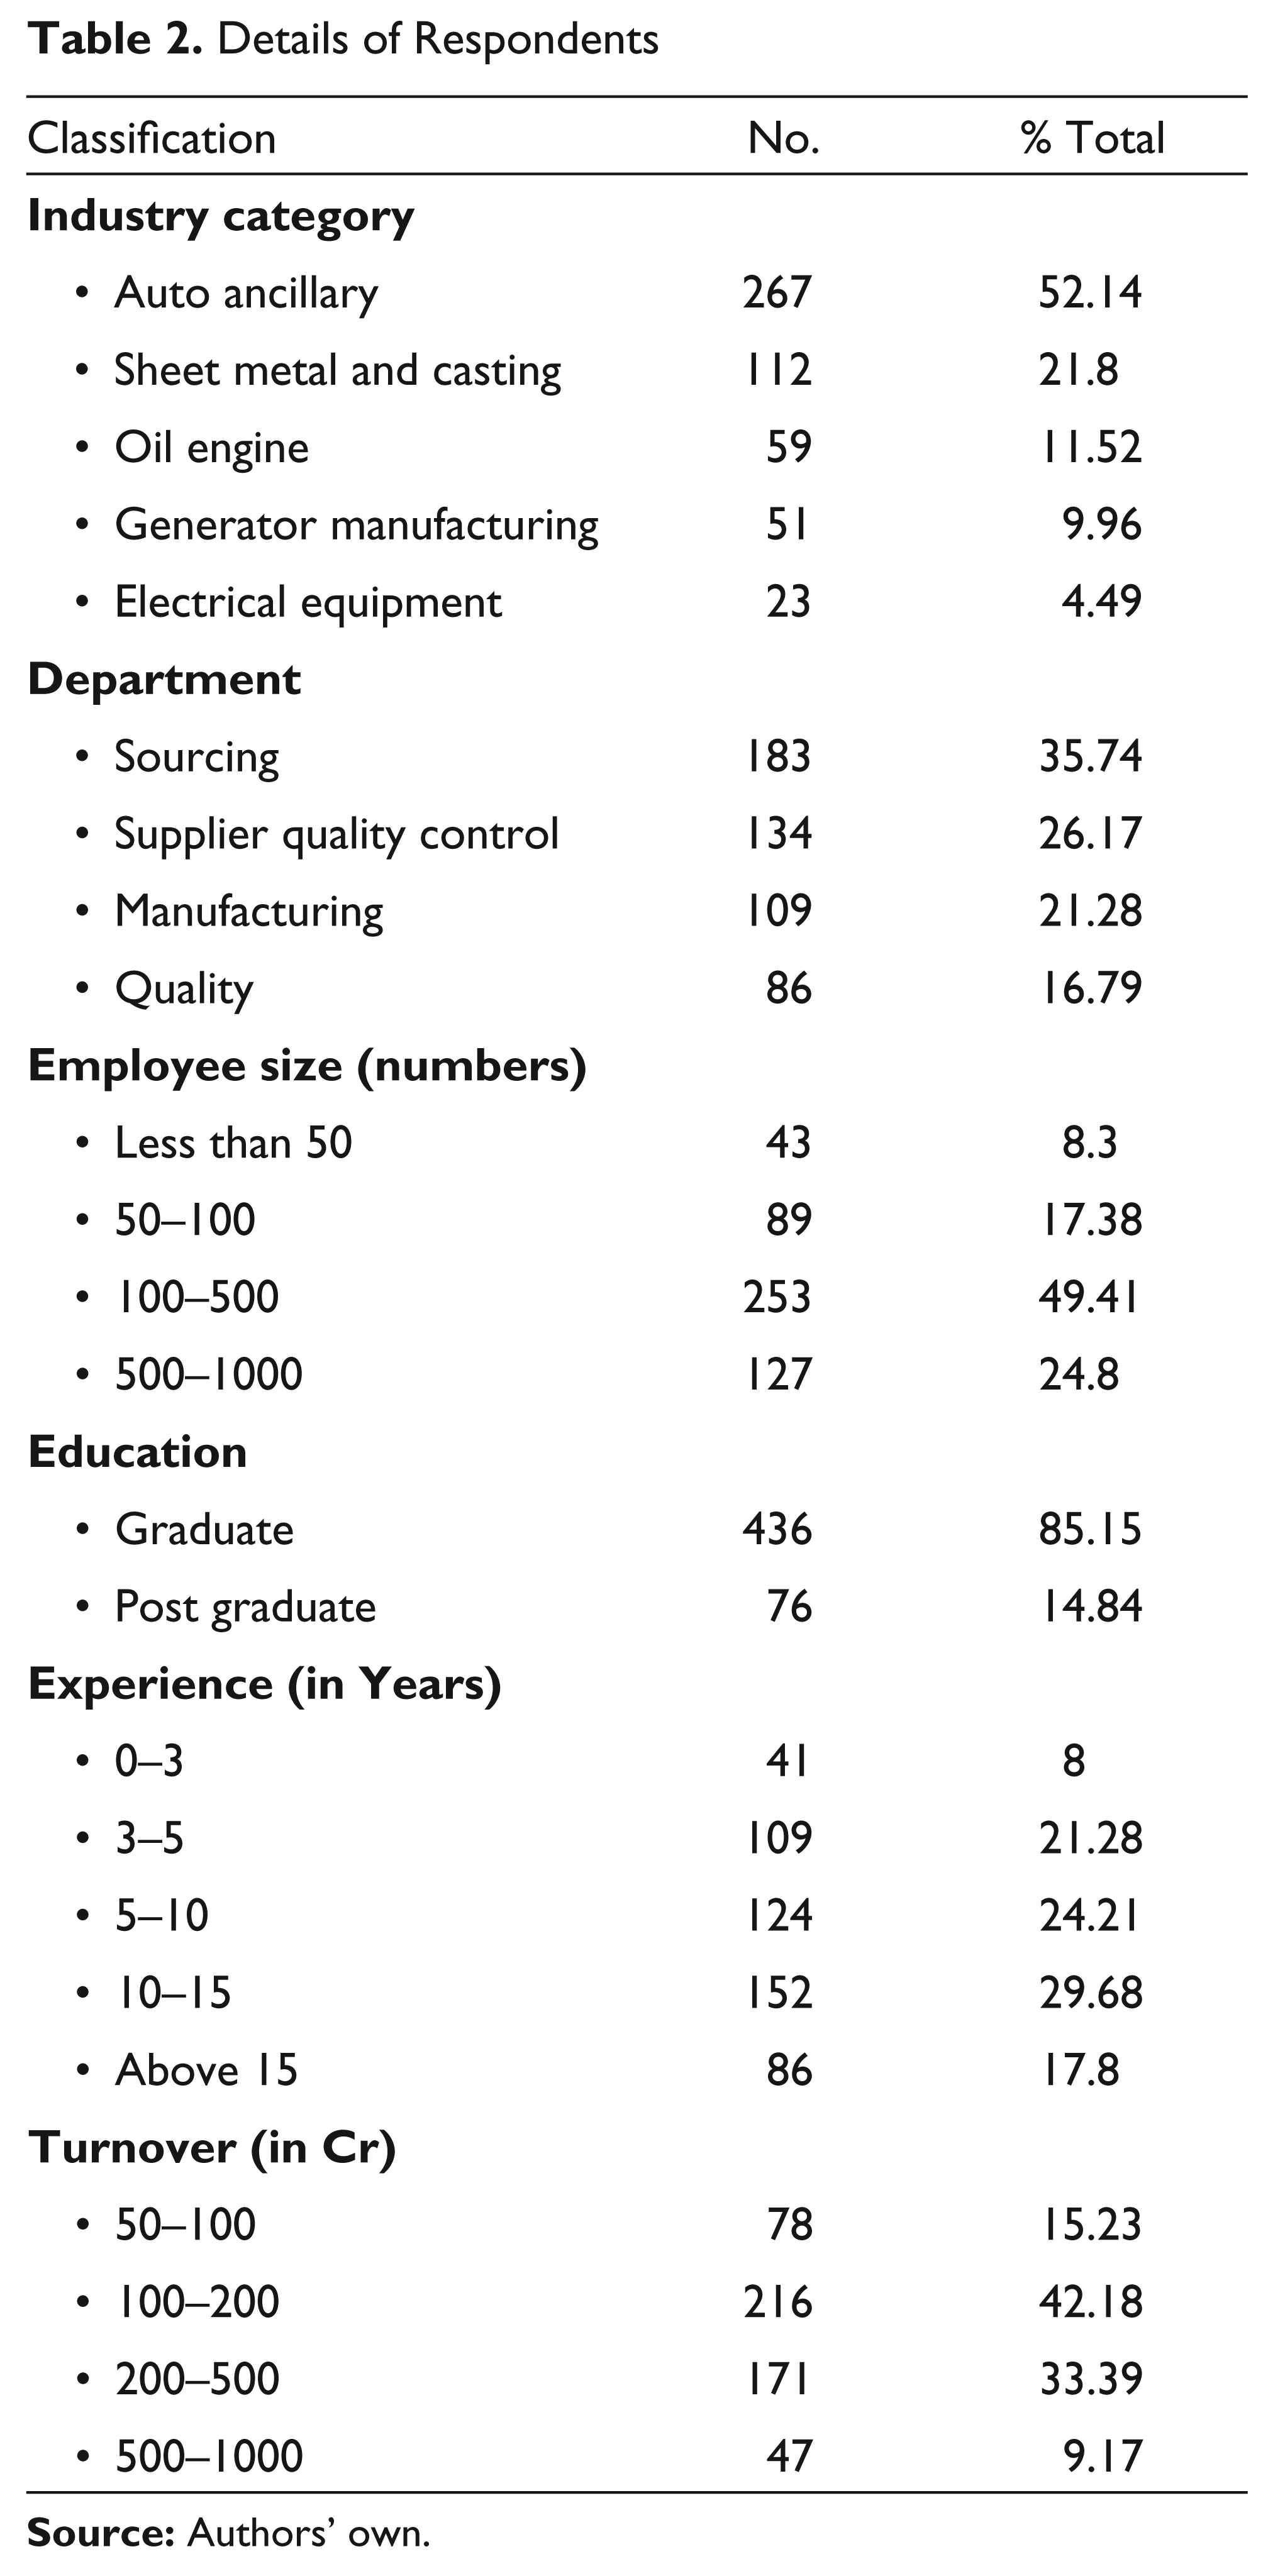
In this phase, 628 respondents from different manufacturing industries were approached for data collection, out of which 541 respondents agreed to respond. Out of 541 responses, 29 responses were incomplete, so data from 512 respondents were used for analysis. Data was collected through emails and personal visits.
Profile of Respondents
The profile of the respondents of the main survey is presented in Table 2.
Details of Respondents
Data Analysis
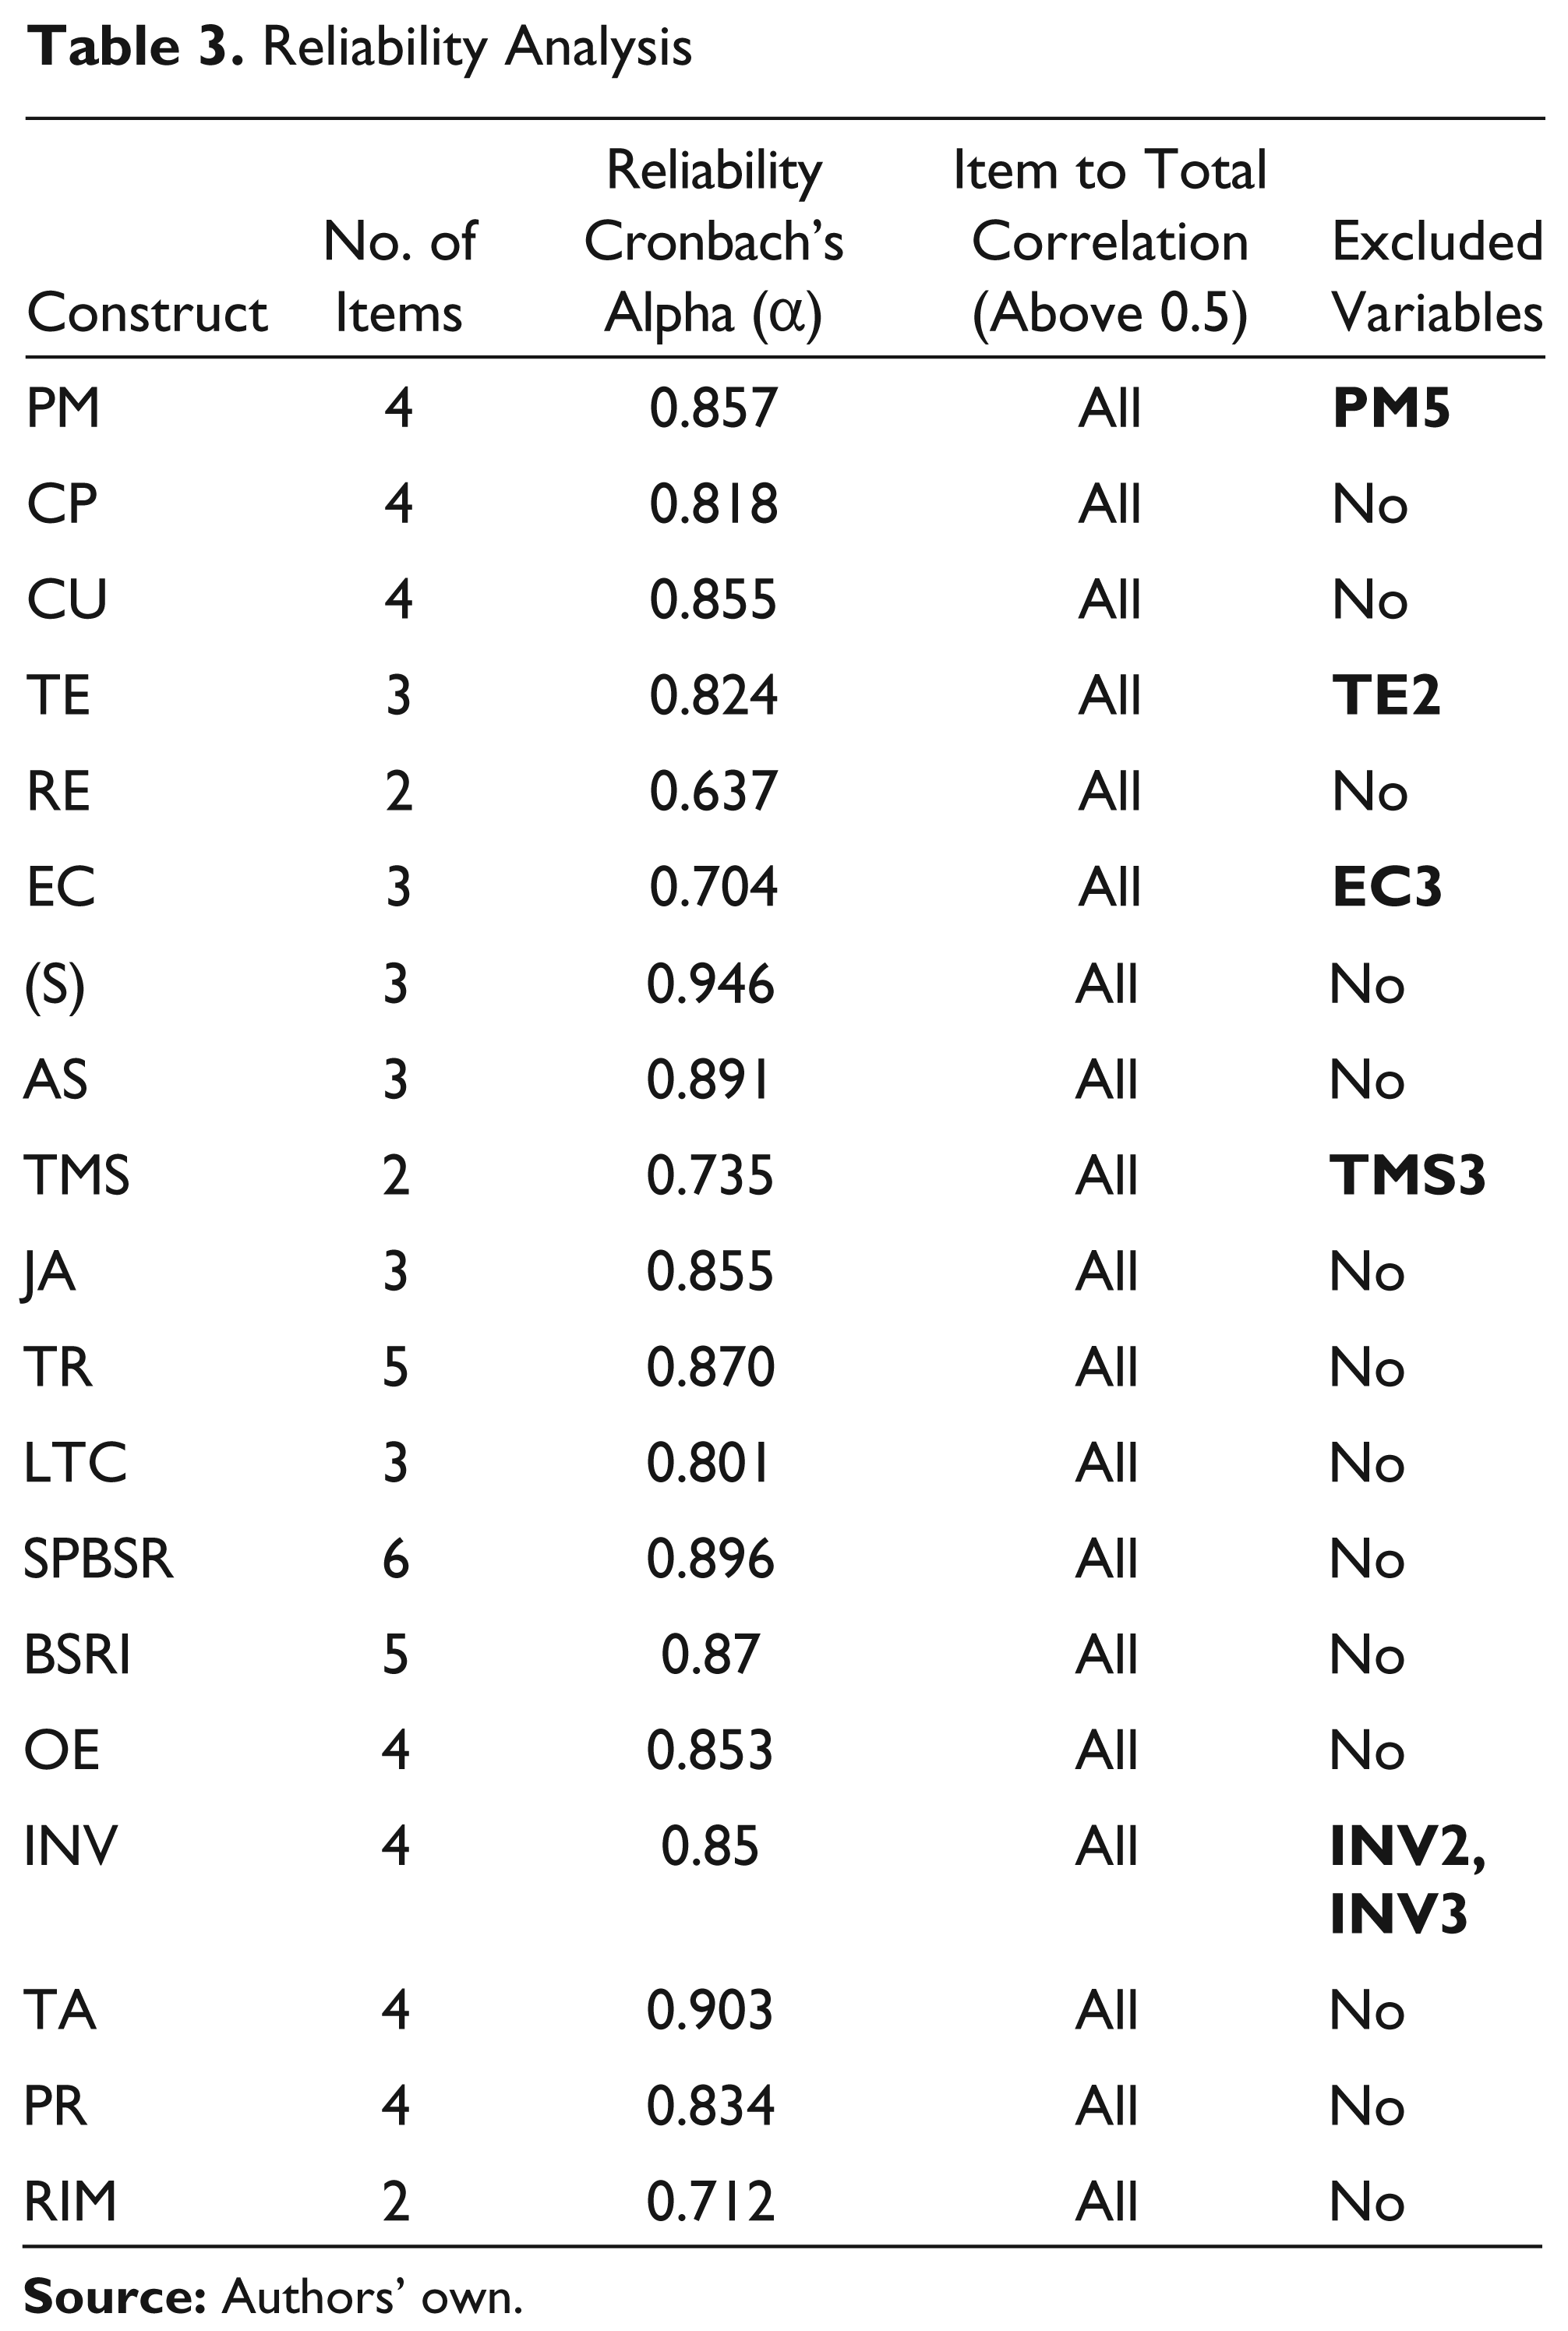
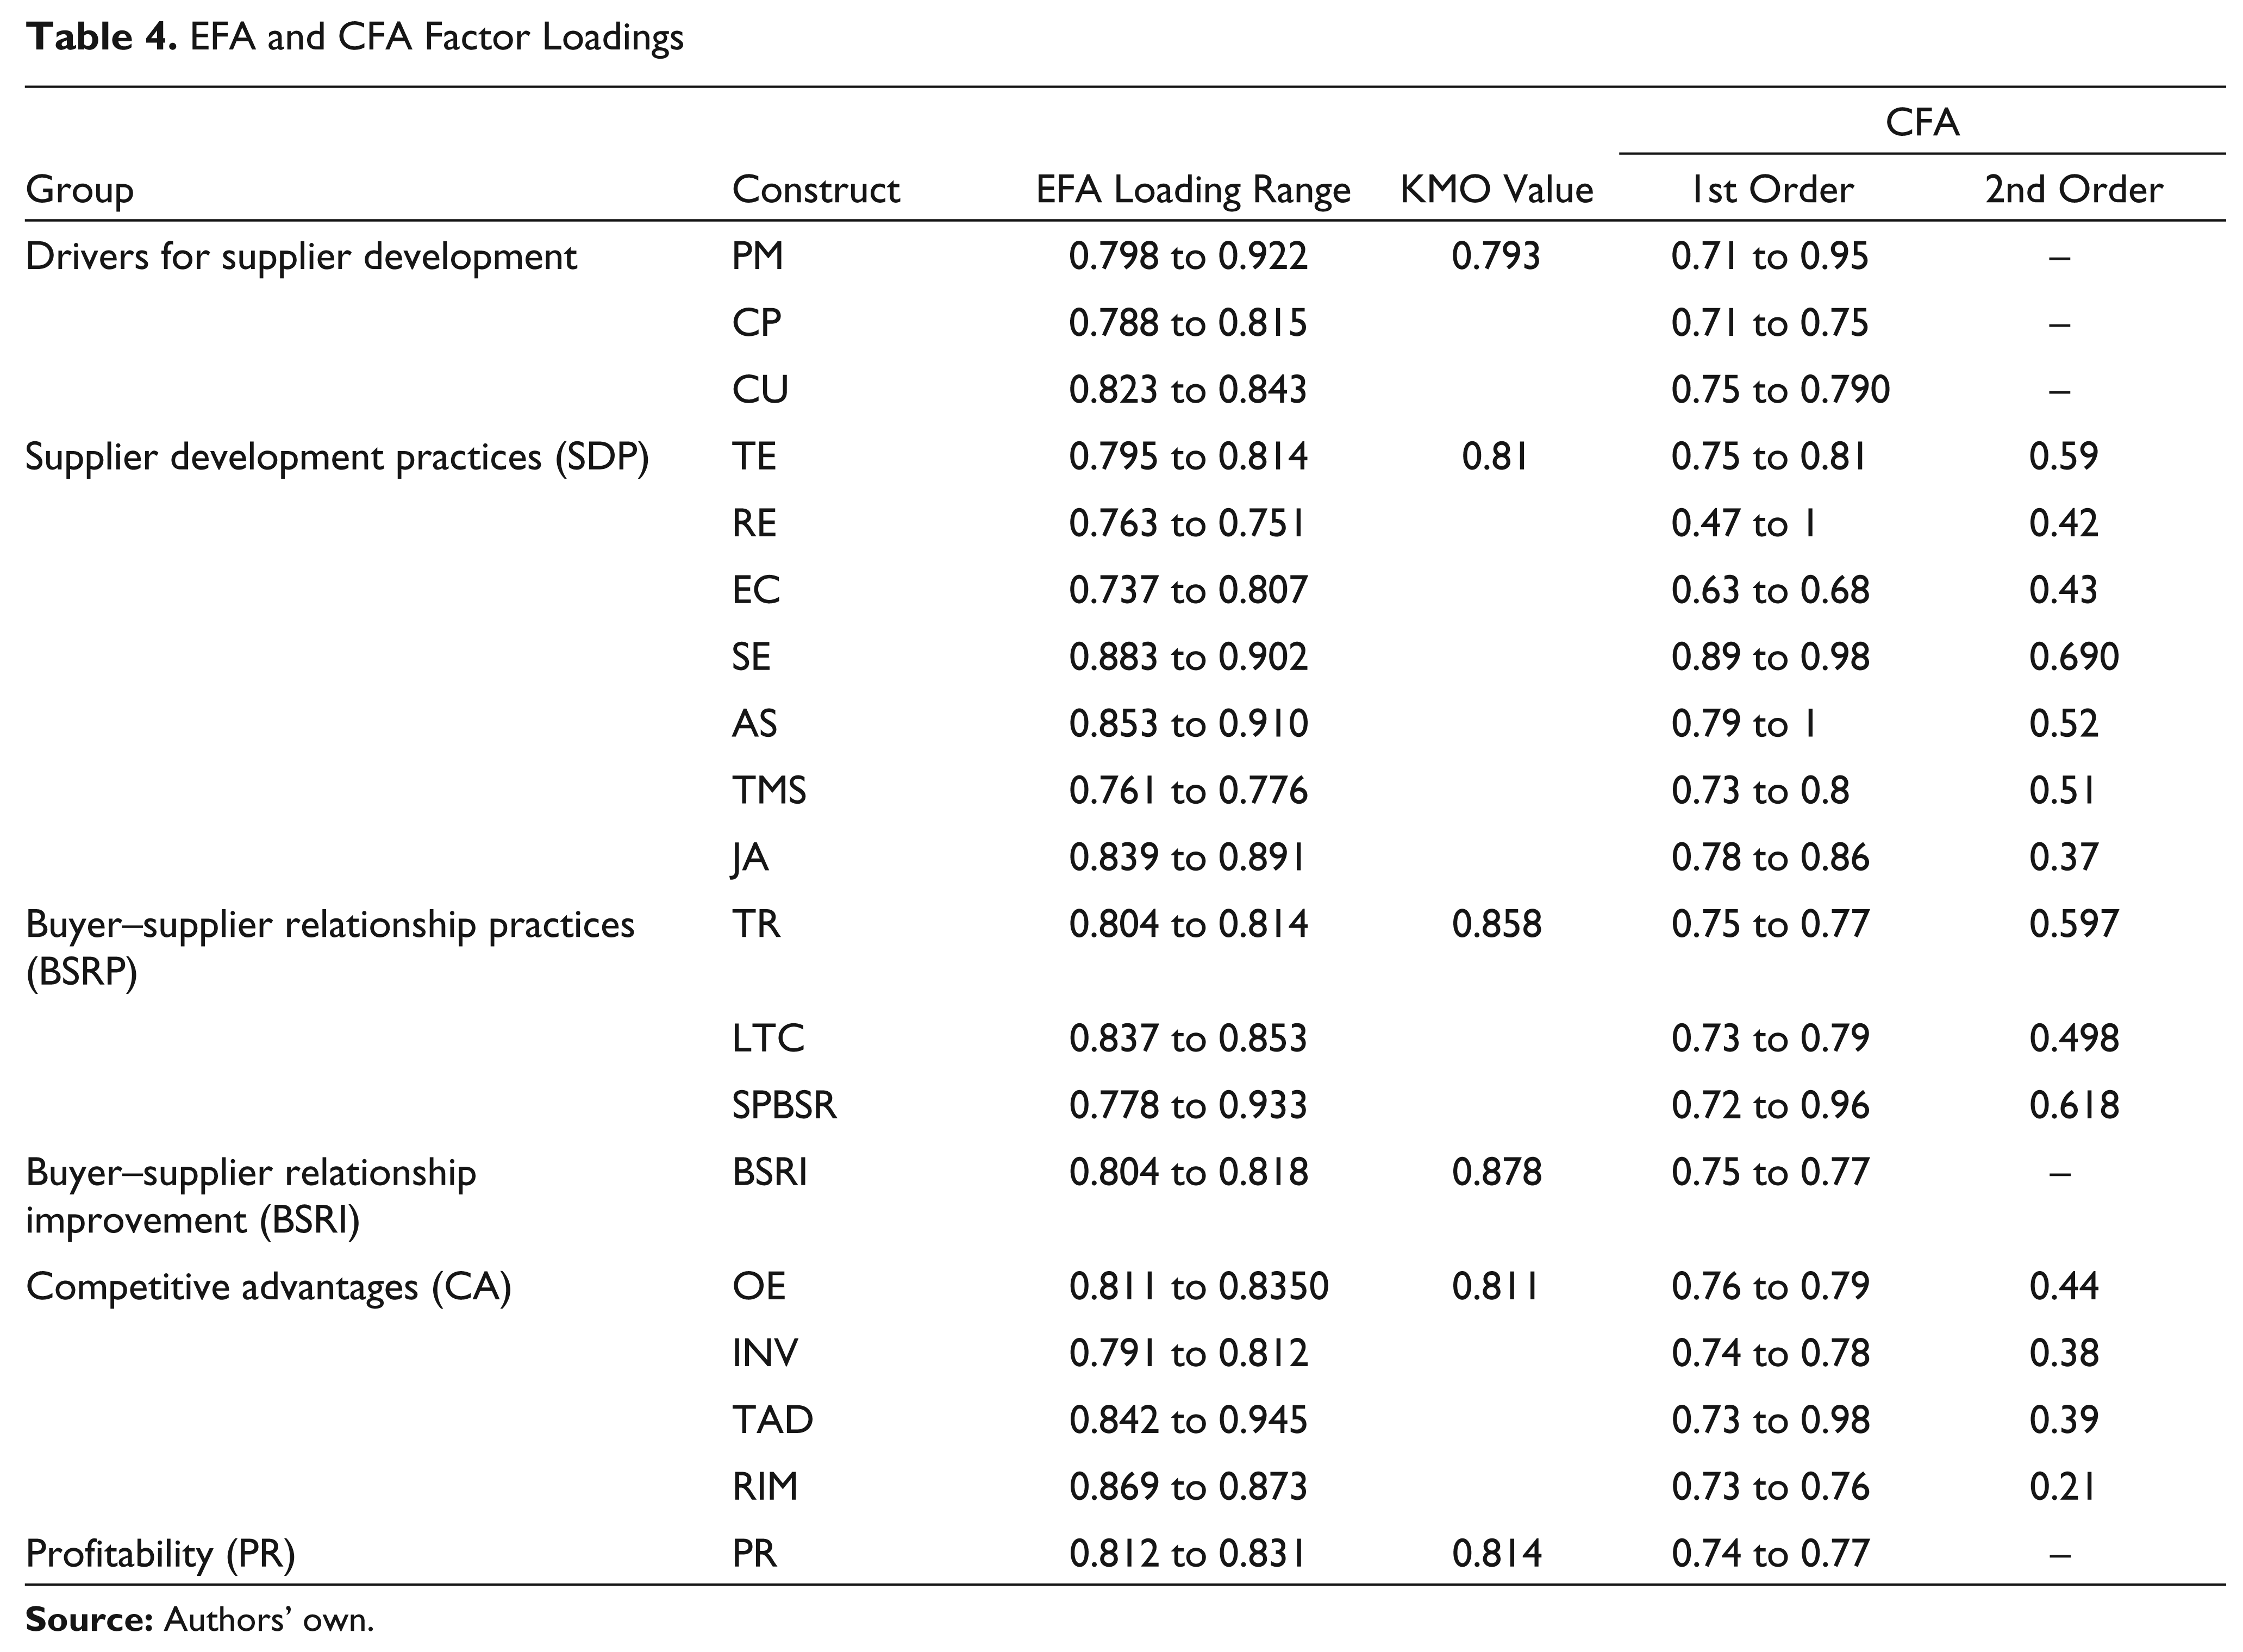
Here, again the reliability and EFA were performed on the obtained data and following that CFA was performed for confirmation of factors. In EFA, six items were deleted due to cross-loading and less importance for a respective construct. Table 3 and Table 4 show the respective values after analysis of data.
Reliability Analysis
EFA and CFA Factor Loadings
Measurement Model (CFA)
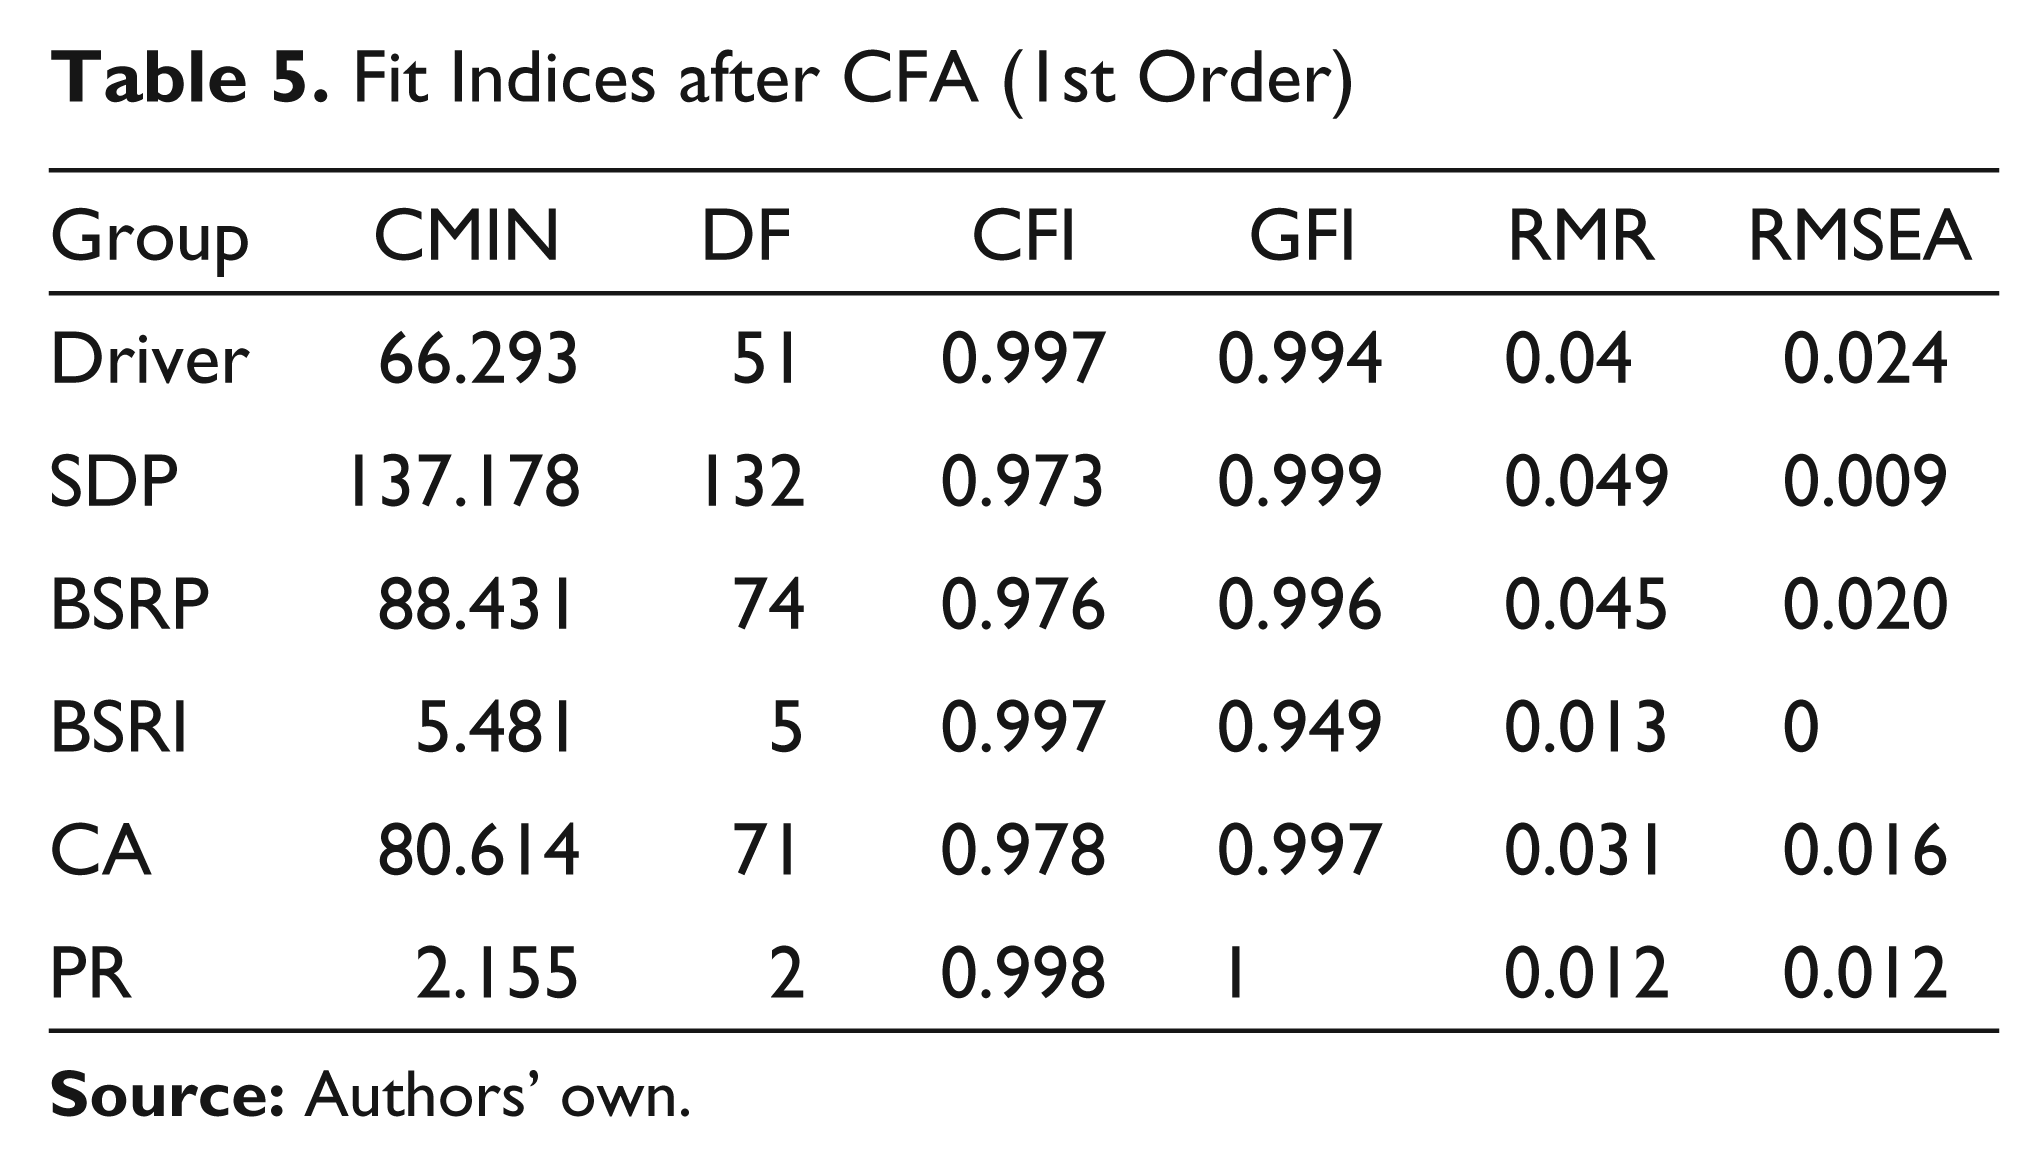
CFA is a multivariate statistical procedure that is used to test how well the measured variables represent the number of constructs. The present model is developed by using AMOS V20.0. Evaluation of the constructed model is evaluated by respective fit indices such as, factor loadings, goodness-of-fit indices, standardised residuals and modification indices. For normality of data, sufficient sample size is needed from random sampling (n > 200) (Hair et al., 2010). The root mean square error of approximation (RMSEA) is a measure of model fit that is not dependent on sample size, whereas other fit measures such as chi-square (χ2) and goodness-of-fit index are highly dependent on sample size (Hair et al., 2010). Hair et al. (2010) provided the following guidelines for model fit, starting with RMSEA, (RMSEA < 0.05) good model fit; (0.05 < RMSEA < 0.10) reasonable model fit; and (RMSEA > .10) poor model fit. Also, root mean square residual (RMR) and standardised root mean square residual (SRMR) are absolute measure of fit and are defined as the standardised difference between the observed correlation and the predicted correlation. A value less than 0.08 is generally considered a good model fit and a value between 0.08 and 0.10 is considered as a reasonable model fit. Moreover, an additional fit index that is most frequently used is, that is, chi-square (χ2/df) because it corrects for sample size. A suggested value of normed chi-square is between 1.0 and 3.0, because small values of normed chi-square (< 1.0) can indicate an overfitted model and high values (> 3.0) can indicate an under parameterised model. Incremental fit indices (CFI, IFI and TLI) range from 0 (no fit at all) to 1.0 (perfect fit) and an accepted decision rule is to accept fit that is approximately above 0.80 as moderate fit and above 0.90 as great fit (Hair et al., 2010). The results of measurement model and fit are tabulated in Table 5 and Table 6.
Fit Indices after CFA (1st Order)
Fit Indices after CFA (2nd Order)
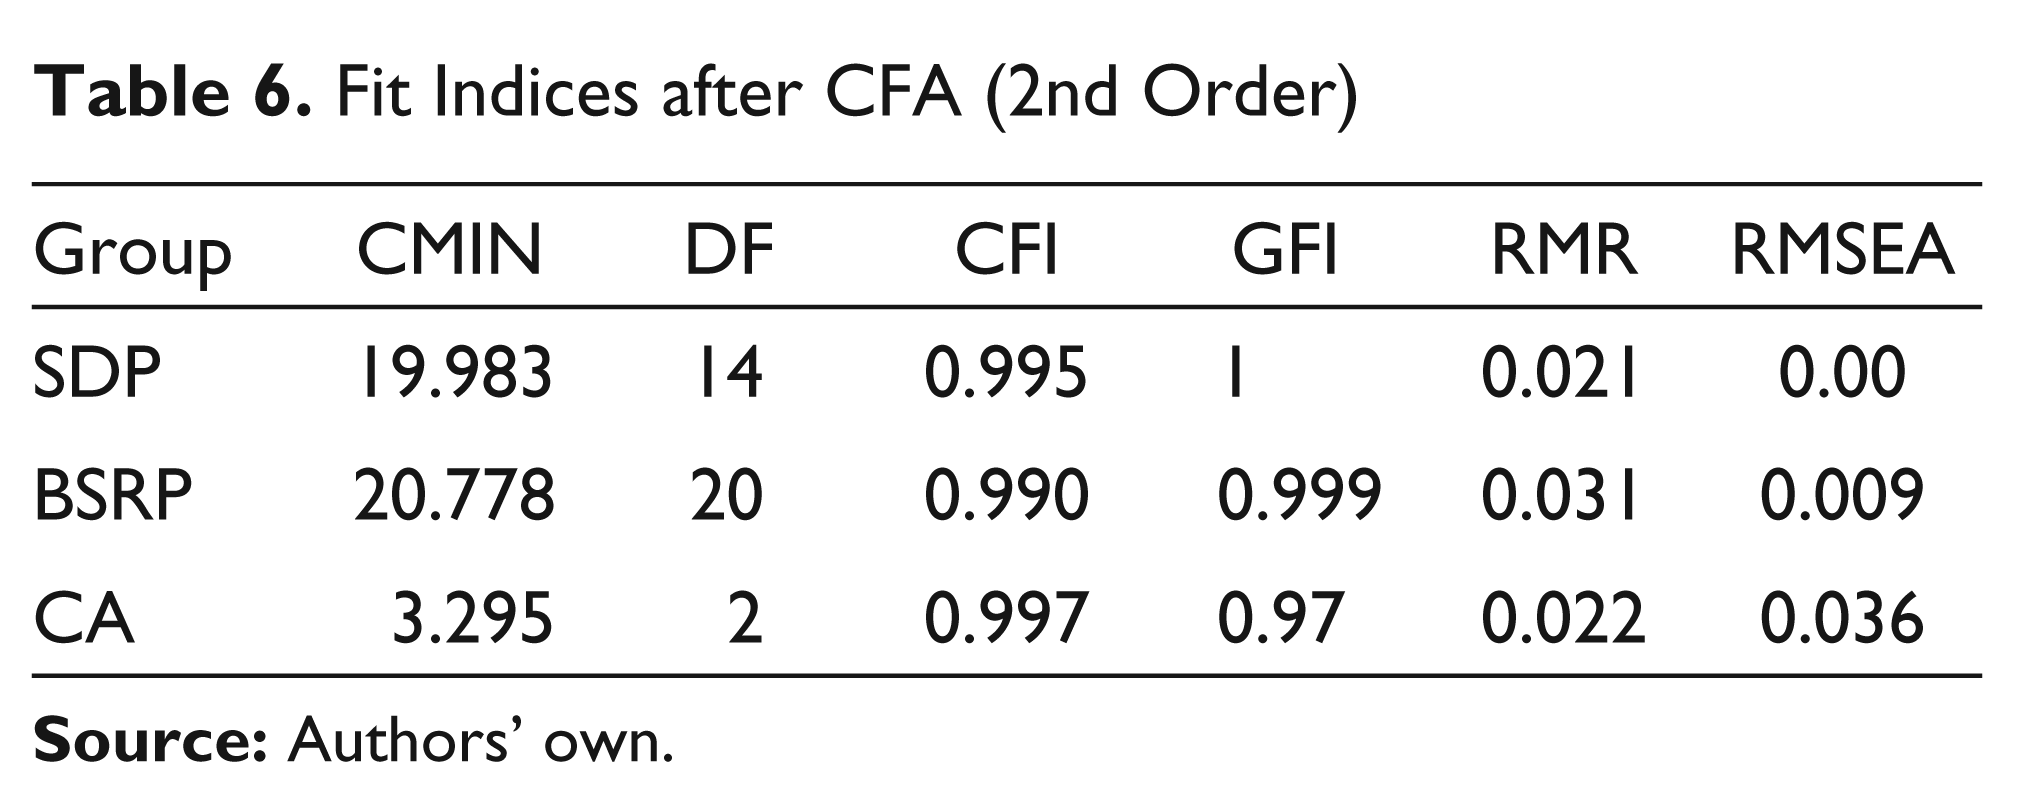
All fit indices’ values are satisfactory with respect to cut-off values mentioned above. All values for reliability, EFA and CFA were found to be satisfactory as per cut-off mentioned above. Constructs were supposed to be reliable and valid as per the analysis carried out successfully fulfilling the statistical criteria.
Structural Equation Modelling (SEM)
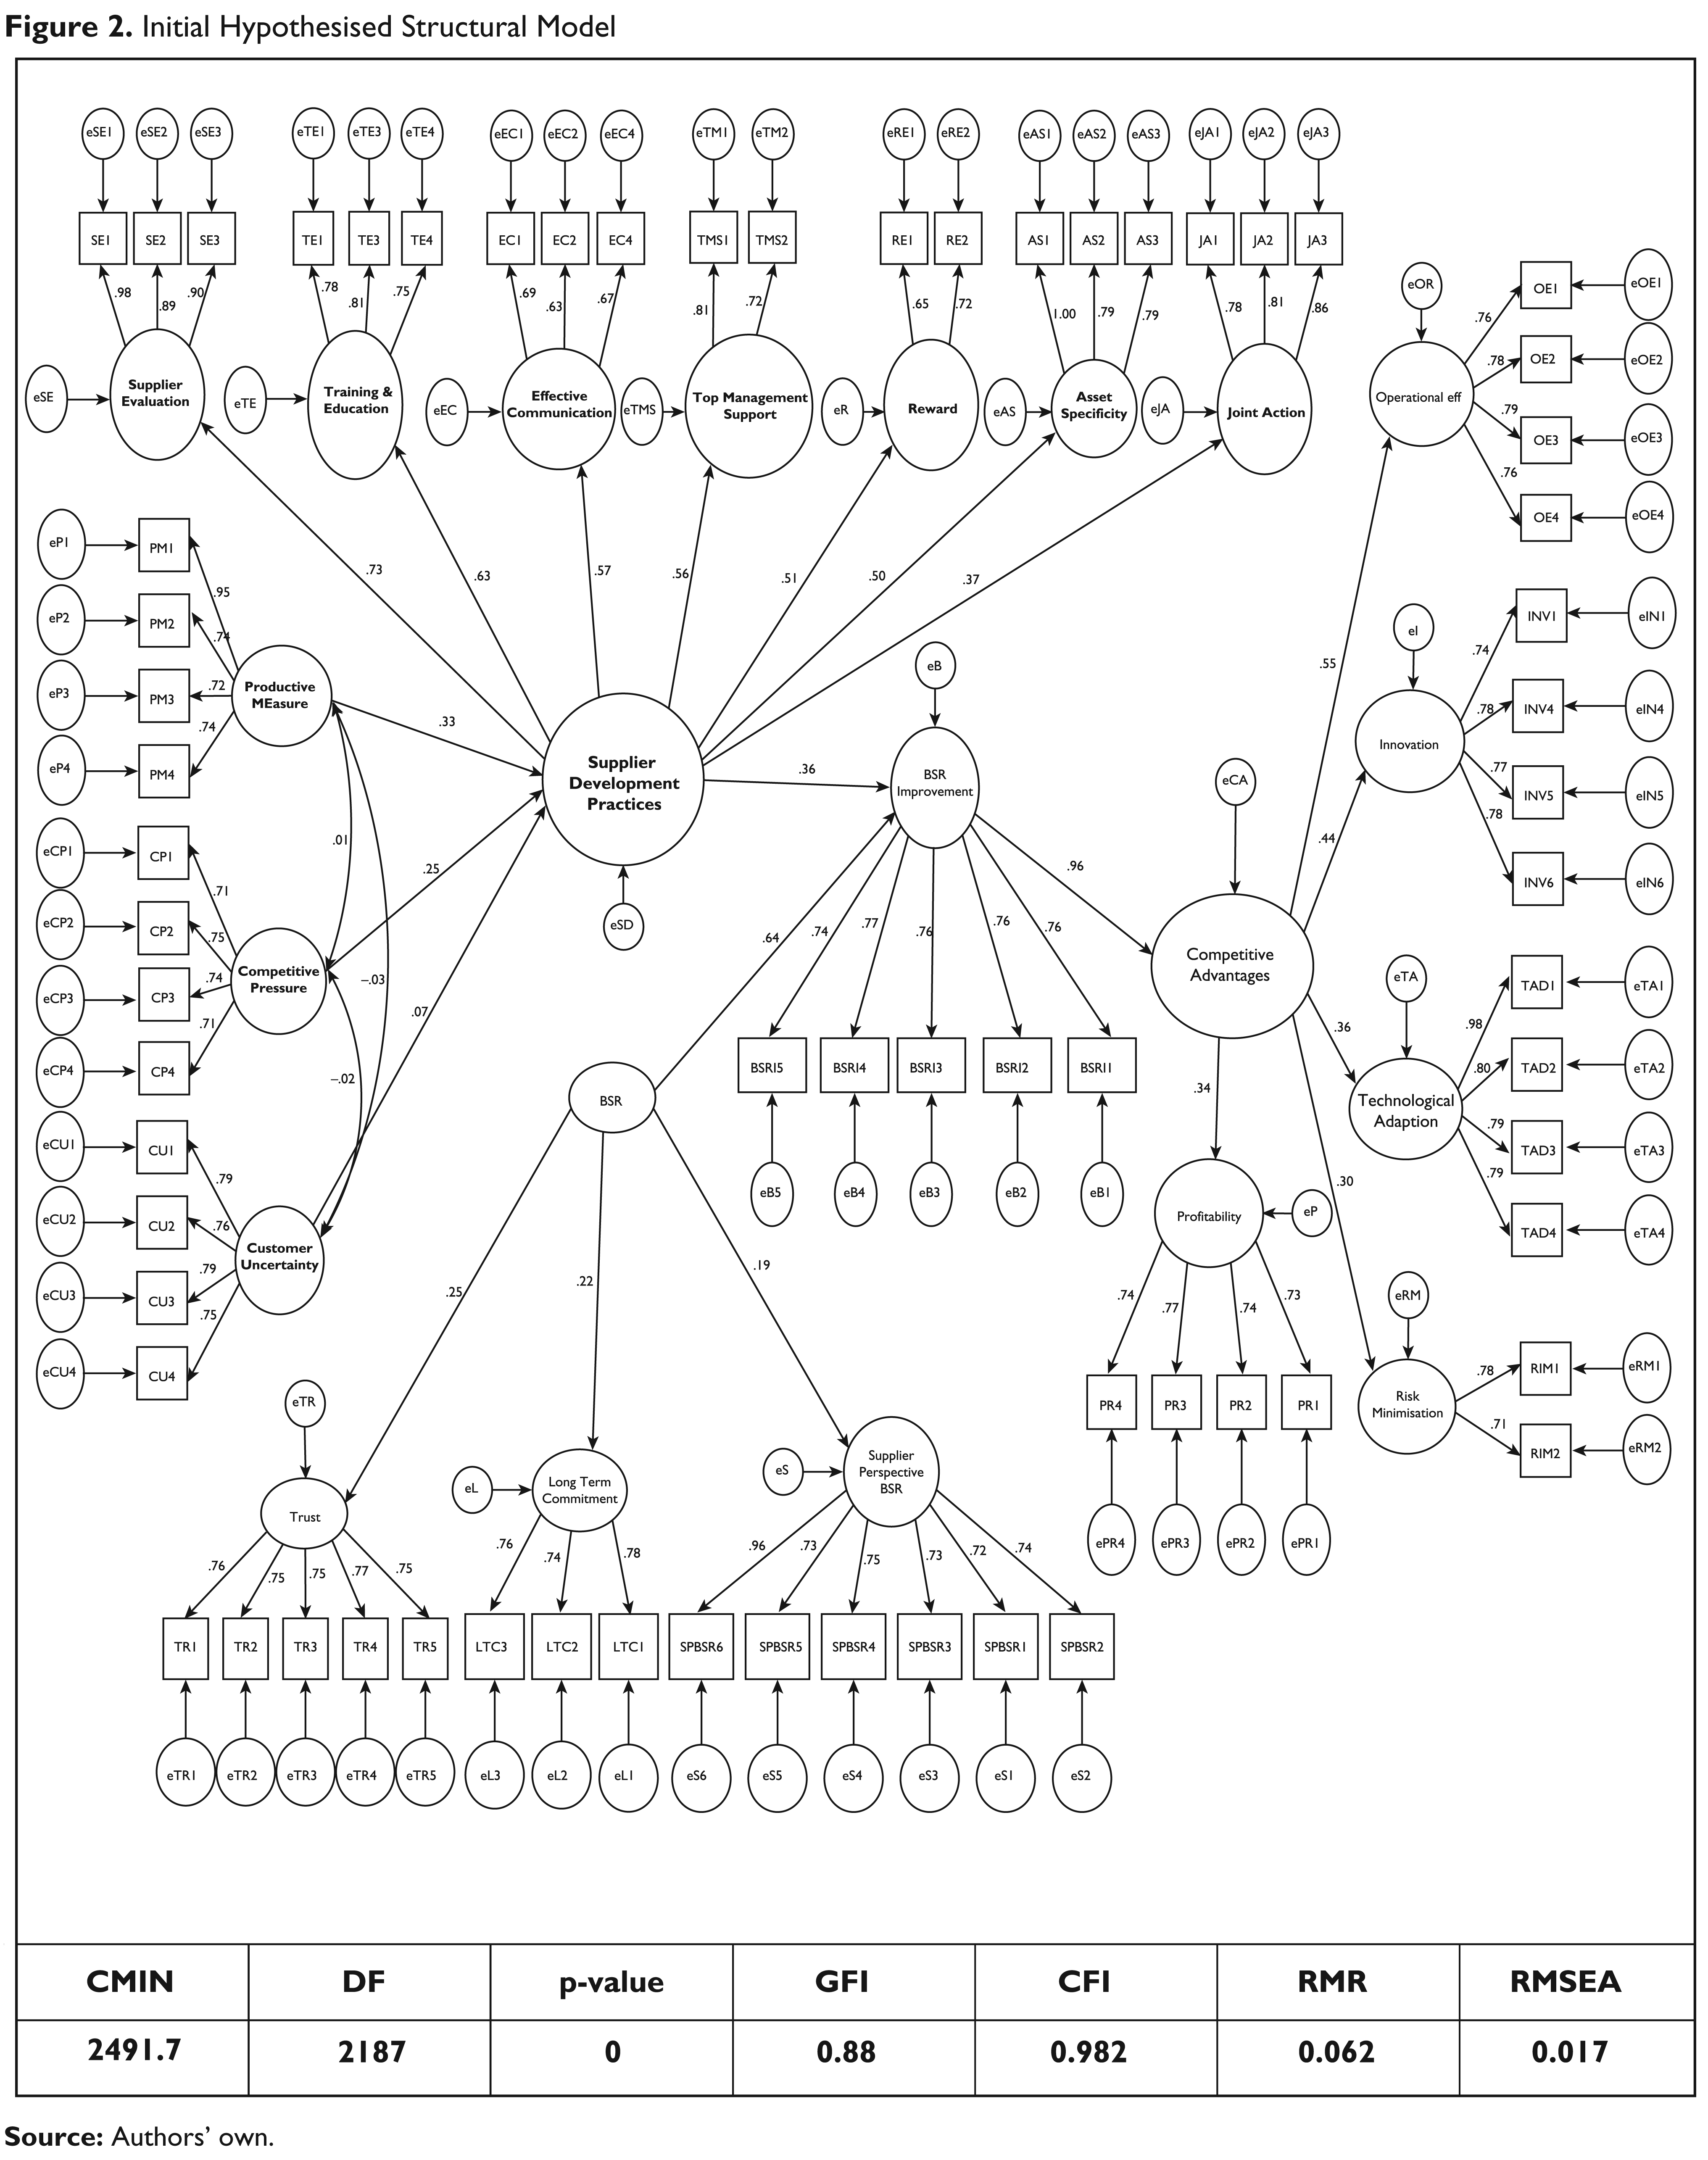
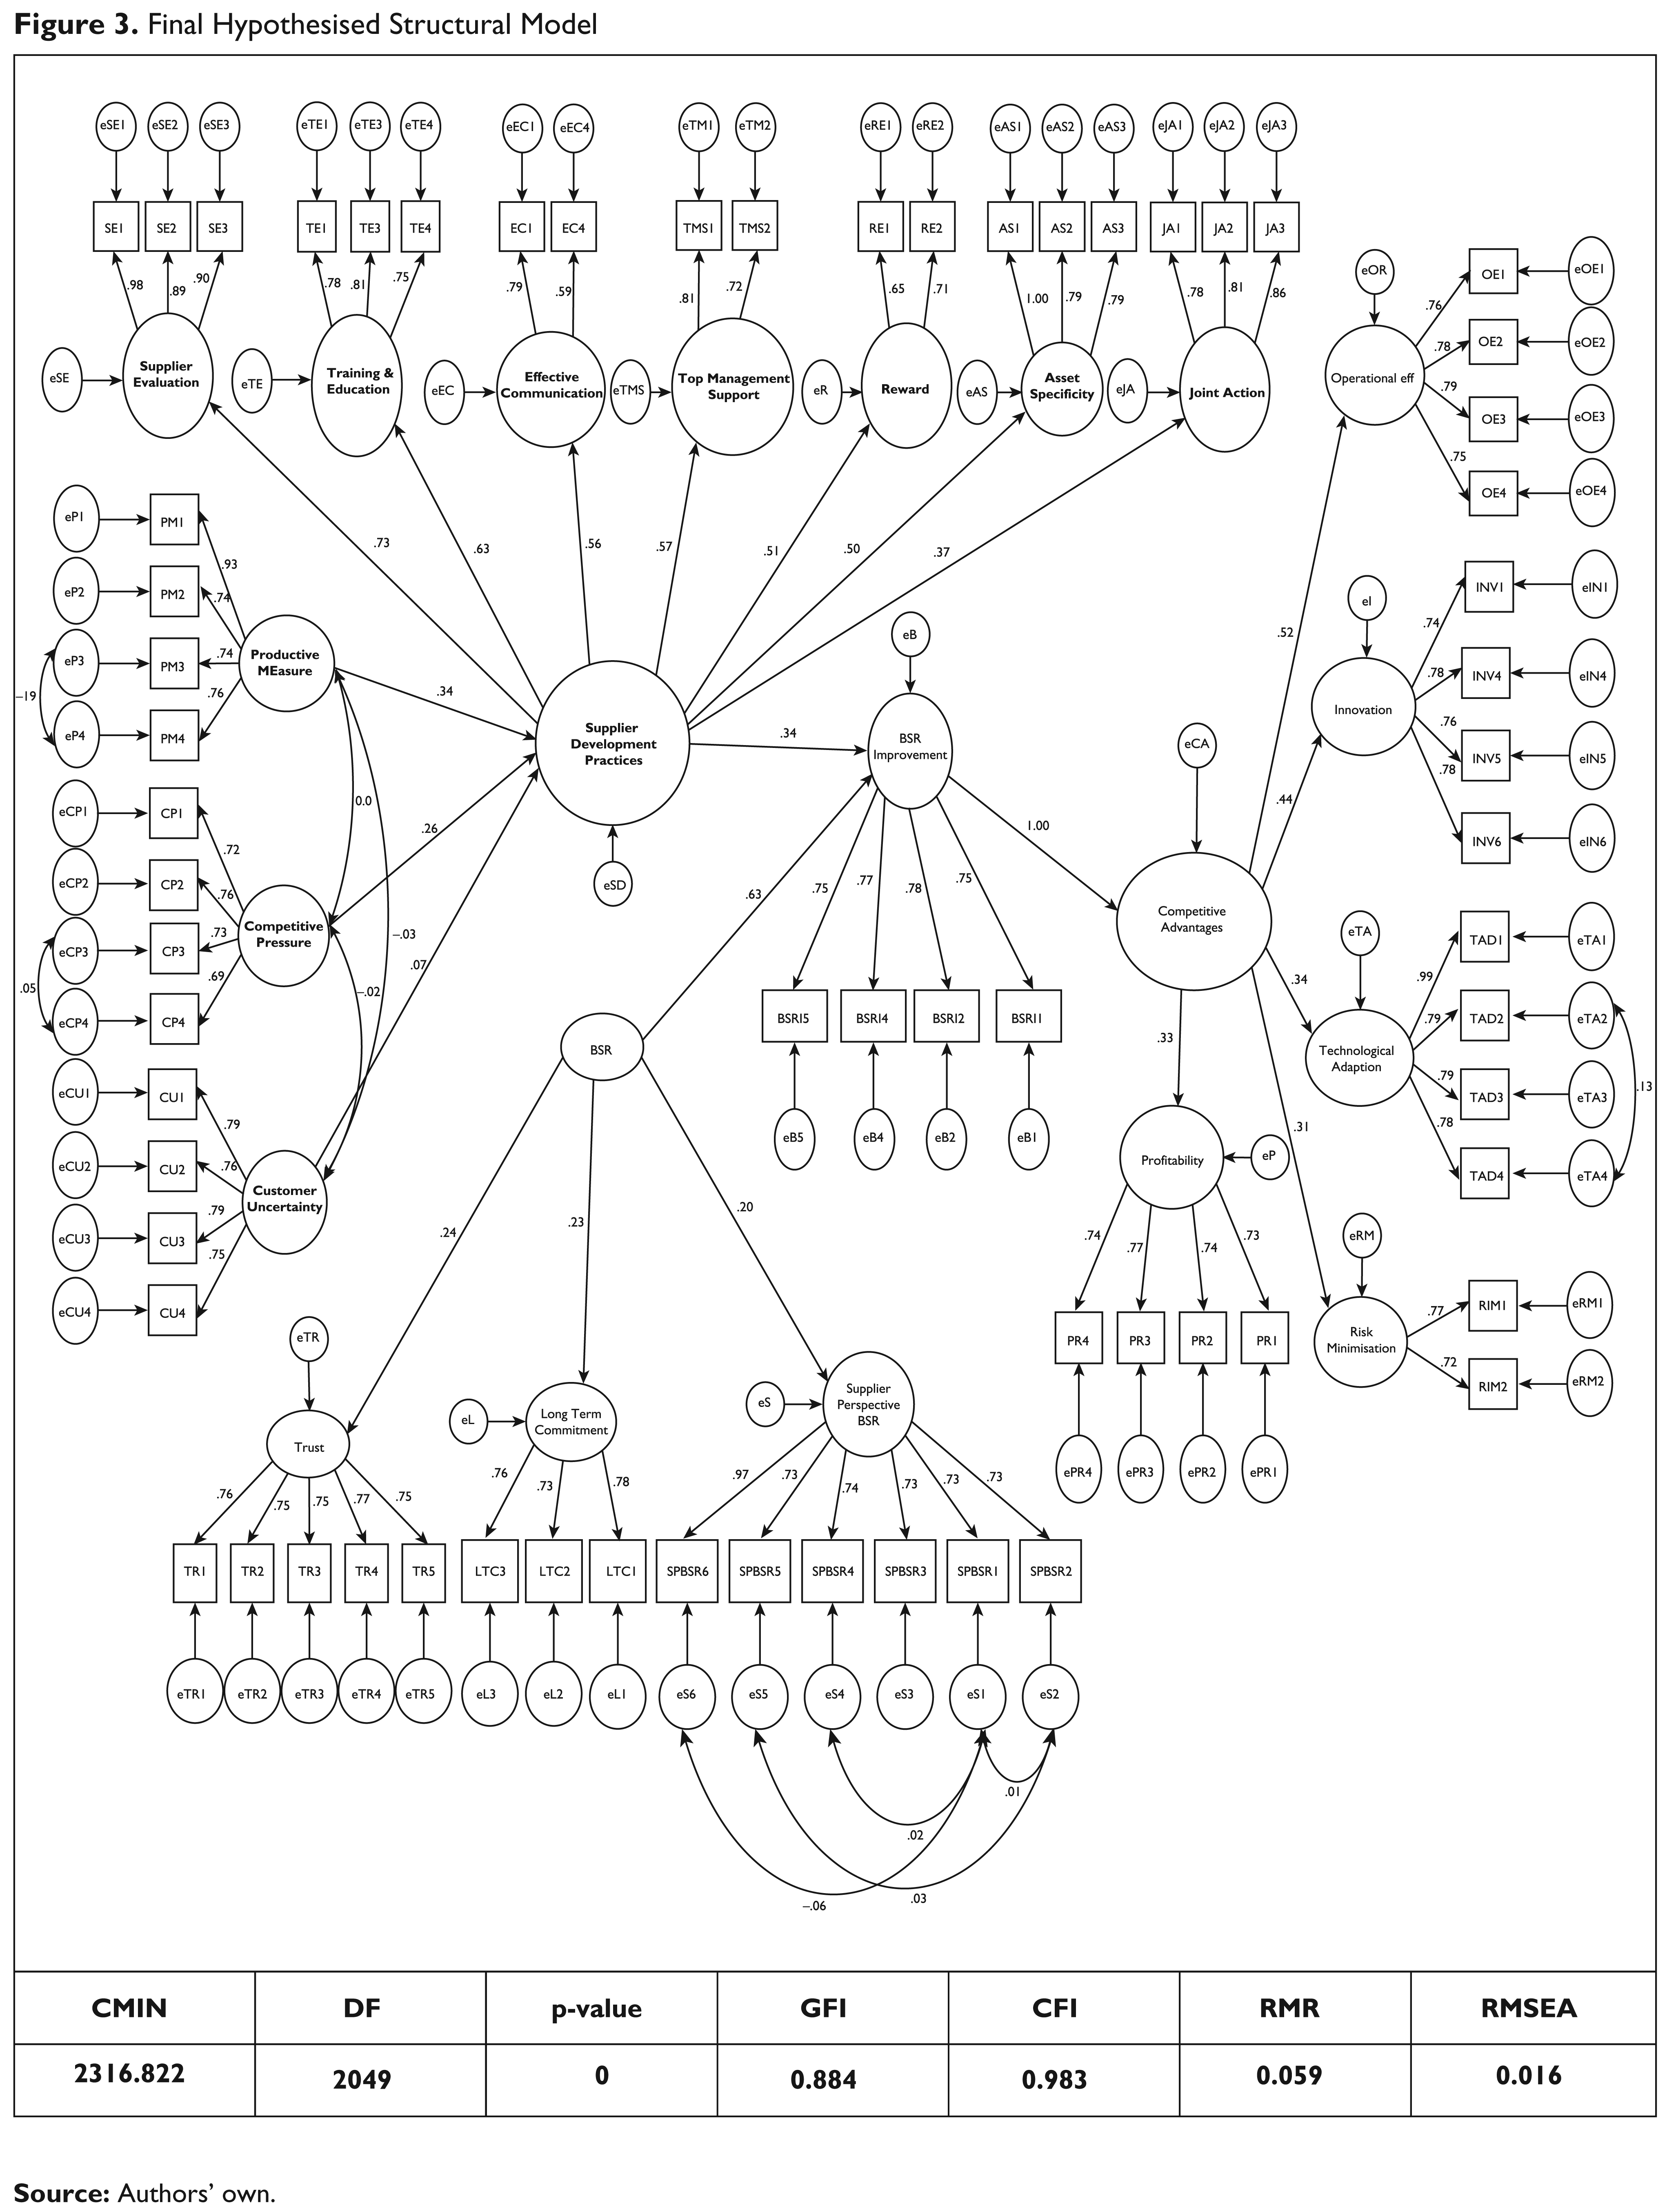
Initially, questionnaire is getting explored and confirmed through EFA and CFA. The next step deals with framing of hypotheses based on the proposed framework and testing them using SEM technique (Hair et al., 2010), employing the maximum likelihood method. Based on the obtained values of fit indices, testing is getting confirmed. First, loading estimates were examined to make sure that they have not changed substantially from the measurement model, indicating parameter stability among measured items, which further supports measurement model validity (Hair et al., 2010). χ2 statistics along with the associated p-value are the measures of overall model fit. In Figure 2, initial causal model for measuring the relationship among different measurement models is summarised. This model was derived on the basis of final CFA model of constructs. The model is reflective due to their interchangeability and high degree of correlation exists between the items of a particular construct. All model fit indices were not found to be satisfactory with respect to their cut-off values (GFI = 0.843, CFI = 0.923, RMR = 0.071 and RMSEA = 0.035). From the obtained fit values, it can be concluded that the proposed model in Figure 2 does not fit with the data well. To obtain satisfactory cut-off values of fit indices there is a need for making modification in the earlier model. In a step-by-step manner, first the correlation path between SPBSR2 and SPBSR5, SPBSR1 and SPBSR4, SPBSR1 and SPBSR2, P3 and P4, C3 and C4, TAD2 and TAD4, and SPBSR1 and SPBSR6 were specified, then the indicator EC2 was deleted due to high standardised residual covariance in the initially hypothesised structural model. After making respective changes in the previous model, new model has been constructed (Figure 3) which demonstrated satisfactory cut-off values of fit indices and mentioned estimates at 95 per cent confidence level (GFI = 0.887, CFI = 0.989, RMR = 0.068 and RMSEA = 0.014).
Testing of Model Hypotheses
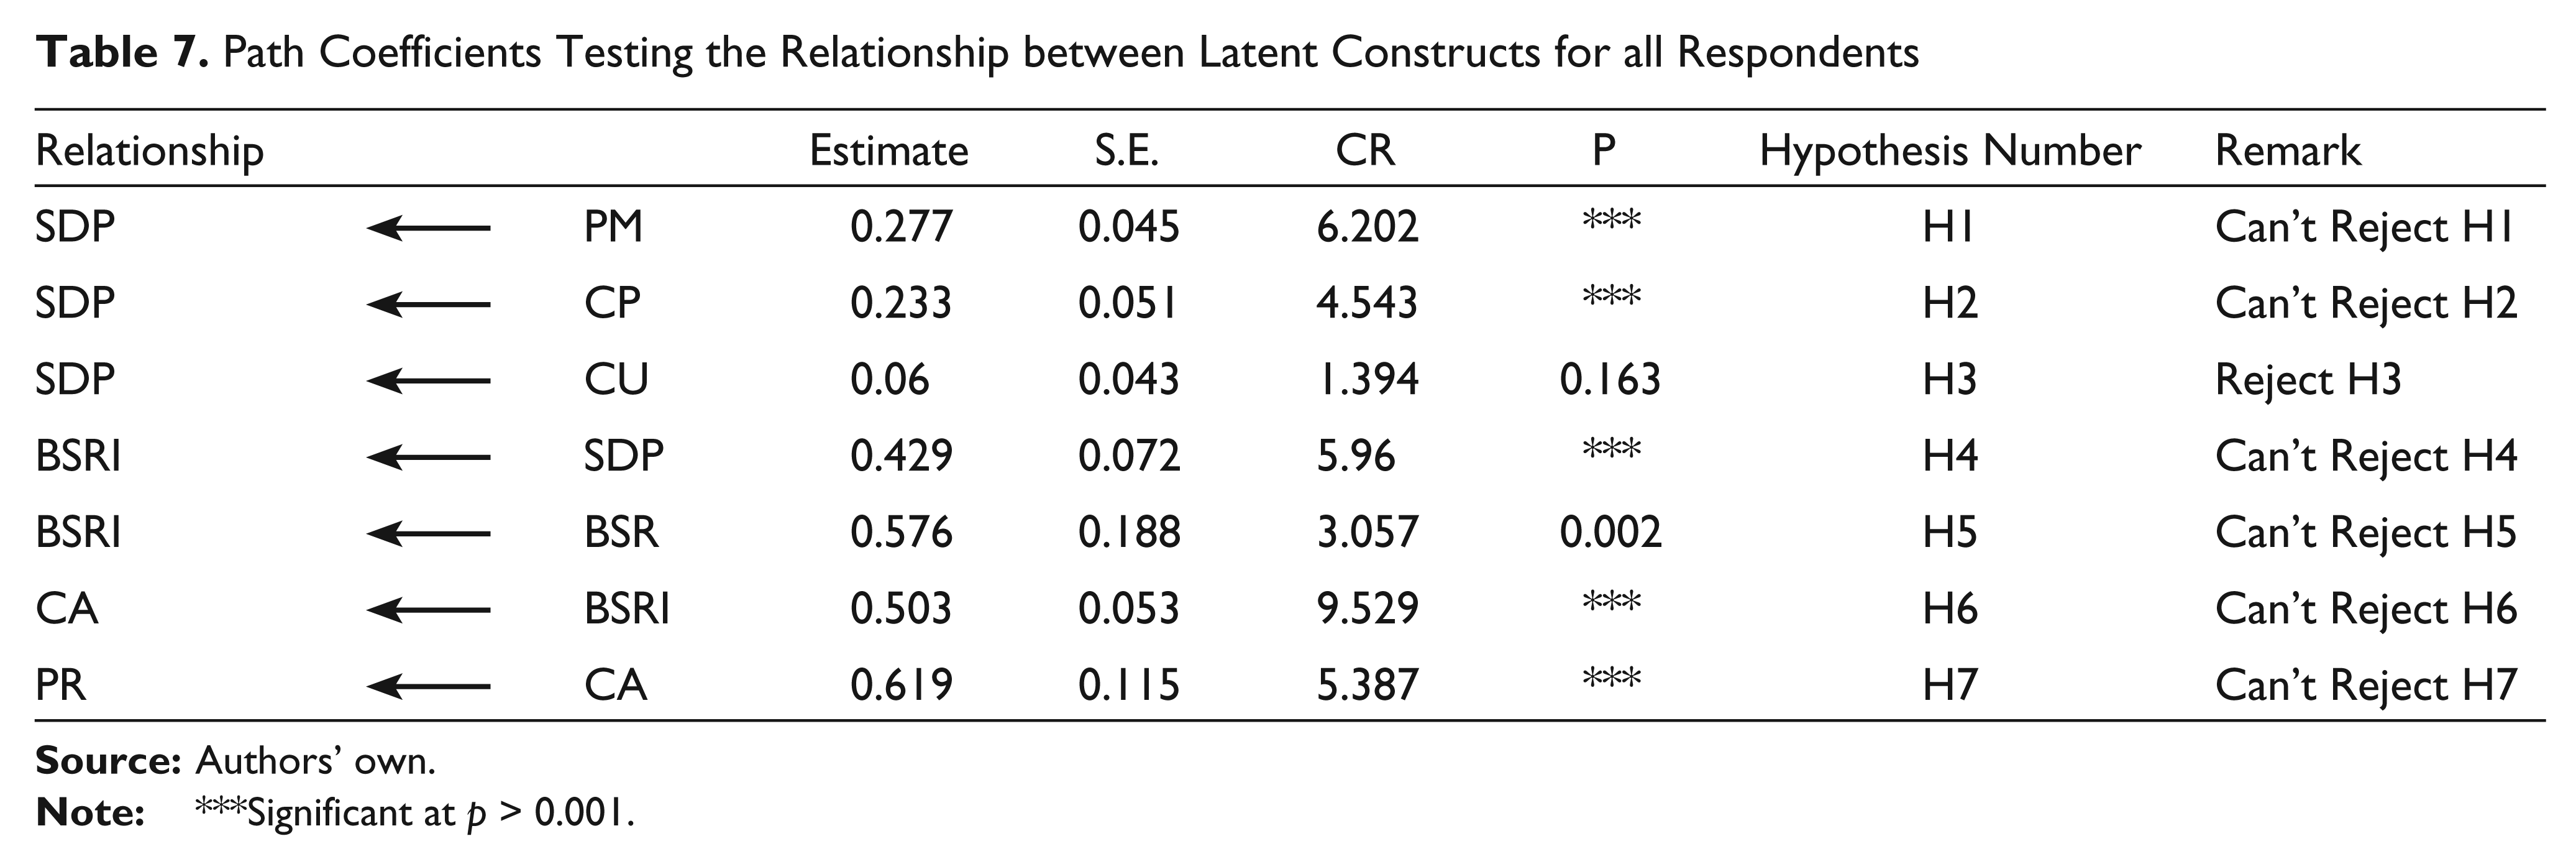
Table 7 summarises the path coefficients obtained after testing the relationship between latent constructs.
Path Coefficients Testing the Relationship between Latent Constructs for all Respondents
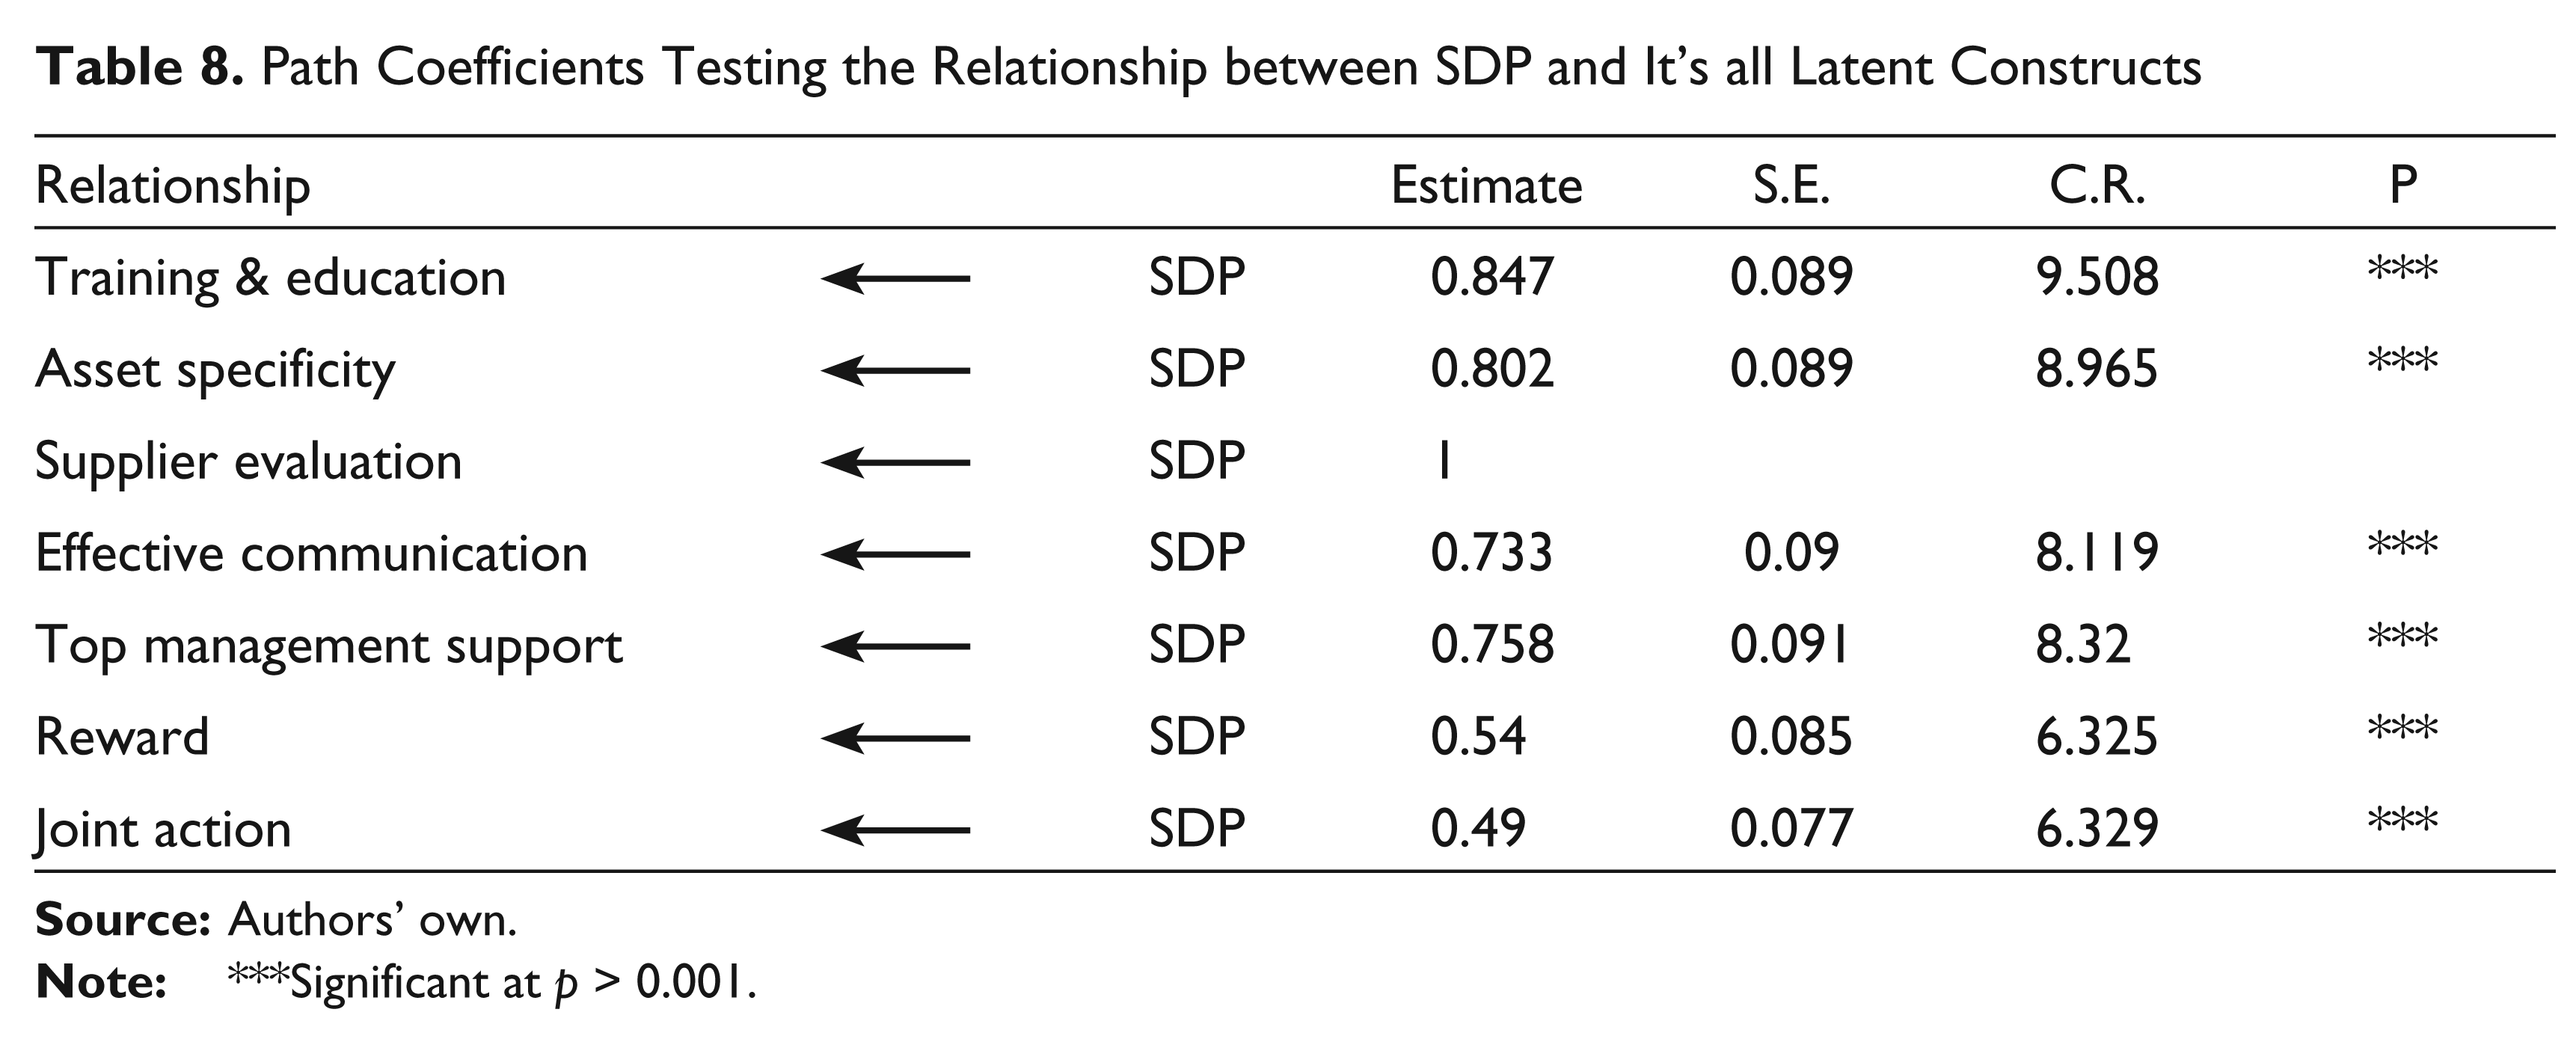
From Table 8, it can be concluded that all seven practices were found to be significant at 95 per cent confidence level.
Path Coefficients Testing the Relationship between SDP and It’s all Latent Constructs
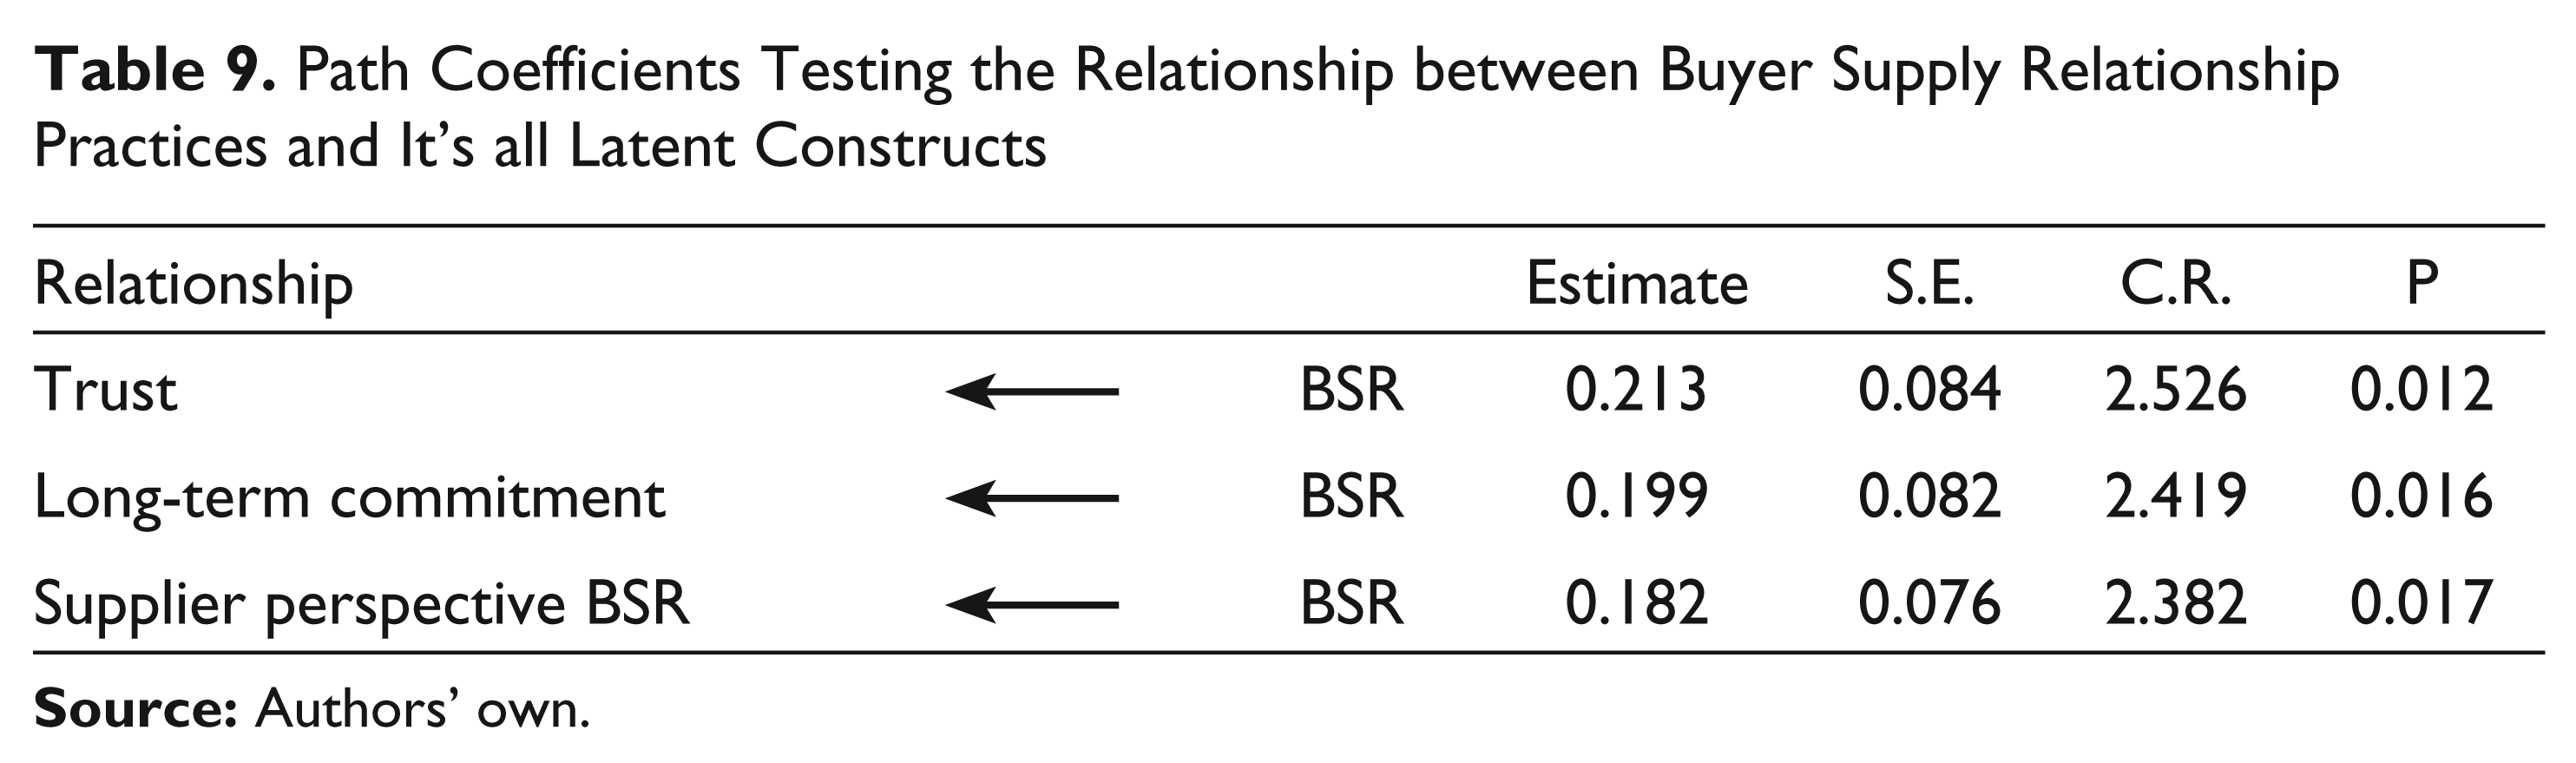
From Table 9, it can be concluded that all the three practices were found to be significant at 95 per cent confidence level.
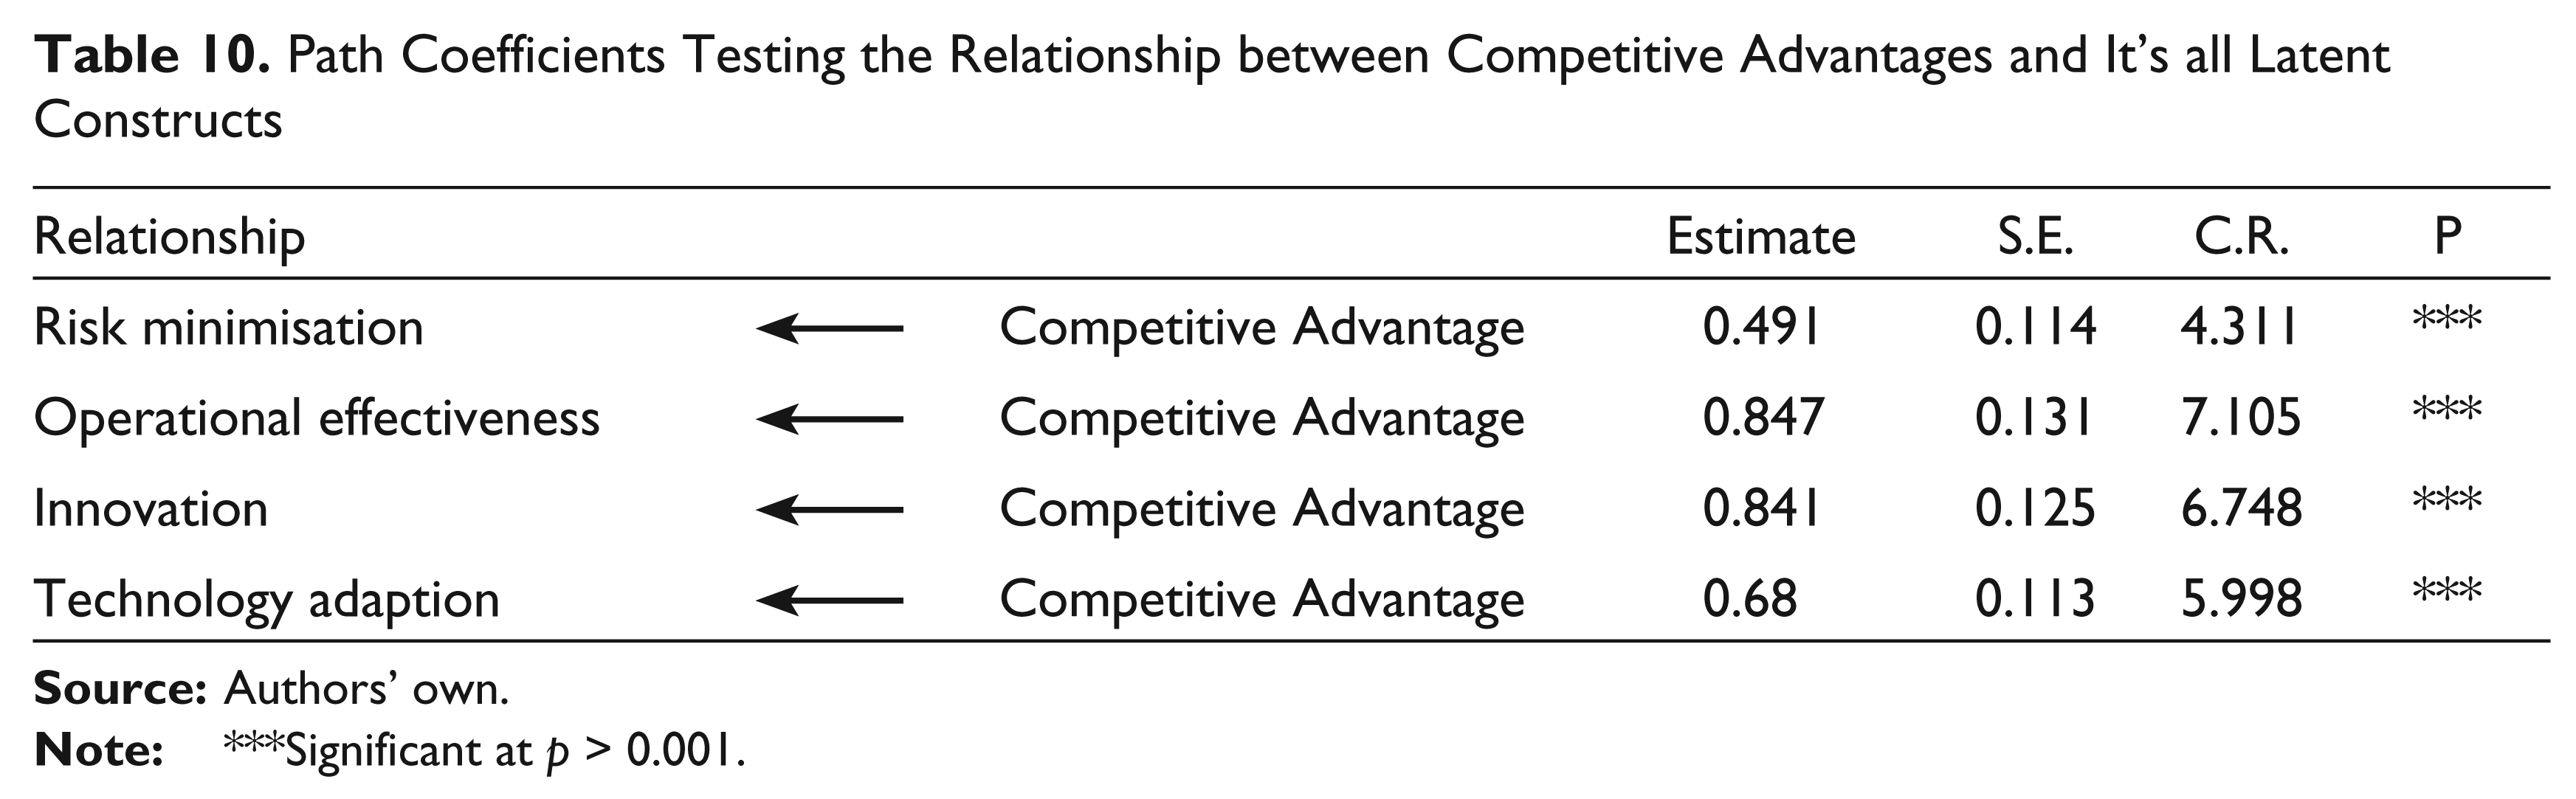
Similarly, from Table 10, it can be concluded that the listed four CAs were found to be significant at 95 per cent confidence level.
Path Coefficients Testing the Relationship between Buyer Supply Relationship Practices and It’s all Latent Constructs
Path Coefficients Testing the Relationship between Competitive Advantages and It’s all Latent Constructs
Conclusions
It is found that two drivers, namely, Productive Measures like quality, cost, rejection rate and engineering level, came out to be significant along with second driver as Competitive Pressure of rivals, which are forcing buyer for SDP. Another driver of CU is not found significant for SDP. Based on stable market regarding respective product, PM came out to be significant and the focus of buyer is more on selling their product with low cost and improved quality due to which pressure of competitors came out to be significant and, as said, due to stable market, CU is found to be insignificant here. The study listed seven supplier development programmes, which were found to be significant for improving the performance of supplier as SE, TE, TMS, EC, AS, JA and RE.
For being competitive in market, it is necessary for buyer that their supplier group should be moved for incremental INV, new TAD and OE. As discussed above, SDP plays a key role for such CAs, but there may be a rising threat of supplier switching and data leakage after development of supplier.
It is necessary for buyer to minimise such threats and to promote factors like INV, new TAD and operational excellence for creating long-term relationship through mutual understanding. The study results also depicted that CA boosts up with the linking of BSRP with supplier development programme. Further TR, LTC and suppliers perspective are found to be highly significant. The results of the current study revealed that buyer should not only think about only SDP but also work for BSRP. Together these practices with consideration of suppliers perspective will not only make buyer competitive but will also make supplier to think that the buyer treats us as a valuable supplier and as supplier, we should stand with buyer for giving a better quality to customer.
Managerial Implications
TMS plays a crucial role along with EC for effectively implementing SDP. As EC between buyer and supplier increases, it leads to JAs which can be termed as early supplier involvement for making better product to satisfy end user. Continuous evaluation is necessary to sharpen the performance of supplier and giving RE for performance, which improves the morale of supplier for the betterment of both parties.
A manager should analyse that CA and RIM can be achieved through improvement in relationship between them. SDP along with relationship practices leads to improvement in relationship, leading to CA. For BSRP, obtained results suggest that TR and LTCs are important factors for relationship improvement. Apart from this, buyer should also be aware of supplier’s perspective towards the relationship. If buyer analyses the supplier’s perspective, mostly in terms of his profit, business growth and his views about buyer and if buyer is fulfilling supplier’s perspective and treating him as a valued supplier, then supplier will also treat that buyer as a valued buyer and will perform better in any situation. This improved relationship will help to achieve diversified range of products to customer along with CA, which will lead to the PR and growth of both parties.
Limitations
Although, the current study presented significant results in the domain of buyer–supplier relationship, it is not without limitations. First, the current study was carried out where the product was stable and established. Second, buyers and suppliers selected were well established and were manufacturing the respective product from considerable time. In future, studies should address these shortcomings to enrich the domain of buyer–supplier relationship and its improvement, leading to CA and PR. This will also support the framework proposed in the current study to be generalised at large level.
Further, the end user is supposed to be selecting the product from the available range. INV considered was incremental INV, not sudden/drastic INV. Incremental INV is for giving diversified and new product with added or improved features/performance to the end user. Buyers selected were having expectations from suppliers focusing on cost-cutting with improved quality and performance. Thus, the result may vary for different products depending upon market conditions, constraints of place, type of buyer, supplier and end user.