
Abstract
Working capital is one of the important measures of a firm’s efficiency and represents the total liquid assets available with a firm. It reflects a firms’ ability to meet day-to-day operating expenses and also acts as an indicator of a firm’s short-term financial health. So a firm has to plan the effective utilisation of its working capital in order to maintain equilibrium between liquidity and profitability of the business. Therefore, the present article tries to examine the impact of working capital management on profitability of the firms of Indian steel industry. The study has taken into consideration four independent variables, that is, Current ratio, Quick ratio, Debtors turnover ratio and Finished goods turnover ratio which act as the indicators of working capital use in the industry. Return on total assets represents the profitability of the industry and acts as a dependent variable to develop an empirical model in order to establish relationship between working capital management and profitability of the steel industry in India by using panel data regression. The period of study is 17 years, that is, 2000–2016. The result of the study indicates that the impact of working capital management on profitability of the firms of Indian steel industry has been significant.
Introduction
The financial management decision of a firm has four aspects, which include investment decision, financing decision, dividend decision and liquidity decision. The working capital management is considered to be a vital issue in liquidity and short-term investment decision of the firm. It has an effect on liquidity as well as on profitability of the firm. The value of the firm is being created by optimal working capital management (Bagchi & Khamrui, 2012).
The term working capital refers to the quantum of fund required to maintain day-to-day expenditure on operational activities of a business enterprise. It is actually required to run the wheels of the business (Mandal & Goswami, 2010). Working capital management objective is to maximise the profits, which results into reducing the risk of not able to satisfy the maturing short-term debt. The efficacy of working capital management depends on the balance between liquidity and profitability (Faulkender & Wang, 2006). A firm’s high liquidity risk results in high profitability. The issue here is in managing working capital, a firm must take into consideration all the items in both accounts and try to balance the risk and return.
Among all the industries of the country, iron ore and steel industry is one of the basic industries which plays an important role in strengthening the economy. India holds third largest position in crude steel production in the world (up from eighth in 2003) and India overtook Japan to become the second-largest steel producer in the world after China in 2016, according to the data released by the International Stainless Steel Forum (ISSF). ISSF said at their annual conference in Tokyo, Japan that India’s stainless steel production rose to 3.32 million tons for 2016, showing an impressive growth of about 9 per cent over 3.0 million tons achieved in 2015.
The present study focuses on the management of working capital and its relationship with profitability of the firms in steel industry of India. We can, therefore, expect that the way in which working capital is managed will have a significant impact on the profitability of firms. Both ways, whether it has a positive impact or a negative impact, it affects the overall efficiency and profitability of firms (The Hindu, May 22, 2017).
The study is being presented in six sections, the second section relates to the literature review which contains the literature regarding the working capital management on profitability. The third section discusses the objective of the study. The fourth section discusses the methodology which describes the data source and the method applied for the analysis and the empirical model justification with the hypotheses of the study. The fifth section shows the results which include the analysis and the inferences of the study. The concluding observations are summed up in the sixth section.
Literature Review
The significance of working capital management has been a common opinion among researchers. It was observed by Venkatraman and Ramanujana (1987) that business economic performance is being measured by using sales growth, net income growth and return on investment. Raheman, Afza, Qayyum, and Bodla (2010) analysed the working capital management practices and their impact on corporate performance. They took a sample of 204 manufacturing firms of Karachi Stock Exchange for the period 1998–2007 and found cash conversion cycle, net trade cycle and inventory turnover affecting the performance of the firms significantly. It was analysed by Van Horne and Wachowicz (2004) that excessive level of current assets may have a negative impact on a firm’s profitability. Ghosh (2007) analysed in his study working capital management practice in four different industries: (a) National Fertilizer Limited (b) Textile Industry (c) Cement Industry and (d) Pharmaceutical industry; and included the objectives like to control source and size of working capital with a review made in 98 small-scale textile firms of Punjab. The study concluded other than the own capital, bank loans are the most projecting source of working capital among most of the selected units.
It was examined by Bose (2013) that the working capital management impacts on firms’ profitability. It was found in the study that in the electric equipment sector source of the working capital management components widely vary. Kaur and Singh (2013) study examined that the efficiency and profitability can be managed through working capital management. Their findings were in support to the earlier studies that efficient management of working capital significantly impacts profitability. Also Kumar and Ramanan (2013) supported that there has been an impact of working capital management on profitability of manufacturing firms. They found a positive relationship between profitability and debtors’ day and inventory days.
The influence of working capital management on the firm’s liquidity, profitability and non-insurable risk was examined by Mandal and Goswami (2010). This was a case of ONGC, a leading public sector enterprise in India. The study also stated that in order to achieve the goal of the organisation, liquidity and profitability have to be considered. Both liquidity and profitability are interrelated to each other. Moreover, the risk dimension of liquidity has an impact on the measurement of overall performance of the risk. Sharma and Kumar (2011) investigated for 263 Indian firms for the period 2000–2008, and inferred the link between the working capital management and profitability of the firm. The study found a positive relationship between profitability and number of days accounts receivables whereas a negative relationship with number of days accounts payables. The evidence is mixed on whether a relationship exists. Whereas, Bagchi and Khamrui (2012) investigated and found that there is a strong negative relationship between variables of the working capital management and profitability of the firm. The study also stated that there is a negative relationship between debt used by the firm and its profitability.
Working capital management is often a dilemma between the liquidity and profitability. The present study has made an attempt to find out an optimum solution to the problems of working capital management by identifying the gap in the previous research findings mentioned earlier. Previous research studies show that the working capital management practices of the industries have contradictory impact on the profitability. Some of the research findings stated that the debtors’ days and inventory days have positive impact on profitability whereas some research findings stated the level of current assets and number of days accounts payable have negative impact on profitability. This encouraged us to make an attempt to establish an empirical model of working capital management effect with respect to liquidity aspect and operational activities of the firm on profitability with respect to Indian steel industry. This study will be a source of material for future research to the related topics also. The findings of the study can be helpful to come up with planning for the working capital business models.
Objectives of the Study
The broad objective of the present study is to identify the effect of working capital management on firm’s profitability in steel industry, especially in the Indian context.
Methodology: Data Source, Sample Frame and Empirical Model
The analyses of data involve descriptive and panel data analysis which has been used to establish an empirical model which in turn establishes the relationship between working capital management and profitability of the steel industry in India.
Where ‘i’ represents number of firms and ‘t’ represents number of years. β0, β1, β2 and β3 represent coefficient of explanatory variables. ‘εit’ represents the error term.
According to Greene (2008), the main advantage of panel data is that one can formally model the heterogeneity across groups that are typically present in panel data. Baltagi (2005) confirms this in his statement that the first benefit of panel data is ‘controlling for individual heterogeneity’.
Choice of Variables
The regression model that we aim to predict has a dependent variable, proxy for firm’s profitability and independent variable, proxy for working capital. The dependent variable for the study is return on total assets (ROA) which has been calculated as a ratio of profit after tax on total assets of the firm and indicates the profitability measure of the firm. The independent variables selected for the study include the quick ratio and current ratio which indicate the liquidity position of the firms and the debtor turnover ratio and finished goods turnover ratio indicate the turnover and operational activities of the firms. The details are mentioned in the following:
QR is the quick ratio of the firm which is stated as current assets–inventories) on current liabilities; CR is the current ratio of the firm stated as ratio of current assets to current liabilities; DTR is debtor turnover ratio which is calculated as net sales by average debtors; and FGTR is the finished goods turnover ratio which is sated as a ratio of cost of finished goods on average finished goods inventories.
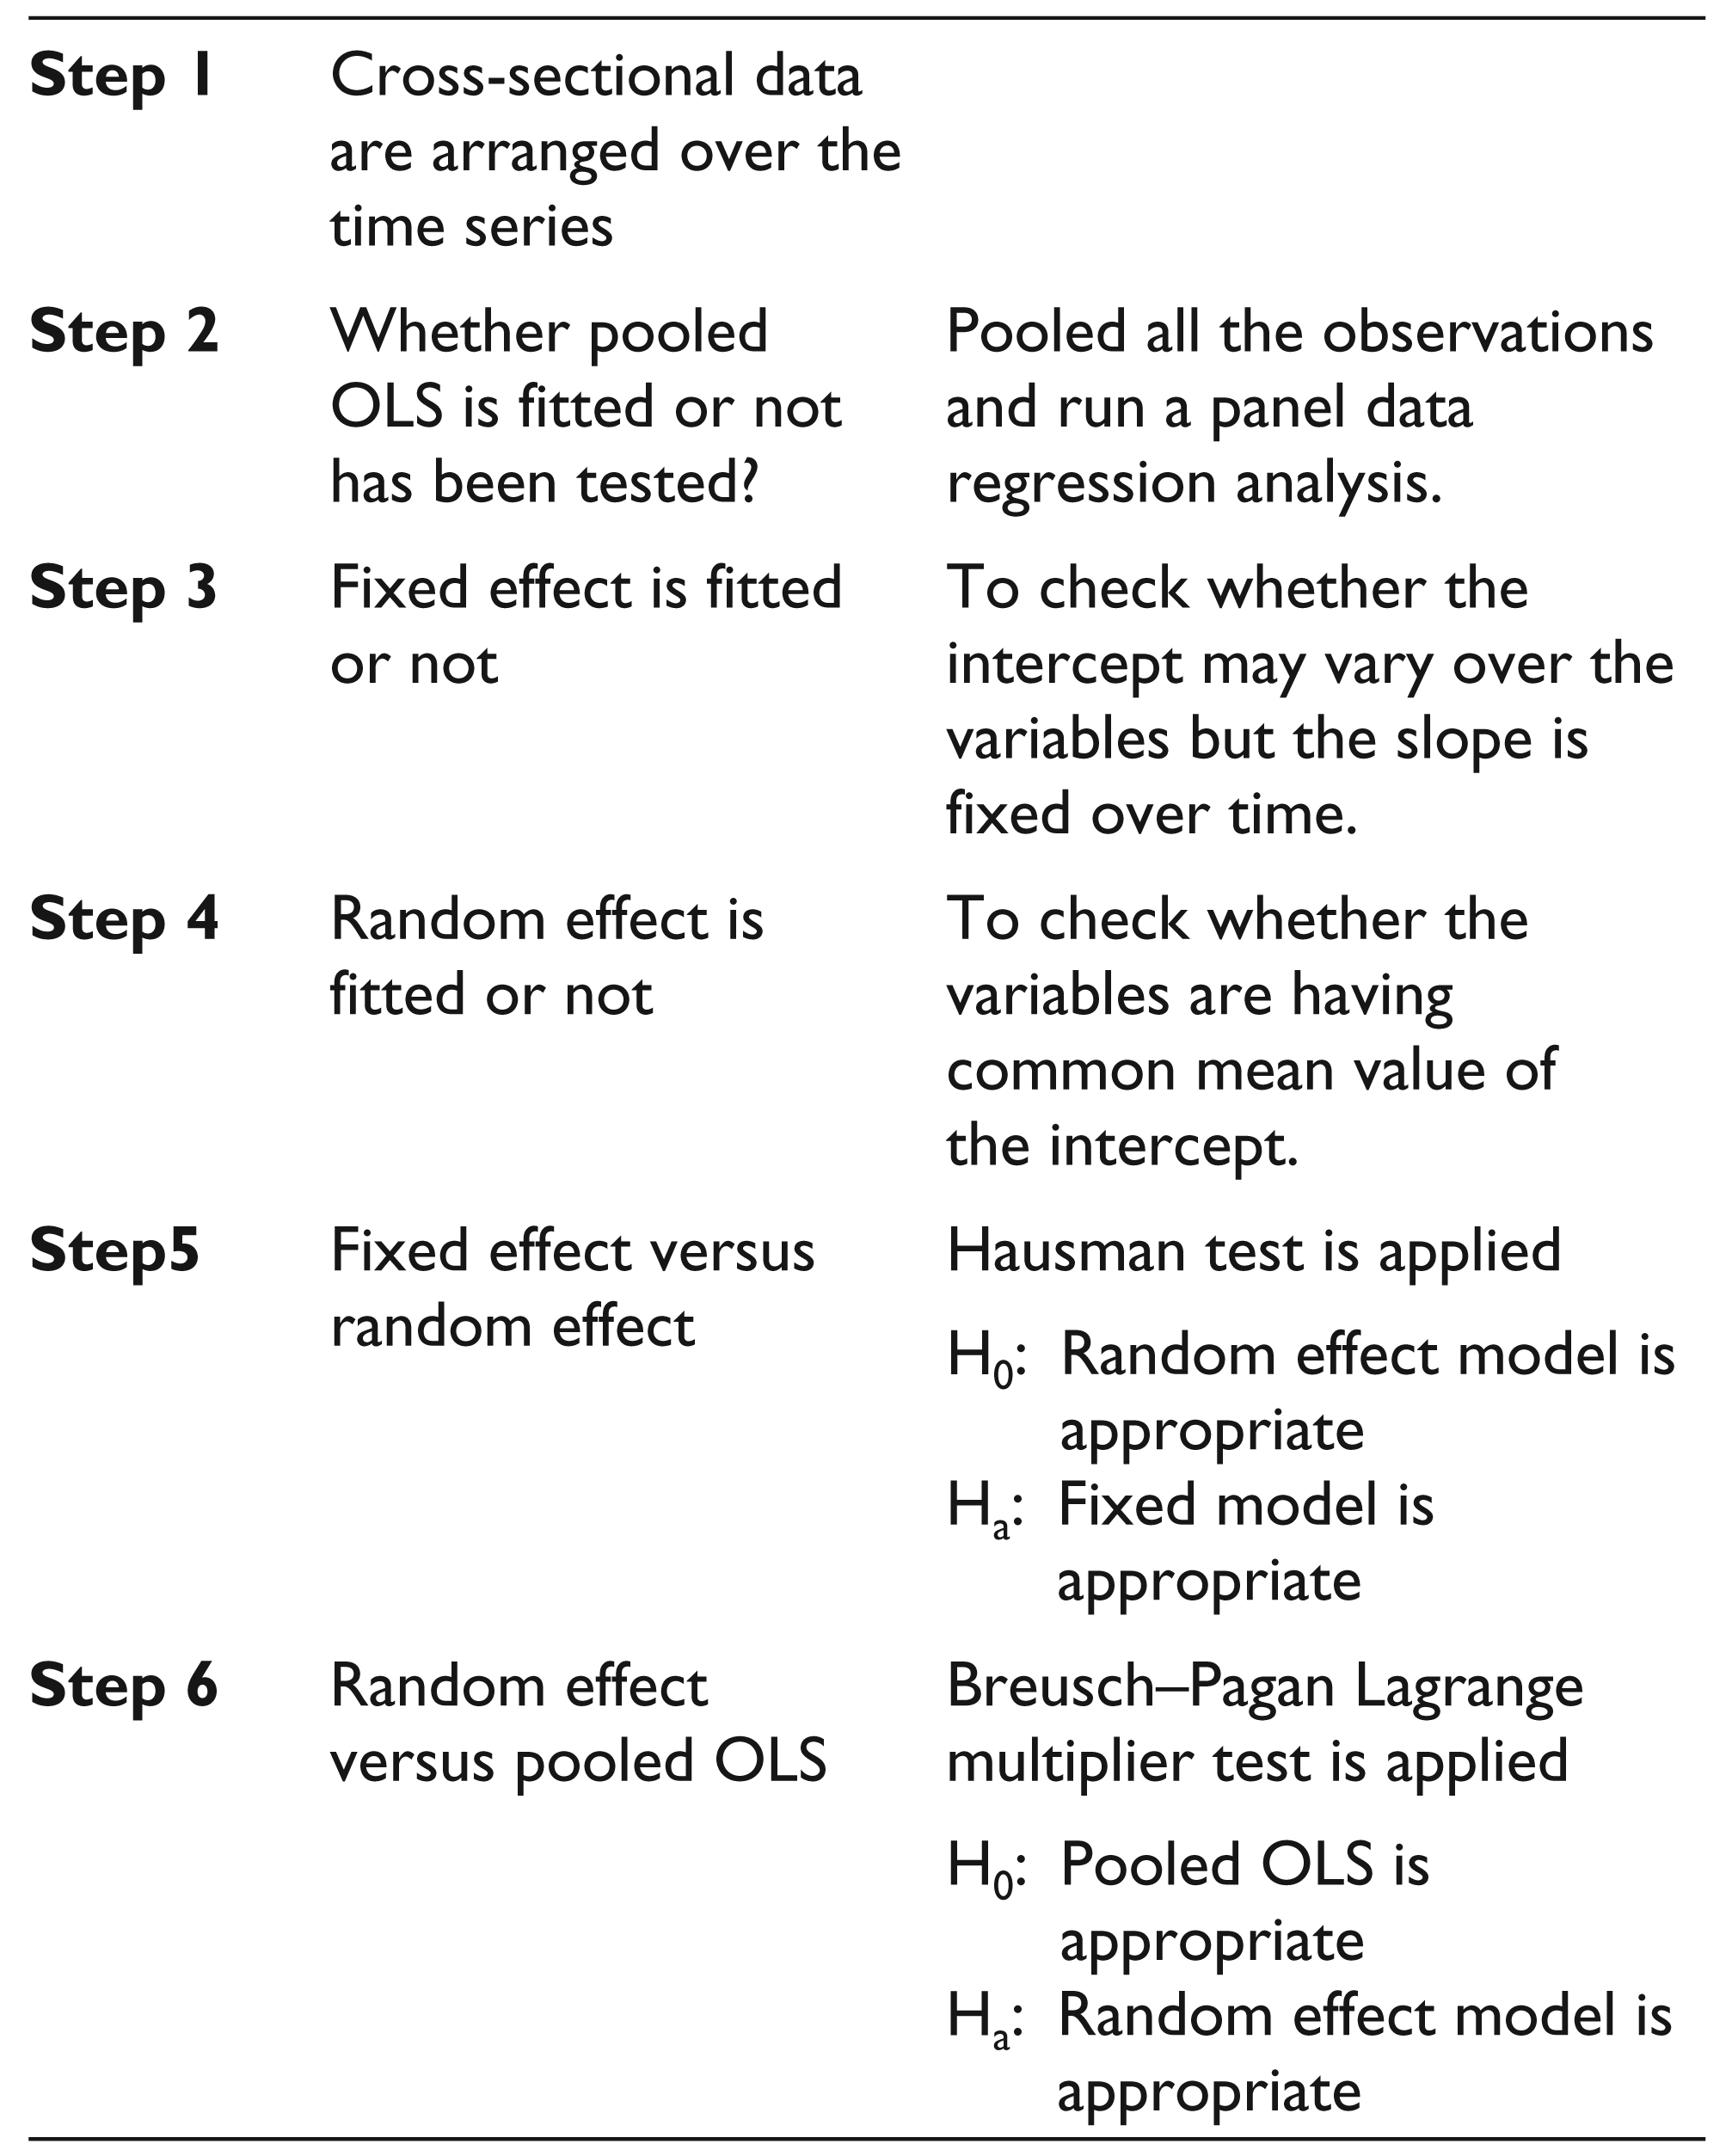
Steps to Develop the Model
Hypotheses of the Study
The following hypotheses guided the study:
H1: There is no significant relationship between QR and ROA. H2: There is no significant relationship between CR and ROA. H3: There is no significant relationship between DTR and ROA. H4: There is no significant relationship between FGTR and ROA.
Analysis and Findings
Nature of the Data
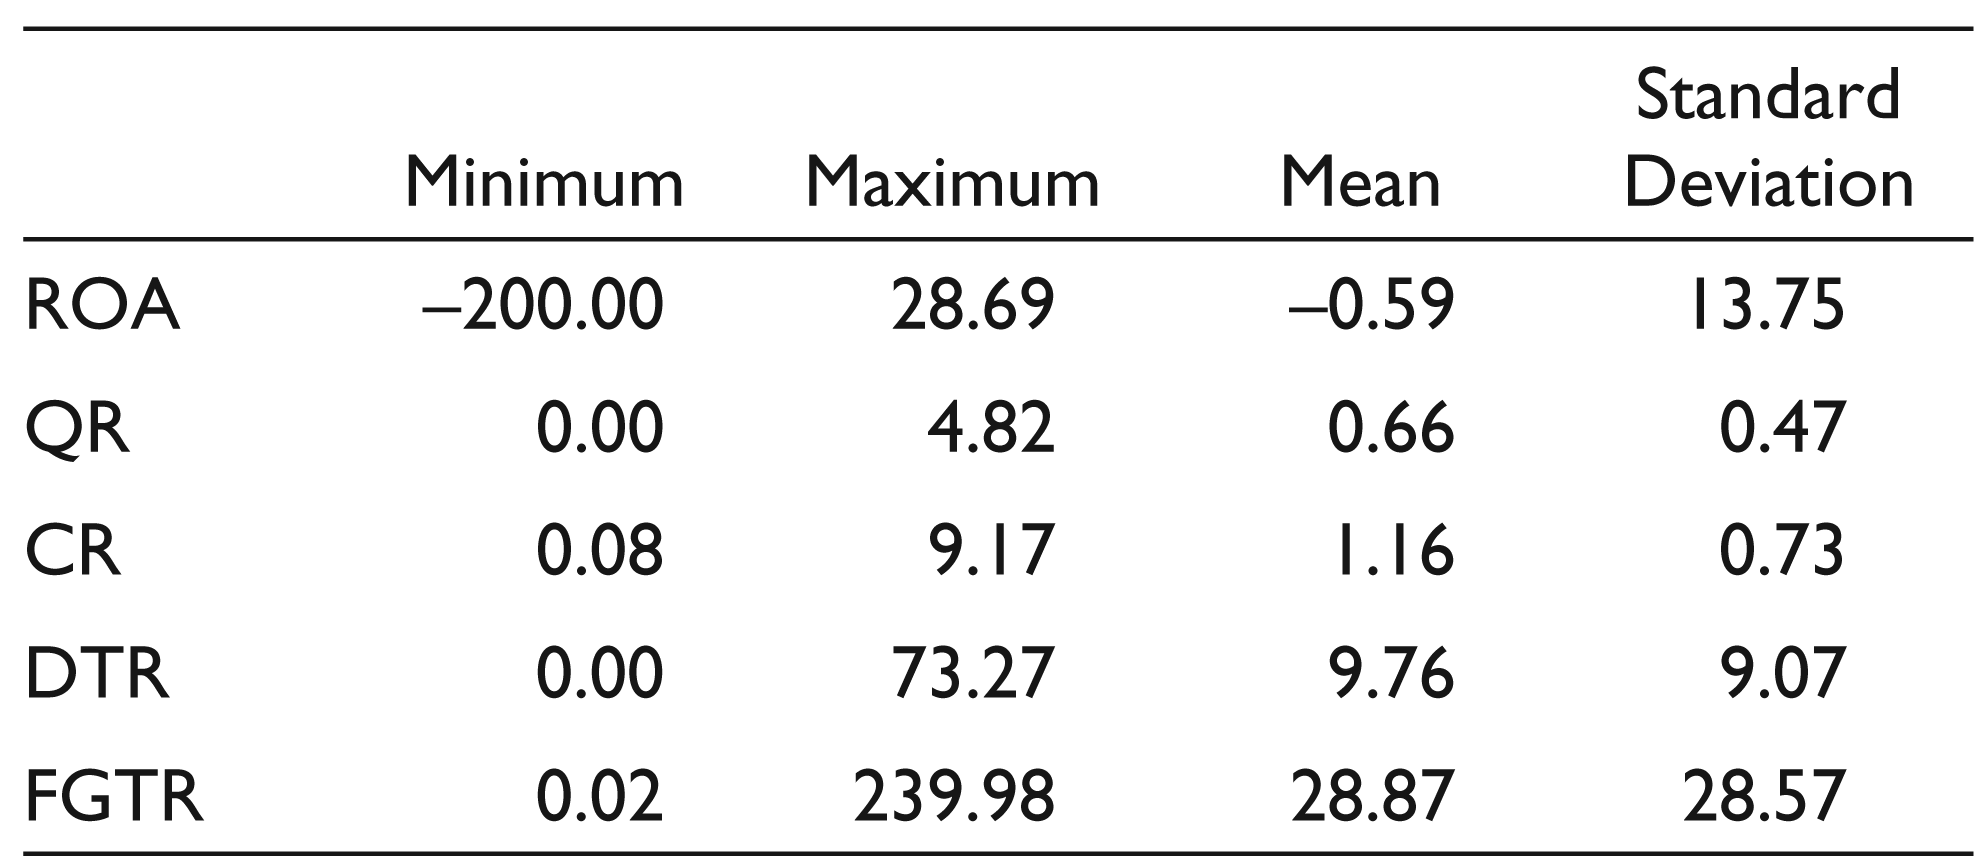
Table 1 shows the nature of the variables by using the descriptive statistics. It is evident from the result that there is a wide variation in the variables across the companies during the period. The ROA maximum and minimum values are 28.69 and negative value of 200. While analysing the working capital variables, it was clear that different companies have employed different working capital measures. The highest variation was seen in FGTR where the maximum value is 239.98 and minimum value is 0.02 with mean score being 28.87.
Descriptive Statistics of the Steel Industry in India
Test of Multi-collinearity
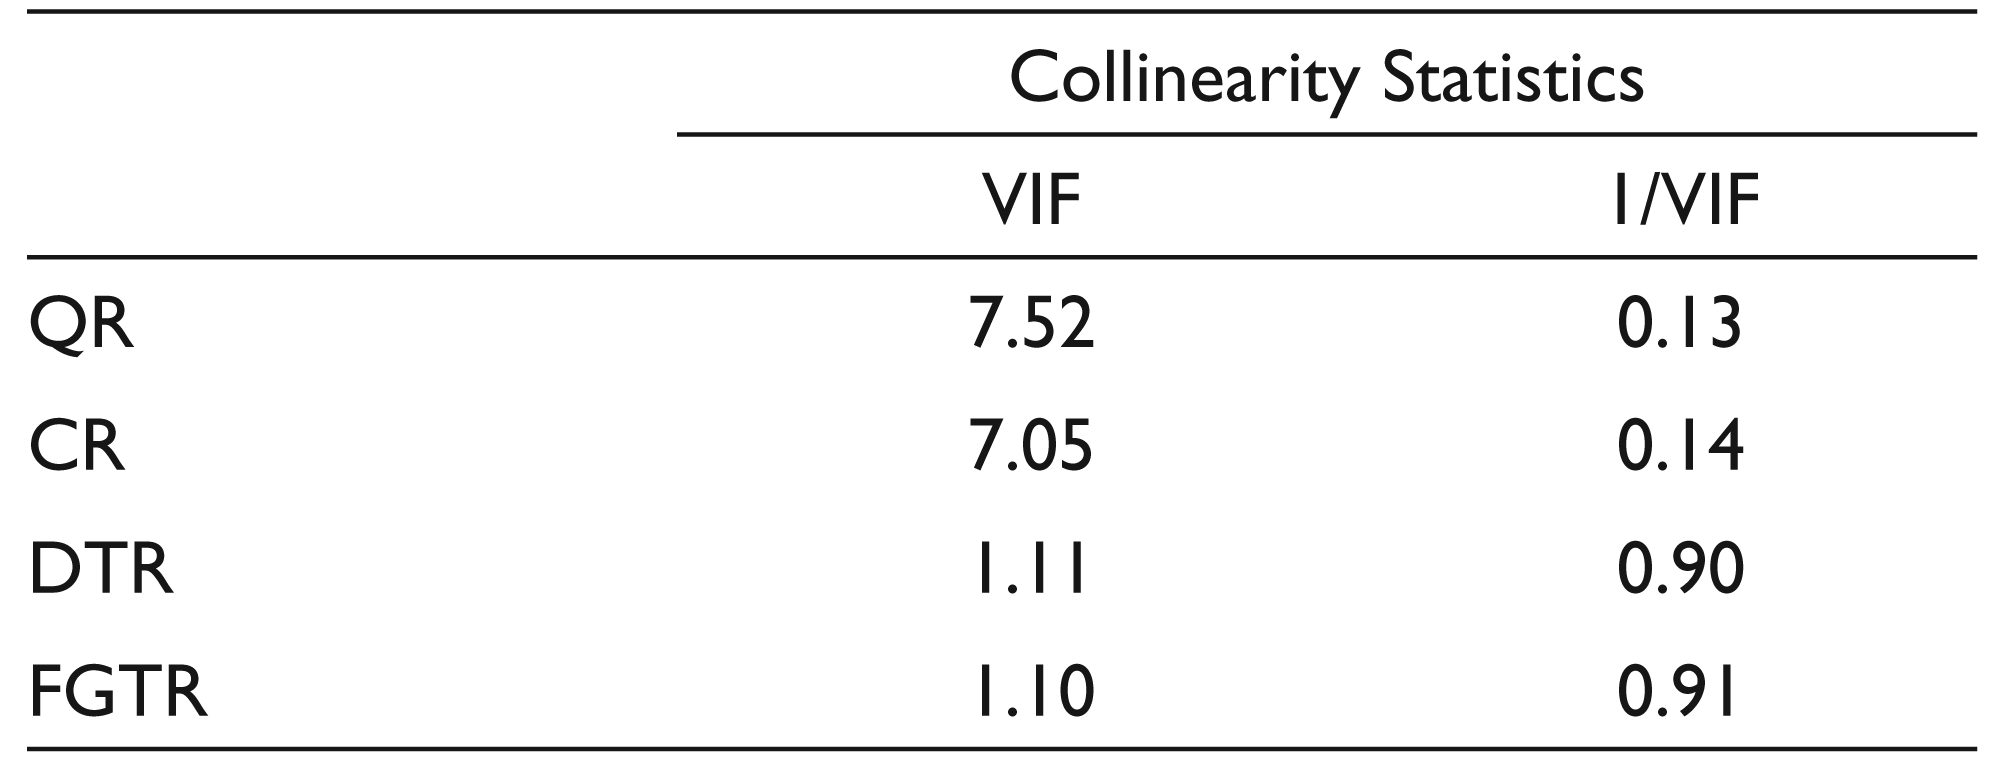
The test for multi-collinearity has to be done before moving to panel regression model. This will help us to check whether the independent variables are highly correlated or not. It is generally accepted that the variance inflation factor (VIF) of more than 10 will lead to multi-collinearity problem.
Because all the independent variables have VIF below 10 and within the desirable limit, which is represented in Table 2, we have four independent variables for the panel regression model.
Testing the Multi-collinearity
After the test of multi-collinearity, the data set is subject to unit root tests in order to test its stationary property. In the present study, the Levin–Lin–Chu test is applied and the results are presented in Table 3.
Levin–Lin–Chu Unit-root Test Results
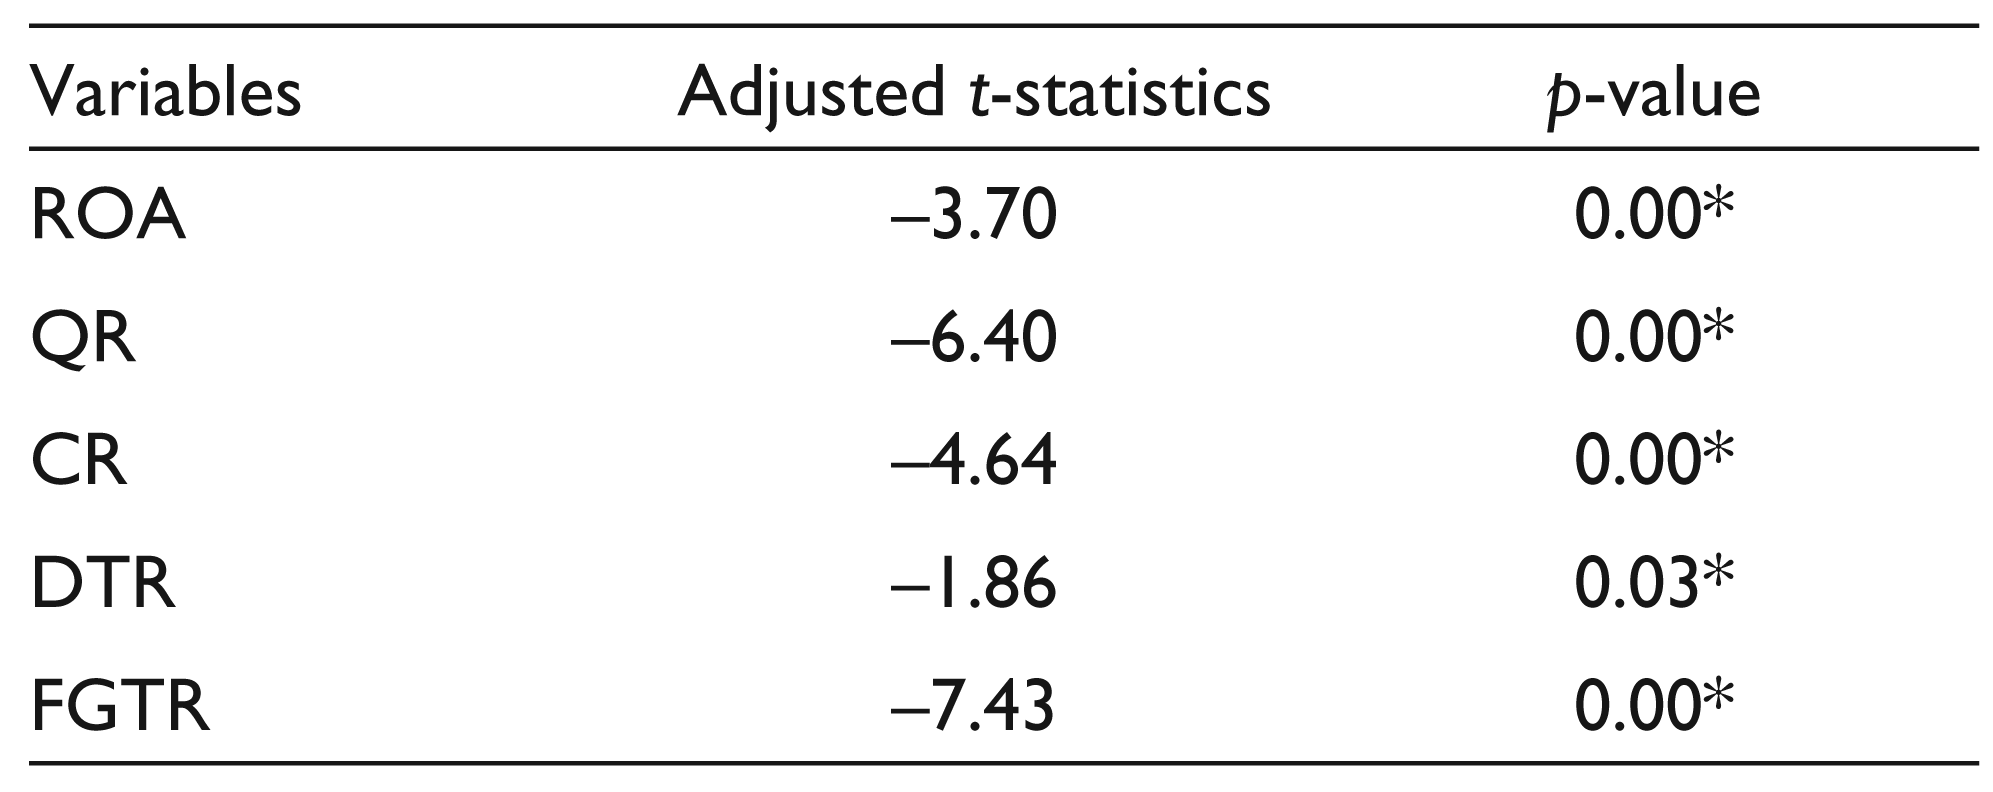
Because all the p-values are less than 0.05, null hypothesis is rejected, that is, data has unit roots and accepting the alternative hypothesis leads to the conclusion that data are stationary at levels. Thus, the results obtained are not fictitious. Hence, the panel data regression has been carried out for the purpose of analysis.
Panel Data Analysis
The empirical model developed to check the impact of working capital on profitability of the firm considers both time series elements for which ‘t’ is used and crosssectional elements captured using ‘i’. The model that is tested is as follows:
The panel data regression results can be analysed only after finalising the model which we can apply. The following steps are adopted for this purpose:
In the first step, we pooled the time series data of 17 years from 2000 to 2016 and cross- sectional data of 35 steel companies of India. In the second step, pooled regression (OLS) was performed to estimated common intercept term and the common slope coefficient. Table 4 indicates that the explanatory power of the regression was extremely low as R square is 0.15 with the coefficients QR, CR, DTR and FGTR. In the model only QR and DTR coefficients are significant as the probabilities of both the coefficients are less than 5 per cent. But the probabilities of the coefficients of both CR and FGTR are more than 5 per cent. It is concluded that hypotheses H1 and H3 are not accepted, that is, QR and DTR have significant impact on the profitability of the industry whereas hypotheses H2 and H4 are accepted, that is, CR and FGTR do not have significant impact on the profitability of the industry.
Pooled OLS Regression Results
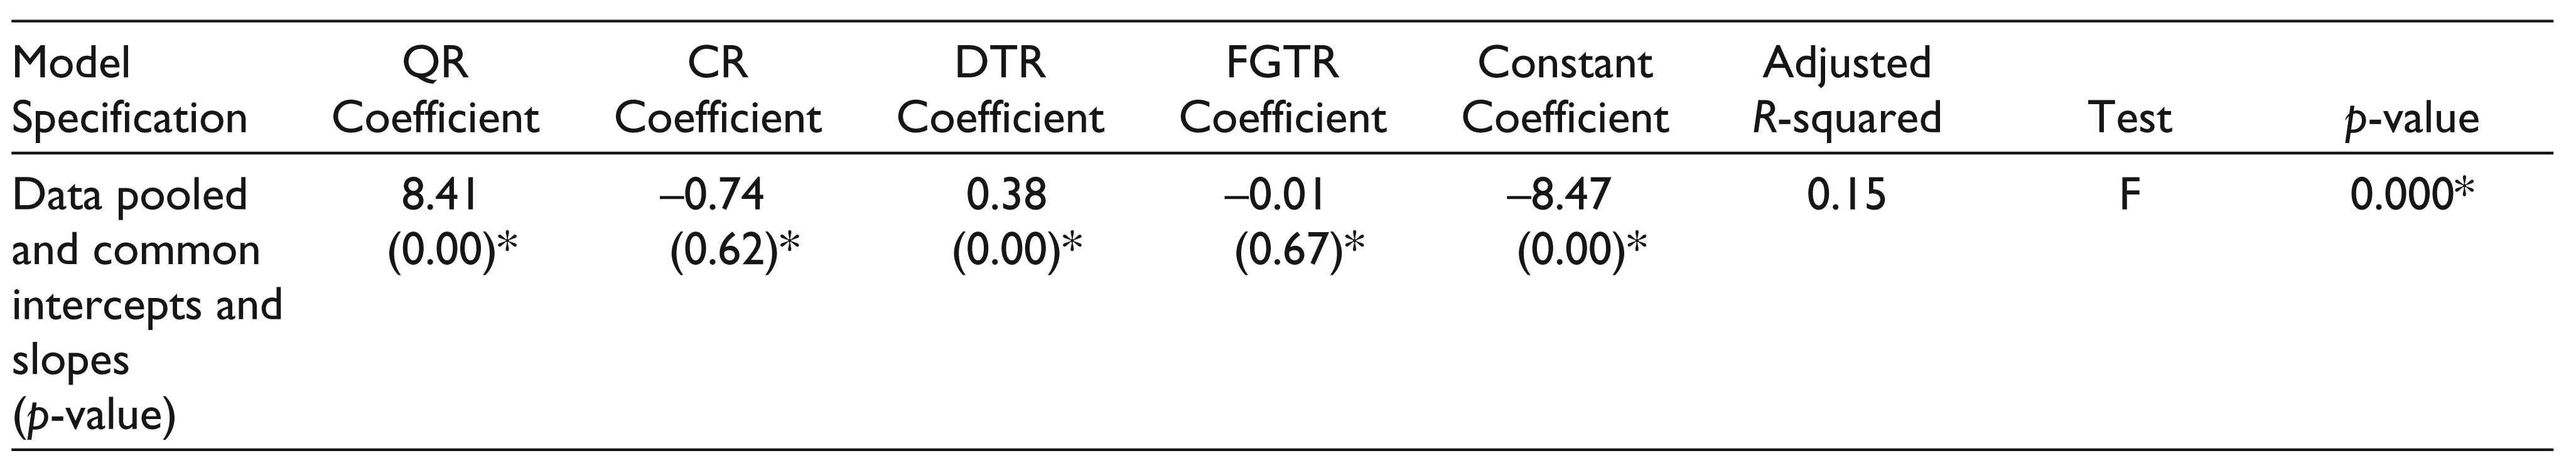
The pool ability test was performed to test the null of a common intercept and slope coefficient versus the alternative of running individual regressions for each cross section. The calculated probability value of F statistics of the regression equation indicates rejection of null hypothesis as it is less than 5 per cent level of significance. So, we can conclude that the data should therefore not be pooled for regression purpose.
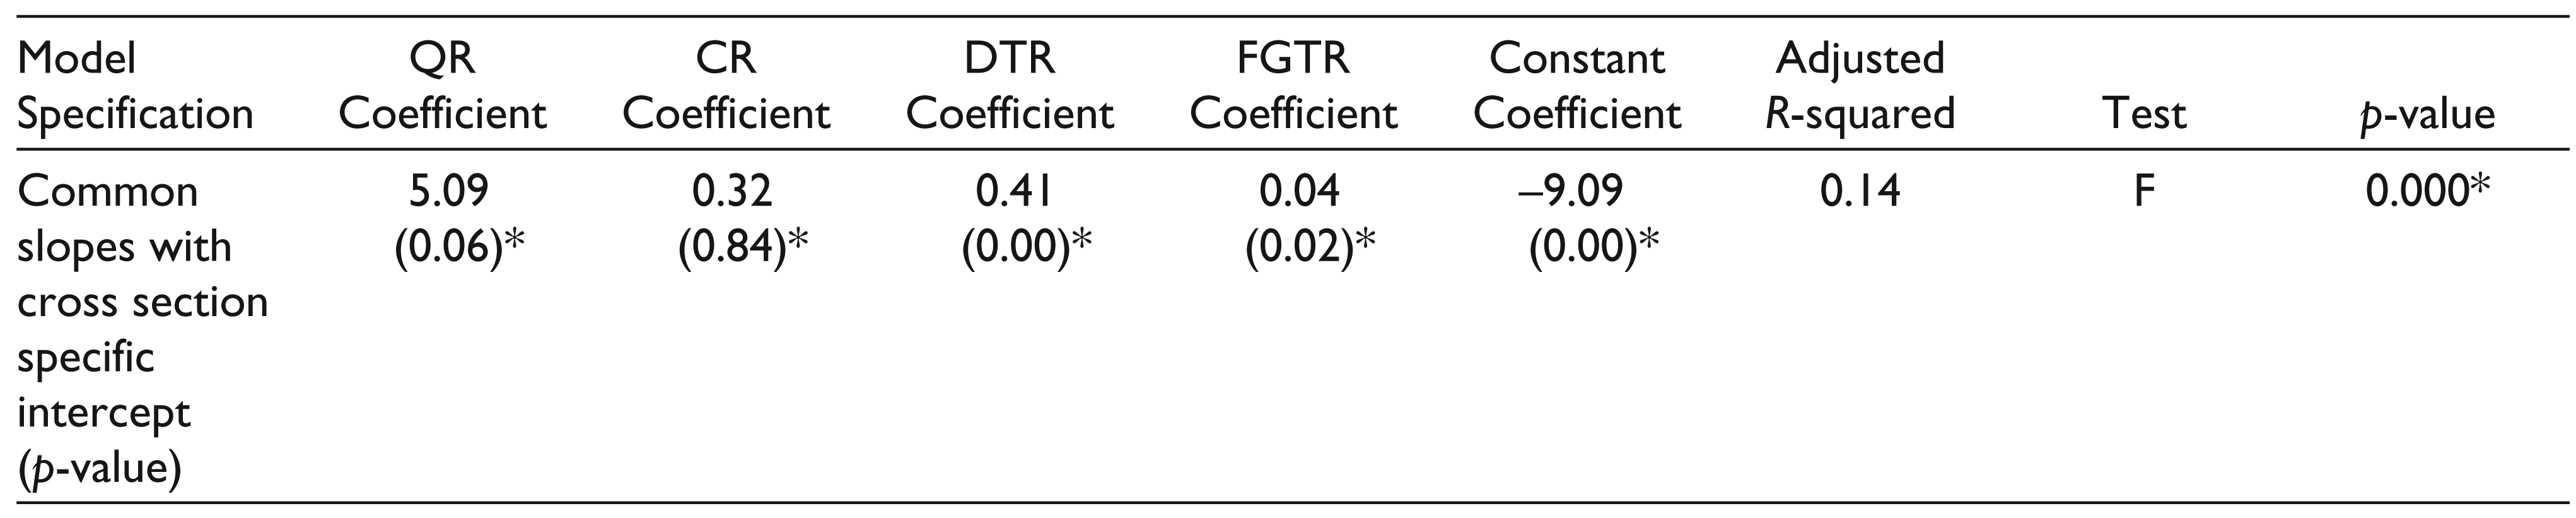
In the third step, the validity of fixed effects and fixed time effects was then tested and is presented in Table 5. The result indicates that the explanatory power of the regression decreased more, that is, R square is 0.1395 which implies 13.95 per cent of the variation in the dependent variable, ROA, can be explained by the variation in the explanatory variables. Most of the slopes are very close to each other. But on the other side the calculated probability of F statistics indicates rejection of null hypothesis as it is less than 5 per cent level of significance. That means, the model is fitted well and the coefficients are not equal to zero. But in this test DTR and FGTR coefficients are only significant as the probabilities of both the coefficients are less than 5 per cent, which indicates that only turnover ratios were fitted well but both the cash ratios QR and CR were not fitted well as the probabilities of the coefficients are more than 5 per cent. So it is concluded that hypotheses H3 and H4 are not accepted, that is, DTR and FGTR have significant impact on the profitability of the industry whereas hypotheses H1 and H3 are accepted, that is, QR and CR do not have significant impact on the profitability of the industry.
Fixed Effect Regression Results
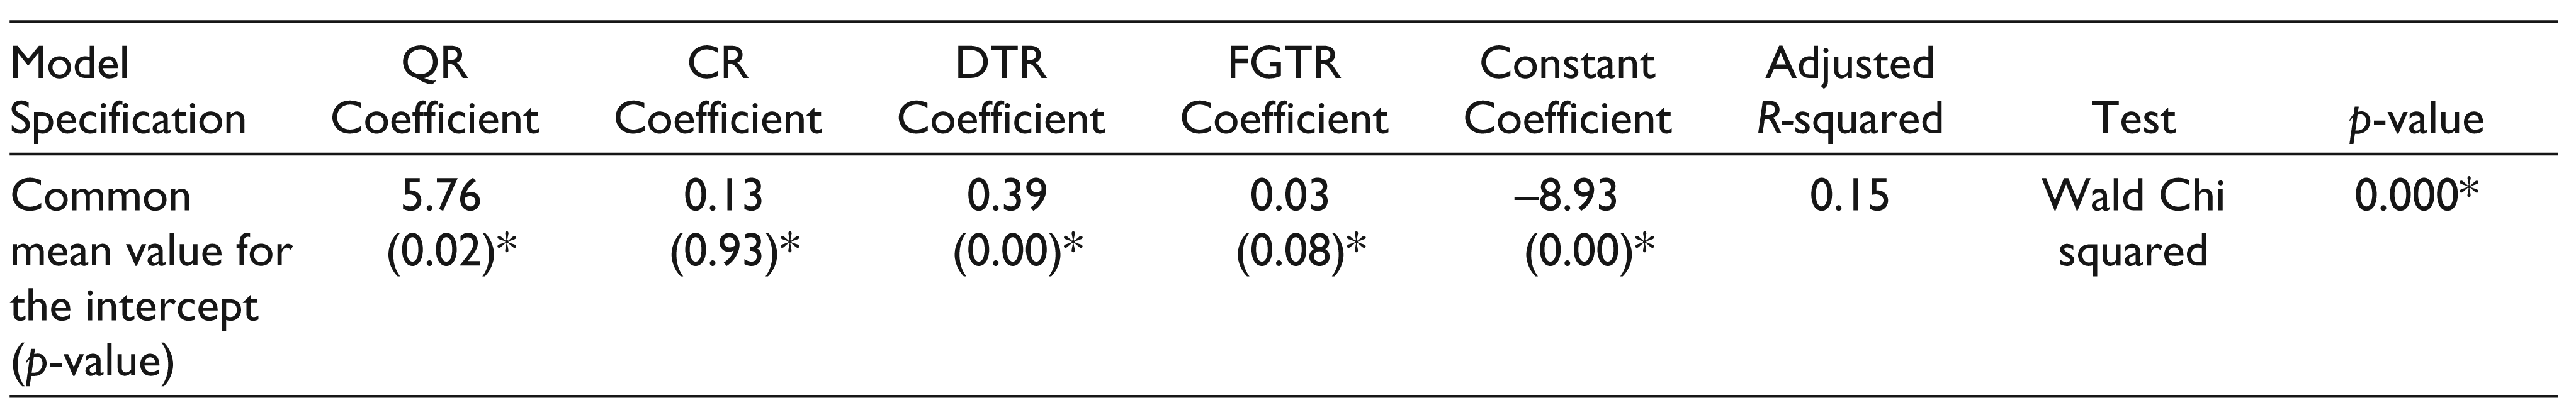
In the fourth step, the validity of random effects was then tested and the results are presented in Table 6. The results indicate that the explanatory power of the regression is better than fixed effect, that is, R square is 0.1462 which implies 14.62 per cent of the variation in the dependent variable, ROA, can be explained by the variation in the explanatory variables. The slopes are very close to each other. The calculated probability of Wald Chi squared statistics indicates rejection of null hypothesis as it is less than 5 per cent level of significance. That means, model is fitted well and the coefficients are not equal to zero. But in this model also, QR and DTR coefficients are only significant as the probabilities of both the coefficients are less than 5 per cent. But CR and FGTR were not fitted well as the probabilities of the coefficients are more than 5 per cent. It is concluded that hypotheses H1 and H3 are not accepted, that is, QR and DTR have significant impact on the profitability of the industry whereas hypotheses H2 and H4 are accepted, that is, CR and FGTR do not have significant impact on the profitability of the industry.
Random Effect Regression Results
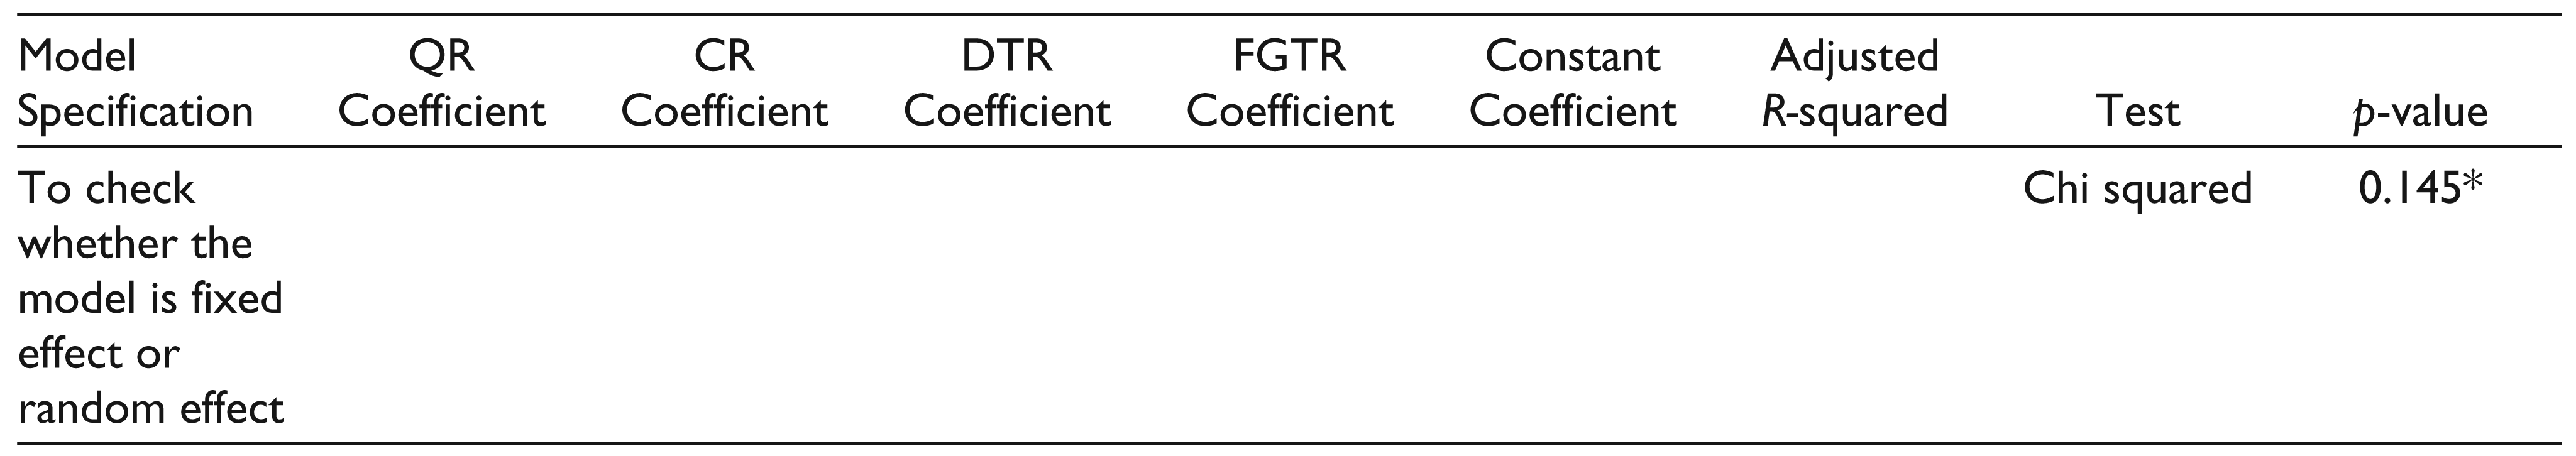
In the fifth step, we checked which model (fixed effect / random effect) is appropriate. To check the appropriateness we applied Hausman test. The null hypothesis explains the random effect model is appropriate against the alternative hypothesis which explains the fixed effect model is appropriate. The result in Table 7 implies the probability value of Chi squared is more than 5 per cent level of significance and we accept the null hypothesis. Thus, random effect model is more appropriate than fixed effect model.
Fixed Effect versus Random Effect: Hausman Test
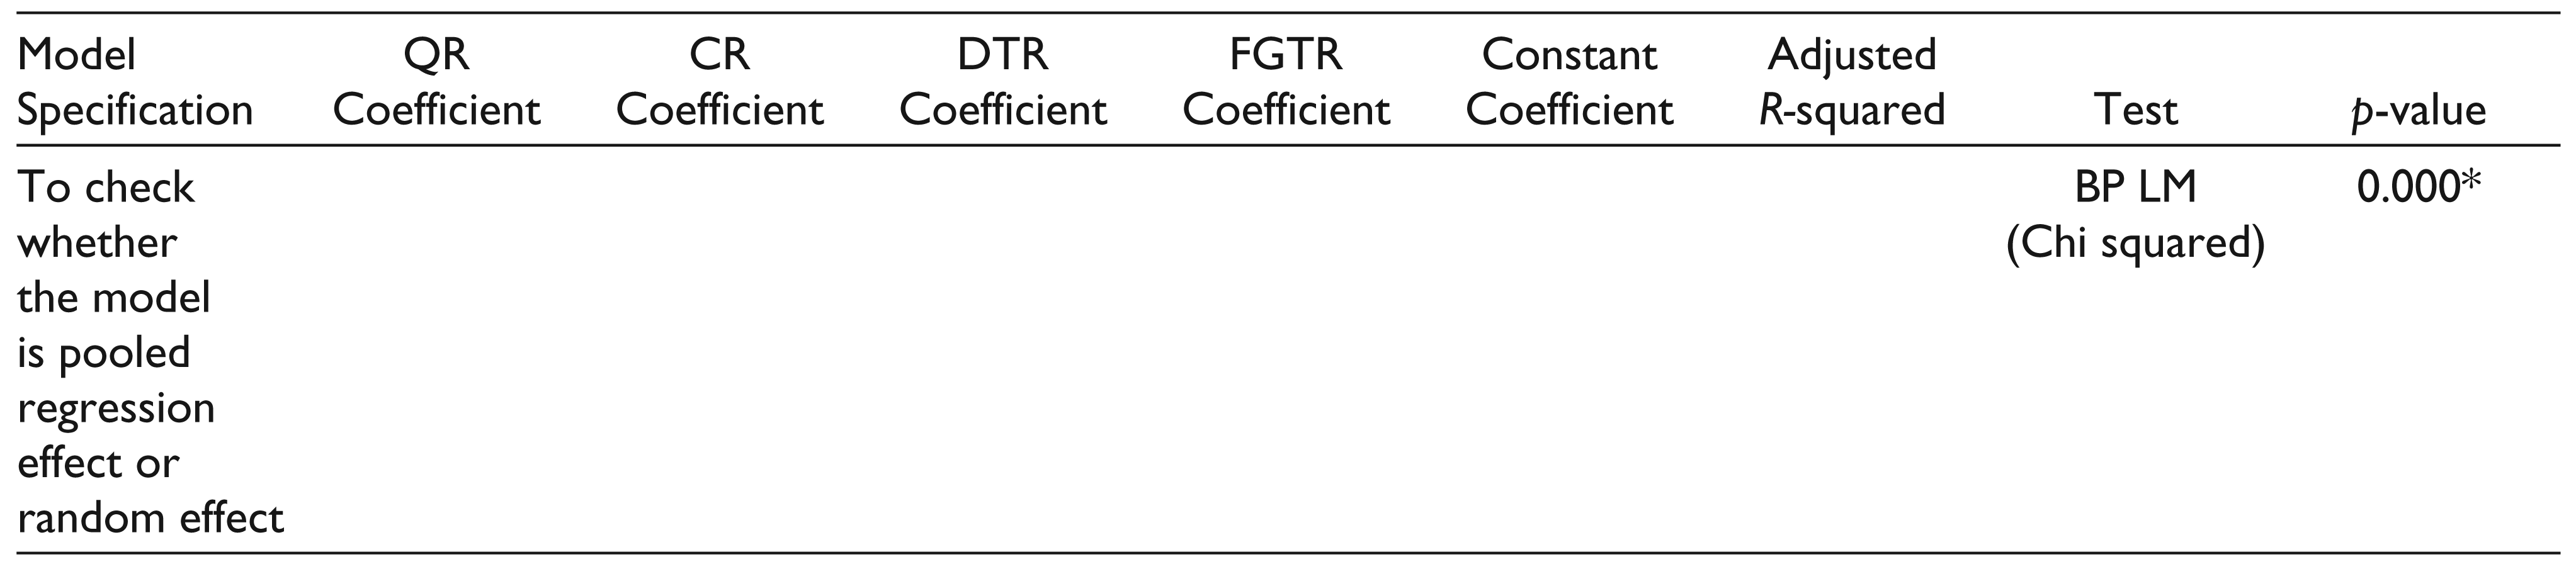
In the sixth step, we checked which model (random effect/ pooled regression) is appropriate. To check the appropriateness we applied Breusch–Pagan Lagrange multiplier test. The null hypothesis explains the pooled regression model is appropriate against the alternative hypothesis which explains the random effect model is appropriate. The result in Table 8 implies the probability value of Chi squared is less than 5 per cent level of significance and we accept the alternative hypothesis. Thus, random effect model is more appropriate than pooled regression model.
Pooled OLS versus Random Effect: Breusch–Pagan Lagrange Multiplier Test
For the random effect model, it was evident that quick ratio and debtors turnover ratio have a significantly positive influence on the firm’s ROA with the probabilities of both the coefficients are less than 5 per cent. But the CR and FGTR were not significant as the probabilities of the coefficients are more than 5 per cent. The model depicts 14.62 per cent of the variation in the dependent variable, ROA, explained by the variation in the explanatory variables. So it is finally concluded that hypotheses H1 and H3 are not accepted, that is, QR and DTR have significant positive impact on the profitability of the industry whereas hypotheses H2 and H4 are accepted, that is, CR and FGTR do not have significant impact on the profitability of the industry.
Conclusion
It was indicated by Raheman and Nasr (2007) that working capital management has been an essential part of financial management and contributes significantly to a firm’s wealth creation as it directly influences organisational profitability and liquidity. The present study analysed the working capital management on profitability of 35 steel companies of India. It was found that there has been an impact of the working capital on the profitability of the industry. Prior to the application of the panel data regression, the test of multi-collinearity and the unit root by using the Levin–Lin–Chiu test was carried out. Then it was found that the QR and the DTR have positive effect and are statistically significant to the ROA. It was consistent with the findings of Arunkumar and Ramanan (2013) regarding a positive relationship between profitability and debtors’ day but contrast to the positive relationship between profitability and inventory days. It also goes with the findings of Sharma and Kumar (2011) who found a positive relationship between profitability and number of days accounts receivables. The firms can invest more in the productive purpose and focus on the credit sales of the company which in turn increases the profitability of the company. The investment in the liquid assets of the firm also has a positive impact on the profitability of the firm. Hence, the study clearly asserts that sample companies of the steel industry have enough scope to enhance their profitability by the use of working capital in a more efficient way.
Declaration of Conflicting Interests
The authors declared no potential conflicts of interest with respect to the research, authorship and/or publication of this article.
Funding
The authors received no financial support for the research, authorship and/or publication of this article.