
Abstract
Diversity means variations in social, economic, demographic and employment factors. The diversity of the workforce, social and demographic-wise, is an interesting comparison for a study on diversity management. The purpose of the research work is to estimate the direction and relationship of identified social, demographic and economic diversity factors on job perspectives, namely firm and peers, job and life and human resource management (HRM) systems. The conceptual framework is built on diversity factors, such as age, gender, marital status, religion, nativity, caste and salary. The study is conducted on a random sample of 928 employees, spread across five industrial and service sectors in a public sector steel plant, two private sector steel plants, a BPO, a public sector information technology (IT) firm and private sector IT firm. The sample includes executives and non-executives within the respective industrial employments. The Cronbach’s α values for all 176 items of job perspective factors are in the range of 0.938 to 0.770. The perception of peers has an inverse impact by age diversity. The age, religion and caste diversity on the job and in life is moving in the reverse direction. The age and religion diversity presents a similar trend in HRM systems. The age, religion and caste diversity are major diverse variables on HRM systems, job and life and perception on firm and peers. Diversity factors in the Indian context on HRM factors, job and life and firm and peers are the reflection of age, religion and caste.
Introduction
Diversity as a concept is the distinguishable variations or differences based on criteria (Shen et al., 2009) such as social, economic, demographic and employment. Human resource management (HRM) is a focused subject with a multidisciplinary approach based on behavioural sciences and management. The evolution of HRM has seen either reactive or proactive changes. The manifestation of changes in diversity is in the nature, concept and scope of HRM, a key area of management. Innovation in technology processes has made the role of HRM more complex (Rao, 2018) and comprehensive.
On diversity in HRM practices, Wambui et al. (2013) point out that social and demographic factors lead to an increase in the competitive strength of any organisation. It is also true that the demographic and social profile of the workforce plays a key role in various sectors of the economy. In another study, the demographic diversity divide provides an advantage for an emerging country like India (Meena & Vanka, 2013). About 45% of the workforce would be from the millennial age group (Mukherjee, 2019). The diversity of the workforce, social and demographic is an interesting topic of comparison for a study on diversity management. Fang Lee Cooke and Debi Saini (2010) and Kundu et al. (2015) investigate diversity in HRM practices and reveal differences in the perception of Indian employees on criteria related to harassment, flexible hours, merit and disabled employees. HRM factors are strategic integrators both horizontally and vertically (Kundu et al., 2015). Some other investigations find a significant relationship between a firm’s HRM system and performance (Kunze et al., 2013), with diversity in age (Parry and McCarthy, 2017), professional tenure and expertise (Lu et al., 2015).
Social peer pressure influences social incentives more than monetary incentives (Kandel & Lazear, 1992), and the peer effect is high within the upper level of the hierarchy (Lucas, 1988; Marshall, 1890). However, wages, productivity and skill levels show a minor positive effect by peers (Cornelissen et al, 2017). Scattered migrant families have an impact on workplace lifestyles and contribute to the social, economic and political environment (Goulbourne et al., 2010). The non-natives’ or migratory families’ work–life balance is a research area for human resource researchers to understand work–life management (Choa & Allenb, 2019).
Organisational culture supported by HRM practices drives diversity management practices. Kundu et al (2015) found a positive relationship between HRM diversity practices (recruitment, selection, training, support groups and audit), performance and organisational levels (individual, group and organisational). Aumann and Ostroff (2006) explain that HRM practices across cultural contexts depend on life values derived from society and heredity.
Some researchers have observed a significant influence in limiting discrimination with HR diversity management (Abidi et al., 2017). Caste (Haq, 2012; Meena, 2015) and religion (Rao, 2015) are identified as major diversity factors impacting the workplace in India. While the above studies cover only HRM practices, the present study focuses on the components of firms and peers, job and life, and HRM systems.
The framework of the present study measures the impact of the selected socio-demographic and employment factors on three job perspective factors: firms and peers, job and life, and HRM systems. The predetermined grouping of the three factors and hypothesis formulation is discussed next.
Conceptualisation and Hypothesis Formulation
The socio-demographic and economic issues considered in the study are age, gender, marital status, religion, nativity, caste, education and salary. Job perception factors, namely, firm and peers, job and life and HRM systems, are evaluated to find the impact of diversity. These factors named on extraction with the help of factor analysis, viz. Firm And Peers, job and life and HRM systems. A questionnaire is prepared in both hard and soft format and administered on the selected sample during 2016–2017.
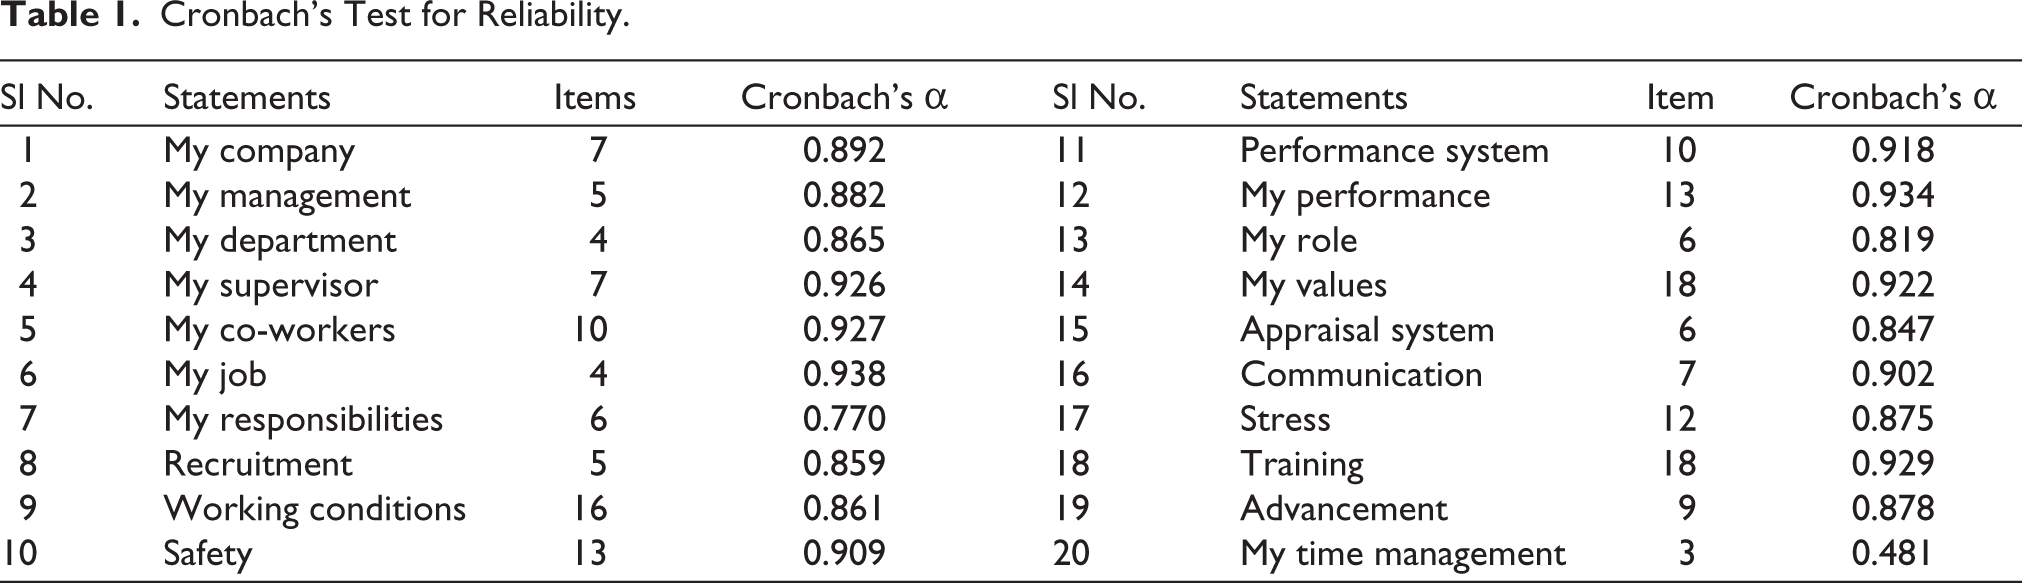
Cronbach’s α values (see Table 1) for all the 176 items of job perspective factors are in the range of 0.938 to 0.770, except ‘My time management’. The results are within the acceptable limits of reliability (≥0.600).
Cronbach’s Test for Reliability.
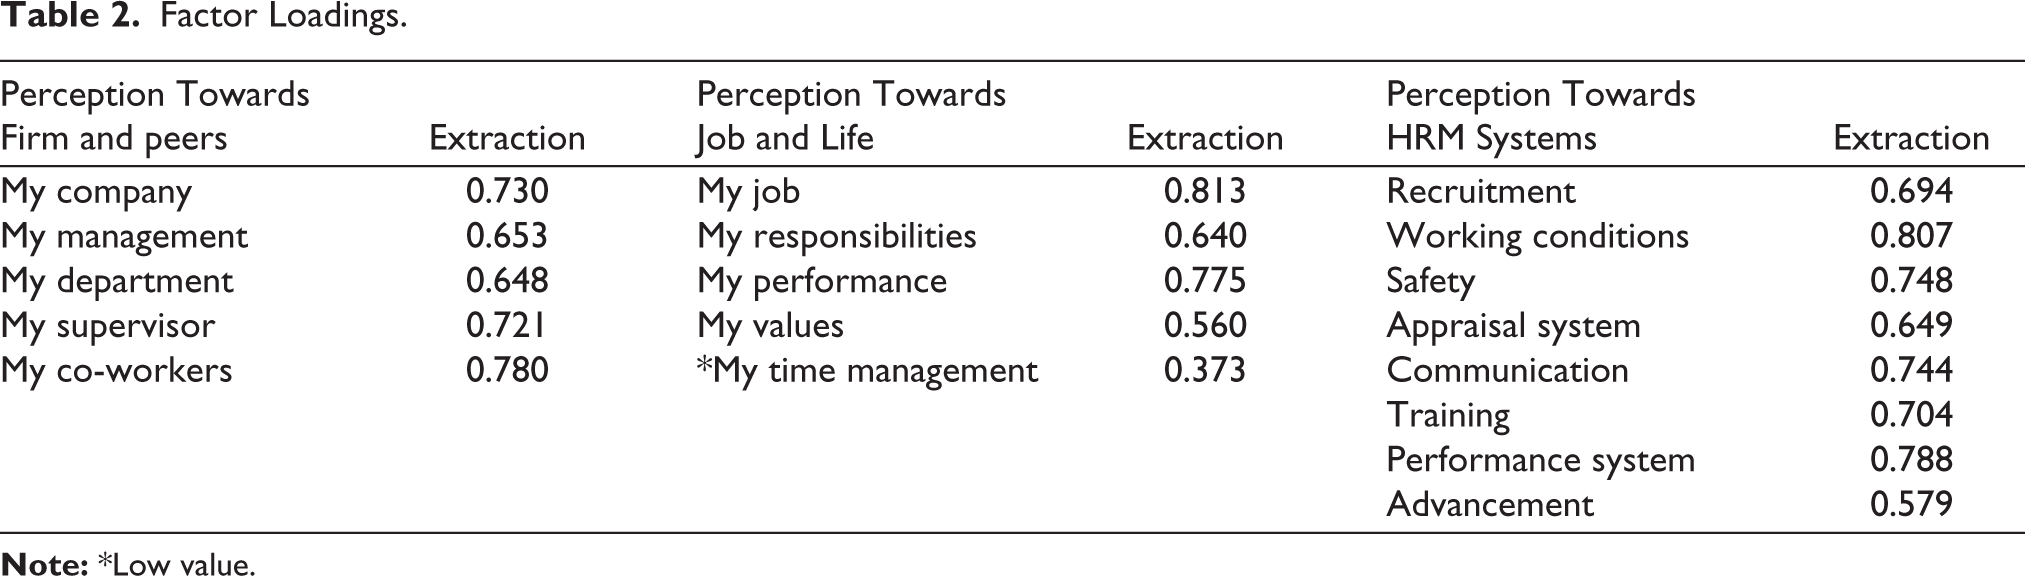
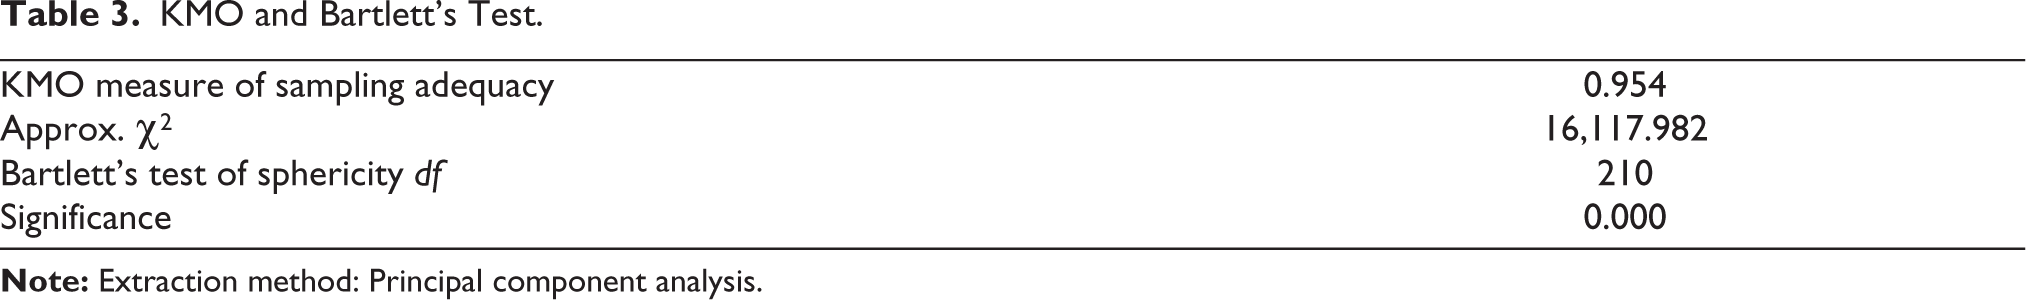
Factor loadings are calculated to examine the strength of the factors formulated for the study. Based on the results, the analysis of ‘my time management’ is discarded. Principal component analysis is applied to extract factor loadings. The analysis has extracted three factors, and the values range from 0.373 to 0.813 (see Table 2). The Kaiser–Meyer–Olkin (KMO) and Bartlett’s test of sphericity (see Table 3) are significant, and it is found appropriate to apply factor analysis.
Factor Loadings.
KMO and Bartlett’s Test.
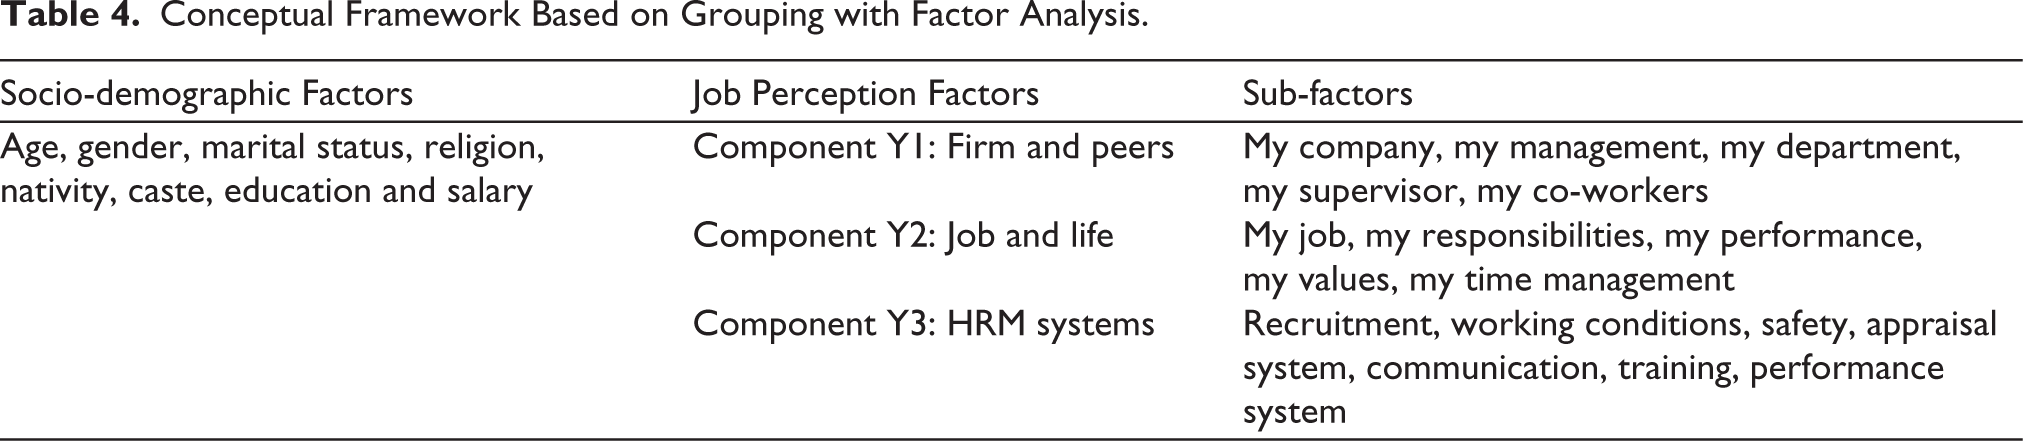
Based on the similarity of concepts, the factors are predetermined into three components (see Table 4).
Conceptual Framework Based on Grouping with Factor Analysis.
The conceptual framework is built on the diversity of socio-demographic and economic issues and job perspectives. The hypotheses tested in this work are:
H01: Socio-demographic and economic diversity factors have no impact on firm and peer. H02: Socio-demographic and economic diversity factors have no impact on job and life. H03: Socio-demographic and economic diversity factors have no impact on HRM systems.
Methodology
A hybrid design is framed with a combination of descriptive and case research methods. The organisations selected for the study are (a) one public sector steel plant which is fully automated; (b) two private sector steel plants with manually operated machine technology and with computer-based operations in HRM, finance and marketing functions; (c) a business processing outsourcing unit with computer operations in all functions; (d) a public sector information technology (IT) firm with high-level computer systems; and (e) a private sector IT firm with high-level computer systems (names are not mentioned to maintain confidentiality).
A sample of 928 respondents, which constitutes 4.3% of the total population (21,650), is selected on a stratified random sampling basis from these five industrial employments. The data are collected from the respondents during 2016–2017 by administering a questionnaire directly and online to measure their perception.
The sample includes executives, non-executives and workers of the respective industrial employments. A five-point Likert scale is used for data collection. The instrument with 176 items was tested for its validity and reliability with the test and retest method. Invalidated items were removed and the finalised instrument was administered.
This study aimed to estimate the direction and relationship between social, demographic and economic diversity factors on job perspectives, namely firm and peers, job and life and HRM systems.
We find the impact of socio-demographic and economic issues on the organisational factors in frame of objectives. The data are processed with SPSS and R to calculate mean, standard deviation, factor analysis for factor loadings and regression statistics.
Results and Discussion
Socio-demographic and Economic Issues
The mean age of the respondents is 35.14 years (Table 5). The mean ages of the five organisations present a sharp contrast, with the highest and lowest being the public sector steel plant (44.86 years) and BPO (26.81 years). The mean age (29.80 years) is surprisingly low in the case of the public sector IT firm. The gender equation is highly skewed in favour of male, with a 2.85:1 ratio, followed by the highest in the public sector steel plant (8.68:1), private sector steel plant (6.58:1), public sector IT firm (2:1), private sector IT firm (1.45:1) and BPO (1.26:1). The marital status comparison between steel manufacturing and IT sector presents more unmarried in the IT (60.25%) and BPO sectors (83.8%). The religion Hindu forms the major group in the steel, IT and BPO sectors. An interesting inference is that Muslims are lower in the BPO and IT sector than in the steel sector. Also, Christians find employment in BPOs as they are better in English.
Socio-demographic and Economic Factors.
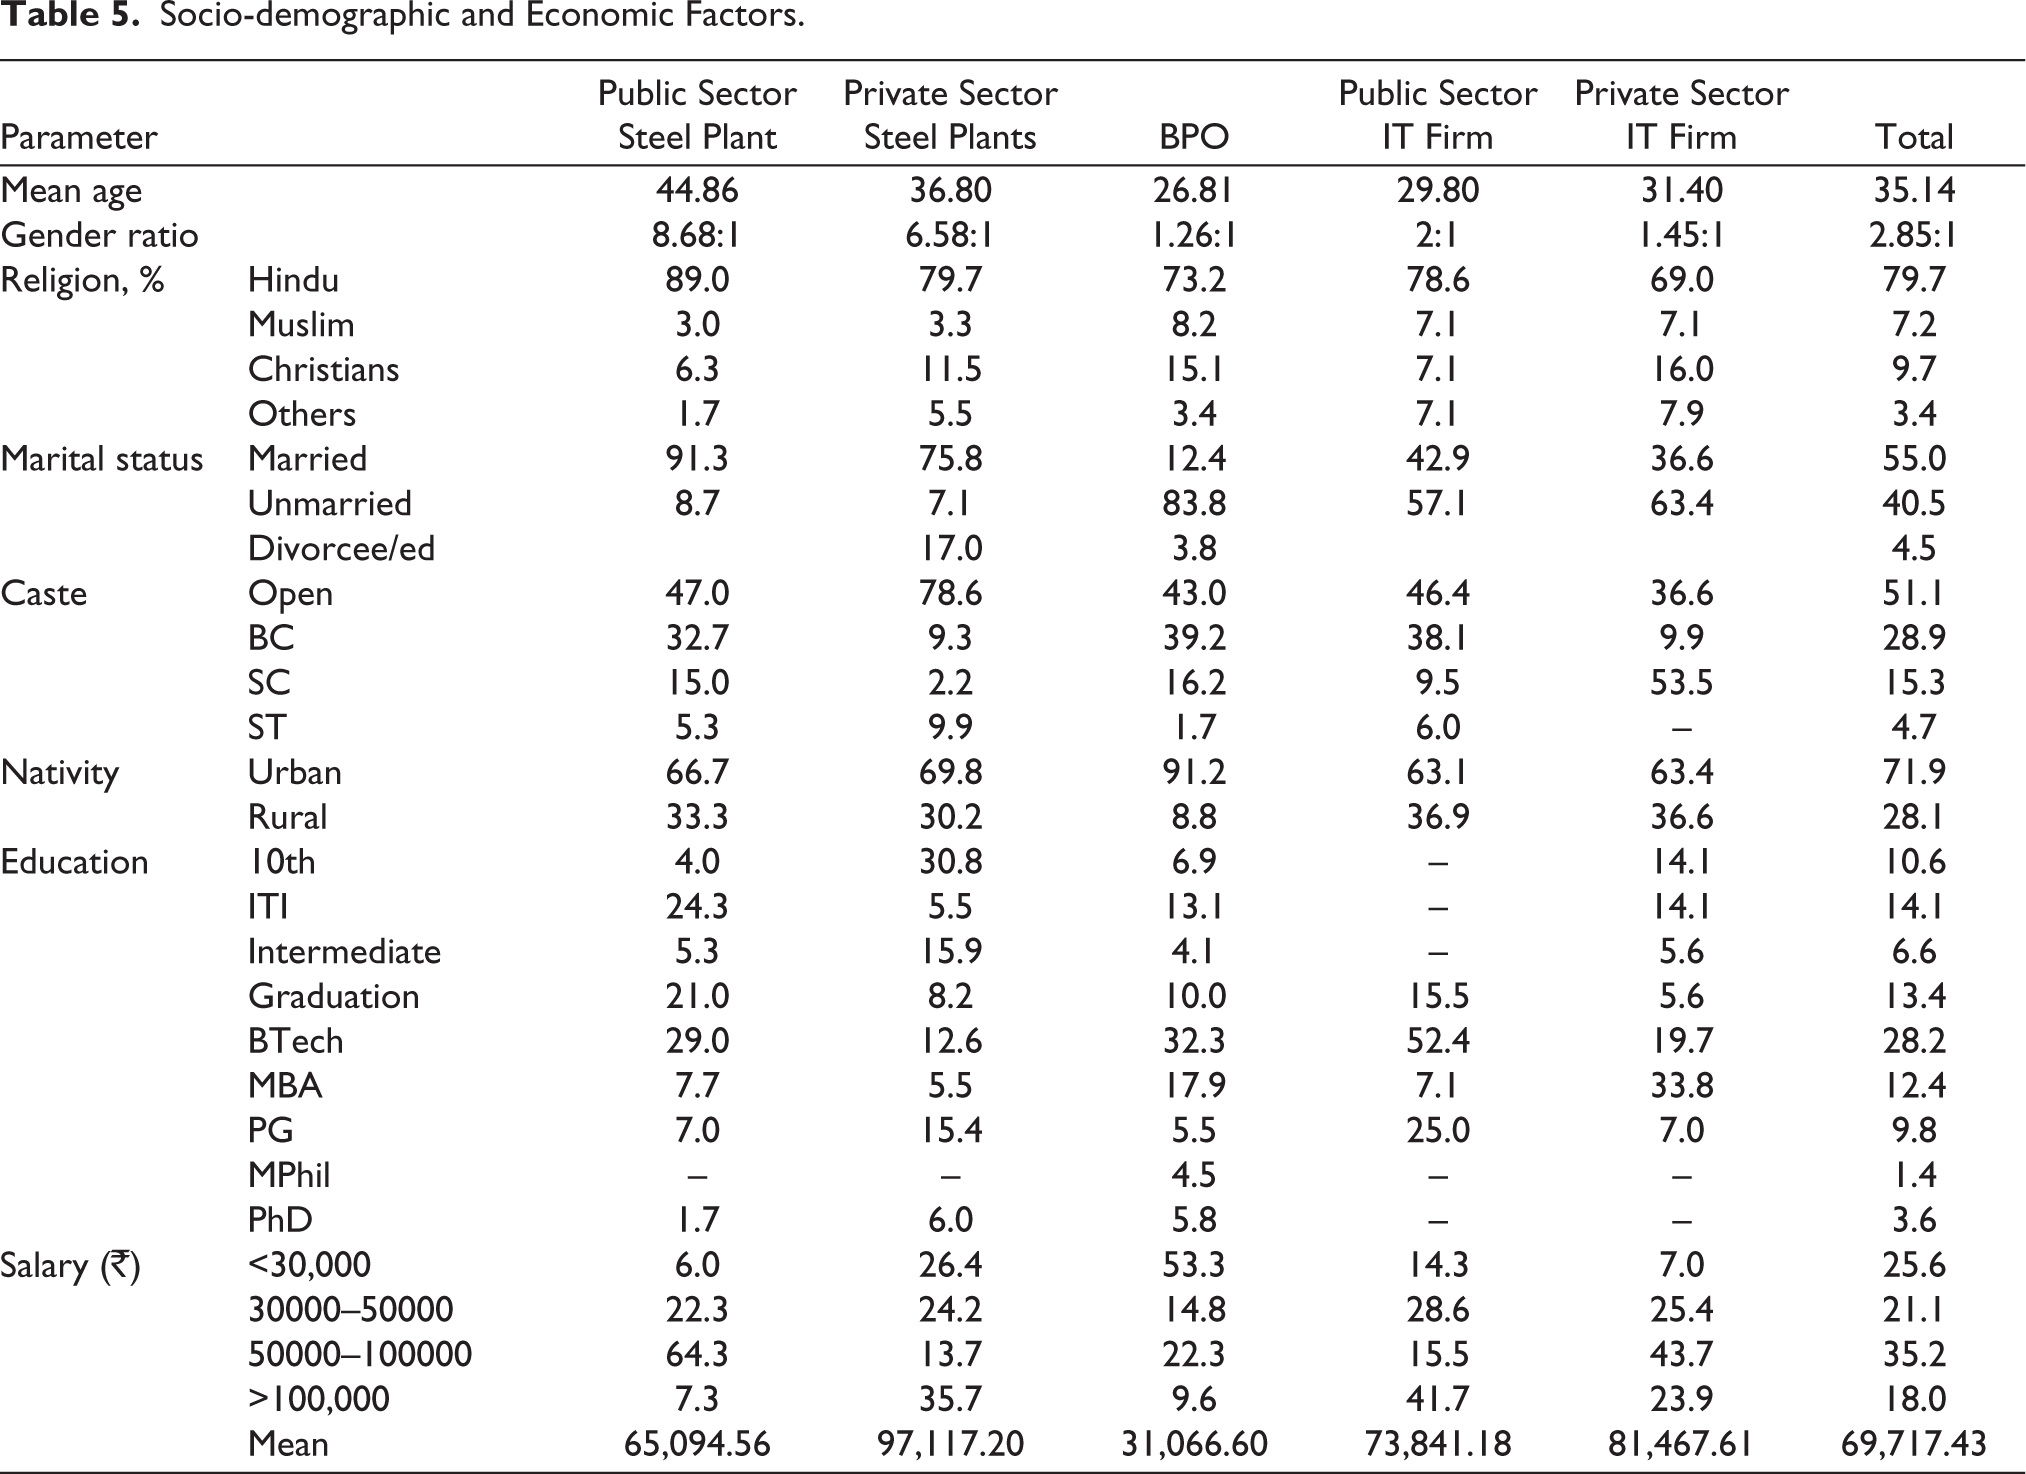
Caste distribution is even in all sectors except in the private sector IT firm with low ST representation (4.7%). Other sectors did not show any unusual caste distribution. Data on nativity indicate the predominance of urban inhabitants (71.9%) in comparison to rural. Those who migrated from rural areas form one-fourth and have presence in public sector and private sector IT firms. The majority across the five sectors, that is, public sector steel plant, private sector steel plants, BPO, public sector IT firm and private sector IT firm, have technical qualifications. The mean salary for the whole sample is ₹69,717.43, with the BPO sector recording a mean salary level of ₹31,066.60.
The average family size for the reported sample is 2.85 per family. BPO employees are predominantly from the joint family structure, and their average age is low and are mostly unmarried. Therefore, they live with parents in joint families.
Employment-related Issues
The majority of public sector employees (55.2%) and BPO employees (47.7%) have their own houses. Employees of the public sector steel plant have permanent employment status (91.7%), whereas employees of the BPO (95.3%) and the private sector IT firm (80%) are temporary or on off-roll employment. A change in designation is estimated to shift organisational roles, with the greatest change observed at the associate level (54.4 – 14.3 = 40.1%). Promotions in a career are analysed, revealing that the majority (38.9%) of the employees across the different sectors have an average of three promotions.
Steel plants (33.6%) and private sector IT firms (50.4%) employees have an average of three promotions. The trend is the same during one’s career with the present employer. The commutation to work as a criterion presents the majority (61.4%) travel less than 10 km, except in the case of BPO employees, who travel more than 15 km (49.3%), and public sector steel plants (37.2%) employees travel less than 5 km. The BPO and IT firms are located in satellite towns, and this requires a longer travel distance. The public and private steel plants have industrial townships attached to factory premises, minimising the travel time.
Variations in Job Perspective Factors
The perceptions of the employees on the factors are evaluated with mean scores (Table 6). The mean analysis for all the companies presents a positive perception. The inter-factor analysis for ‘My company’ shows that the values range from 78.0% to 58.5%. The factor most preferred is that the firm motivates them to work in a team. The least preferred is that the supervisors, managers and everyone speak with one voice on the firm’s policies and programmes, and the calculated mean is 25.86, and the standard deviation is 5.79. The inter-factor percentage for ‘My management’ ranges between 67.1% and 57.6%. The most preferred factor is the management assistance as it helps them to adapt to changing situations through innovation and creativity, and the factor favoured least is raising of funds by the management to adjust to the new technical issues, with mean at 18.08 and the standard deviation at 4.31.
Means of Job Perspectives.
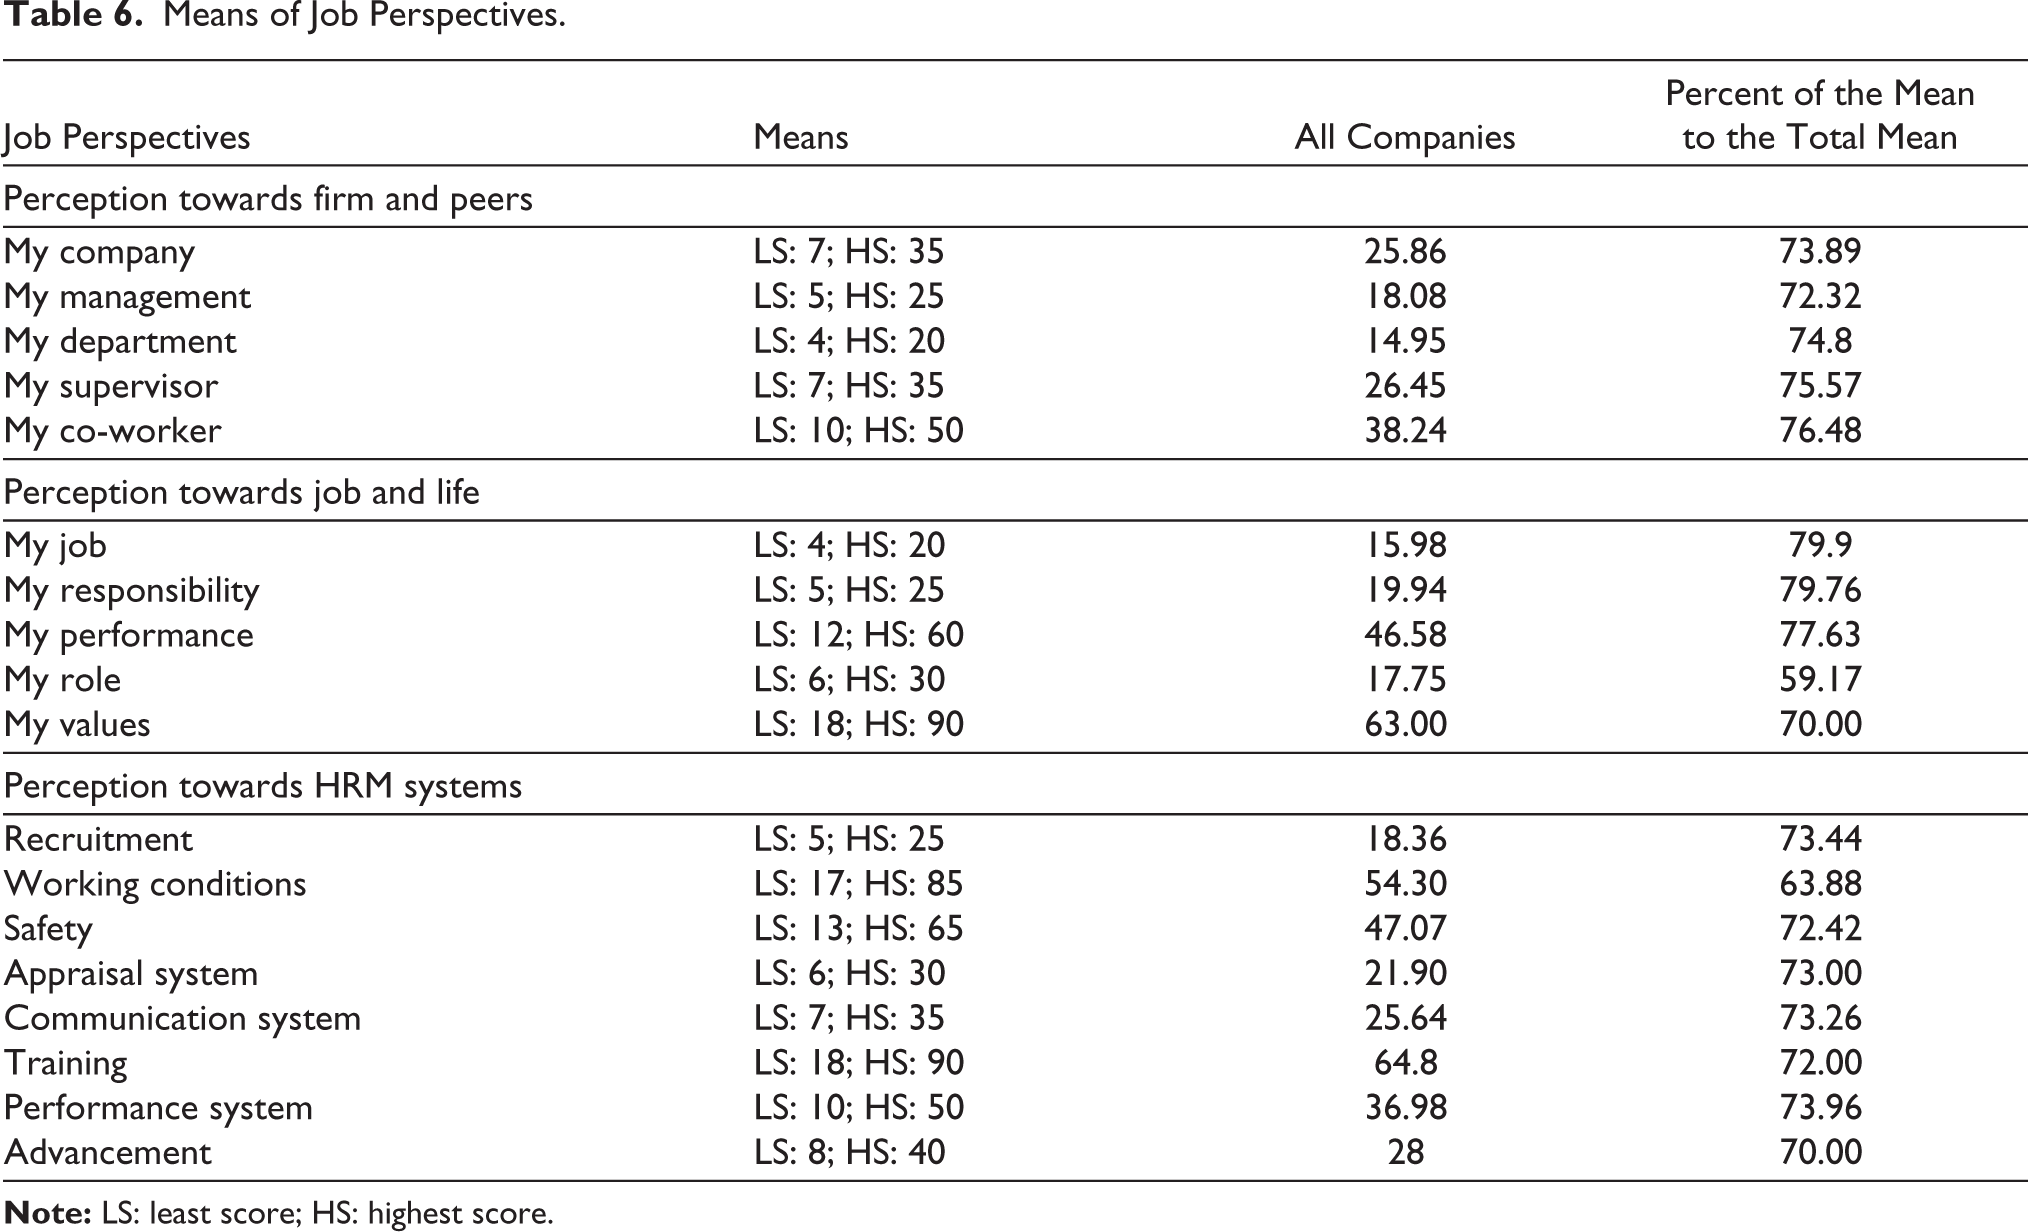
The analysis of data on ‘My department’ indicates that 22.2% rank their department’s role as very high and 48.0% as high. Most of the employees (70.2%) consider their department as very cooperative in their performance. Those who have no opinion are 14.7% and rank their department’s role as low at 11.1% and very low at 3.8%. The calculated mean is 14.95, and the standard deviation is 3.52. The values for the individual factors of ‘My supervisor’ range between 75.3% and 65.1%. These factors are noted as the supervisor is always positive to take up suggestions, and the least-preferred statement is that the company always realises that career development from within is better. The calculated mean is 26.45, and the standard deviation is 6.49.
The inter-factor analysis of ‘My co-worker’ shows that the values of the factors range between 78.3% and 55.9%. The factors favoured most almost equally are (a) we work together and relationships are good (78.3%) and (b) we can take help from others if we work in a team (78.2%). The factor least preferred is that co-workers are willing to work in a new location if needed. The calculated mean is 38.24, and the standard deviation is 8.31. The values of the factors of ‘My job’ are higher than the factors of other aspects, ranging from 80.3% to 78.2%. The most preferred factor is that the employee assists co-workers when the need arises, and the least preferred is that they will step in for co-workers if the situation demands. Next favoured is that the employee always tries to learn and improve. The calculated mean is 15.98, and the standard deviation is 4.28.
The inter-factor analysis of ‘My responsibility’ indicates that the values range between 81.7% and 59.0%. These factors are that the employee is responsible for achieving his specific targets, and the least favoured is low performing employees who are held accountable. The mean is 19.94, and the standard deviation is 4.60. The values on recruitment range from 72.4% to 55.7%. The most preferred is that the company provides required information at the time of joining without any ambiguity, and the factor favoured by the smallest group is that the time taken in the recruitment cycle is reasonable. The calculated mean is 18.36, and standard deviation is 4.45.
The values of the individual factors of working conditions range from 74.3% to 41.4%. The factor most favoured is that the building is rightly ventilated with sufficient height and air circulation. The least preferred one is that family meetings and picnics are common. The calculated mean is 54.30, and the standard deviation is 12.27. Inter-factor analysis of safety shows that the highest percentage of the employees (74.2%) favour the statement that the department feels safety is the most important, and the least group of 51.4% reports that employees are discouraged from taking safety risks. The calculated mean is 47.07, and standard deviation is 11.47.
Performance system values range between 78.3% and 62.9%. The factor most preferred is that the employee involves himself with full capacity in his job. The least favoured statement is that teams are rewarded for higher performance. The calculated mean is 36.98, and the standard deviation is 8.57. The values for individual statements of ‘My performance’ vary between 80.6% and 55.8%. The statement preferred most is effectiveness at work, and the factor considered least is dependence on others. The calculated mean is 46.58, and the standard deviation is 4.28.
The statements of ‘My role’ were assessed for identifying the causes for role conflict. The values range between 49.1% and 36.8%. The largest group conveys that the office requires him to be available for emergency work around the clock, and the least group reveals that he has to go out on personal or friends’ work during office hours. The calculated mean is 17.75, and the standard deviation is 6.07. ‘My values’ data assessed by the employees indicate values from 77.2% to 48.2%. The values favoured by the largest group are that one should aim to be appreciated and admired for knowledge and skills. The least groups which are almost similar prefer that either one should value money more than work (48.2%) or one can entertain friends and relatives during working hours (48.3%). The calculated mean is 63.00, and the standard deviation is 14.60.
Appraisal system values range from 73.4% to 58.1%; the largest group prefers that to say they know the targets sit for performance, and the least group favours the statement that the method of appraisal used is fair. The next least group (59.5%) conveys that the timing of the appraisal system is accurate. The calculated mean 21.90, and the standard deviation is 5.05. The values range between 68.0% and 62.4%. All the statements are favoured almost equally. However, the largest group prefers that the superiors are receptive to all communication about risk, including bad news, and the least group conveys that the firm is interested in making the employees realise the importance of managing risk. The calculated mean is 25.64, and the standard deviation is 6.03.
The inter-face analysis indicates that values for stress range from 69.5% to 45.6%. The most preferred statement is that the employee has a relaxed positive outlook towards work and life. The factor least favoured by the group is that the wellness programme is effective in controlling stress at all times and for all cadres. The calculated mean is 42.30, and standard deviation is 9.01.
Diversity Factors’ Impact on Job Perspectives
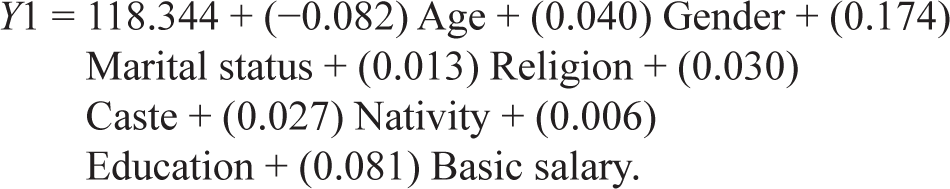
The multi-regression analysis of the socio-demographic, employment factors on the first component firm and peers with Beta values are positive except age, religion and caste (Table 7). The equation is fit as the F-value is significant. The explanatory power of the equation is R2 = 0.03605516. The equation construct follows:
Regression Analysis of the First Component: Firm and Peers.
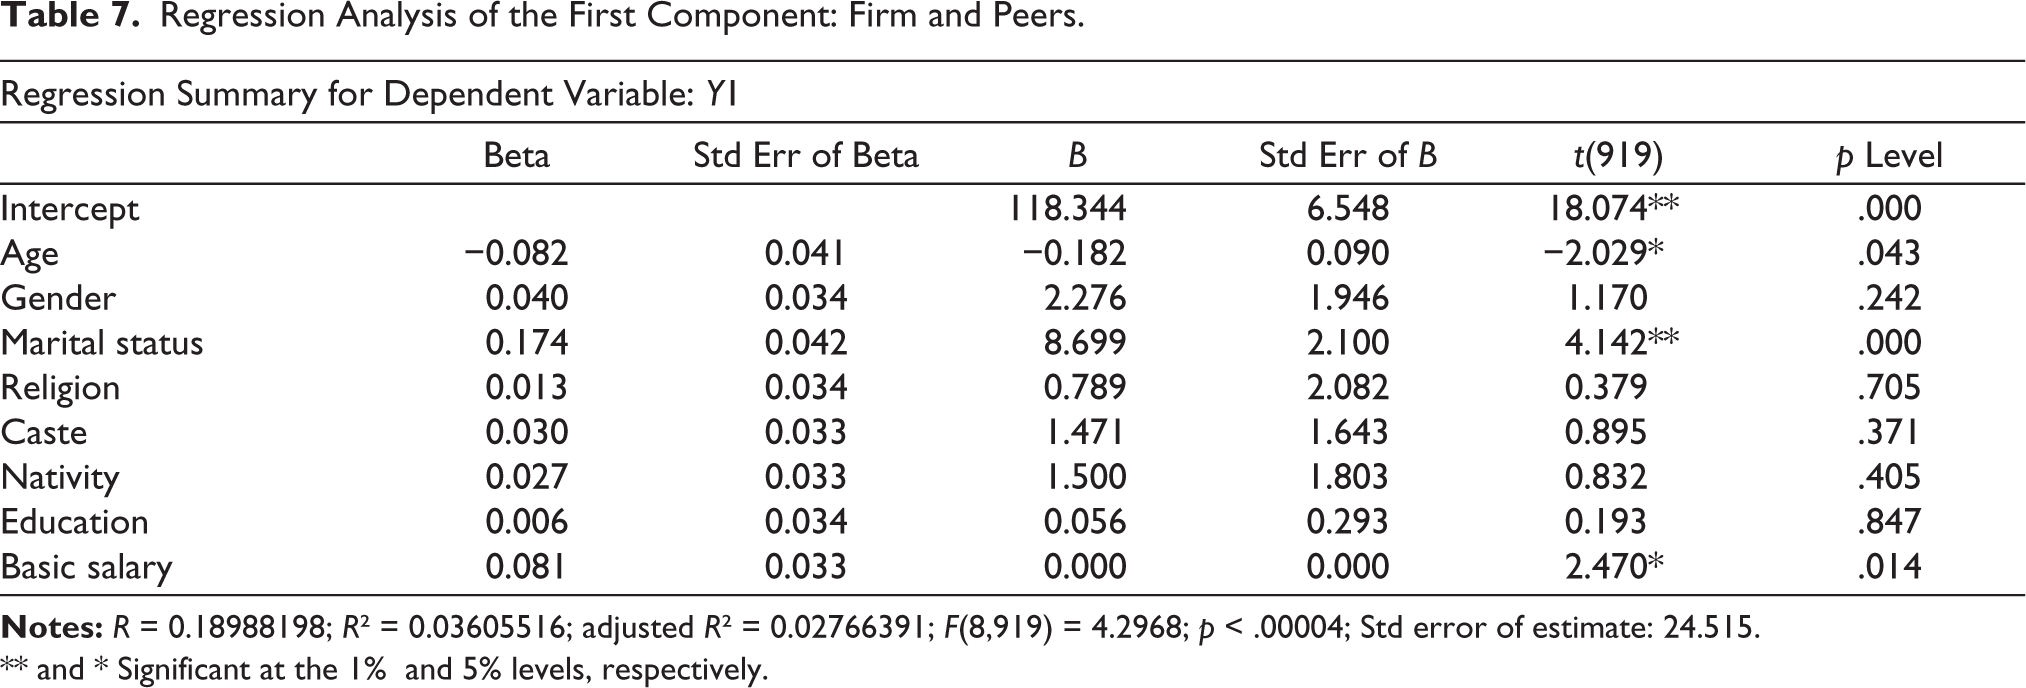
Notes: R = 0.18988198; R² = 0.03605516; adjusted R² = 0.02766391; F(8,919) = 4.2968; p < .00004; Std error of estimate: 24.515.
** and * Significant at the 1% and 5% levels, respectively.
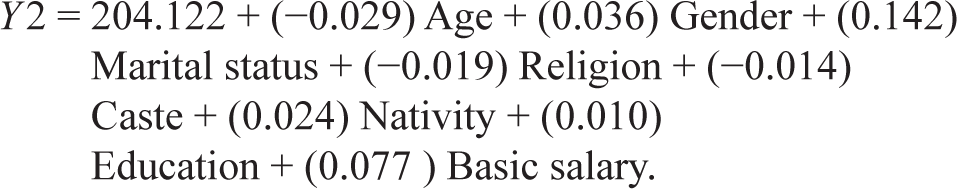
The second component (job and life), as dependent on socio-demographic and employment factors, is fit into a multiple regression equation (Table 8). The Beta intercept is 204.122. The equation is fit as the F-value is significant with the explanatory power (R2) of 0.0268. Age, religion and caste are impacting in the reverse direction. The regression equation with Y2 as the dependent variable follows.
Regression Analysis of the Second Component: Job and Life.
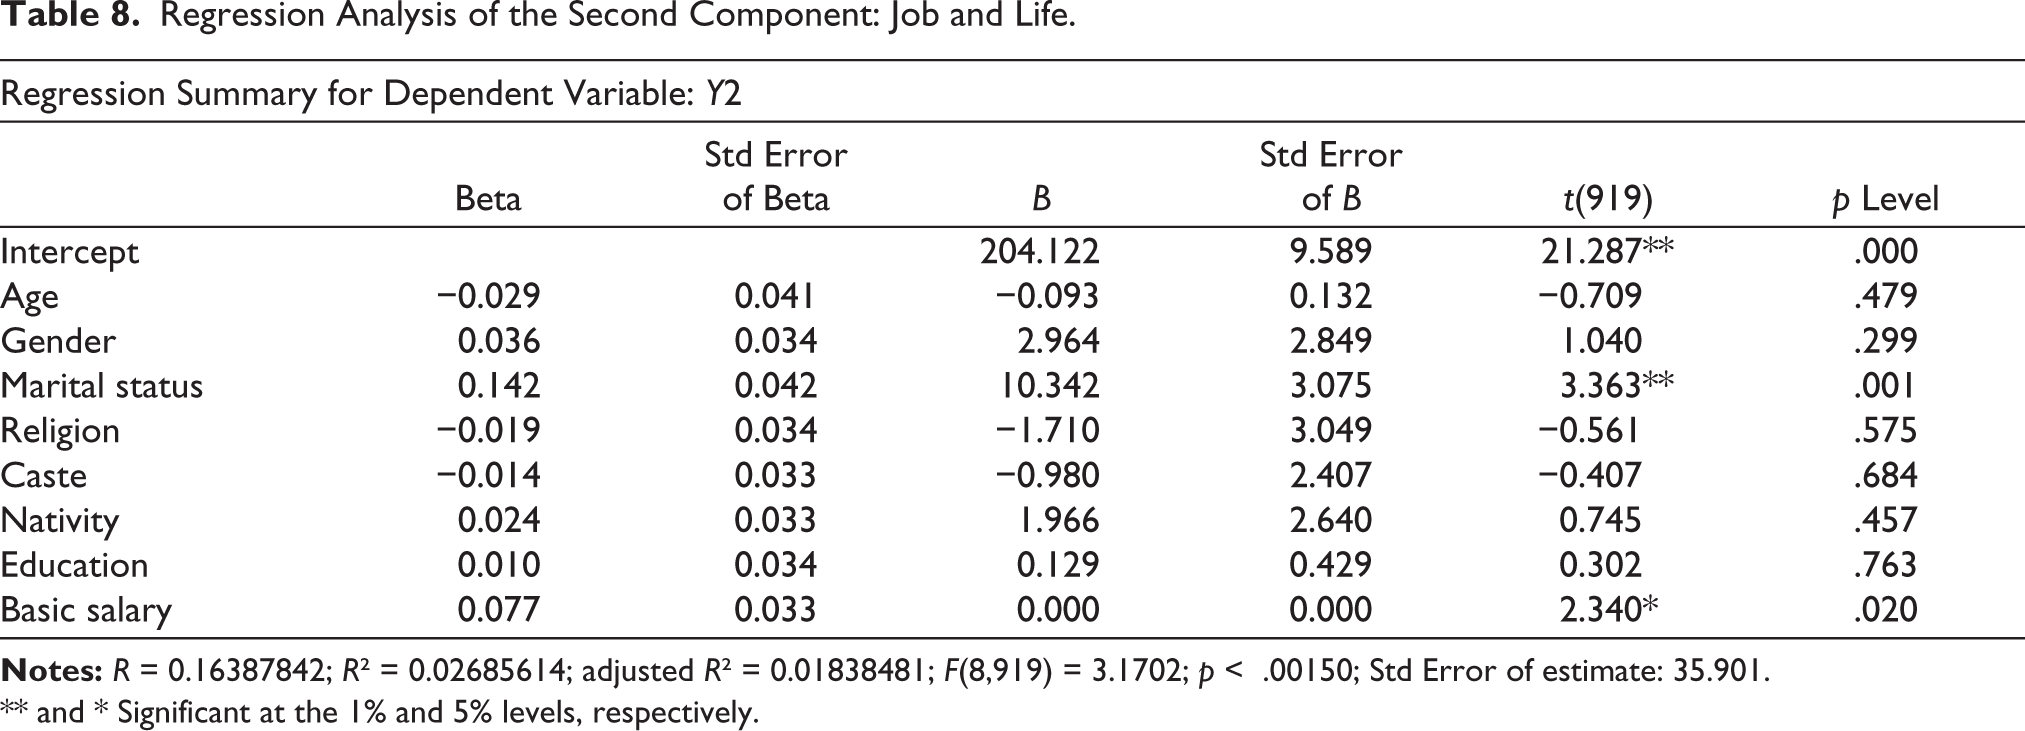
** and * Significant at the 1% and 5% levels, respectively.
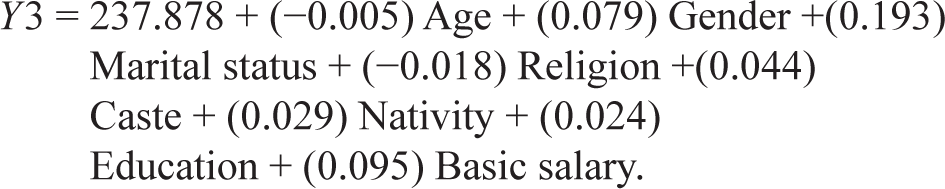
The regression equation with the third component (HRM systems) as the dependent factor on socio-demographic and employment factors is constructed (Table 9). The equation is fit as the F-value is significant with the explanatory power (R2) of 0.066. Age and religion were moving in the reverse direction, and the equation is
Regression Analysis on the Third Component: HRM Systems.
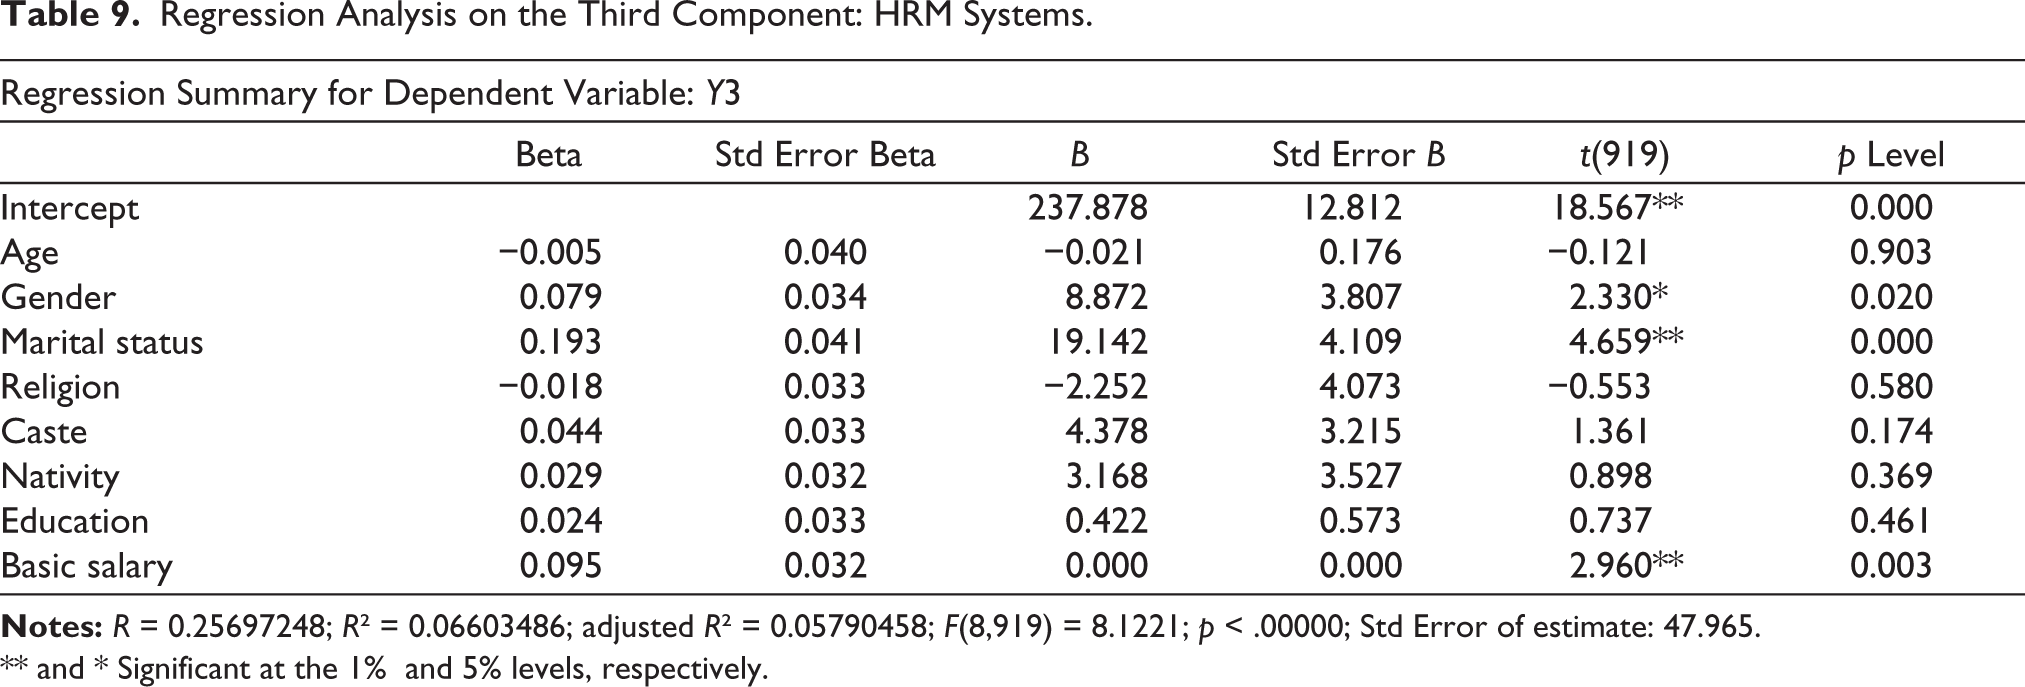
** and * Significant at the 1% and 5% levels, respectively.
Perception of peers has an inverse impact by age diversity. The age, religion and caste diversity on job and life is moving in the reverse direction. Age and religion diversity present a similar trend in HRM systems. Age, religion and caste diversity are major diverse variables on HRM systems, job and life and perception on firm and peers. Age diversity in the contemporary period has a generational gap, with more generations (20–30 years) in the IT and ITES sector. The average age is 34 years across all the sectors under study, and the perceptions towards the three components have an inverse relationship in comparison with the other diversity factors.
Some of the socio-economic and demographic variables, namely, age, caste, basic salary and marital status, show association with HRM systems, job and life and firm and peers. The three hypotheses are not proved in this research and therefore a relationship exists between the socio-economic and demographic variables with HRM systems, job and life and firm and peers.
Conclusion
Diversity factors in the Indian context affecting HRM systems, job and life and firm And peers are reflected by age, religion and caste. In India, the demographic divide of the contemporary workforce impact HRM factors, job and life and firm and peers. HRM strategies should be focused on age diversity. Consciousness towards religion and caste could not be completely eradicated from the workplace, warranting attention. The new generation of workers is different at work with respect to broad patterns of engagement (Mukherjee, 2019). Age diversity due to generational difference is likely a key factor for future HRM practices. In the Indian context, religion and caste are not positively associated. Work structure and flexibility attract a diverse workforce (Saxena, 2014); this finding is supported in the case of age diversity.
Religion and caste are surprise elements that impact the HRM practices in India. Oversensitive reaction of the macro policy at the national level accounts for identification with the above two variables. diversity factors such as gender, marital status, nativity, education and basic salary directly impact firm and values, job and life and HRM systems.
This study is important for policy decisions of the management. The demographic advantages for India are its large working population in the age group of 15–60 and being the main global supplier of human resources. Age and marital status are mainly associated with negative outcome. The management has to concentrate on human resource demographic utilisation policy and work–life balance. Further, role perspective in employment context is to be given attention, especially in terms of age and work–life balance. Human resource business partners shall devise strategies to address the above problems. Human resource business partners may frame strategies to offset the impact of religion and caste by conducting sensitivity and team-building exercises. The needs fulfilment for work–life balance differs based on the life stage of the individual. The life stage is linked to age diversity; any policy initiatives based on uniform rules and regulations will create rifts and grievances. Therefore, human resource business partners shall link compensation policy, leave policy, welfare policy and well-being and engagement policy with life stage. The younger age group prefers incentives, whereas the older generation having priorities prefers a fixed pay policy. The preference for allowances and welfare measures differs in priority across the age groups, and the same needs to be incorporated in the policy.
Human resource business partners shall conduct stress busters programmes designed and structured to meet the age diversity and life stage. These programmes may be broad based and include employee well-being sessions with team exercises to relieve stress and generate positive emotions and motivations.
Footnotes
Declaration of Conflicting Interests
The authors declared no potential conflicts of interest with respect to the research, authorship and/or publication of this article.
Funding
The authors received no financial support for the research, authorship and/or publication of this article.