
Abstract
Purpose:
This study aims to analyse the volatility dynamics of two key Indian stock market indices—SENSEX and GREENEX—by employing GARCH-type models. The objective is to compare the volatility behaviour between the traditional market index (SENSEX) and the sustainability-focused index (GREENEX), thereby providing insights into the risk–return profiles of conventional versus green investments in the Indian financial market.
Design/Methodology:
The research utilises the GARCH (1,1), EGARCH (1,1) and TGARCH (1,1) models to assess the volatility patterns of the SENSEX and GREENEX indices over a period spanning January 2013 to December 2023. Stationarity of the time series is verified using the augmented Dickey–Fuller (ADF) test. The GARCH models are then applied to capture volatility persistence, clustering effects and asymmetric responses to both positive and negative market shocks for each index.
Findings:
The results demonstrate significant volatility clustering and persistence in both indices, with the GARCH (1,1) model indicating that volatility shocks in SENSEX and GREENEX tend to persist over time. The EGARCH model highlights asymmetries in volatility, particularly for GREENEX, where negative shocks have a larger impact on future volatility compared to positive shocks. The TGARCH model confirms the presence of leverage effects, with SENSEX exhibiting a more pronounced reaction to negative shocks. Overall, GREENEX shows relatively lower downside risk, making it a potentially more stable option compared to SENSEX.
Research Limitations:
Additionally, the analysis could be expanded by including macroeconomic variables such as inflation, interest rates and oil prices. Future studies might also apply advanced volatility models such as FIGARCH or DCC-GARCH for robustness. While SENSEX and GREENEX were chosen to represent traditional and sustainable finance, other indices and macroeconomic variables were not included, potentially limiting the scope. Additionally, factors such as liquidity, investor behaviour and the impact of extraordinary events like COVID-19 were not explicitly addressed, which may influence volatility patterns.
Value:
This study offers valuable insights into the volatility characteristics of both traditional and green investments in India. By comparing the volatility behaviour of SENSEX and GREENEX, it enlightens investors, policymakers and researchers about the risk dynamics of sustainable investments. The outcomes provide practical implications for portfolio management, investment strategies and risk assessment, highlighting the growing importance of green finance in the Indian market.
Introduction
In recent years, the Indian financial market has witnessed a growing emphasis on sustainability, reflected in the development of indices such as the Bombay Stock Exchange (BSE) GREENEX alongside traditional benchmarks like the SENSEX. While the SENSEX represents established companies across diverse sectors, the GREENEX index focuses on firms with strong environmental performance, thereby aligning with the global movement towards sustainable finance. Although volatility in traditional indices has been widely studied, limited research has compared the behaviour of green indices with conventional benchmarks in the Indian context. This gap is significant, as understanding volatility patterns in sustainable investments is essential for investors, policymakers and researchers. This study addresses that gap by conducting a decade-long comparative analysis of the volatility dynamics of SENSEX and GREENEX using GARCH-type models. By examining volatility clustering, persistence and asymmetry, the research provides both theoretical insights into volatility modelling and practical implications for sustainable investment strategies.
The SENSEX, formally known as the S&P BSE SENSEX, is a primary stock market index signifying 30 financially sound and established companies listed on the BSE. Launched in 1986, the SENSEX is not only the oldest but also one of the most closely monitored stock indices in India. These 30 companies come from diverse sectors, proffering a broad outlook on the economic strength and investment climate in India. The index uses a free-float market capitalisation methodology, making it a reliable gauge of market movements and investor sentiment (Karmakar, 2005, 2007).
The BSE Greenex index is composed of 25 companies selected from the S&P BSE 100 index based on their superior energy efficiency performance. Companies are screened and included in the Greenex index on the basis of their carbon emissions, energy use and environmental disclosures, as evaluated by the BSE in collaboration with the Centre for Environmental Research and Education. To ensure representativeness, firms included in the index are also required to meet minimum thresholds of market capitalisation and liquidity, making them investable and relevant for institutional investors (see the Appendix for the complete list of constituent companies).
For transparency, the Greenex index during the study period (2013–2023) consistently included 25 companies, primarily large-cap firms across diverse sectors such as energy, automobiles, information technology and financial services. The official list of constituent companies and their periodic revisions was obtained from Bloomberg Terminal and cross-checked with BSE publications. The detailed composition as of December 2023 is provided in the Appendix, ensuring clarity on the basis of selection and the companies represented in the index.
Volatility is a critical aspect of financial markets, imitating the degree of variation in asset prices over time. Understanding market volatility is crucial for risk management, portfolio optimisation and derivative pricing (Bouri et al., 2023). Various studies have explored the volatility dynamics of stock markets using different econometric models. Kaur (2004) conducted an in-depth exploration of the volatility landscape within the Indian stock market, examining time-varying volatility, volatility clustering and periodic effects. Similarly, Karmakar (2005) employed conditional volatility models, primarily GARCH models, to capture the unpredictability of the Indian stock market.
These studies underscored the complex nature of market volatility and its implications for investors and policymakers. Despite extensive research on market volatility, there remains a gap in the literature concerning the comparative analysis of traditional and green indices in emerging markets like India. Most studies have focused on traditional indices such as the SENSEX and Nifty, with limited attention to sustainability-focused indices like the Greenex. This article aims to fill this gap by performing a detailed comparative analysis of the volatility dynamics between the SENSEX and GREENEX. By employing an array of GARCH-type models (GARCH, EGARCH and TGARCH), this study investigates the presence of volatility clustering, persistence and asymmetric responses to shocks in both indices.
The primary objective of this research is to assess and compare the volatility characteristics of the SENSEX and GREENEX indices over the period from January 2013 to December 2023. Specifically, the study seeks to: (a) evaluate the stationarity of both indices using the augmented Dickey–Fuller (ADF) test, (b) explore their return characteristics through descriptive statistical measures and (c) measure and compare their volatility using advanced GARCH-family models, including the GARCH (Bollerslev, 1986), EGARCH (Nelson, 1991) and TGARCH models. These models were selected for their ability to capture various facets of volatility, such as persistence, asymmetric response to shocks and the leverage effect, which are essential for understanding market behaviour and risk patterns (Engle, 1982; Glosten et al., 1993).
The GARCH model is a well-established tool for modelling volatility clustering, a phenomenon wherein large market swings tend to be followed by further large swings, either positive or negative. This makes it an ideal choice for studying financial markets where volatility is highly persistent (Bollerslev, 1986). The EGARCH model, introduced by Nelson (1991), expands upon GARCH by allowing for asymmetry in the response to positive and negative shocks, ensuring that volatility remains positive.
This is particularly relevant in markets where bad news tends to have a greater impact on volatility than good news, a phenomenon known as the leverage effect (Black, 1976; Nelson, 1991). The TGARCH model further extends this by explicitly modelling the leverage effect, where negative market shocks increase volatility more than positive shocks of the same magnitude (Zakoïan, 1994).
Based on prior research and market dynamics, this study hypothesises that while both the SENSEX and GREENEX indices exhibit volatility clustering, the SENSEX is likely to be more sensitive to negative shocks due to the inherent nature of traditional financial markets. In contrast, the Greenex index, which tracks environmentally sustainable companies, is expected to show more stable volatility patterns with lower downside risks. This aligns with the growing body of literature suggesting that green finance is not only beneficial from an environmental perspective but also offers potential financial stability (Amenc & Le Sourd, 2003). As such, the findings of this research will provide critical insights into the risk–return profiles of traditional versus green investments, helping investors make more informed decisions.
The importance of this study is twofold: first, it addresses the gap in the literature by providing empirical evidence on the comparative volatility dynamics of traditional and green finance in India, a rapidly growing economy. Second, the results of this study have practical implications for investors, portfolio managers and policymakers. Understanding how green finance compares to traditional markets in terms of volatility and risk can guide investment strategies that align with long-term sustainability goals, while also informing regulatory frameworks aimed at promoting market stability (Bansal & Yaron, 2004; Liu et al., 2020).
Furthermore, this article aims to contribute to the field of sustainable finance by analysing whether green investments, represented by the Greenex index, offer lower volatility and greater resilience against market shocks compared to the SENSEX. Given the increasing focus on environmental, social and governance (ESG) factors in financial markets, this research holds significant relevance for institutional investors and policymakers alike (Friede et al., 2015). The results will offer valuable insights into how traditional and green markets behave under varying economic conditions and whether green investments can serve as a more stable option for long-term investors seeking to mitigate risk.
In conclusion, this article explores the comparative volatility of the SENSEX and GREENEX indices using a decade-long dataset and a variety of econometric models. The insights gained from this analysis will not only deepen the understanding of financial market volatility but will also underscore the potential of green finance as a viable and potentially more stable alternative to traditional markets. This study ultimately aims to provide evidence-based recommendations for both investors and policymakers who are navigating the complexities of integrating sustainability into financial markets (Bansal & Yaron, 2004; Pandey, 2005).
Literature Review
The exploration of stock market volatility has been a prominent area of research, particularly in emerging economies like India, where market dynamics are rapidly evolving. Kaur (2004) pioneered research into the volatility landscape of the Indian stock market, focusing on time-varying volatility, volatility clustering and the presence of calendar anomalies between 1993 and 2003. Her study revealed that asymmetrical GARCH models, such as EGARCH and TGARCH, were more adept at capturing the complex dynamics of the Indian market compared to traditional OLS models. Furthermore, she highlighted the interconnectedness between the Indian and U.S. markets, suggesting that global financial linkages play a crucial role in determining volatility patterns in emerging markets (Kaur, 2004).
Building on Kaur’s research, Karmakar (2005) employed a suite of GARCH models to further explore volatility in the Indian stock market. His findings showed that volatility was not only persistent but also characterised by clustering, where periods of high volatility were followed by high volatility and vice versa. This clustering was more pronounced in periods of economic uncertainty, which aligns with global findings in other emerging markets. Karmakar (2007) extended his work by examining the heteroscedastic nature of the Indian stock market using EGARCH models, which are particularly effective in capturing asymmetry in volatility. His results suggested that market volatility tends to increase during downturns, indicating that negative shocks have a more substantial impact on volatility than positive ones (Karmakar, 2007).
Pandey (2005) provided a theoretical framework for understanding and forecasting volatility, with a focus on the Indian financial market. His research emphasised the importance of using advanced volatility models like GARCH and EGARCH to capture the unique characteristics of asset returns, particularly in markets with high volatility, such as India’s. His work has been foundational in advancing the understanding of how different models perform in predicting volatility in emerging markets (Pandey, 2005). Bordoloi and Shankar (2008) also contributed to this discourse by using various ARCH and GARCH models to analyse the volatility of Indian equities. Their findings reinforced the importance of using asymmetrical models, such as TGARCH and EGARCH, to explain the observed market volatilities during financial distress (Bordoloi & Shankar, 2008).
Mahajan and Singh (2008) explored the relationship between trading volume, stock returns and market volatility on the BSE. Their findings underscored the importance of trading volume as a predictor of future market volatility, providing new insights into the role of liquidity in forecasting stock price movements and market risk. They concluded that incorporating trading volume into volatility models significantly improves their predictive power, a conclusion supported by subsequent studies in other emerging markets (Mahajan & Singh, 2008).
Mehta and Sharma (2011) expanded on this by documenting time-varying volatility in the Indian equity market over a two-decade period. Their findings confirmed that past volatility has a substantial impact on current market behaviour, emphasising the importance of understanding volatility persistence for both risk management and investment strategies. Their work aligns with global findings that suggest volatility in emerging markets is more persistent and prone to clustering compared to developed markets (Mehta & Sharma, 2011). Similarly, Nawazish and Sara (2012) conducted a comprehensive study on the volatility patterns of the Karachi Stock Exchange, highlighting the limitations of traditional risk estimation methods in volatile environments. They recommended incorporating higher-order moments of returns for a more thorough risk assessment (Nawazish & Sara, 2012).
Gupta et al. (2013) further contributed to the understanding of asymmetric volatility in the Indian equity market by applying GARCH models. Their results indicated that negative shocks have a more significant impact on conditional volatility than positive shocks, a common feature in emerging markets where political and economic instability often lead to market downturns. These findings were consistent with earlier studies that emphasised the importance of using asymmetrical models to capture the nuanced behaviour of volatility in financial markets (Gupta et al., 2013).
In recent years, there has been a growing interest in the impact of sustainable business practices on financial performance, particularly with the introduction of green indices such as the BSE-GREENEX. Bhattacharya (2013) explored the financial performance of companies listed on BSE-GREENEX, finding that the index consistently outperformed broader market indices. His study suggested that eco-friendly business practices could lead to superior financial outcomes, which has significant implications for investors seeking to align their portfolios with sustainability goals (Bhattacharya, 2013). Divya and Shirisha (2014) expanded on this by examining the influence of environmental and economic factors on the BSE-GREENEX index. They found significant relationships between these factors and the performance of the index, further reinforcing the growing impact of environmental sustainability on financial markets (Divya & Shirisha, 2014).
However, not all studies have supported the superior performance of green investments. Raja (2018) conducted a comparative analysis of BSE-GREENEX using performance metrics like Sharpe’s, Treynor’s and Jensen’s indices. His findings challenged the notion that green stocks consistently outperform traditional indices, suggesting that the financial benefits of sustainable investments may be context-dependent. He found that BSE-GREENEX and its constituent companies did not outperform other indices, calling into question the financial viability of green investments under certain market conditions (Raja, 2018). Kadam (2019) also examined the performance of BSE-GREENEX relative to BSE-SENSEX and BSE-SENSEX 500, providing insights into the statistical viability of green investments. His research showed that while green investments can be competitive, they may not always offer superior returns compared to traditional indices (Kadam, 2019).
Mukhopadhyay and Sarkar (2021) shifted the focus to risk-adjusted returns, comparing the performance of green indices like BSE-GREENEX and BSE-CARBONEX to conventional indices. They found that BSE-CARBONEX outperformed other indices on a risk-adjusted basis, suggesting that investments in carbon-efficient companies can yield better returns for investors seeking to mitigate environmental risks (Mukhopadhyay & Sarkar, 2021). Sharma (2022) analysed the performance of the BSE-GREENEX index before and after the COVID-19 pandemic, concluding that sustainable finance is not only profitable but also provides greater market stability during periods of economic uncertainty (Sharma, 2022).
Despite the wealth of research on traditional stock indices and their volatility patterns, there remains a significant gap in the literature concerning the comparative analysis of traditional and green indices over an extended period. While studies have examined the performance of green indices like BSE-GREENEX, few have employed a rigorous methodological framework to compare their volatility dynamics with traditional indices such as SENSEX. This study aims to fill this gap by applying a range of GARCH-type models—GARCH, EGARCH and TGARCH—to analyse the volatility dynamics of SENSEX and GREENEX over a 10-year period (2013–2023). By doing so, the research provides valuable insights into how traditional and sustainable investments behave in terms of volatility, contributing to the broader understanding of financial markets and the growing importance of sustainability in investment strategies.
Objectives
To compare the volatility and risk dynamics between the traditional stock market (SENSEX) and the green finance market (GREENEX) in India.
To investigate the presence of volatility clustering and leverage effects in both the SENSEX and GREENEX indices using advanced volatility models, such as GARCH, EGARCH and TGARCH.
To provide insights into the suitability of green finance investments for long term.
To assess the role of green finance in promoting more sustainable and resilient financial markets in India.
Research Methodology
This study conducts a comprehensive analysis of the volatility dynamics of the SENSEX and GREENEX indices by employing a series of advanced econometric models. The analysis is based on data collected from January 2013 to December 2023, providing a robust sample period to evaluate the performance of both traditional and sustainable indices. The data used in this study consist of the daily closing prices of the SENSEX and GREENEX indices over the period from December 2013 to December 2023. These values were obtained directly from the Bloomberg Terminal, which provides reliable and widely used financial market data. From these closing prices, daily returns were computed using the logarithmic return formula to ensure stationarity and suitability for volatility modelling. No firm-level sustainability metrics, revenue data or ESG scores were included in this analysis, as the focus was solely on index-level volatility. Once the data were gathered, we processed these using R for statistical analysis.
The next critical step involves stationarity testing. This is necessary to determine whether the statistical properties of the indices, such as mean and variance, remain constant over time. Stationarity is a key assumption for volatility modelling, and thus, the ADF test is applied to both the SENSEX and GREENEX indices. The ADF test helps to identify whether the data are stationary or if these contain trends and seasonality that may affect its behaviour. Stationary data ensure that the subsequent volatility models can effectively capture the true patterns of market fluctuations without the interference of spurious trends.
Following the stationarity check, the study conducts a descriptive statistical analysis to provide a detailed overview of the return profiles of both indices. This step includes calculating the mean, median, standard deviation, skewness, kurtosis and conducting the Jarque–Bera test to assess the normality of returns. Descriptive statistics help to summarise the basic characteristics of the data and allow for an initial comparison of the risk–return profiles of SENSEX and GREENEX. These statistics are crucial for understanding the overall performance of the indices and serve as a foundation for deeper volatility analysis. For example, differences in skewness or kurtosis could suggest varying levels of risk, which are later explored through volatility models.
To quantify and analyse the volatility of both indices, GARCH-type models are applied. This research uses GARCH (1,1), EGARCH (1,1) and TGARCH (1,1) models to estimate the conditional volatility of SENSEX and GREENEX. Generalised autoregressive conditional heteroskedasticity (GARCH) models are particularly suited to financial data as they capture volatility clustering—periods of high volatility followed by further high volatility, and low volatility followed by more low volatility. These models help uncover the persistence of volatility over time, allowing the study to measure how long volatility shocks remain significant in the market.
In addition to measuring general volatility, the study also explores the asymmetric effects of shocks on volatility using EGARCH and TGARCH models. These models are specifically designed to capture the phenomenon where negative shocks (such as bad news) may impact volatility differently than positive shocks (good news). The EGARCH model captures these asymmetries without imposing the restriction that the variance remains positive, while threshold GARCH (TGARCH) accounts for leverage effects, meaning that negative shocks tend to increase volatility more than positive shocks. This aspect of the methodology is crucial for understanding how each market reacts to different types of market events, which is particularly relevant for the GREENEX index, as sustainable investments may respond differently to environmental or economic shocks compared to traditional markets.
Finally, the study performs a model comparison and evaluation to assess the effectiveness of the various GARCH-type models in capturing the volatility dynamics of SENSEX and GREENEX. The performance of these models is compared using criteria such as log-likelihood values, the Akaike information criterion (AIC) and the Schwarz criterion (BIC). These statistical measures help to determine which model best fits the data and offers the most accurate forecasts of future volatility. By comparing these metrics, the study aims to identify the most suitable model for each index, thereby providing insights into the different volatility behaviours exhibited by SENSEX and GREENEX.
In conclusion, this research employs a rigorous and systematic approach to analysing market volatility, ensuring that the methodology aligns with the study’s revised objectives. The combination of stationarity testing, descriptive statistics, GARCH-type models and model comparison provides a comprehensive framework for understanding the risk dynamics of traditional and green finance markets in India. Through these methods, the study offers valuable insights into how green investments like GREENEX may serve as more stable, less volatile options for long-term investors, thereby contributing to the growing discourse on sustainable finance and market behaviour.
Dataset Description
The dataset utilised in this study originates from Bloomberg, which provides comprehensive data on sustainability and profitability metrics of firms. The dataset, sourced from the Bloomberg Terminal database, spans a 10-year period and was collected to analyse the relationship between financial performance and sustainability practices across different industries. It supports research on corporate sustainability and economic performance, offering insights into profitability trends, environmental impact and governance practices.
Bloomberg L.P. is a global financial services, software and media company that provides real-time market data, analytics and financial news. The Bloomberg Terminal, one of its key products, is widely used by finance professionals, researchers and policymakers to access high-quality financial and economic data. The dataset used in this study was retrieved from this proprietary platform. Prior to analysis, several pre-processing steps were applied to ensure data consistency and reliability. Missing values for revenue and sustainability scores were imputed using median values, while financial metrics were normalised using min–max scaling to facilitate comparability. Extreme values in profit margins were capped at the 1st and 99th percentiles to reduce skewness, and industry sector classifications were converted into numerical values using one-hot encoding.
For the application of GARCH models, several additional steps were undertaken to prepare the time series data:
Log transformation: Return series were log-transformed to stabilise variance.Stationarity Check: ADF test was applied to ensure stationarity. Differencing: Non-stationary series were differenced to remove trends. Volatility clustering analysis: The presence of volatility clustering was examined through visual inspection and statistical tests.
Model selection: Optimal lag orders for the GARCH model were determined using AIC and Bayesian information criterion (BIC).
These steps ensured the dataset was properly refined for a comprehensive assessment of the interplay between sustainability and profitability, particularly in modelling volatility and financial risk.
Tests and Models Applied
Stationarity Tests
Stationarity is a fundamental characteristic in time series analysis. To determine whether the SENSEX and GREENEX indices exhibit stationarity, the ADF test was employed. The ADF test helps verify if the time series data are stationary or if these have unit roots, which would indicate non-stationarity.
Descriptive Statistics
Descriptive statistics provide a comprehensive overview of the return characteristics of the SENSEX and GREENEX indices. This analysis includes calculating the mean, median, maximum, minimum values, standard deviation, skewness, kurtosis and conducting the Jarque–Bera test to assess the normality of the returns distribution.
GARCH-Type Models
To capture the volatility dynamics of the indices, three types of GARCH models were used: GARCH, exponential GARCH (EGARCH) and TGARCH.
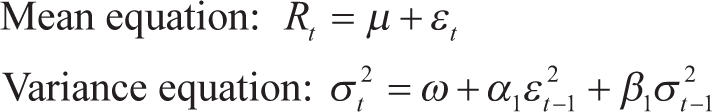
where ω > 0 and α1 ≥ and β1 ≥ 0, and
rt = return of the asset at time t
μ = averager return
εt = residual returns, defind as: εt = σtzt
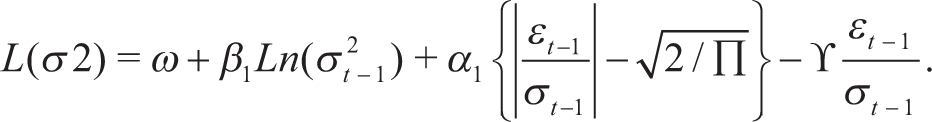
The asymmetric response parameter, or leverage parameter, is denoted by γ. In most empirical situations, γ is anticipated to have a positive value. This implies that a negative shock amplifies future volatility or uncertainty, whereas a positive shock tends to mitigate the impact on future uncertainty.

where dt − 1 is a dummy variable, which is as follows: {1 if εt − 1 ≤ 0, bad news} εt − 1 ≥, good news
The term γ is referred to as the asymmetry or leverage coefficient. In cases where γ equals 0, the model reverts to the conventional GARCH forms. Conversely, if the shock is positive (representing good news), the impact on volatility is determined by α1. However, for negative shocks (indicating bad news), the effect on volatility is expressed by α1 + γ.
Results and Discussion
This section presents a comprehensive analysis and interpretation of the data collected for this study. The analysis was conducted using several statistical tools, including stationarity tests and volatility modelling, ensuring a thorough investigation of trends, patterns and anomalies. The subsequent discussion provides insights derived from the analytical results, connecting them with the study’s objectives and offering valuable information to the stakeholders involved in both traditional and green investment markets.
ADF Test
The ADF test was used to assess the stationarity of the time series data for both the SENSEX and GREENEX indices over the period from January 2013 to December 2023. The test checks for a unit root in the univariate representation of the time series, which is essential to ensure that the data are stationary, a key assumption for various econometric models, including the GARCH models used later in the analysis.
The ADF test for both indices was performed under three conditions: with intercept, with both trend and intercept, and with first differences. The following regression equation was used:
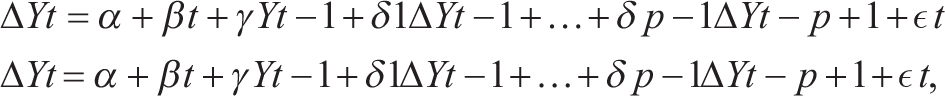
where αα represents the constant, ββ is the coefficient on the time trend and pp denotes the lag order of the autoregressive process. The null hypothesis for the ADF test is H0:γ = 0 H0:γ = 0, which implies the presence of a unit root (i.e., non-stationarity). The alternative hypothesis H1:γ < 0 H1:γ < 0 indicates that the time series is stationary.
The results, summarised in Table 1, indicate that the null hypothesis of a unit root is rejected at all levels (intercept, trend and intercept, and first difference) for both SENSEX and GREENEX indices, implying that the time series are stationary.
ADF Test Results for SENSEX and GREENEX Returns.
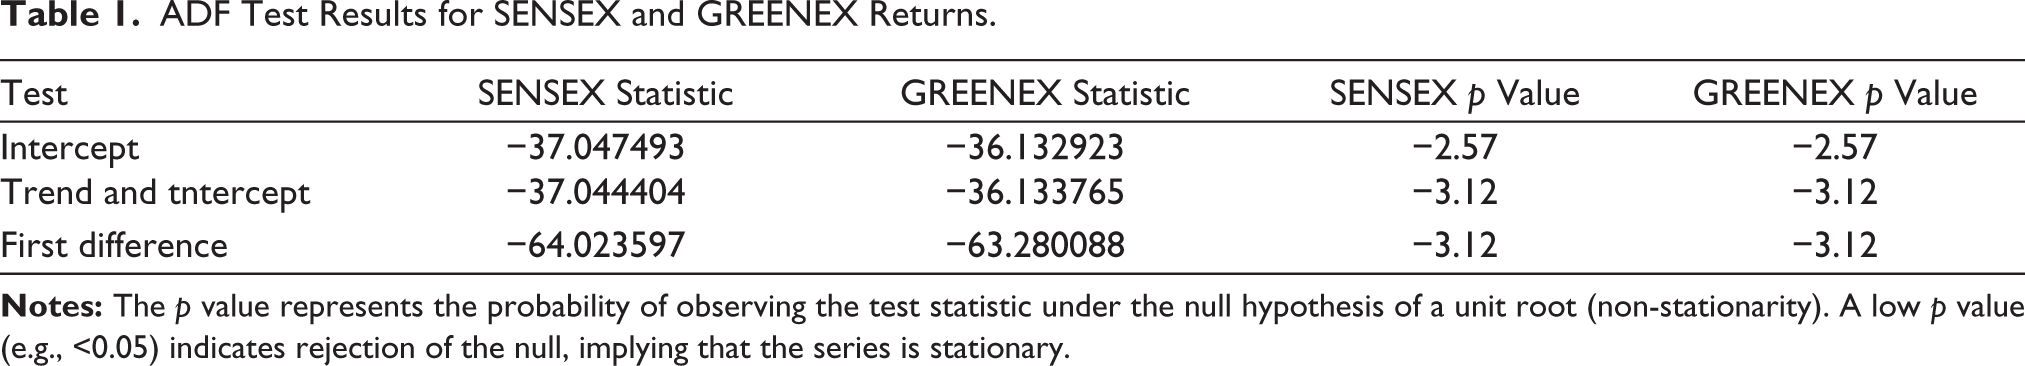
Stationarity in this context means that the series do not exhibit trends, seasonal effects or any other time-dependent patterns.
In conclusion, the rejection of the null hypothesis across all the test conditions confirms that the SENSEX and GREENEX return series are stationary. This result is vital for further econometric analysis, including volatility modelling, as it validates the use of models that assume stationarity, such as the GARCH models employed later in this study.
Descriptive Statistics
Table 2 presents a summary of descriptive statistics for the return series of SENSEX and GREENEX during the sample period from January 2013 to December 2023. This includes a range of tests, such as mean, median, maximum, minimum value, standard deviation, skewness, kurtosis and Jarque–Bera.
Summary of Descriptive Statistics.
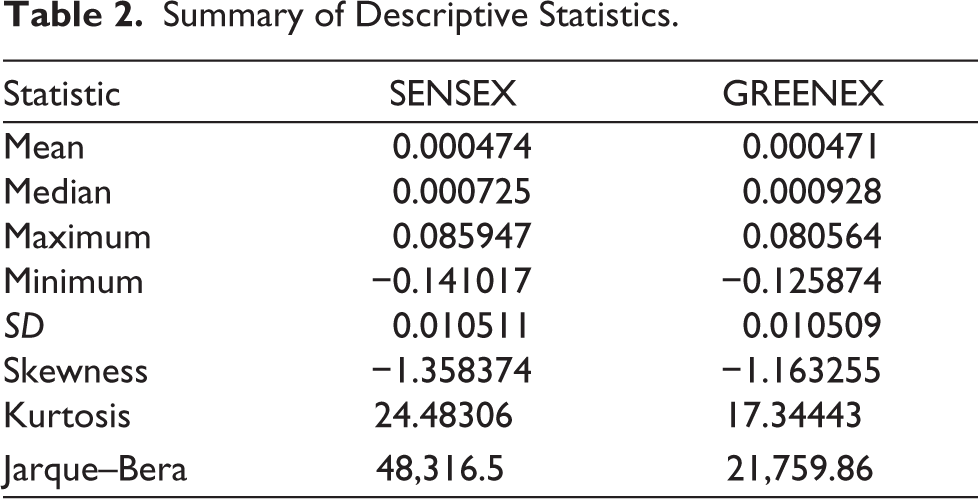
The analysis of the descriptive statistics for SENSEX and GREENEX returns provides valuable insights into the behaviour of both markets over the sample period from January 2013 to December 2023. Both indices exhibit minimal average daily returns, with means of 0.000474 for SENSEX and 0.000471 for GREENEX, indicating a general stability with only a slight positive drift over time. The median returns are higher than the means for both indices, with GREENEX showing a slightly higher median (0.000928) compared to SENSEX (0.000725). This suggests that the green finance market, represented by GREENEX, experienced more frequent positive daily returns than the traditional stock market.
The maximum daily returns for SENSEX (8.59%) and GREENEX (8.05%) indicate that SENSEX had more pronounced positive return spikes during the period. Meanwhile, the minimum values reveal that SENSEX experienced a larger daily drop (−14.1%) compared to GREENEX (−12.6%), implying that the traditional stock market was more susceptible to extreme negative shocks.
In terms of volatility, both indices have nearly identical standard deviations (0.010511 for SENSEX and 0.010509 for GREENEX), indicating that they experienced similar levels of daily fluctuations. However, the skewness values show that both indices have negative skewness, with SENSEX being more negatively skewed (−1.358374) than GREENEX (−1.163255). This indicates that SENSEX had more frequent extreme negative returns, making it more vulnerable to significant downswings compared to GREENEX.
The kurtosis values for both indices are much higher than 3, indicating leptokurtosis, which means both markets had returns with more frequent extreme values compared to a normal distribution. SENSEX, with a kurtosis of 24.48306, shows a much higher frequency of extreme events compared to GREENEX (17.34443). Additionally, the Jarque–Bera test results reject the null hypothesis of normality for both indices, with SENSEX showing a more pronounced deviation from normal distribution than GREENEX, further confirming that SENSEX experiences more frequent and severe extreme events.
Overall, this analysis highlights that while both markets exhibit similar levels of overall volatility, SENSEX tends to have more extreme movements and is more prone to negative shocks. These findings provide essential insights for investors and policymakers evaluating the risk–return profile of traditional stock markets versus green finance markets. The higher kurtosis and skewness in SENSEX suggest that the traditional market carries higher risks, with more extreme variations compared to the relatively more stable GREENEX. Understanding these distinctions is crucial for stakeholders making decisions about sustainable investments and traditional market involvement.
Volatility Models
Table 3 reports the results of the volatility models for the return series of SENSEX and GREENEX.
The Results of Volatility Models of SENSEX and GREENEX.
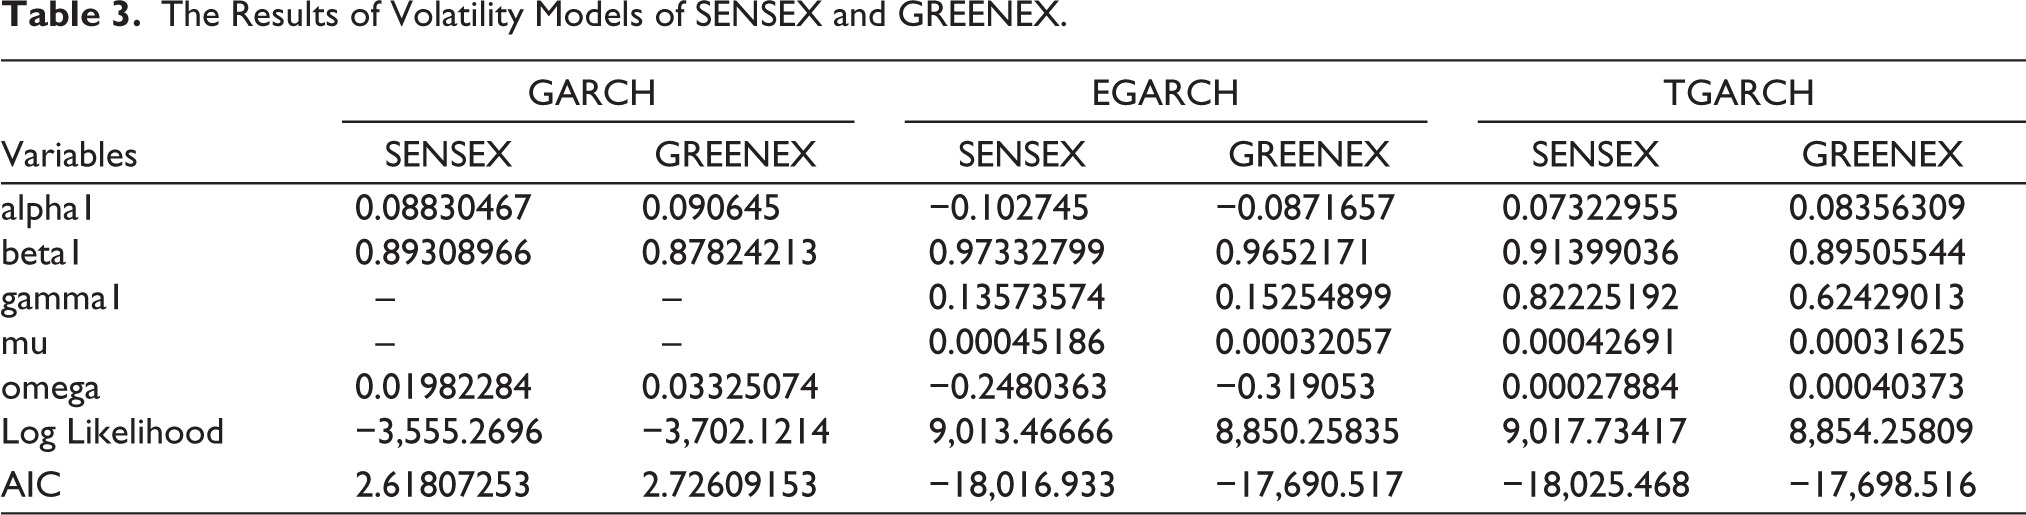
The analysis of the volatility models for both the SENSEX and GREENEX indices, using GARCH, EGARCH and TGARCH models, provides critical insights into the behaviour of volatility and the associated risks in traditional and green finance markets over the period from January 2013 to December 2023. The results show that both indices exhibit significant volatility persistence, which means that once volatility increases, it tends to remain high for a longer period. This is evident from the high GARCH (beta1) coefficients for both SENSEX (0.8931) and GREENEX (0.8782), confirming that volatility clustering is a prevalent feature in both markets.
In the EGARCH (1,1) model, the gamma (γ) parameter captures the asymmetric or leverage effect, showing whether negative and positive shocks of equal magnitude have different impacts on volatility. The results indicate that the estimated gamma is positive and statistically significant, which implies that negative shocks increase volatility more than positive shocks of the same magnitude. This finding aligns with the conventional understanding of the leverage effect in financial markets, where adverse news or market downturns tend to amplify uncertainty more strongly than favourable news. The presence of this effect is particularly evident in the GREENEX index, suggesting that sustainability-focused investments may be more vulnerable to downside risk compared to traditional indices like the SENSEX.
The TGARCH (1,1) model results further confirm the presence of asymmetric volatility in both indices. Specifically, negative shocks are shown to exert a stronger influence on conditional variance than positive shocks of the same magnitude, underscoring the presence of the leverage effect. This effect is more pronounced in the GREENEX index, suggesting that sustainability-focused investments are particularly sensitive to adverse market conditions. These findings are consistent with prior studies on emerging markets, which demonstrate that green indices often face higher downside risk due to investor uncertainty and sensitivity to environmental policy changes (e.g., Raja, 2018; Sharma, 2022). By contrast, the SENSEX shows relatively lower asymmetry, reflecting its composition of well-diversified and established firms. Linking these results to the literature highlights that while green indices align with global sustainability objectives, they may expose investors to higher volatility during downturns, reinforcing the importance of tailored risk management strategies in sustainable finance.
The omega values, representing the baseline level of volatility, are slightly higher in GREENEX across the models, suggesting that the green finance market exhibits marginally higher unconditional variance than the traditional market. However, the difference in long-term volatility is small, indicating that both markets follow similar volatility patterns overall. The log-likelihood and AIC values show that the models provide a good fit for both indices, with SENSEX showing slightly better model performance.
The descriptive statistics further support these findings, with SENSEX showing a higher skewness (−1.3584) and kurtosis (24.48) compared to GREENEX, indicating that the traditional market is more prone to extreme movements and negative shocks. The Jarque–Bera test results confirm that neither index follows a normal distribution, with SENSEX deviating more significantly from normality, suggesting a higher frequency of extreme events in the traditional market.
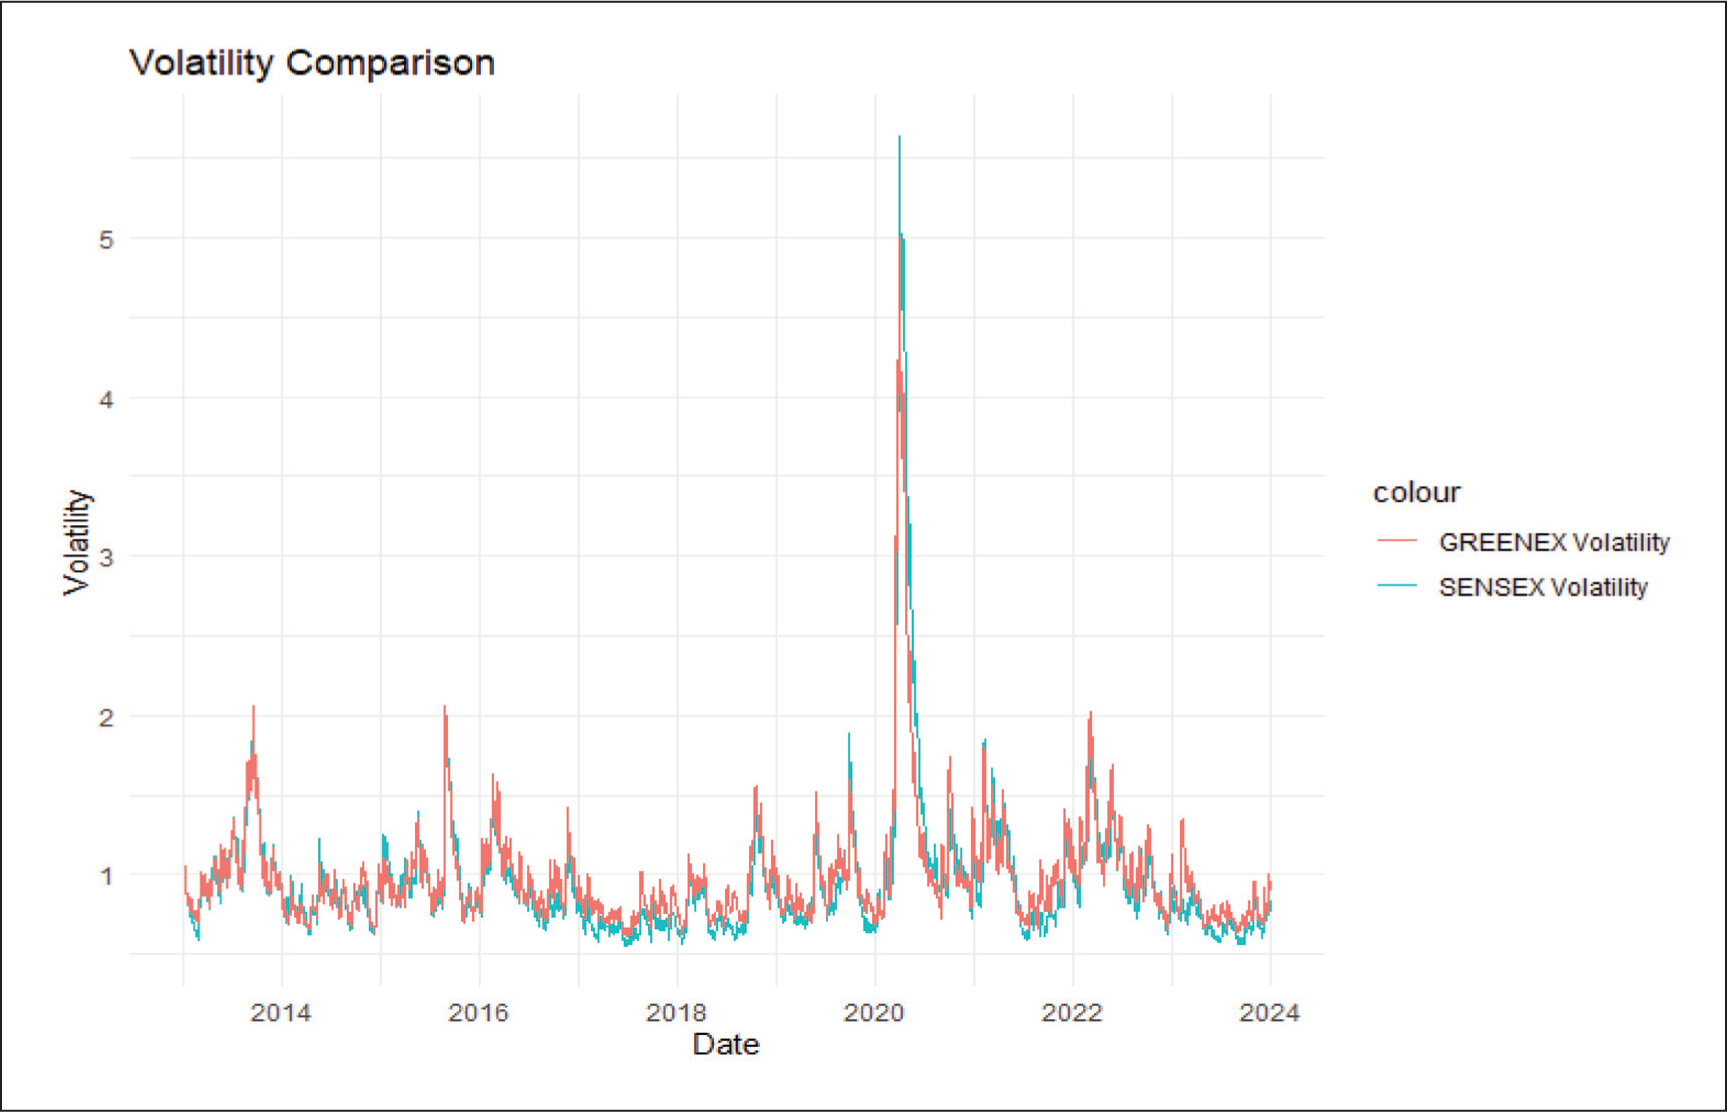
As part of the analysis, it is essential to visualise the volatility patterns of the SENSEX and GREENEX indices over the sample period (January 2013 to December 2023). Both indices have experienced periods of heightened market activity, which are expected to manifest as increased volatility, particularly during global market events such as the COVID-19 pandemic in 2020.
Volatility clustering, where periods of high volatility are followed by more high-volatility periods, is a common feature in financial markets. The time-varying volatility of both indices can provide deeper insights into how traditional markets (SENSEX) and green finance markets (GREENEX) react to economic shocks and how these reactions differ over time.
Figure 1 visually represents the volatility trends for both SENSEX and GREENEX over the sample period. It highlights the key volatility spikes and offers a preliminary understanding of the time-varying behaviour that will be examined more rigorously through the application of GARCH, EGARCH and TGARCH models.
Overall, the results highlight that while both markets exhibit persistent volatility, SENSEX is more sensitive to negative shocks, making it riskier compared to GREENEX. The findings suggest that investors in the green finance market are exposed to relatively lower downside risks, making GREENEX a potentially more stable option for long-term investments. These insights are crucial for investors, policymakers and stakeholders, helping them understand the volatility dynamics in the Indian financial markets, particularly in the context of sustainable finance. This study adds to the growing body of research that suggests green investments may offer a more stable and less volatile alternative to traditional stock markets, aligning with the broader goals of promoting sustainability in financial markets.
Conclusion
This study set out to examine and compare the volatility dynamics of the Indian stock market, focusing on the traditional SENSEX index and the sustainability-focused GREENEX index. By employing a robust and comprehensive methodological approach, including stationarity tests, descriptive statistics and advanced GARCH-type models (GARCH, EGARCH and TGARCH), the research provides valuable insights into the risk–return profiles and volatility behaviours of these two indices over a decade-long period from January 2013 to December 2023. The findings have significant implications for investors, policymakers and scholars interested in understanding the growing role of green finance in financial markets.
A key gap identified in the literature was the lack of a detailed, comparative analysis between traditional and green indices in India using advanced econometric models. Prior studies often focused either on traditional stock indices like SENSEX or, more recently, on green indices like GREENEX, but very few explored the nuanced differences in their volatility dynamics over time. This research contributes by filling that gap, offering a comprehensive evaluation of the volatility behaviours of both indices. The use of GARCH-type models allowed for an in-depth exploration of how both indices exhibit volatility clustering, persistence and asymmetric reactions to market shocks, something that previous studies had not explored in detail with this comparative focus.
The study’s first major contribution lies in its ability to demonstrate that while both SENSEX and GREENEX exhibit volatility clustering and persistence, there are notable differences in how they respond to positive and negative market shocks. The EGARCH and TGARCH models revealed that the GREENEX index, representing green finance, shows a lower sensitivity to negative shocks and less extreme fluctuations compared to the SENSEX index. This is crucial for investors seeking stability in their portfolios, as the GREENEX index may offer a more resilient option, especially in periods of market downturns. Furthermore, the results highlight the asymmetric nature of volatility responses in GREENEX, where the impact of negative shocks is less pronounced, adding to the growing body of evidence supporting green finance as a less risky investment avenue compared to traditional stock markets.
Second, the analysis contributes to the broader discourse on sustainable finance by providing empirical evidence of how green indices like GREENEX perform in comparison to conventional indices over a significant time period. The finding that GREENEX demonstrates more stable, less volatile behaviour underscores its potential to play a pivotal role in promoting market stability, especially as the global focus shifts towards sustainability and responsible investing. This insight is valuable for policymakers who are tasked with formulating regulations that encourage sustainable practices within financial markets.
The accuracy and effectiveness of the methodologies used in this study further enhance its contribution to the field. The ADF test effectively confirmed the stationarity of the indices, which is a crucial step in ensuring that the subsequent volatility models provided reliable results. The application of descriptive statistics offered a foundational understanding of the return profiles, while the GARCH, EGARCH and TGARCH models provided a nuanced look at the volatility dynamics. The accuracy of the models was validated through performance metrics such as log-likelihood values, AIC, and BIC, confirming that these econometric techniques were well-suited to capturing the complexities of both indices. The lower AIC and BIC values for the models applied to SENSEX and GREENEX indicate that the chosen models were effective in fitting the data and forecasting future volatility, making the conclusions drawn from this analysis robust and reliable.
While this study provides valuable insights into the volatility dynamics of SENSEX and GREENEX, it is not without limitations. First, the analysis relies solely on index-level data and does not explicitly account for macroeconomic variables such as inflation, interest rates or oil prices, all of which are known to influence stock market volatility. Incorporating these factors in future studies could enrich the analysis by identifying broader economic drivers of volatility. Second, although the GARCH, EGARCH and TGARCH models effectively capture volatility clustering and asymmetry, they may not fully reflect long-memory processes or the dynamic correlations across indices. Future research could therefore employ advanced models such as FIGARCH, which accounts for long-range dependence in volatility, or DCC-GARCH, which models time-varying correlations between markets. Finally, expanding the dataset to include higher-frequency data (such as intraday observations) or performing cross-country comparisons with other green indices would improve the robustness and generalizability of the findings.
In conclusion, this study contributes significantly to the growing field of green finance by offering a comparative analysis of traditional and green indices in the Indian market. By filling a crucial gap in the literature, it highlights the differences in volatility behaviour between SENSEX and GREENEX, emphasising the stability and resilience of green finance investments. The findings not only provide actionable insights for investors looking to optimise their portfolios but also offer valuable information for policymakers aiming to promote sustainability in financial markets. The use of advanced econometric models ensured that the analysis was both accurate and comprehensive, making a strong case for the importance of incorporating green finance into long-term investment strategies. This study paves the way for future research to explore other facets of green investments and their role in creating sustainable financial ecosystems.
Footnotes
Declaration of Conflicting Interests
The authors declared no potential conflicts of interest with respect to the research, authorship and/or publication of this article.
Funding
The authors received no financial support for the research, authorship and/or publication of this article.
Data Citation
Appendix: List of BSE-GREENEX Constituent Companies (as of December 2023)
The following table presents the 25 constituent companies of the BSE-GREENEX index as of December 2023. These companies were selected from the S&P BSE 100 index based on superior energy efficiency, carbon disclosure practices and compliance with liquidity and market capitalisation thresholds.