
Abstract
Keywords
Introduction
In metropolitan cities, the construction of a metro train infrastructure involves heavy investments, required to enable its service to the public. The main reasoning for the construction of a metro is to cater to the rising need for efficient public transportation in the city, along with alleviating the increasing pollution and traffic congestion. In India, metropolitan cities such as Mumbai and Delhi have installed metro transit systems for an effective and eco-friendly transportation in order to provide relief from the increasing traffic congestion and emissions (Haque & Patel, 2017). Along with the pollution and car traffic congestion that are seen to be increasing, the public transportation system across major cities has become enormously congested due to the increase in the number of commuters worldwide (Anantsuksomsri & Tontisirin, 2015; Cheng, 2018; Miller, 2016). For instance, in Beijing, a passenger has to wait up to 40 minutes to board a subway train during peak hours (Wang, Ettema, Zhou, & Sun, 2018). Such delays trigger the governments to enable an additional mode of public transport that exhibits the sustainability factors, which can be enabled by the incorporation of sustainable fuels, along with efficient and effective land usage patterns (Subash, Chandrabose, Umamaheshwari, & Maharajan, 2013). The governments of various countries have been searching for the solutions of two vital issues in contemplation with the mobility systems. First, it is vital to portray the resources of the government at a national level, in order to achieve a sustainable mobility system. Second, it is vital to increase the capacity of cities, which in turn will enhance mobility with the adoption of sustainable operations and solutions. The adoption of sustainable operations along with an effective crowd management system has been echoed as the need of the hour for metro transportation systems across the world. Therefore, we focus in this case study by following a theoretical framework developed through literature review, followed by a supply chain operations reference (SCOR) model development and an ARENA simulation of Dubai Metro.
Literature Review
Origin of the Dubai Metro
Ever since the re-ordination of the United Arab Emirates (UAE) in 1971, the global identity of Dubai has been shaped by the three major modes of transportation: air, marine and road (Keilo & Montagne 2012). During the period of increasing local and expatriate population, the government of Dubai has sensed the need for establishing a metro system, since the road network system in the city could bring in challenges of providing efficiency for the growing population (Keilo & Montagne, 2012; Nassar, Alan Blackburn, & Duncan Whyatt, 2014). Dubai made some enormous advancements in terms of economy, investment, infrastructure and population, but these advancements in the period of growth were at times been hindered by the increasing population, a dilemma comparable to what most of the developed and developing cities around the world had to undergo. As a defence against the traffic congestion among the growing population, the construction of world class infrastructure was proposed, which would enhance and transform the current place into a metropolitan city. As a result, the consortium called Dubai Rapid Link (DURL) was created by the government in July 2005 to bring the design plan into reality by means of an engineer-to-order process (Narayanaswami, 2015). The launch of the Dubai Metro was incepted at 9 September 2009, at 09:09 pm (Acuto, 2010; Bobley, 2016), at a time when the launch was instrumental in reviving the image of Dubai during the global financial crisis (Keilo & Montagne, 2012). Today, the Dubai Metro acts as a world-class infrastructure that hubs international business and tourist attractions together (Kamarudeen, Sundarakani, & Nabhan, 2018).
Operations of Dubai Metro
Dubai is regarded as one of the most advanced cities for its convenience and advancements in transportation across UAE. Keilo and Montagne (2012) has revealed in his research that the growth of Dubai has been fuelled by various combinations of mobility factors such as automobile taxis, water taxis, public bus facility and finally the self-automated metro which has been effectively connecting all the major business hubs and prime employment locations. This has been evidently elucidated by the increase in the number of people using the metro for their commutation purposes over the years.
The Dubai Metro trains have been equipped with more than 142 seats, with a maximum capability of undertaking 897 passengers on a single trip. On an average day, the Dubai Metro has the potential to carry 1.2 million passengers (Railway Technology, n.d.). As of 2016, more than 830 million riders have used the Dubai metro service, which is 329,365 every day, 13,723 every hour, 229 every minute and 3.8 every second (Tesorero, 2016). The Roads and Transport Authority (RTA) in its website has announced that the passenger number broke the 1 billion barrier in September 2017.
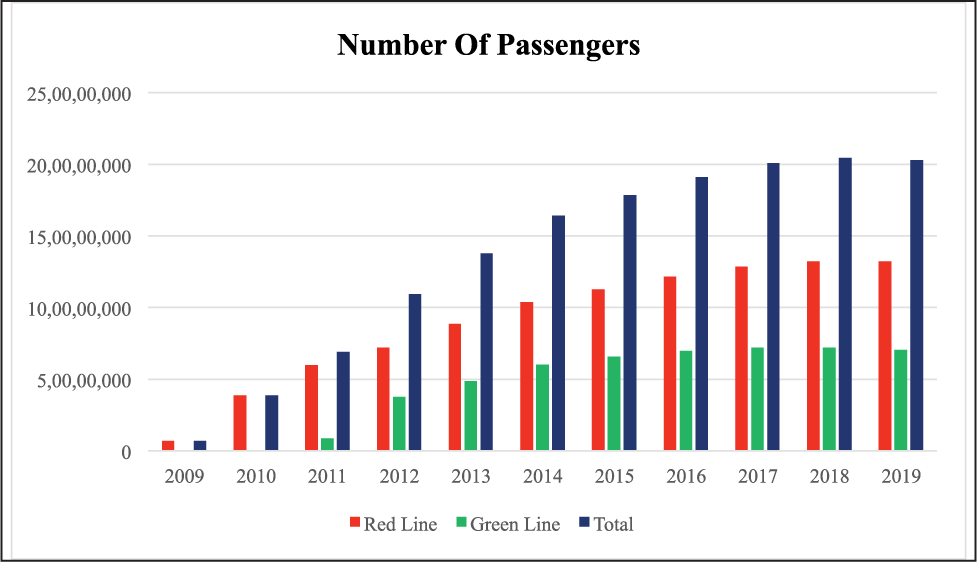
The operations of the Dubai Metro have been handled by Serco, a UK-based traffic management service provider. In the year 2013, Serco renewed its contract until 2019 for a whopping €355 million for undertaking the service operations of the Dubai Metro (Serco, 2013). Currently, the Dubai Metro network constitutes 47 stations divided into two zones of Red Line and Green Line, spread through a track length of almost 75 km. Out of those 47 stations, the Red Line handles 29 stations through a track length of 52.1 km, while the Green Line handles 18 stations through a track length of 23 km. Shahbandari (2017) has revealed that in order to create a supportive infrastructure for the upcoming Expo 2020, the Red Line has been currently extended to incorporate eight more stations through a track length of 15 km connecting the Expo 2020 site. This work is estimated to be completed and become operational on time, before the inception of Expo 2020. The local tram system extends its support to the metro system that moves from Jumeirah Beach Residence, Jumeirah Lake Towers and Dubai Marina to Al Sufouh Tram Station (Dubai Online, n.d.). RTA provides feeder bus services for passengers who are unable to complete their travel through the metro system. In addition to providing comprehensive services, it also provides concessions to passengers who take an RTA bus immediately after their travel through the Dubai Metro. A perfect public transport not only develops the city but also helps reduce pollution and traffic congestion. Figure 1 portrays the number of passengers attained by Dubai Metro from the inception of its metro service from 2009-2019. It can be noted that the number of passengers has been increasing gradually over the years, which can be attributed to the increase in population and business in Dubai.
Operational Challenges and Research Gap
The challenges to the operations which were encountered on a daily basis are listed below:
During the peak hours, the lift gets crowded with huge amount of passengers which makes it difficult for the disabled, expecting mothers and ladies carrying infants to travel hassle free.
Women and parents with baby strollers faced enormous challenges due to the crowd, where they were pushed, shoved and crushed at peak hours.
Maintenance caused enormous time lags because of the involvement of the complicated and enormous connections of pipelines and cables.
There were difficulties in attaining energy and environmental sustainability in mass public transportation services.
The availability of the card recharging systems and their location were not clearly specified.
Adoption of sustainable operations along with an effective crowd management system has been the need of the hour for metro transportation systems across the world. Therefore, the case study research focuses on the theoretical framework developed based on the SCOR model embedded with ARENA simulation henceforth.
Research Methodology: SCOR Model Plus ARENA Simulation
The supply chain and the operational process of an organization can be difficult to segment into groups for the enhancement of each division in the supply chain. In order to solve this issue, the SCOR model can be used to group them perfectly in order to get a deeper understanding about the process. This model can be utilized to portray the exercises and tasks of a business to satisfy the clients’ demand (Apics, 2017; Moreno, Lara, & Rojas, 2016), including customer interactions, physical transactions and market interactions (Kottala & Herbert, 2019). The SCOR model, developed in 1996 by the Council of Supply Chain Management Professionals (CSCMP), is a process reference model intended to be an industrial standard which enables supply chain management of the next generation, with the aim to understand, describe and evaluate supply chains (Wang, Chan, & Pauleen, 2010). It provides a common framework methodology using standardized terminology, indicators and best practices, and follows a hierarchical structure (Bolstorff & Rosenbaum, 2012; Huan, Sheoran, & Wang, 2004; Palma-Mendoza, 2014). The SCOR model investigates five classifications of business processes, including plan, source, make, deliver and return (Kamarudeen et al., 2018).
The three levels of the SCOR model—supply chain structure, pillars configuration and process configuration—can be used to identify and map the supply chain processes present. The mapping process begins at Level 1 with establishing the chain structure, followed by defining the configuration and interaction pillars. When the process categories have been defined, it is important to choose which configuration better describes the supply chain processes and their activities with regard to the interactions between the actors of the chain and the functions of each pillar.
The major goal of the overall section is to deliver the transportation services to the people who are in and around the city. In order to develop a detailed understanding of the factors involved in achieving this goal, SCOR model Level 2 was constructed for the section of transportation service delivery.
SCOR Level 2 Model of Transportation Service Delivery
In Figure 2, the factors that are essential for the achievement of the goal—to deliver the transportation service—have been formulated. In order to deliver the transportation service, the service provider has to develop a layout that is necessary to coordinate and monitor the activities that are vital for the achievement of the objective. Therefore, Figure 2 illustrates the activities that have to be incorporated into the system. In the model, it can be observed that the initial step undertaken is the sourcing of all the metro related equipments such as train parts, Nol Travel Cards (i.e., the radio-frequency identification [RFID] card for passengers to use the metro) and the model ends with performing mobility services for the customers and receiving feedback from them. Receiving inventory, planning service routes and performing necessary checks are also crucial for the successful delivery of mobility services. In order to develop an operational design of the transportation service delivery, the components that belong to this section have been incorporated into the ARENA Simulation program for a detailed view.


ARENA Simulation
Simulation is used to refer to an imitation of procedure and process of any working system that can be used to validate the efficiency and the outcome of the process using a desirable software that is pertinent to the working system (Kelton, Sadowski, & Swets, 2009). In this case study, the model simulation of operations of the Dubai Metro was done on ARENA Simulation software. Arena simulation is a discrete event simulation tool that enables decision-makers and managers to implement changes in a particular business process without affecting other interrelated processes (Waters, 2003). ARENA is a simulation software based on the SIMAN language originating from the two words ‘SIMulation and Analysis’. This language provides the ability to graphically describe the model using a scheme, which allows avoiding writing and programming thousands of lines of code (Yassine, Khalid, & Said, 2019). ARENA Simulation package by Rockwell Inc. enables its users to develop a model and simulate it for various modular designs (Sharma, Jayant, & Tyagi, 2019). Discrete event simulation helps understanding the process with unique, specific events in time. These are mostly activity-based modelling methods that are capable of accommodating flexibility in processes and simulating almost any process in the industry. They provide a range of implications of the decisional changes before their practical application in the unit, thus reducing the uncertainties that would affect, as a consequence, the operation due to the new changes implemented. This would also help mangers in the industry combine the layout, utilization of resources and space orientation to facilities in the production floor. The software allows users to enter data and design the features of the process intuitively with the following:
Real-time decision making;
Addressing bottlenecks; and
Increased reliability.
Along with the current operations, the future scope of the operations were also optimized and designed. Figure 5 displays the flow of passengers in the current metro system. In the current operations of the Dubai Metro, it can be observed that the passengers entering into the system can take a decision either to go to the Card Entry section and get into the metro platform directly, or spend some time on a few other available options such as card recharging from a card vending machine, money withdrawal through an ATM or other money exchange centres, having a quick snack in a convenience store or enquiring on the travel modes and routes through the customer service information centre booths. The reason for getting into this system is to analyse the time spent by the customers and passengers in the station.
Retrieving vital information such as passenger timing will help us come up with innovations to help the passengers reduce the overall time spent in the system and to develop an efficient crowd management system, maintaining the importance of time as a whole. In this research, the time factor is considered to be constant, irrespective of the age, gender or profession. There are two Station Entry and Station Exit points for passengers on the two opposite directions of a metro station. The calculation of time has been made easier with the in-built probability distribution functions in the ARENA software. In this case, we have adopted the triangular probability distributional function to capture the time sequence of each element in the system (see Figure 3).
The triangular probability function is built based on the below form (Forbes, Evans, Hastings, & Peacock, 2011):
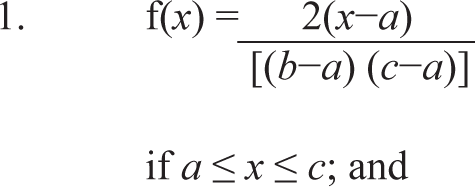
where, a = minimum value (or) minimum time spent by a passenger in the metro system;
b = maximum value (or) maximum time spent by a passenger in the metro system;
c = most likely value (or) likely time spent by a passenger in the metro system;
Mean = (a + b + c)/3; and
Variance = [(a2 + b2 + c2 – (ab) – (ac) – (bc)]/18.
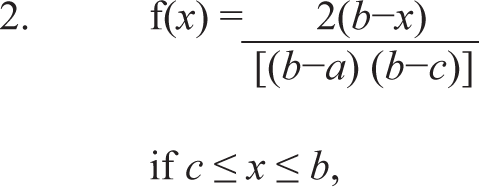
Time at Non-peak Hours
Time at Peak Hours
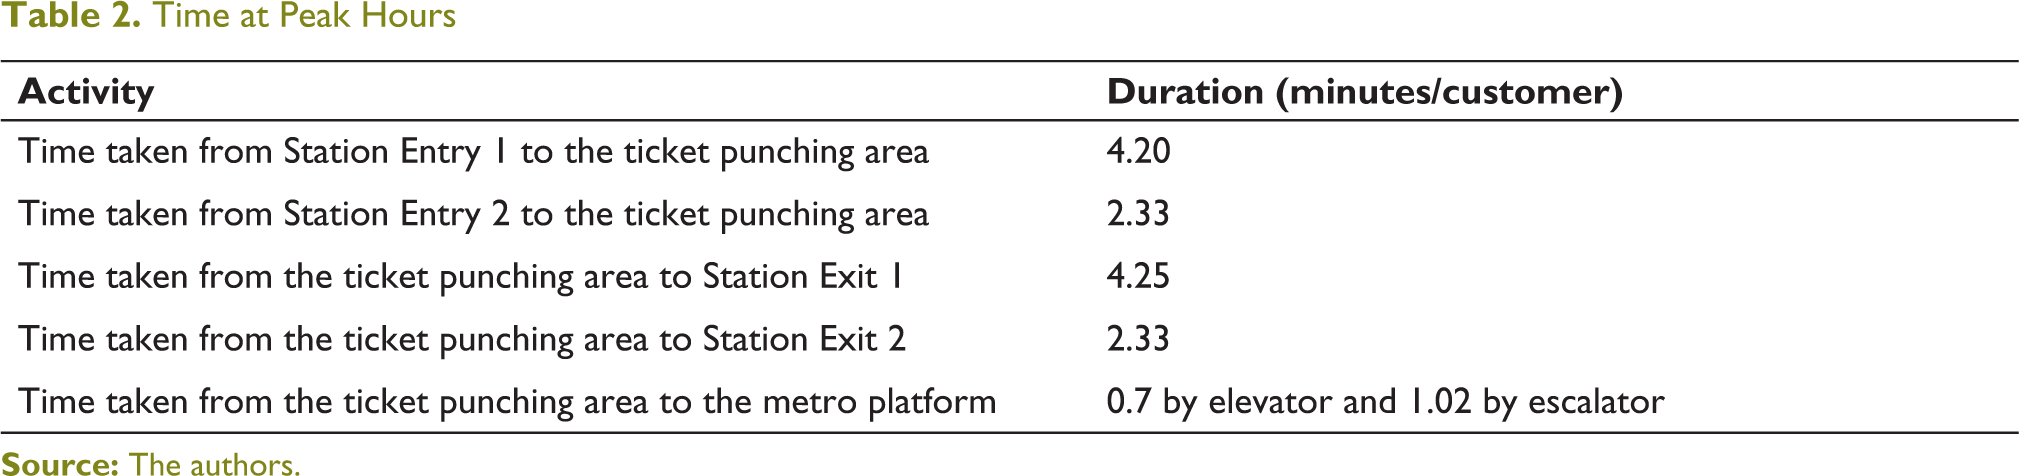
Let us have a look at the time spent in the system calculated for each section:
The times mentioned in the above cases are subject to change based on peak hours.
In order to reduce the overall time spent in the system, a futuristic design has to be constructed by incorporating advanced technologies and space management. Over the years, technologies have been used efficiently in almost every field for the purpose of achieving a significant reduction in time taken to serve the customers. In this research, the same thinking has been assimilated into our system to reduce the time factor involved in the overall system. Figure 2 depicts how the engineer-to-order system can be redesigned in the future in order to reduce the overall average time spent in the system. In order to achieve the objective of reducing the overall time spent in the system, technological implications that aid in reducing the hassle and congestion has to be introduced. Now, let us look at the remodelled design of the Dubai Metro system. Three changes have been incorporated into the system, which include:
Onboard card recharge system;
Automatic checkout using RFID systems (the Internet of things [IOT]); and
Separate lanes and queues for the elderly, disabled and pregnant.
Installing the onboard card recharge system in the metro can help in reducing passengers’ overall time spent in the system. As calculated earlier, a passenger has to spend at least 30 seconds at the ticket vending machine, and this number tends to increase at peak hours depending on the number of passengers in the queue. Therefore, installing the onboard card recharge system can help passengers save time that is been used in the station at ticket vending machines and information booths.
RFID is one key technology that will provide an imperative support for IOT to play an essential role in integrating the different systems together. RFID is an automated sensing technology that incorporates tags to transfer data upon RFID reader queries (De Souza, et al., 2011; Li, 2009). The RFID system has been used in ‘Salik’ toll gates in the UAE, which charges car users without hindering them through toll booths or barriers. The same technology can be used in the metro system whereby passengers will no longer be hindered by card punching systems on their way out of the checkout system. This will contribute in reducing both the time that is spent in the system and also that in the building traffic at the checkout counter. This technology can be installed at checkout counters, whereby people will not be needed to place their cards on the checkout machine. Rather, they could just hold their cards in their hands or keep them in their pockets, and the RFID systems would sense the card’s unique number and automatically detect the balance in the card. The RFID system provides numerous advantages in terms of increased comfort and productivity and reduced administrative and personnel costs like those due to mistakes and errors (Chudy-Laskowska, 2018; Szilagyi & Dupláková, 2016). Apart from the metro, this system can also be introduced in airports, for the passenger check-in and immigration sections, and in bus terminals.
IOT and blockchain have been revolutionizing both the manufacturing and service industries, enabling them to achieve higher responsiveness consequently by maintaining efficiency in their operations. IOT is a network that integrates several applications and systems through a combination of sources like the Internet, RFID, the Global Positioning System (GPS), infrared sensors and other information-sensing systems (Yan, Jin, Liu, & Liu, 2017). It aids in integrating and enabling intelligent identification, monitoring, tracking, location and management, which can be used to a very good effect in the public transportation system. Simultaneously, Kshetri (2018) has said that blockchain can also be used to facilitate the effective measurement of key performance indicators. He has also revealed that blockchain provides ample benefits for the key supply chain activities than what it provides for the financial industry. Therefore, enabling blockchain coupled with IOT in the metro system can be crucial for obtaining and managing accurate real-time data of passenger flow. Moreover, they also provide other abundant benefits such as passenger tracking and estimation, real-time train scheduling based on passenger availability, spare parts tracking for the inventory, accuracy in maintenance timing and train management, crime and accident detection and auto location detection. In this research, we employ the IOT application by deploying RFID in the metro system. The graphic design of the current card punching system and the futuristic model of RFID integration can be observed in Figure 4.

Visualized Integration of RFID Sensors in Metro Stations
During peak hours, it has been observed that the elderly, disabled and pregnant peoples are stuck between the fast-moving young people. Moreover, they also get crushed in fast-moving crowds during the peak hours, which is a normal sight in a highly developed city with an enormous, growing population. Therefore, a distinct path can be introduced to separate the people of the aforementioned category from the fast-moving crowd. The design of all the mentioned recommendations has been integrated into the Dubai Metro system which has been optimized and simulated using ARENA Simulation software, which can be seen in Figure 8. The simulation has been conducted for the current working metro system and has been compared with the optimized system in order to bring forth and justify the improvements in the system.
Current Dubai Metro System
The working model of the current metro system has been designed and simulated in Figure 5. Though each station differs in size, equipment, entrance and exits, a constant model is represented considering the average numbers in each station. The model contains a series of customer decision phases where the customer can decide to avail different services within the metro system. The calculated time for each component in the system (from Tables 2 and 3) was fed into the ARENA software as an input to calculate the overall time spent in the system.

Figure 6 contains the list of resources that have been adopted in the program and their numbers. The numbers of each resources are based on the average calculations considering all the stations of the system. The ticket vending machines (TVM) in the stations are assumed to be four, while the different shops like convenience stores, money exchange centres and canteens altogether in the system are assumed to be four in a single station. The checkout and check-in machines are assumed to be six in total. The metro runs from morning 5 am till midnight at 12, at an average of one metro every 5 minutes (The number varies depending on peak and non-peak hours). It is to be noted that the numbers assumed above are based on the average calculation. Figure 7 shows the replication parameters and base time units for the simulation program. The simulation runs for 19 hours, which is the operational time of the Dubai Metro per day.


Figures 8 and 9 show the simulated time that a passenger spends on the system based on peak and non-peak hours. It can be seen that during the peak hours, a passenger spends 10.07 minutes in the system on an average, compared to 8.35 minutes during the non-peak hours. At the same time, the minimum time spent on the system during the peak hours is 6.29 minutes, compared to 5.49 minutes during the non-peak hours. This difference is due to the formation of crowds during the peak hours, whereby the free movement of passengers gets blocked in many ways during the elevator ride, card check-in and checkout, shopping and card recharging. The goal here is to reduce this overall time spent in the system by the passengers, so that the usage of the metro can also be promoted to the ‘high-income’ people. In order to reduce the time spent on the system, we have incorporated into the system the three recommendations that we had mentioned earlier:
Onboard card recharge system;
Automatic checkout using RFID systems (IOT); and
Separate lanes and queues for the elderly, disabled and pregnant.
These three changes where affixed to the current model for the purpose of improving the performance of the system. Let us have a look at the effect of these changes in the upcoming section.


Optimized Model
In the optimized model, we have integrated the changes as mentioned above into the system and created a new simulation program to test the model. The onboard card recharging system was installed, hence saving time spent standing in the queue in the metro station. The inclusion of RFID antennae in the place of card checkout systems has prevented crowd build-up in the metro system as well as in the queues. However, the check-in system is used as before to detect the balance of the travel card, and also to make sure that no one gets a free ride without the permission of the authorities. A separate lane for the old, disabled, pregnant and children means the fast movers will not be interrupted in their movement out of the system. A new design was established, maintaining the same resources and the replication parameters. The changes incorporated into the system are:
Onboard card recharge system;
Automatic checkout using RFID systems (IOT); and
Separate lanes and queues for the elderly, disabled and pregnant.
The optimized system integrated with the recommended changes can be seen in Figure 10. The program with the optimized design was simulated and the results were recorded for research and comparison.
The simulated program has given the time spent by a passenger on the newly designed system, which can be seen in Figure 11. The average time spent on the system by a passenger was simulated to be 7.75 minutes, while the minimum time spent on the system by a passenger was 4.98 minutes. The minimum time from the table indicates that a passenger has to spend a minimum of 4.98 minutes even if he/she chooses to withdraw from all the other miscellaneous activities in the metro apart from the direct travel to his/her destination. The main factor to consider in this program is the effect of time at the peak hours. It can be noted that since the build-up of queues is eliminated in most of the places, the time would be almost the same during the peak hours of the system.
Results and Discussions
The comparison of both the programs indicates that the newly visualized model can save time spent in the system by the passengers. The values displayed by the simulation program specify that a good amount of time can be reduced in the system by incorporating the recommended changes in the system, which are:
Onboard card recharge system;
Automatic checkout using RFID systems (IOT); and
Separate lanes and queues for the elderly, disabled and pregnant.
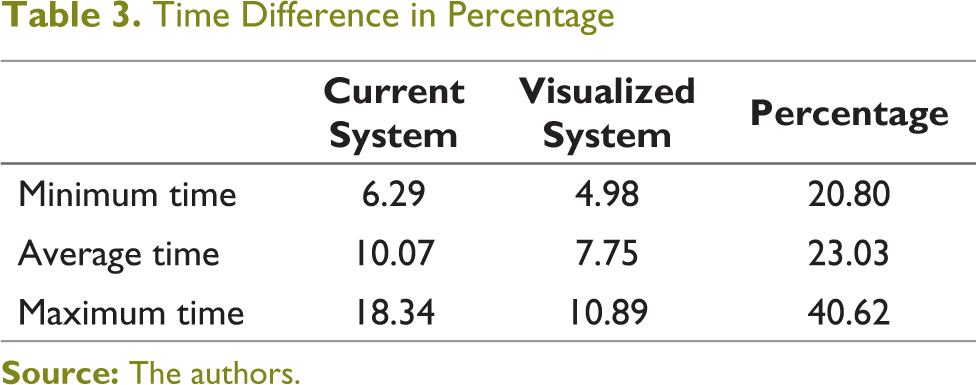
Table 3 shows the comparison of time and the differences in the values in terms of percentage. The values indicate that the assimilation of the recommended changes can reduce the minimum time by 20.08 per cent, the average time by 23.03 per cent and the maximum time by 40.62 per cent. This reduced time can bring many advantages to the overall system as well as to the passengers, such as:
Enabling the metro system to handle more passengers; Efficient management of crowds in emergency situations; Increased peacefulness in travel; Improved service quality, efficiency and security; and Encouragement for high-income people to use the metro.
Hence, it can be concluded that the recommended changes to the metro operational system can have a positive impact on the overall operations of the metro, the citizens and the country. The ‘high-income people’ mentioned in the above paragraph can be described as the people who can afford to travel on their own without dependence on public transportation. Gustavo Petro, a politician from Colombia, once said: ‘A developed country is not a place where the poor have cars, it’s where the rich use public transportation’. Therefore, in order to aim for long-term sustainability, it is important for citizens to use public transportation, irrespective of their income. The modifications recommended in the system have the tendency to attract passengers across different levels, which will enable us to achieve the goal of encouraging people to use public transportation, thereby reducing the carbon footprint and taking a step closer towards achieving sustainability.
Time Difference in Percentage
Major Findings
The application of the SCOR model has enabled a pathway to view the operational and supply chain mapping related to the service operations of the metro. In this research, the focus was to detail the transportation service delivery model of the metro in order to identify the gap that exists within the system. This has led us to optimize several improvements from the results obtained from the ARENA Simulation program. The major goal of establishing an effective crowd management system along with organized smooth flow of passengers to reduce the overall time spent in the system has been achieved. The installation of onboard card recharge system, RFID checkout systems and dedicated lanes has been proven to achieve our goal of establishing an effective crowd management system and reducing the overall time spent on the system by the passengers. The results of the simulation program revealed that 20.80 per cent to 40.62 per cent of time can be saved by the implementation of the proposed changes in the metro system. Apart from providing a solution for crowd management and time reduction, the research further encourages the ‘high-income people’ to use the metro, which will be consequential in achieving sustainability in the transportation sector across the country.
Conclusion
This research focuses on understanding the service operations of the metro in the context of Dubai, in order to promote its usage among all classes of citizens and residents. The availability of a high-quality public transportation service will encourage users to decrease the use of private automobiles in urban cities (Miller, 2016; Yanik, Aktas, & Yusuf Topcu, 2017). Dubai has attained a magnificent urban revolution on the basis of infrastructure and development, which enabled the city to rise high among the others to be considered as one among the highly advanced and quickly evolved in the world (Kamarudeen et al., 2018).
Dubai has evolved into a commendable, powerful city with the help of strong leaders, due to which it is considered to be one of the topmost across the globe. Their eminence and acumen have brought tremendous changes in the city of Dubai. Innovative projects like the metro require the vision of strong leaders to welcome and appreciate the change in the country. In order to achieve this stand, technological innovation has to be enforced, since it has the ability to reduce the cost and resources required for building the systems and, consequently, running operations effectively. With the whole world running towards the goal of sustainability, it will be only fair to initiate this stand from the public transportation systems.
Footnotes
Declaration of Conflicting Interests
The authors declared no potential conflicts of interest with respect to the research, authorship and/or publication of this article.
Funding
The authors received no financial support for the research, authorship and/or publication of this article.