
Abstract
The current work adds to the present research by exploring the asymmetric impact of gold prices, interest rates, oil prices and the currency exchange movements in the Indian equity market. The study considers the monthly price of interest rate, crude oil, USD versus INR, BSE Sensex closing value and the prices of gold. A non-linear method promoted by Shin et al. (2014) is applied to 27 years of data from 1990 to 2018 to examine short-term and long-term asymmetrical relationships. The empirical outcome revealed that the variables analysed have an asymmetrical influence on the equity index. Positive shocks on crude oil prices affect the stock index negatively, while gold price changes tend to generate a favourable effect on the stock indices in a short interval yet suggest the adverse impact in the long-run. A positive short and long-term reaction on the equity indices is seen due to the negative move in currency exchange. The results are essentially significant due to the commodities’ volatility pattern that plays a determining role to value derivatives and hedging instruments. The asymmetric relation of explanatory variables with stock index offers a superior understanding of the risky environment, especially in emerging financial markets.
Introduction
Deep knowledge of dynamics explaining the volatile existence of financial markets is a crucial issue in financial-economic literature when deciding an investment or formulating business policies. Since diverse information at micro–macro level might surround the markets (Bhatia & Gupta, 2020), with a global outreach and integration of financial markets, asset price dynamics earn significant interest (Baruník et al., 2016). The financialization of the commodities provides a parallel market to stock traders that result in the comovement of the prices of both (Jain & Biswal, 2016). Popular among them are crude oil, gold, interest rate, exchange currency rates and equity that generate dynamics and have a prominent role in the economy due to their widespread utilities. These commodities correspond to the most passionately traded assets across the globe and Sensex which represents the most comprehensive outlook of the Indian stock market. All five assets have significant leverage variations making them highly attractive in the financial set-up. Since comparing comovements of macroeconomic variables and stock prices offers valuable insight about the strategic substitution in preference as financial assets (Creti et al., 2013), for instance; gold and equity. Similarly, oil and exchange rates is a prominent barometer for countries in view of the fact that fluctuation in these variables can be a crucial indicator for economies.
Based on the theoretical proposition (discussed in the next section) researchers have used various econometric methods to study the link between these indicators. It is important to look into asymmetries in the stock price adjustment process, as stock prices incorporate overpricing (bad news) faster than under-pricing (good news) (Koutmos, 1998, 1999), and existing economic factors could also lead to nonlinear and asymmetric trends of macroeconomic indicators and other asset classes over time (Bildirici & Türkmen, 2015). Evidence also suggests asymmetric reaction of stock prices to rate cuts and hikes (Lobo, 2000). As such, nonlinear phenomenon affects the market mechanism that otherwise remains hidden in a linear setting (Granger & Yoon, 2002). In this backdrop, we examine whether stock prices, crude, interest rate, exchange rate and gold prices are in any manner connected, and if so what is the nature of the relationship? The study is also encouraged by the ground provided by existing literature showing the response of crude, gold, exchange rate and interest rates separately for equity pricing across the globe. The composite transmission of these variable shocks to the financial market exhibiting asymmetric adjustment patterns would be appealing for the Indian market since these commodities chase equity in a unique way (detailed in the next section).
With the existing asymmetries, the dynamic multiplier computes and adjusts the respective reactions of the stock index to negative and positive deviations in every regressor. The study observes contemporary linkages of the exchange rate, interest rate, gold, oil, crude over the equity index for the Indian economy. Our finding shows that movement in prices of crude affect equity prices negatively. Over short-term gold prices create a favourable impact on the equity index, whereas in the long-run, positive shocks in gold prices impact the Indian markets negatively. Negative shock does not, however, have any major impact on it. In the short and long run, exchange rate negative movements make a positive reaction on the equity index. Stock prices behaviours towards changes in interest rates changes also indicate asymmetric reaction. A synoptic view shows that contractionary policies impede stock movement more than the easy money stimulates it. This heterogeneous asymmetric behaviour of these variables in the stock index equips market players and policymakers to construct their investment and trading strategies better across sectors. These strategies may be used to identify investment and hedging opportunities for optimal portfolio asset allocation decisions. We only came across one very recent study (Kumar et al., 2020) that involve all sampled asset pricing patterns for the Indian market. The study attracts greater importance due to the less application of nonlinear and asymmetric relationships. The study, therefore, uses NARDL model to capture both long and short-run (a)symmetric price responses. This extended version of the standard ARDL approach (Pesaran et al., 2001) or ECM (Engle & Granger, 1987) provides the fine edge by developing a flexible dynamic parametric approach to bring out the clear long and short-run (a)symmetric economic in underlying regressors in a multivariate model.
The rest of the article consists of five parts. The second section includes a study of literature. The third section includes an overview of the data set, the methods and the statistical techniques used to assess asymmetry. The fourth section deals with model-based calculations and their interpretation. The final section concludes with implications of the result for reforms and addressing future scope.
Theoretical Argument
Supporting the theoretical underpinning of the study, we review some essential text. Reliance on oil as an energy source by all international economies, particularly emerging countries are widely recognized with more than half the overall world consumption (Pershin et al., 2016). Another rationale to understand the oil sensitivity could be its industrial and societal consumption, which is more than 92 million barrels per day globally. By 2040, India would import 7.2 million barrels of crude oil a day, to become the second-largest importer worldwide, behind China (IEA, 2015, p. 118). Also, its effect on the company’s future earnings cannot be ignored (Arouri & Nguyen, 2010; Gogineni, 2010; Huang et al., 2015). Oil is one of the most sought after commodity around the world and changes in its prices has an acute and visible effect on world economy and politics, and subsequently expected to affect the fluctuation of the equity market (Arouri & Nguyen, 2010; Chang & Yu, 2013; Ratti & Vespignani, 2015, 2016). Also, oil remains an inseparable part of the global financial system and as such affects decisively its complexity characters (Kwapień & Drożdż, 2012). Investors’ decisions strategically depend on both financial and oil-related information prevailing in the market (Mensi et al., 2017). The involvement of traders may cause a short term disruption in its price (Lombardi & van Robays, 2011). Any increase in international oil prices for an oil-importing country may increase its current account deficit; since the extra amount is transferred to exporting countries (Turhan et al., 2014). Such inequality in the balance of trade leads to exchange rate fluctuations. This integration becomes more sensitive for India as it is a major oil-importing player in the world (replaced Japan in 2015 as a third largest importer after the US and China)
Our next leading candidate: ‘gold’ attracts investors for its simple market, its strategic use and a sense of certainty during financial distress (Baur & McDermott, 2010). Serving as the best-preserving currency value product for a long duration (Baur & Lucey, 2010; Baur & McDermott, 2010), high liquidity (Bampinas & Panagiotidis, 2015), store of wealth, derivative valuation (Gaur & Bansal, 2010; Yahyazadehfar & Babaie, 2012), hedge for diversification at distress (Aggarwal & Lucey, 2007; Arouri et al., 2015) are few other features. Even though gold creates a hedge for diversification (Conover et al., 2009); volatile gold prices may lead to negative equity return (Riley, 2010). A switch over between oil and gold, or putting them together in a single portfolio is also preferred by the investors (Soytas et al., 2009). Indeed, less volatility in the market denotes a stable investment environment (Baur, 2012), yet an understanding of gold price volatility is imperative to value derivative instruments, preparing hedging strategies, trading in financial markets, and integrating towards the world economy (Ewing & Malik, 2013). To understand more about gold prices behaviour readers are advised to refer Lucey et al. (2013).
With the substantial advancement in the financial market across the world, the expansion in money demand and asset markets along with the resilience in currency market practices have also increased. Therefore, restoration or amendments in foreign exchange policies have raised ambiguity and uncertainty between equity markets and currency volatility. Since oil is traded in dollars, an essential relationship exists between oil and US Dollar. Fluctuations in currency rate not only affect stock prices, but it also influences domestic firms indirectly (Aggarwal, 1981; Beckmann et al., 2015; Turhan et al., 2014). For instance, devaluation may lead to a negative/positive reaction on import/export units and consequently a rise/fall in stock prices and the other way round (Joseph, 2002). Hence, equity prices always share a complex, but a crucial relationship with the real exchange rate. Also, oil and gold in India trail a certain trend that eventually affects currency value. Thus, investigating interdependencies between these assets for an oil demanding country like India might be supportive to market players and policymakers. On this subject, we, therefore, attempt to capture the asymmetric associations of Indian capital indices with these variables.
Literature Review
Several empirical pieces of research have been devoted in support of the fact that variables undertaken in this study have an equilibrium relationship with the equity market in different regions of the world. Substantial work to indicate the relationship individually with stock prices is also present. Researchers are more interested in highlighting the implication of nonlinear modelling results in the context of developed economies while emerging markets like India were paid less attention. To check time-varying long-run equilibrium among USD, gold and oil market (Mo et al., 2018) employed DCC-MGARCH and had shown a long-term inter-correlation among these variables. They highlighted a negative association of international oil prices with USD. Mollick and Sakaki (2019) used mean-variance approaches and transmission of shocks to examine the reaction of 14 currencies with crude prices and stock returns. The study found an appreciation in currency values with positive oil price innovations but a depreciation following positive equity innovations. Studies on gold to measure volatility transmission, a tool for diversification, hedging are widely published.
Gold as an investment instrument was found to be a desired asset to protect portfolios during distressed market conditions (Narayan & Sharma, 2011). Arouri et al. (2015) also found gold as a safe investment avenue than oil during recessionary periods in the markets. They examine both the uncertainty and return spillover between global gold markets and the stock market in China over the period from 2004 to 2011 using the VAR GARCH method by Ling and McAleer (2003). Using cross-correlation function (CCF) approach, Miyazaki and Hamori (2013) found unidirectional causality from stock to gold from 2000 to 2011. Bouri et al. (2017) also employed the same methodology and found a nonlinear causal relationship between international gold prices and oil volatility in Indian equity market. Likewise, Nguyen et al. (2015) applied asymmetric causality tests to look into two-way causality between the US equity market and a wide range of commodity futures. The authors evidenced higher gold return that becomes a cause of lower equity return in the US market. Bekiros et al. (2017) used a multi-scale wavelet approach and a GARCH-based copula methodology to investigate BRICS financial market in the response to international gold price changes. The finding documented a bidirectional causal effect between equity indexes and gold prices at different frequency bands. Choudhry et al. (2015) studied the multivariate nonlinear comovement between gold and equity return for Britain, the US and Japan during the sub-prime crisis by including changes in the three-month LIBOR rates. The result with the help of GARCH and nonlinear granger causality techniques shows significant nonlinear causality during the crisis period, whereas little significance is observed for the pre-crisis period.
Nonetheless, only a few studies such as Bildirici and Türkmen (2015) did not find any nonlinear co-integrating and causal relation between oil and metal prices like gold, silver and copper. The study applied NARDL and nonlinear causality tests from 1973 to 2012 on monthly basis database yet captured only a partial nonlinearity of oil-gold prices.
The subtleness of diverse industry groups to change with oil price volatility substantially from one sector to another in European economies is indicated by Arouri and Nguyen (2010). The methodology includes ARCH and causality approach on weekly and monthly data. A linear and nonlinear cointegration approach is employed from 1998–2008 by Arouri et al. (2011). The authors observed strong asymmetrical relation between equity returns and oil price changes. Similar results were reported by Gogineni (2010) who used quantile regression technique pioneered by Koenker and Basset (1978) for the oil-dependent industries that have a positive statistical significance with oil price fluctuation. While oil price movement affects negatively in different industries. The oil volatility by Gao et al. (2014) for the US economy, particularly the positive shocks from oil prices revealed high significance in the energy-incentive consumer price index. The author proposed econometrics and complex network theory combination. To form a transmission process, the study defined fluctuant pattern which comprises regression equation of a fragment to transfer fluctuant pattern into each other. The most relevant patterns, medium of transmission and distance to transmission are later detected. Such nonlinear relations also influence the capital markets (An et al., 2014; Huang et al., 2015; Ma et al., 2013; Manimaran et al., 2009; Vacha & Baruník, 2012). These authors have also reported asymmetric interrelationship between commodities and equity returns. They observed varied interests of market players to be its main cause. Naifar and Dohaiman (2013) too revealed that the linear approach does not distinguish the present asymmetries between oil and gold prices. They employed two Markov regime-switching models (crisis regime and non-crisis regime) and several Archimedean copula models to develop regime probabilities for oil market variables. Hamma et al. (2014) considered GARCH–BEKK model and found significant stock impulsiveness in Tunisian stock market, although the magnitude of fluctuation is observed to be different in different sectors. Bouri et al. (2016) reported a change in financial and service sector return due to a change in Brent oil return for Jordan. Though, the return for sector indexes of Jordan is not affected by fluctuation in oil prices. The study was based on cross-correlation functions calculated from GARCH methods standardized residuals. Bouri et al. (2017) applied cross-correlation function (CCF) approach to document the effect of adjustments to Chinese oil prices. The researchers presented that after the reform of March 2013, causality between oil return across the world and stock return of China strengthened, while causality of these uncertainties is lost afterward.
Based on daily database, Wen et al. (2018) employed univariate GARCH model with interaction terms on the daily database from March 2011 to March 2015. They documented that the Chinese oil price reform in 2013 substantially reduced stock investment and financing risk. Ji et al. (2018) examined effect of political, economic and financial affairs on information adjustments among implied volatility indexes with the help of graph theory that integrates a conditional correlation model. The authors found an inconsistent variation of integration network spillover structure over time for BRICS countries’ stock markets in relation to crude and gold. Wang et al. (2020) breaks the data into three (extreme positive, extreme negative and normal shocks) cumulative components and employed extreme Granger causality analysis model. The study shows the effect of extreme oil returns that causes significant causality and extreme shifts in stock returns of BRICS. Wen et al. (2019) uses dependence-switching copulas and time-varying single copulas and regression analysis to identify the global reliance on oil stock markets in a wide number of developing countries and demand dependency trends determinants. The study found a nonlinear causal relationship between oil and equity prices. For a healthy US economy study evidenced limited oil-stock reliance.
The equity and exchange rate symmetric cointegration model has also been established earlier. Plenty of literature has been in existence for many years from examining causality to identify short and long-term co-integration between two variables, which was contributed by many researchers. These studies conventionally assumed symmetric adjustment between currency exchange and equity prices. Some authors (Ibrahim & Aziz, 2003; Kim, 2003) believed a long-term equilibrium, whereas few others (Bahmani-Oskooee & Sohrabian, 1992; Nieh & Lee, 2001; Smyth & Nandha, 2003) documented short-run equilibrium. A couple of studies (Ozair, 2006; Solnik, 1987) did not find any related evidence. From an Indian perspective, Jain and Biswal (2016) examined global crude prices, a currency exchange rate (USD–INR), gold and Indian capital market (SENSEX) with DCC-GARCH models. In this approach standard, exponential and threshold forms and lead lag linkages with symmetric and asymmetric causality tests were used. The investigation concluded that a drop in gold and oil prices results Indian currency and Indian capital market to collapse. Tian and Ma (2010) investigated the cointegration between equity return and macroeconomic variables on monthly basis including currency exchange rate in the Chinese economy (Shanghai stock price index) from 1995 to 2009. The research employed ARDL and error correction models (ECM) to determine the causal relationship between the study variables. The author discovered the lack of co-integration relation between major world exchange rates and Chinese economy before 2005 (the year of financial liberalization), but a presence of co-integration after 2005, that is, after liberalization. Wickremasinghe (2012) examined cointegration with Johansen’s test and checked in and out sample causality test with variance decomposition analysis. The research observed that the inconsistency of share prices is due to fluctuations in Indian currency. Yang et al. (2014) used Granger causality test in quantiles on a daily dataset of nine countries for 13 years (1997–2010) to establish causality and reported relations between currency exchange and equity returns. Amid liberalization and economic distress, Lin (2012) explored equity return and currency exchange relationship with the help of autoregressive distributed lag (ARDL) model on the dataset of 25 years of seven Asian economies. He concluded that during the time of financial distress the association is stronger. While analysing the symmetrical versus asymmetrical co-integration impact applying ARDL (linear and nonlinear) of the monthly data of 24 countries between currency exchange and financial return, Bahmani-Oskooee and Saha (2015) again observed that the non-linear co-integration approach is more fruitful than a linear approach. Delgado et al. (2018) observed the Mexican equity index to examine its interplay with oil and exchange rate with the help of VAR model on monthly data from 1992 to 2017. They reported a negative response of equity index with the exchange rate and a significant relationship of oil price against exchange rate. Ismail and Isa (2009) employed two regime Markov-Switching VAR approach, seeking state dependence of exchange rate and stock return. After studying the Malaysian monthly dataset for 15 years they concluded that non-linear forms are better suited than linear ones. Cuestas and Tang (2017) applied a nonlinear ARDL approach for Chinese industries to show the exposure of exchange rate on its capital market. Their study results also validate the benefit of non-linear modelling over linear modelling and Chinese market returns have an asymmetric relationship with the currency exchange rate.
From the above discussion, the effect of sampled commodities assets on the indigenous macroeconomic environment cannot be denied. Lack of studies in examining the collective effect of these variables to explore nonlinear behaviour in Indian financial market portrays an unclear picture. The difference of magnitude in findings may also be attributed to the data availability and approaches used. To completely address the relationship between these variables, we propose the explanation through nonlinear ARDL econometric methods and use empirical models to support the result. The current study is motivated by a discrepancy in analysis into the asymmetrical effect on Indian financial market from currency exchange, gold and crude oil. Research forms are available on one or the other single pair of variables which are more focused on linear models (Ahuja & Pandit, 2020). Using linear models to explain such a relationship might be obsolete and unsuited to Indian equity markets due to their change in behavioural tendency in equity prices from commodity prices. To get a comprehensive and better understanding there is further scope for exploring new dimensions by applying new modelling techniques that can improve research accuracy and explanation.
Methodological Framework
As mentioned in earlier sections, the previous literature is mostly dominated by standard linear models. An ample study to model Indian security prices in a linear setting has been carried out; however, the sampled variables of the current study that highlight asymmetric properties vary with economic actions inferring a nonlinear pattern that could be followed in its behaviour. Therefore, employing nonlinear settings would be a better approach to address asymmetrical behaviour, instead of using a symmetrical approach that could result in misleading evidence on such associations. For this reason, this study adopts (Shin et al., 2014) nonlinear modelling technique enabling asymmetric detection between equity values and sampled variables positive and negative short to long term partial sum decomposition to understand the nonlinearity effect.
To begin with, the study primarily explores the attributes of data with graphical representation and descriptive statistics. To determine the integration order Augmented Dickey–Fuller and Phillip–Perron test has been applied to determine the integration order. Then for the empirical implication, we estimate the error correction model for the NARDL approach with a standard OLS method using appropriate lag numbers to seize the intrinsic performance of nonlinearity. Subsequently, we validate the presence of a co-integration by performing Wald test to observe the joint multiple hypotheses on multiple parameters of the lagged independent variables based on F-statistics. The third step of the process involves the testing of asymmetries to draw inferences once the co-integration between study factors is established. Finally, the process concludes with exploring the combined asymmetric dynamic multiplier effects in positive and negative values of interest rates, crude prices, gold prices and currency exchange on financial returns.
Nonlinear Autoregressive Econometric Modelling
The stock price pattern in relation to oil, gold, currency exchange and interest rates is broadly examined with the help of the nonlinear autoregressive distributed lag (NARDL) model. Before this, various linear techniques like VAR, SVAR model (Hammoudeh et al., 2015; Wang et al., 2013) for oil and stock return, GARCH, Granger causality, VECM, and so on, was applied to examine the response of one or two asset prices over equity. However, in the traditional models, asymmetries and nonlinearity is constrained in the estimation of the price transmission mechanism. NARDL capacity to detect asymmetric adjustment patterns in small samples is superior to other conventional methods. Since, it contains a dynamic error correction mechanism that facilitates the measurement of nonlinearity and asymmetry in a single equation (Romilly et al., 2001). This method facilitates to explore non-linear and asymmetrical relations by disintegrating the regressors into partial sum process for both decreases and increases. Moreover, it also provides flexibility as far as the integration order (whether it is I(0) or I(1) but not I(2)) of involved variables are concerned (Nusair, 2016). The readers are advised to follow Shin et al. (2014) for more details.
Econometric Setup
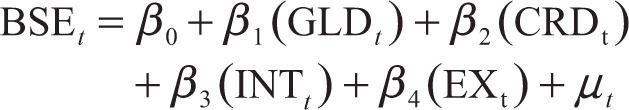
The following linear equation has initially been proposed to highlight the long-run cointegrating between interest rates, currency exchange, crude, gold and equity price.
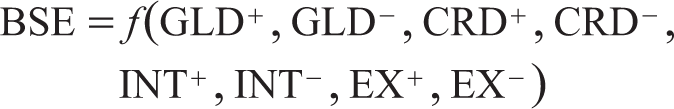
The following model with the nonlinear functional properties has been derived for further analysis, that is, the asymmetrical relation between gold, interest rates, crude oil, exchange rate and equity index.
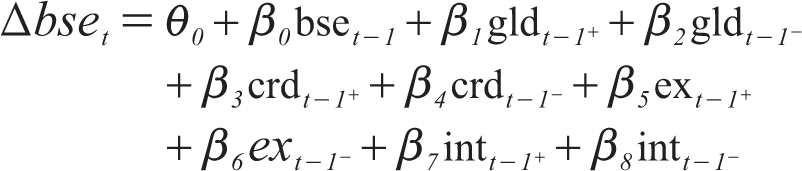
The model formed in this study is based on the earlier work of Dhaoui and Bacha (2017), Ibrahim (2015), Katrakilidis and Trachanas (2012), Koutroulis et al. (2016), Raza et al. (2016). The model of the specific asymmetric long-run equation is expressed below.
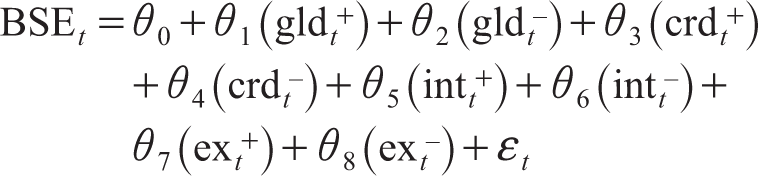
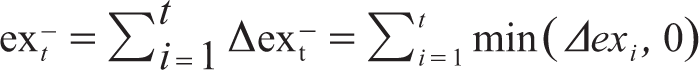
Where θi is the long-run parameter (co-integrating vector that is to be estimated) gld t +, gld t –, crd t +, crd t –, int+, int–, ex t +, ex t – represent the partial sums process of an increasing and decreasing variations in crude, interest rates, gold and currency exchange in Indian capital market.


Following equation (1), formulation of the nonlinear ARDL model (NARDL) is as follows.
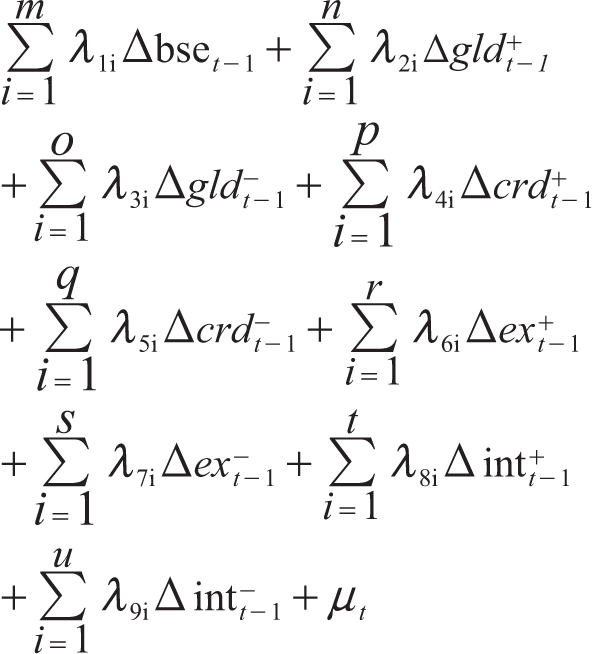
In the above equation, that is, equation (12) lag order is indicated as m, n, o, p, q, r, and s, t, u. The long run coefficients
To see the asymmetric cumulative dynamic multiplier effects of 1% change in gld t +, gld t –, crd t +, crd t –, ex t +, ex t –, int t + and int t – the following equation are developed respectively.
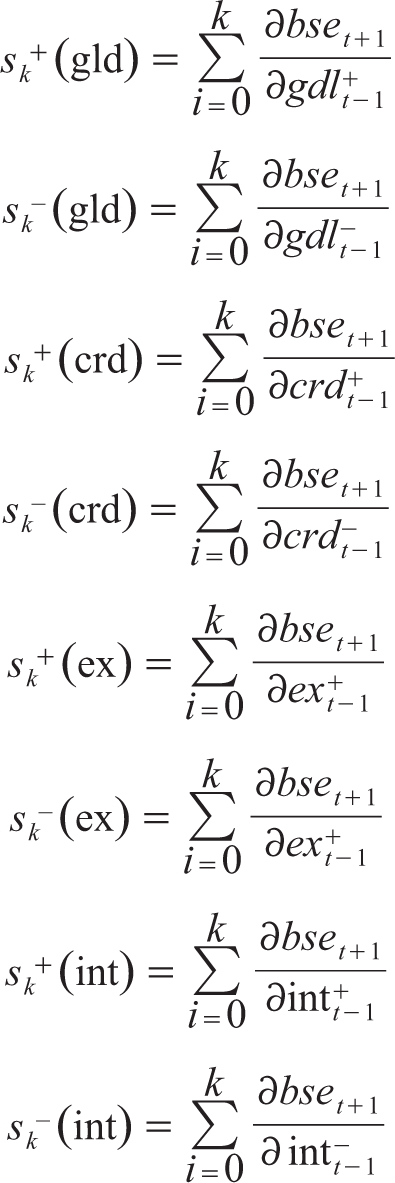
Where k = 0,1,2,3, …∞,
sk+(gld) = θ1, sk–(gld) = θ2, sk+(crd) = θ3, sk– (crd) = θ4, Sk+ (ex) = θ5, Sk– (ex) = θ6, Sk+ (int) = θ7, Sk–(int) = θ8
Data Specifications and Preliminary Analysis
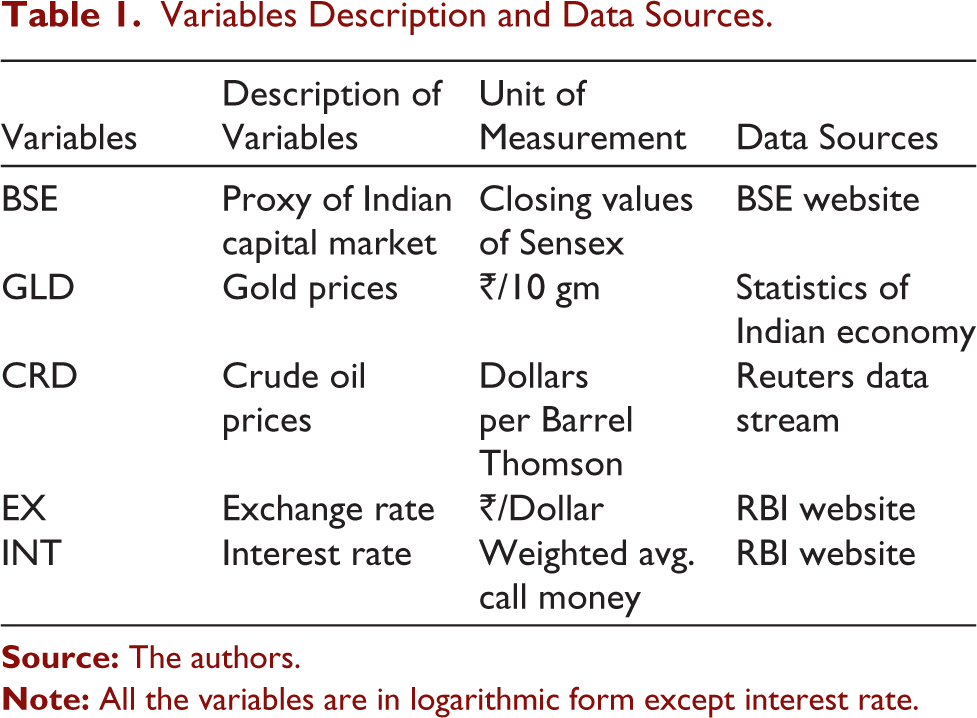
The study is carried out from April 1990 to March 2018 to present empirical evidence with the help of a monthly dataset. The Bombay Sensitive 30 Index monthly ending values have been taken to represent the capital market of India. It was also considered an indicator of Indian capital market volatility. With the purpose of evaluating the association of oil, interest rates, gold prices and exchange rate with Indian equity indices, values are extracted from the BSE website, monthly crude prices Brent Crude future. Value for currency exchange is obtained from Indian economy statistics manual and RBI newsletter. Interest rates are represented by weighted average call money rate. Due to the dominance of the US dollar for trading oil in world markets, it is considered a currency exchange. Gold prices are obtained from the Mumbai market (₹ per 10 gm). All variables have been converted to their logarithmic form (Table 1) except interest rates.
Variables Description and Data Sources
Given the quantum of data to work on the objectives of this research, we primarily explore data attributes with a graphic display, descriptive statistics and test for stationarity. This step will help in deciding to choose from a range of econometric methods to meet the study’s objectives. With the possibility of asymmetry in time series data, the current study is performed in a nonlinear framework since the linear structure does not bring out the hidden co-integration (Granger & Yoon, 2002), asymmetries and structural break.
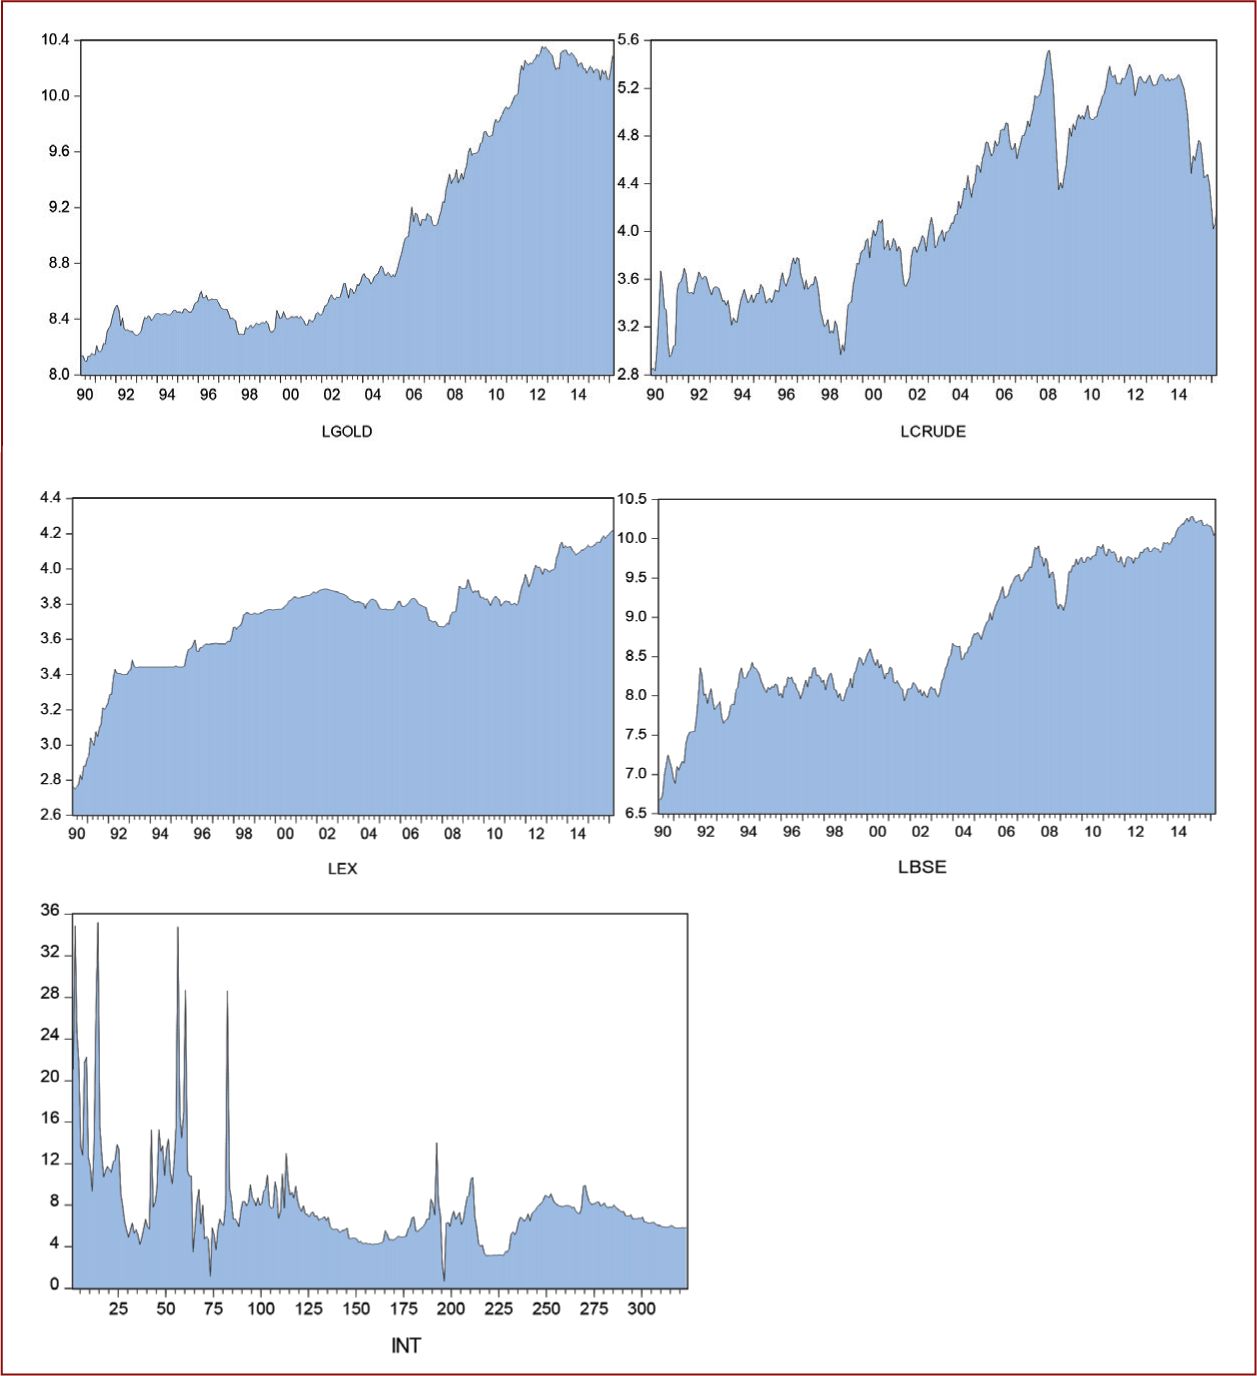
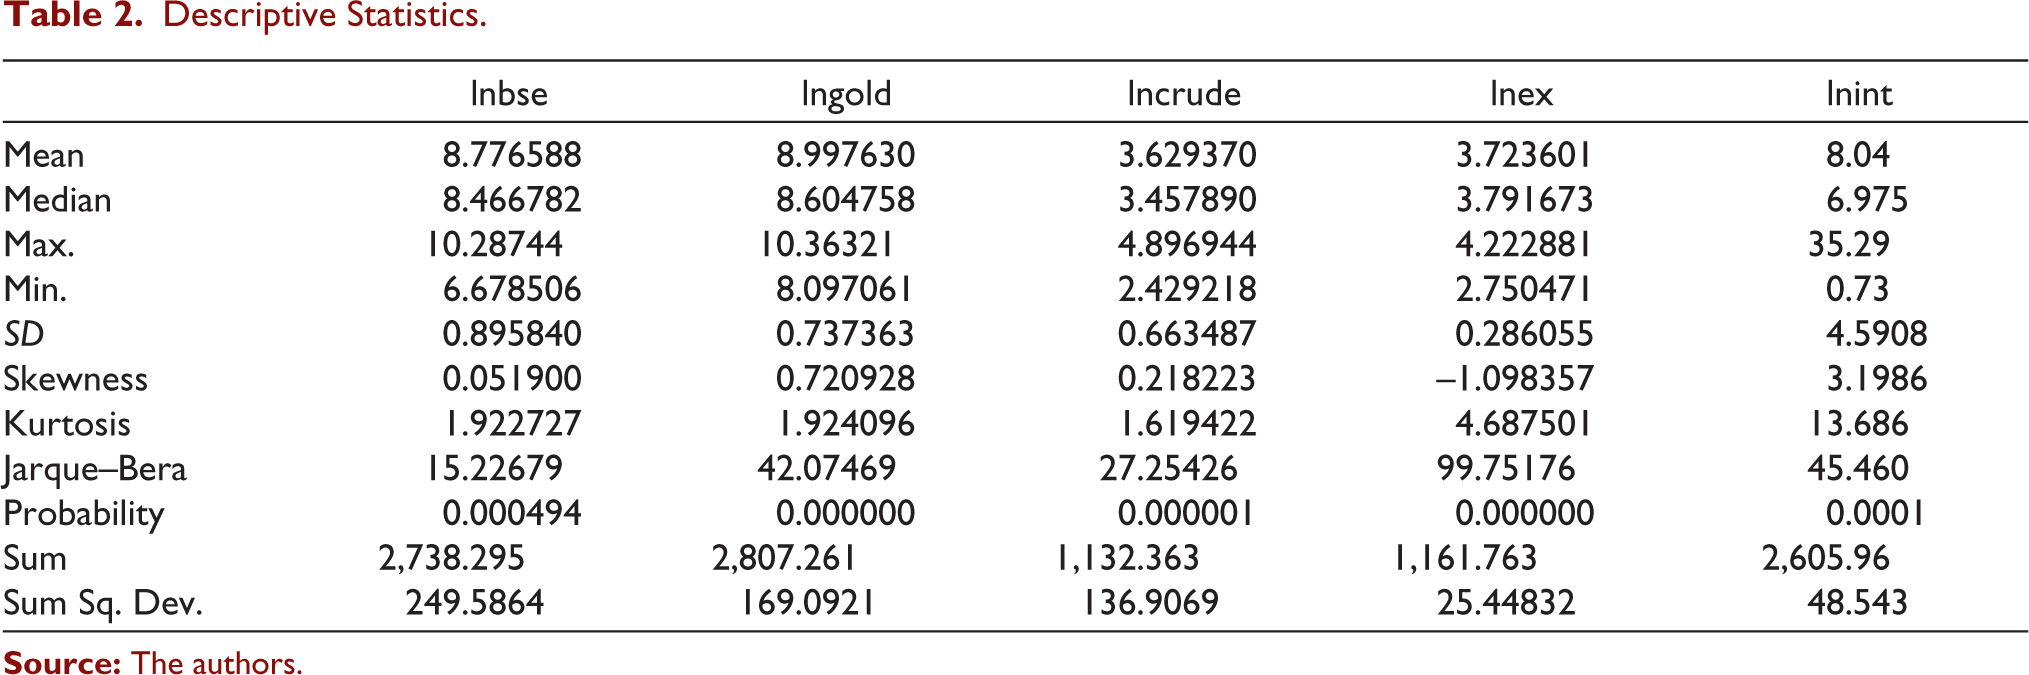
This segment offers the preliminary observations instituted for the current study. The time-series data shows gold prices in Figure 1 are heading upwards, that is the gold prices have been increasing for the study period. The constant change of mean in gold prices possibly suggests the non-stationarity of the series. The same holds for Sensex also. The upward trend and changing mean of the variables of the time series indicate non-stationarity features. Crude and interest rate also signifies a similar movement with a repeated up and down drift. The currency exchange, however, appears stationary as the mean value during the analysis is constant. While these observations give a general overview, we headed further with a formal test of stationarity for concrete results. Standard deviation demonstrates that variation in the unpredictability of exchange rate (ex) is least of all, interest rate volatility being the highest (sixteen times more than the exchange rate). Only exchange rate display negative unconditional skewness. This implies that the probability of investing in exchange rates with negative returns is on the higher side. Again, the exchange rate and interest rates data appears to have leptokurtic distribution. This shows that the investment returns to it have high chances to fall on either side. The Jarque–Bera p-values indicate that the null of the normal distribution of all involved assets series is rejected thus violating the assumption of normality. Table 2 summarizes these findings.
Descriptive Statistics
Estimation and Results
Unit Root Estimation Results
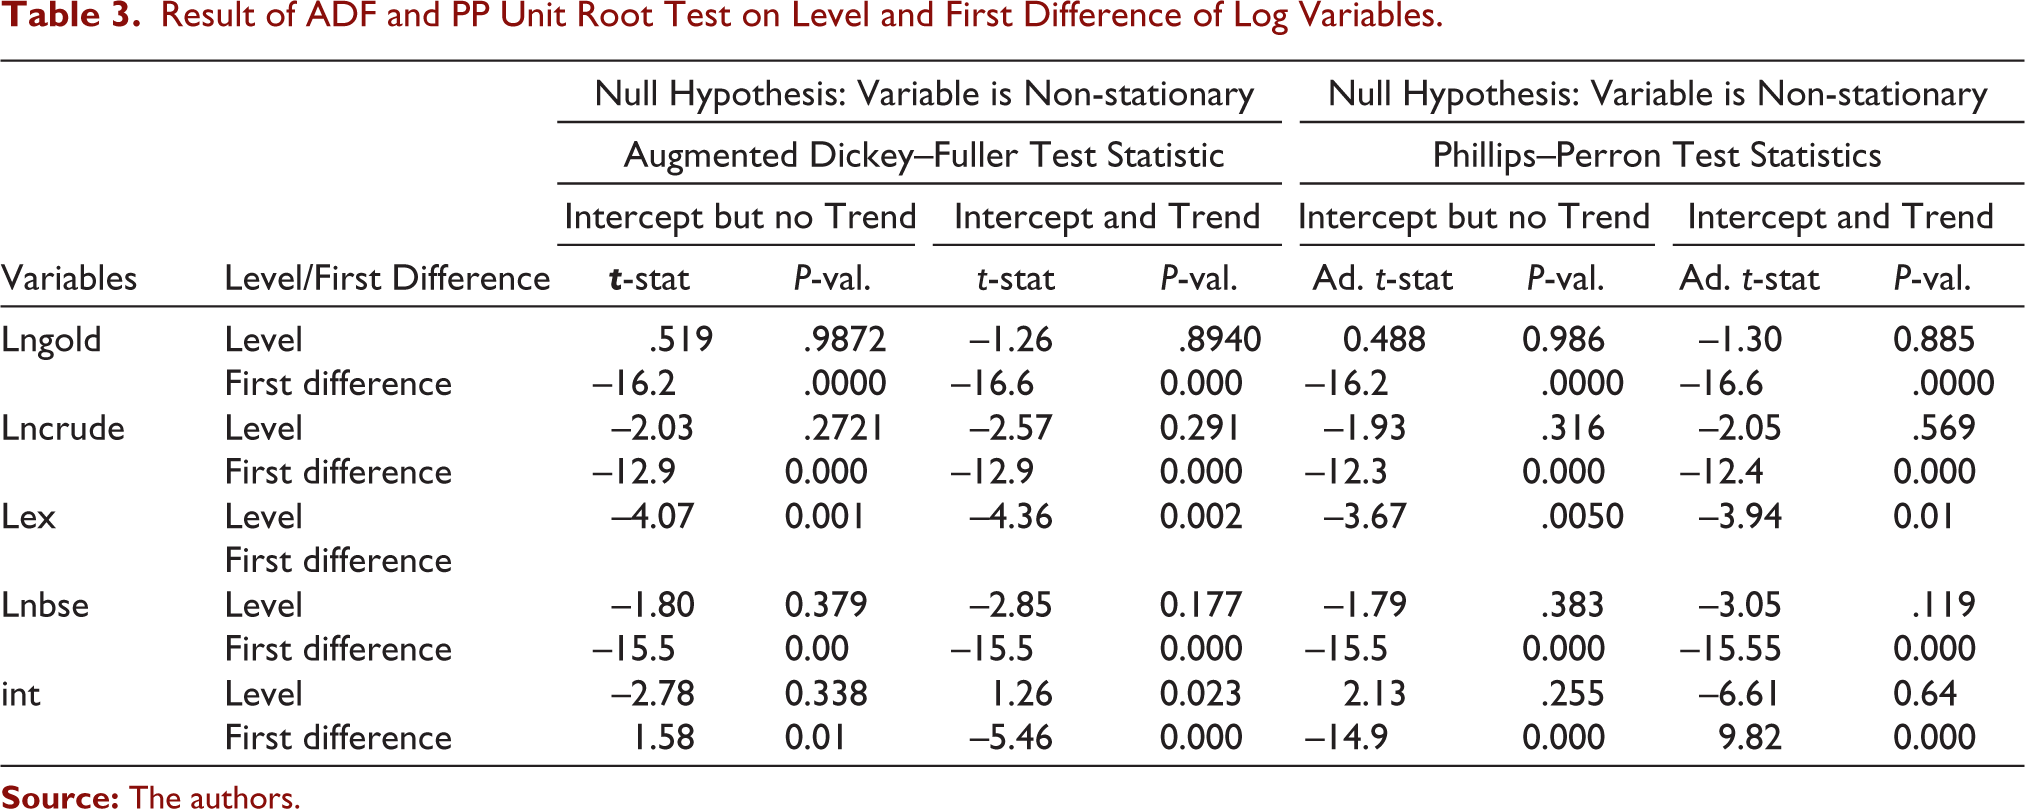
It is necessary to begin with these tests in order to reinforce the outcome of subsequently employed econometric methods. If the unit root is verified, it entails the series transformation by an effective differencing technique to account for valid results. Though, NARDL relieves the basic assumption of choosing the variables of the same integration; order for stationarity either at levels or differenced at level one. Yet the bound testing estimation necessitates that no variable is involved with stationary at a level higher than one, as the precision of F-statistics for measuring the cointegration relationship is impaired. Therefore, we perform our empirical analysis examining the order of integration to satisfy this condition. Finding the integration order implies the levels at which the time series will become stationary, else, the results will show spurious properties. The data set’s stationarity feature is accordingly tested using the Phillips–Perron and Augmented Dickey–Fuller test. These standard techniques are used extensively in economic applications of financial literature to determine the integration order. The null hypothesis of these tests indicates that the data set has a unit root. The outcome shows non-stationarity (at level) of the equity index, interest rate, crude prices and gold prices (Table 3). Subsequently, a stationary form is created by the first difference of all except exchange rate, as it is stationary in its present form. These findings also agree with the preliminary observations in the earlier section.
Result of ADF and PP Unit Root Test on Level and First Difference of Log Variables
NARDL Estimates and Discussion
To ascertain the objectives of the study nonlinear autoregressive distribution lag approach is employed as it gives the most suitable outcome compared to other co-integration approaches (Fousekis et al., 2016). The presence of asymmetric relationships among the variables is established utilizing a bound test on equation (12). Accordingly, the work proceeds with the bounds testing method (in the nonlinear ARDL structure) since the results of unit root tests suggest no variable has more than the first difference form. For examining co-integration appropriate lag order is used to estimate the equation (12). Table 4 reports the bound F-statistics of NARDL approach.
Bound Test for Nonlinear Cointegration
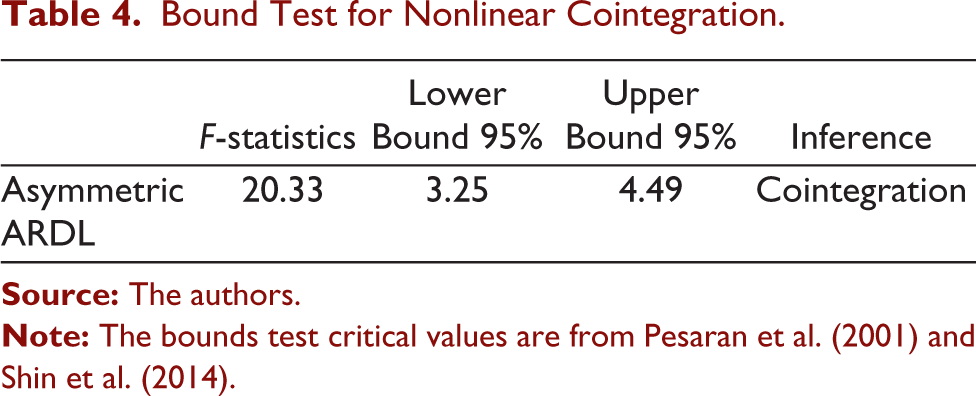
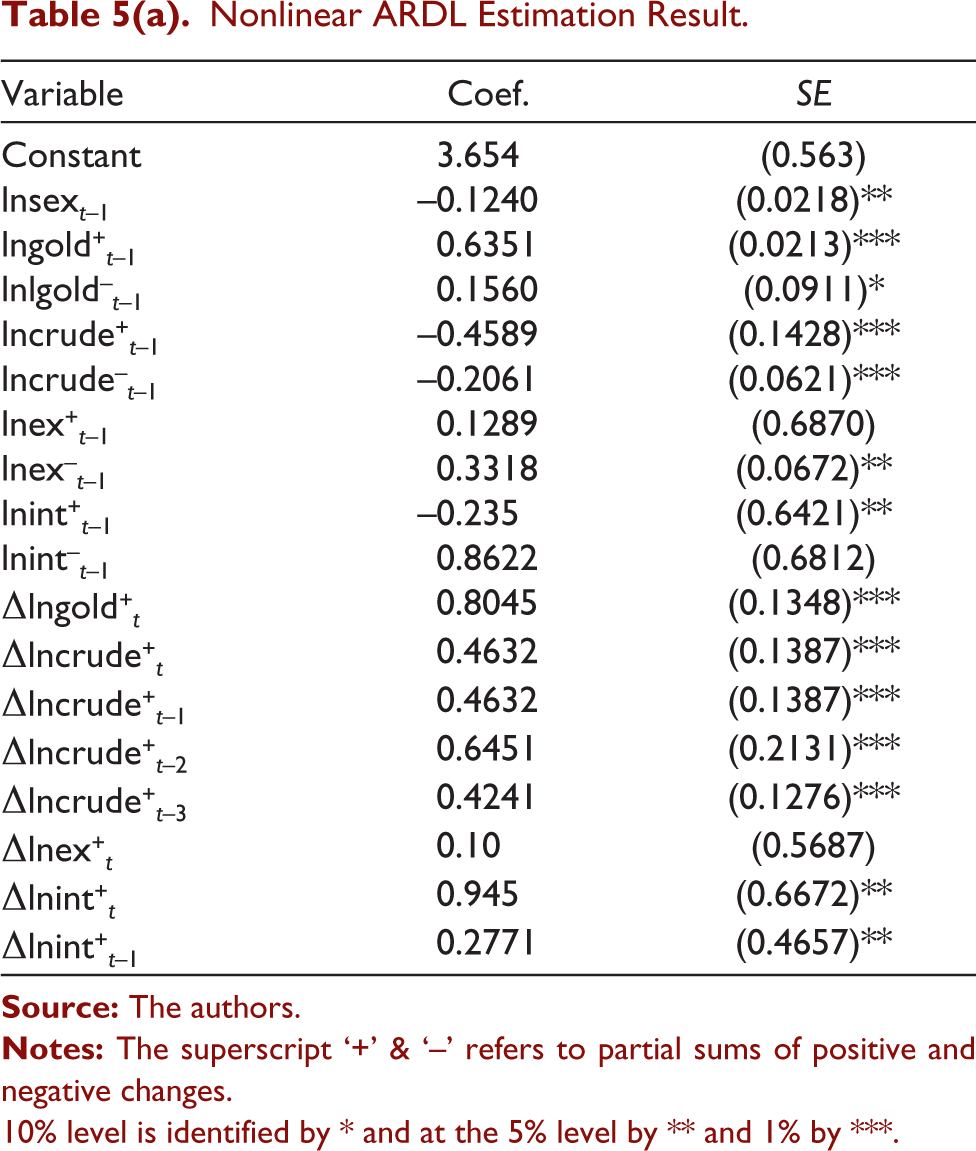
The finding reveals that the price of gold, oil, interest rates, currency exchange and stock index cointegrates in the long run. The F-statistic computed value (Pesaran et al., 2001) exceed the upper bound critical value (95% confidence level), indicating the presence of cointegration of equity index and explanatory variables in a non-linear manner. In the presence of the above settings, we move further for examining asymmetry in ARDL specification. Table 5(a) and 5(b) summarizes the results. For estimating asymmetric ARDL, the Wald test was used to validate the appropriateness of the nonlinear framework. The result certifies that the variables with positive and negative components have a long-term asymmetric relationship. We start with the impact of positive oil shocks that responds negatively while negative shocks of oil prices do not confirm any effect in the long term. The asymmetrical effect implies that higher prices of oil are likely to increase the production cost and further inflationary pressure to the operating cost which may narrow the profit margins and subsequently cut the equity market return. More simplistically, this relationship implies that oil prices increase lowers the cash flows for firms and subsequently to the market value of its assets. Thus, equity returns tend to go up when the oil price goes down or stock returns consolidate when oil price increases, indicating the dependence of economic movement on oil at every level in the long term. It is important to mention here that oil price changes are so sensitive for India that the impacts are not only restricted to the industry but is appended to other levels of the economy also. For instance, an immediate impact on the discretionary income of the consumers. The resulting transmission of an increasing oil price cut down their consumables and investments. Lately, the negative reaction of investors towards such movement may be attributed to their precautionary move towards expected future oil supply shortage. Moreover, variations in oil market prices affect a country’s inflation, the balance of payment, trade, GDP growth and other macroeconomic factors that lead to equity risk premium (Nautiyal & Kavidayal, 2018). These observations conform to the findings reported by Filis et al. (2011), Gogineni (2010) and Jones et al. (2004). The effect of an increasing oil price on the stock return is more pronounced than its decrease (Atems et al., 2015; Raza et al., 2016).
In the long run, the negative movements in the exchange rate make an impact that is positive on the stock index. However, responding to a positive shock does not show a substantial move. This shows that the impact factor of Indian currency depreciation in the equity index is dominated over currency appreciation. It seems that export-dominated industries benefit more than importers due to currency depreciation against the US dollar and help them to minimize producers/render prices to increase profit margins. Nonetheless, a reversal effect may also be possible. The long-run asymmetrical response of equity index to currency exchange rate movements is close to its short-term behaviour, that is, only negative movements make an impact that is positive on the stock index. To add more validity to this argument, we conclude that investors in Indian market are more interested in investing in those businesses that are internationally exposed (export-dominated regime). This relationship acknowledges the traditional ‘flow-oriented model’ which articulates that the competitiveness of international firms improves with local currency depreciation which in turn boosts firm’s margins and thus leads to higher stock prices. This finding agrees with (Cuestas & Tang, 2017; Nautiyal, 2020). Lastly, the positive movement in gold prices has a long-term effect on Indian markets; however, the negative shock fails to bring any significant impact thereon. It may be because of the high interest and inflation rate situation when a positive change in gold prices put negative pressure on the financial market. But at a time of lower interest and inflation rate for a longer period, a sudden positive/negative gold prices movement may put a similar bearing on Indian financial returns.
The calculated long-run coefficients of both positive and negative partial sum are statistically significant. The empirics shows that rise of one basis point in interest rates would result to 0.169% decrease in equity prices and a decrease of one basis point would leads to 0.127% increase in equity movements. The negative relationship in the Indian sense appears to conform to monetarist view, which suggests that during expansionary policy approach of RBI the money supply flow increases the existing money balance which subsequently enhances the investment demand (equity) and hence an uptrend is visible in equity markets. The other explanatory view to this interpretation appears to correspond with the inverse relationship between interest rate and economic development. The result also shows that contractionary policies impede stock movement more than the former stimulates it, (Bernanke & Kuttner, 2005; Chulia et al., 2010; Lobo, 2000).
Nonlinear Dynamics and Diagnostic Test
The analysis is moved forward to seek the short-run asymmetric effect for Indian equity return. Table 5(a) shows the results. The overall impact of crude on the equity index is significantly high at 1%. This indicates that future prices are negatively impacted by the security index pattern of the previous month. Gold prices’ positive and negative previous month effect on the Indian equity index reacted positively at 10% and 1%, respectively. The gold prices’ previous month’s negative shocks, however, appear to be distinct in Indian financial markets. The short-run coefficient of partial positive effect in the exchange rate is insignificant whereas the short-run impact of the partial negative movement in currency exchange is 5% which is significantly high. This indicates a short-run asymmetry between exchange rate and equity index movement where equity returns are not short-run related to currency appreciation but are prominently linked to its depreciation.
Nonlinear ARDL Estimation Result
10% level is identified by * and at the 5% level by ** and 1% by ***.
Long-run Asymmetric Relationship
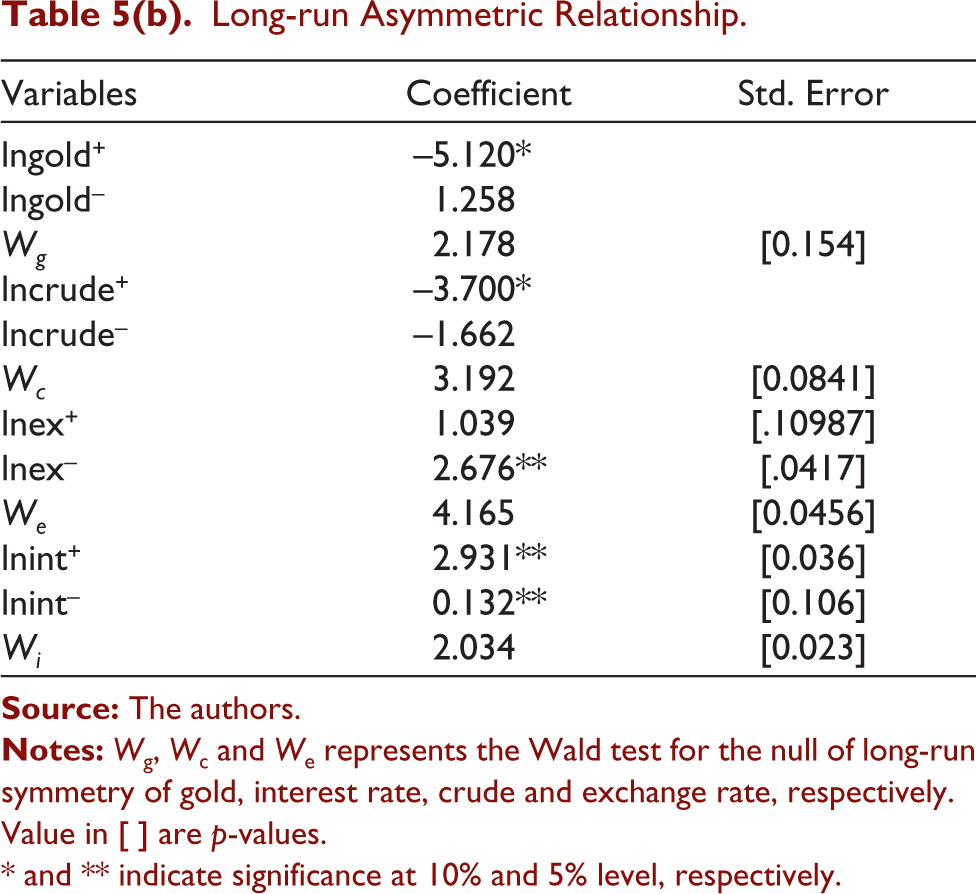
Value in [ ] are p-values.
* and ** indicate significance at 10% and 5% level, respectively.
In reference to dynamic effect of interest rates on stock prices, the analysis presents that the negative adjustments primarily trigger market responses. In other words, a moderate reaction in the equity exchanges appears due to negative interest rate adjustments. Focusing a longer time frame, the impact of rising interest rates outweigh considerably the downward trend in stock prices, however, the extent of the difference is very limited. Above outlook is consistent with the study by Lunde and Timmermann (2004) which explains that effect of short-term interest rates is negative on equity prices and market practices.
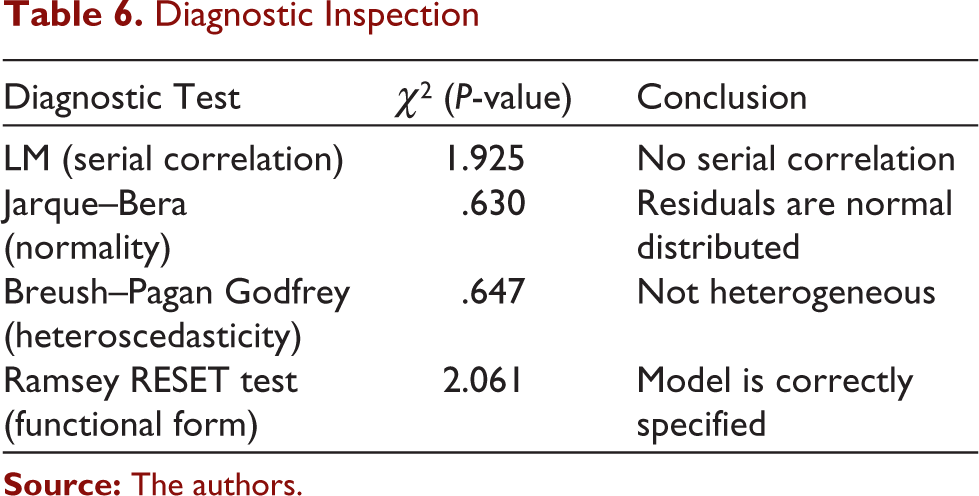
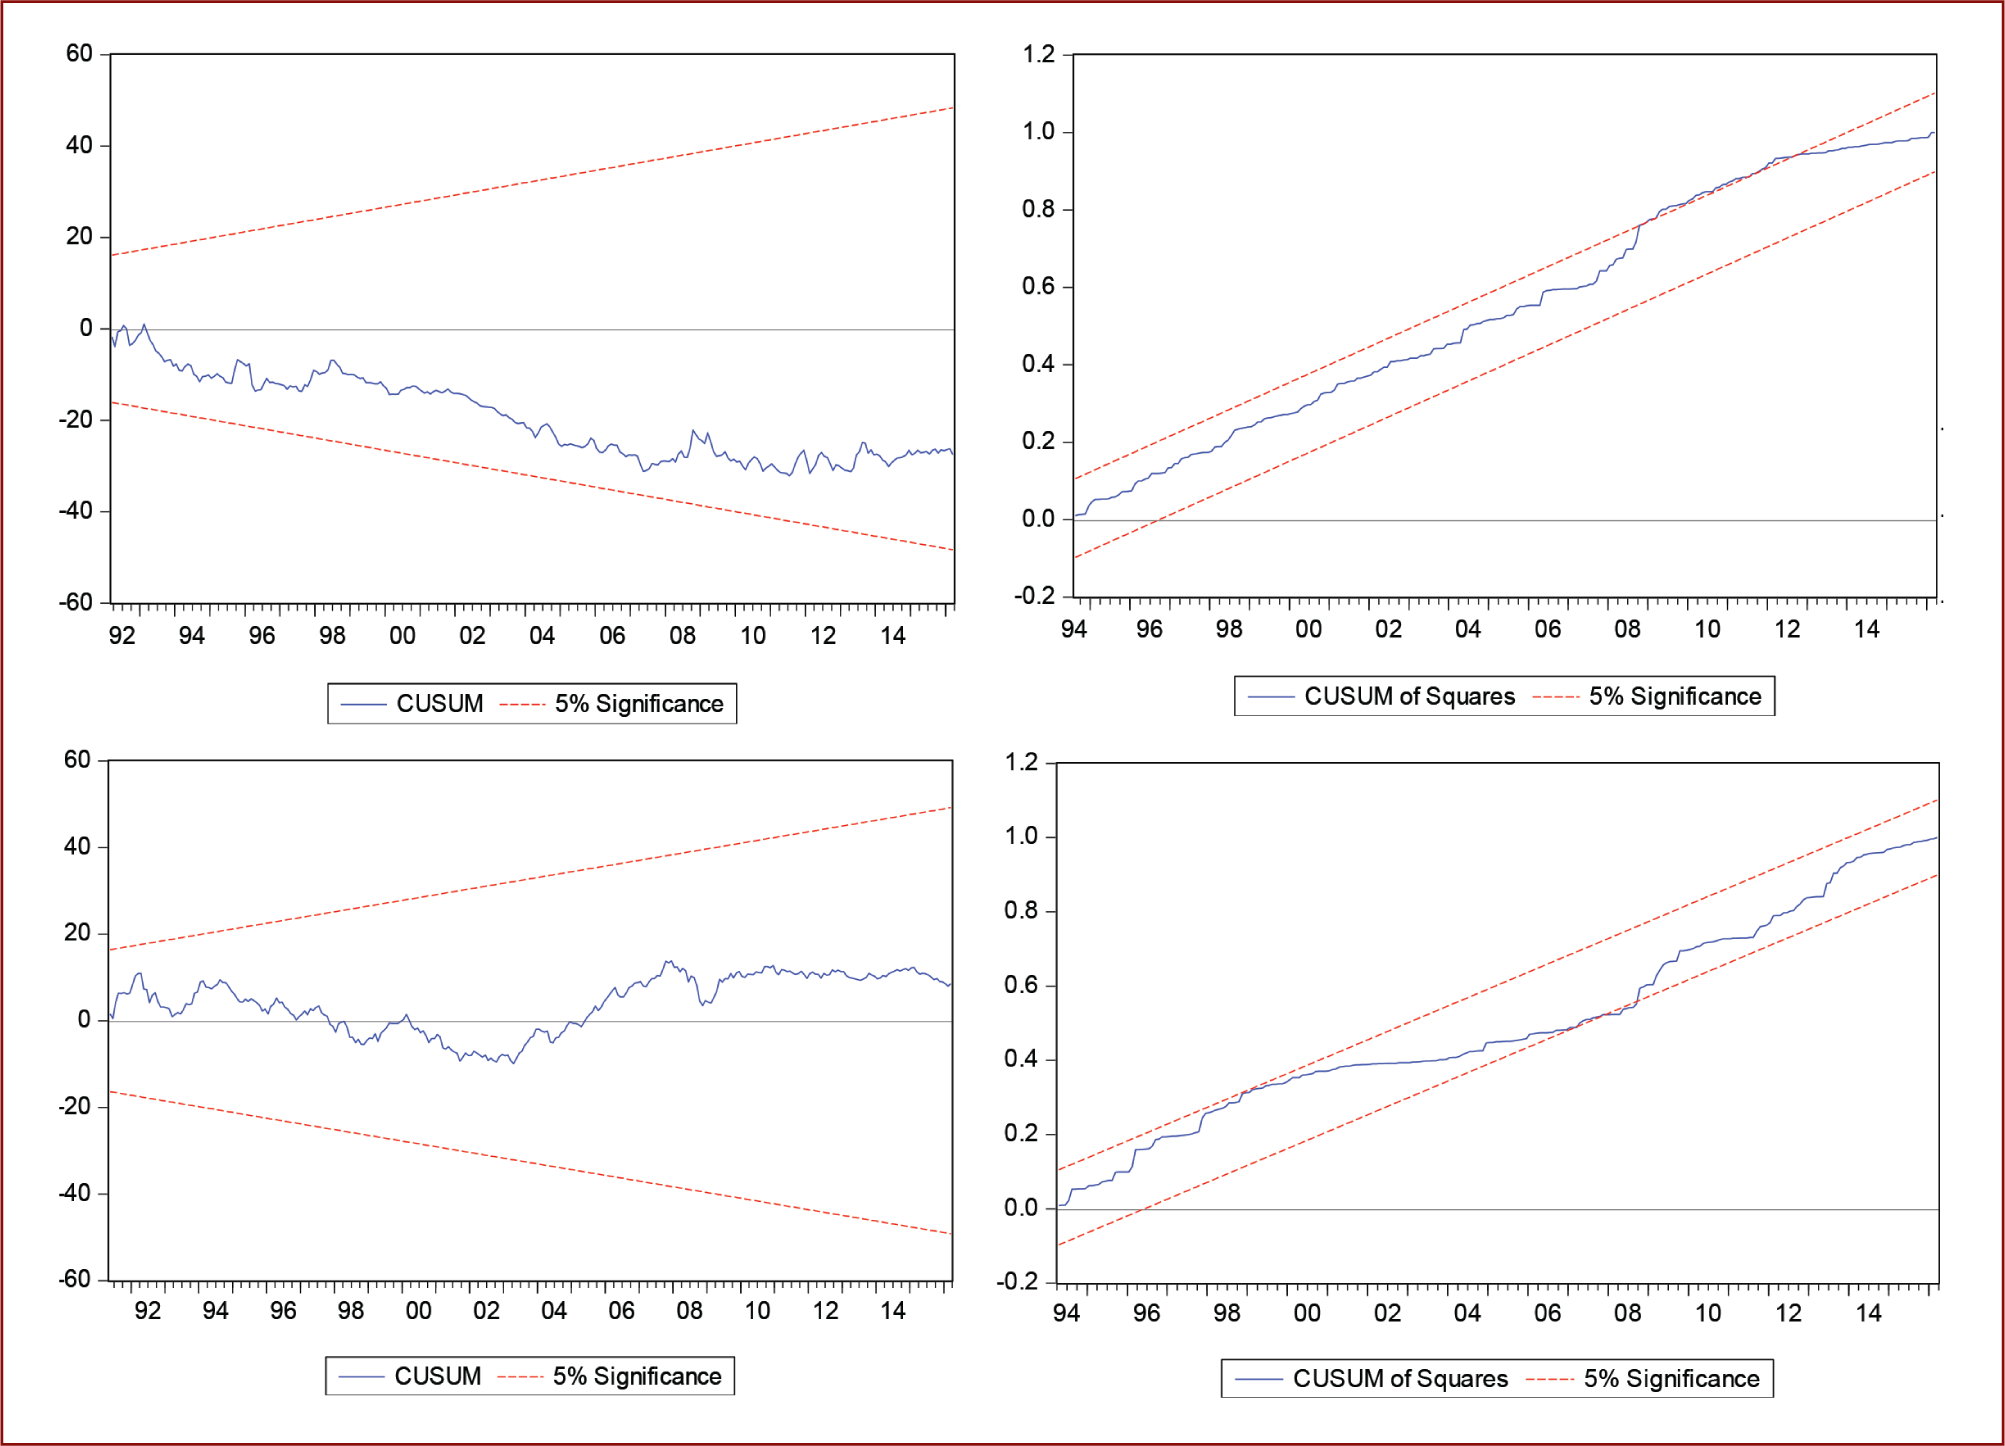
Comprehensively, it can be inferred that the above dynamic effects of variables further endorses the previously attained long-term asymmetry observed in the outcome. There is no fair and equal impact on stock prices by the explanatory variables due to positive and negative adjustments in the Indian sense. Diagnostic tests further validate the results of these asymmetric ARDL structuring (Table 6). For the Lagrange multiplier test, the value of χ2 (p-value) is 1.93 and for Brush–Pagan Godfrey tests is 0.846, restricting the serial correlation and heteroscedasticity in the current models. Ramsey RESET test also confirms the robustness of the function form of the model. The normality of residuals is validated by the Jarque–Bera test. Finally, CUSUM and CUSUMQ (Brown et al., 1975) authenticate the reliability of the model structure (Figure 2).
Diagnostic Inspection
Comprehensively, the results confirm the nonlinear stock return pattern in response to oil, interest rate, gold and exchange rates. The response to whether these variables have changed positively or negatively is highly sensitive. The speed and time-taken to achieve equilibrium depend rationally on the direction of the sampled variables. They depend on the level of the industry too. This allows market players to adapt to such developments and lead to a proactive investment strategy to avoid the undesirable impact of unforeseen events.
Conclusion
The dynamics of the Indian financial index are examined with four macroeconomic explanatory variables, namely exchange rate, interest rates, crude and gold prices in the study using the monthly database. The study provides a non-linear approach for co-integration (NARDL) pronounced by Shin et al. (2014). The study indicates that the asymmetrical effect on the equity indices from gold prices, interest rates, currency exchange and oil prices is substantial. The statistically significant co-integrating coefficients between crude prices suggest movement in prices of oil affects the stock index negatively. Gold prices appear to have a positive short-term influence on equity indices, yet the negative effect on the equity index is more pronounced in the previous month. While the positive movement in gold prices has a long-term effect in Indian markets, the negative shock fails to bring any significant impact thereon. Similar asymmetries in the equity return were found for long and short-term exchange rates. Stock prices behaviours towards changes in interest rates changes also indicate asymmetric reaction. A synoptic view shows that contractionary policies impede stock movement more than the easy money stimulates it. We can attribute this to the rise in the cost of borrowing that either could lead to lower profit or lower profit expectancy and therefore to lower stock prices.
The present study outcome is little different from a major section of existing literature for two reasons; the exchange rate and index return hardly have long-run co-integration and the second is the symmetric relationship that they share, implying that devaluation and appreciation in currency changes stock return in opposite directions by the same degree. The empirical evidence is essentially significant due to the commodity’s volatility pattern that plays a determining role to value derivatives and hedging instruments. The sharp response in equity indices due to fluctuation in commodity index also increases their vulnerability to negative/positive shocks that promote the volatile and vague environment. The asymmetric interaction of oil and gold price volatility with the equity index offers a superior understanding of the risky environment, especially in emerging financial markets.
Implications of Study and Future Research Scope
The present work offers market players with an insight to anticipate stock index movements as it is co-integrated with oil prices, gold prices and currency exchange, which may also be forecasted further on their demand and supply dynamics. Investors may use these insights to strategize investment, which would give them greater analytical ability to take into consideration while predicting the performance of the companies/index and the explanatory variables. Due to the heterogeneous asymmetrical effect of explanatory factors on the equity market index, it may be used to identify investment and hedging opportunities for optimal portfolio asset allocation decisions. Further work examining the effect of explanatory variables in the presence of structural breaks could offer more value on the movements in stock returns. An extension for examining the dynamics between a particular sector’s equity prices/index and explanatory variables using more frequent data could precisely project more accurate and detailed results.
Footnotes
Declaration of Conflicting Interests
The authors declared no potential conflicts of interest with respect to the research, authorship and/or publication of this article.
Funding
The authors received no financial support for the research, authorship and/or publication of this article.