
Abstract
This paper investigates the relationship between earnings management and financial distress and considers whether this relationship varies based on the severity of financial distress and signs of discretionary accruals (a proxy for earnings management). For this purpose, multiple regression analysis has been employed on a sample of 192 financially distressed Indian firms during the period 2011–2018, counting to 1,272 firm-year observations. Discretionary accruals are estimated by the Modified Jones model and Raman and Shahrur (2008) model, while Altman’s Z-score and distance-to-default model are used to detect the degree of financial distress. The findings disclose that the low distressed firms are indulged in higher earnings management than high distressed firms. Also, the low distressed firms are engaged more in income-decreasing earnings management. However, the results are not consistent across both earnings management and distress measures. The findings have significant implications for investors and creditors. They need to be aware of this fact while evaluating creditworthiness of a firm since firms with even a low degree of financial distress can indulge in earnings management to camouflage their true financial condition.
Introduction
The main objective of financial reporting is to deliver reliable information about the financial performance and position of a firm to its internal and external stakeholders on time. High-quality financial reporting plays an important role in the decision-making process of the stakeholders. However, in the past few decades, mainly after major financial scandals of WorldCom, Enron, and Satyam, the quality of financial reporting has become an area of concern. This has highlighted the ugly fact of firms being involved in unethical practices by camouflaging the unpleasant reality in their annual accounts, thereby pointing out earnings management worldwide, making it a topic of great inquisitiveness among the researchers and practitioners. Several studies have addressed the different aspects of earnings management practices in companies concerning various events, one of which is the firms’ financial health (Chhillar, 2016; Habib et al., 2013; Li et al., 2020; among others).
The flaws and loopholes in the accounting system and flexibility in the choice of accounting policies offer oodles of opportunities to the managers to use their judgment while preparing annual accounts. The incentives behind earnings management are manifold. One of the main driving forces being the market reaction. If a company fails to meet its earnings forecast, the company’s share price may be adversely affected by the negative reaction of the market. This may ultimately affect executive compensation, thus compelling the managers to use their discretionary powers to beat the current-year earnings benchmark (Ajit et al., 2013). Managers also resort to earnings management to influence short-term stock performance and enhance their bonus level (Healy & Wahlen, 1999). The firms going for initial public offerings, seasoned equity offerings, buyback of shares, and mergers and acquisitions manage their earnings to enhance the stock price and minimize acquisition cost (Kalgo et al., 2019; Zhang, 2015). Moreover, banking regulations and government interventions also influence earnings management activities in firms (Jones, 1991).
Existing research shows that firms’ financial health also acts as a motivating factor behind earnings management. Financial distress in companies has always been a matter of concern to the investors, creditors, and government since it affects the stakeholders and the entire economy and society. Managers of distressed firms worry about their job loss, cut in bonus, loss of reputation, and resort to earnings management for their private gain (Jaggi & Lee, 2002). Distressed firms face problems related to suppliers, customers, labourers, and creditors. To avoid such problems, they often manage their earnings (Nagar & Sen, 2016).
Prior studies provide evidence that financially distressed firms indulge both in upward and downward earnings management. Mainly the firms deflate their earnings to highlight their financial difficulties to get better terms while renegotiating debt covenants (Jaggi & Lee, 2002), obtaining government support (DeAngelo et al., 1994), or under the pressure of audit opinion (Etemadi et al., 2013) and inflate their earnings to portray firms as less distressed to avoid default and continue obtaining financing from banks (Chhillar, 2016; DeFond & Jiambalvo, 1994). The reasons behind firms engaging in earnings management is a matter of key importance to the researchers. However, the managerial behaviour towards earnings management is closely related to the firms’ financial health.
The present study is intended to empirically examine the earnings management behaviour of financially distressed firms in the Indian context. Mostly the studies on earnings management in distressed firms have been carried out in international scenarios and are mainly based on the developed economies. There are limited studies on developing economies like India, where only a few studies exist (Agrawal & Chatterjee, 2015; Chhillar, 2016; Nagar & Sen, 2016; Rakshit & Paul, 2020). Moreover, the researchers have mainly focused on a single model for detecting earnings management and financial distress. Predominantly the studies have employed the Modified Jones model put forth by Dechow et al. (1995) to validate the earnings management phenomenon for firms, while subsequently, some other researchers have proposed improvements to this model. In India, hardly any studies have considered the Modified Jones model as well as suggested improvements to this measure propounded in the existing literature. Instead of relying on one model, this study is extended to two models of earnings management to explore whether the use of different earnings management models affects the linkage between earnings management and financial distress. Further, Indian studies have considered only absolute discretionary accruals (DAC), a proxy for earnings management, and have not emphasized whether DAC is positive or negative. However, it is crucial to understand whether a company is increasing or decreasing its earnings based on financial distress. This issue is addressed in this paper.
The contribution of this paper to the existing literature is threefold. Firstly, existing studies on Indian firms have mainly focused on a single model for detecting earnings management and financial distress. This paper extends the literature by examining the linkage between earnings management and financial distress by using two different models for detecting earnings management and financial distress. The Modified Jones (1995) model and Raman and Shahrur (2008) model are used to estimate DAC, while Altman’s Z-score and Merton’s distance-to-default model are used as a measure of financial distress. Using two different earnings management models, the paper explores whether the relationship between earnings management and financial distress varies across earnings management models. Secondly, the paper attempts to determine whether a firm’s earnings management activities vary by the severity of financial distress. For this, the distressed sample is divided based on the degree of financial distress into high distressed and low distressed firms. Thirdly, the paper also evaluates whether the relationship between financial distress and earnings management varies based on the signs of DAC. Existing studies on Indian firms have not examined this aspect so far. However, Ting et al. (2009) have analyzed the association between default risk and earnings management by categorizing the sample into positive and negative DAC based on the Chinese economy, which is primarily composed of state-owned enterprises. Habib et al. (2013) also assessed earnings management in distressed firms after such classification in the New Zealand context. India is a developing country whose corporate landscape is dominated by family firms and business groups characterized by large promoter holdings, weak corporate governance structure, low investor protection, and low shareholders’ activism. Hence, there is ample scope for Indian firms to manage their earnings. Therefore, the results could be different for Indian firms, which would greatly value the lenders, investors, and other stakeholders.
The study proceeds as follows. The second section provides a brief review of the extant literature and develops testable hypotheses. The third section outlines the research objectives. The fourth section describes the database and research methodology. Results and analysis are presented in the fifth section. The sixth section concludes the paper with managerial and practical implications of the study and finally, the seventh section put forth the limitations of the study and the scope for further research.
Literature Review and Hypotheses Development
Earnings Management and Financial Distress
A vast body of literature studies the degree of financial distress in firms and its contributing factors (Binh et al., 2018; Bravo & Moreno, 2020; Shahwan & Habib, 2020). Balasubramanian et al. (2019) developed a distress prediction model using financial and non-financial parameters for Indian firms. They found that the accuracy rate of the model with both financial and non-financial variables is higher than the model with only financial variables. Further, they revealed that return on investment, net asset value, institutional holdings, debt-equity ratio, promoters holding pledged, retention ratio, and firm age are significant predictors of financial distress. In contrast, Sehgal et al. (2021) portrayed that fixed asset to total asset, return on capital employed, asset turnover ratio, firm size, debt-equity ratio, and cash flow to total liability play a critical role in financial distress prediction for Indian firms. Binh et al. (2018) documented that market- and accounting-based variables along with macroeconomic factors influence the degree of financial distress in Vietnamese listed firms. However, the influence of accounting-based variables is more significant than market-based variables. Saji (2018) disclosed that Altman’s Z-score of Indian realty companies carries sufficient information that helps in forewarning stock market failures and distress prediction 2–5 years in advance. Bravo and Moreno (2020) assessed whether adherence to the corporate governance codes aids in minimizing the level of distress in Spanish firms. They found that compliance with codes relating to the only board of directors mitigates the risk of financial distress. In a similar context, Younas et al. (2021) argued that good corporate governance practice lowers the likelihood of financial distress in Pakistan. Conversely, Shahwan and Habib (2020) found no impact of corporate governance practices on financial distress in Egyptian firms.
Studies on earning management are also widespread in academic literature. Researchers have tried to find out the relationship between earnings management and several factors, including firm performance (Kumar et al., 2021; Tabassum et al., 2015), firm attributes (Bassiouny et al., 2016; Debnath, 2017), corporate governance mechanisms (Campa & Donnelly, 2014; Chatterjee & Rakshit, 2020; Hutchinson et al., 2008), financial distress (Ghazali et al., 2015; Li et al., 2020; Matonti et al., 2020) and so on. The linkage between earnings management and financial distress has received considerable attention from academic researchers. Several studies have explored the earnings management behaviour of financially distressed firms from different perspectives. DeAngelo et al. (1994) observed that the managers of the US distressed firms shifted their earnings downward to highlight their financial difficulties to renegotiate with their lenders and obtain better terms in debt contracts. Saleh and Ahmed (2005) too discovered that the magnitude of DAC was significantly more negative in the year surrounding debt renegotiations. However, Rosner (2003) noted that the bankrupted firms were involved in income-increasing earnings management in the year preceding bankruptcy to conceal their true financial position. DeFond and Jiambalvo (1994) also exhibited similar results. Chen et al. (2010) conveyed that the Chinese firms involve in income-increasing earnings management practices to eschew continued ST status and minimize the risk of being delisted. Conversely, in Italian non-listed firms, Matonti et al. (2020) noted that the firms engage in income-decreasing earnings management as the risk of financial distress enhances. Li et al. (2020), based on Chinese listed firms, highlighted that internal control restrains earnings management in distressed firms. While Etemadi et al. (2013) disclosed that the failing firms in Iran understated their earnings under the pressure of audit opinion. Ranjbar and Amanollahi (2018) observed higher earnings management in Iranian distressed firms than the non-distressed firms. However, Charitou et al. (2011) found no monotonic relationship between financial health and earnings quality. Further, they stated that the US distressed firms manage their earnings more frequently towards a positive target than healthy firms. Contrarily, for Malaysian public listed firms, Ghazali et al. (2015) found that financially healthy companies having high profits were engaged in higher earnings management than distressed firms.
Some studies have focused both on accrual and real activity-based earnings management. Tabassum et al. (2015) noted that the financial performance of the Pakistani firms indulging in real earnings management becomes worse in the future. In the Indonesian context, Muljono and Suk (2018) discovered that financial distress is negatively associated with accrual earnings management but positively related to real earnings management. Qin and Ren (2017) observed that the rise in negative DAC in distressed firms is because of the reversal of positive total accruals in the preceding years and also as a result of shifting towards income-inflating real earnings management from the parity in the tradeoff between accrual and real earnings management during healthy times. In the case of Pakistani listed firms, Shah et al. (2020) found that the firms use accrual and real earnings management as a substitute to achieve the desired earnings level. Conversely, Agustia et al. (2020) found no association between bankruptcy risk and earnings management. While Christina and Alexander (2019) disclosed that financial distress negatively impacts earnings management.
Earnings management has also been widely studied in the Indian scenario. Ajit et al. (2013) evaluated the extent of earnings management practices in Indian firms and disclosed that the construction and mining sector indulge in higher earnings management. Contrarily, Kaur et al. (2014) argued that the biotech sector involves in maximum earnings management practices followed by the Telecom sector. Studies analyzing the effect of earnings management on firm performance found that earnings management adversely affects firm performance (Debnath, 2017; Kumar et al., 2021). However, prior studies claimed that good corporate governance restraints earnings management in Indian firms (Chatterjee & Rakshit, 2020; Kumari & Pattanayak, 2017). Also, several studies have appraised the degree of financial distress in Indian firms and its determinants (Balasubramanian et al., 2019; Gupta, 2017; Saji, 2018; Sehgal et al., 2021). However, studies analyzing the association between earnings management and financial distress are limited in the Indian scenario. In this context, Agrawal and Chatterjee (2015) noted that the high distressed firms are less inclined towards earnings management than low distressed firms. Chhillar (2016) asserted that distressed firms indulge in earnings management to camouflage their poor financial performance, avoid debt covenant violations, and get better terms in renegotiating debt covenants. Nagar and Sen (2016) argued that companies in their early distress stage resort to real activities and classification shifting-based techniques to enhance profitability and liquidity and during the severe distress phase, they involve in accrual earnings management. Rakshit and Paul (2020) observed that the distressed firms belonging to the Indian textile sector indulge in income-deflating earnings management.
Studies on earnings management have a deep linkage with the agency theory. The agency theory explains the inherent divergence of interest between managers and owners of the firms (Jensen & Meckling, 1976). Managers (agents) may be motivated in managing earnings for their personal benefits while owners (principal) try to restrict opportunistic behaviour of the managers through proper monitoring (Ashbaugh et al., 2004). Strong boards of directors and large institutional shareholders are effective in reducing the agency costs between the managers and owners, especially in family-owned corporations (Anderson & Reeb, 2003; Sarkar et al., 2008). Due to difference in the ownership pattern, the type of agency problem is also different in India than the developed countries. While the developed countries face an insider (manager) and outsider (shareholder) type of agency problem, the agency problem in India is primarily between promoters (i.e., majority shareholders) and the minority shareholders (Chatterjee, 2021). Also, inadequate regulatory supervision and lack of adequate shareholders’ activism provide more opportunities to managers of Indian firms to manage earnings. Earnings management, if any, not only impacts shareholders interest adversely but also increases agency costs.
A review of existing literature highlights that the prior studies provide mixed evidence regarding the nature of the association between earnings management and financial distress. The previous researches have evinced mixed results due to the difference in the quality of auditing (Etemadi et al., 2013), internal control system (Li et al., 2020), and corporate culture of different countries, which influences managerial accounting choices and judgment (Selahudin et al., 2014). In the Indian scenario, there are limited studies in this domain, and the studies have mainly used a single model for estimating earnings management and financial distress. According to Chen (2010), results from a single model are inadequate to prove anything. So, this paper uses two earnings management models to detect the nature of the association between earnings management and financial distress. Hence, results could be different from prior studies since the relationship between earnings management and financial distress may vary based on models used for estimating earnings management. Given the mixed evidence regarding the nature of the relationship between earnings management and financial distress, the present study does not assume the direction of relationship. However, it presumes a significant relationship between earnings management and financial distress. So, the following hypothesis is formulated:
H1: There is a significant relationship between financial distress and earnings management.
Earnings Management and Severity of Financial Distress
The second set of analyses explores whether the severity of financial distress affects earnings management practices in firms. Among the distressed firms, some firms are suffering from severe distress and some are not so severely distressed. So, it is essential to find out how the severity of financial distress is affecting the level of earnings management practices in firms. There is a dearth of studies in this context. Jaggi and Lee (2002) argued that the severity of financial distress affects managerial accounting choices. They observed that the low distressed firms resort to upward earnings management to get a waiver for violating debt covenants while the managers of high distressed firms highlighted their actual financial problems in their financial report to enter into debt renegotiation with their lenders. Agrawal and Chatterjee (2015) found that the high distressed firms are less inclined towards earnings management, whereas less distressed firms are indulged in higher earnings management. In line with this notion, it is postulated that low distressed firms are engaged in higher earnings management than high distressed firms. Hence, the following hypothesis is developed:
H2: The lower (higher) the severity of financial distress, the higher (lower) the level of earnings management.
Financial Distress and Positive and Negative DAC
Finally, the study examines whether the linkage between financial distress and earnings management varies based on the sign of DAC (positive DAC and negative DAC). Instead of focusing on only absolute DAC, it is vital to know how the level of financial distress affects the firms’ upward and downward earnings management behaviour. Limited studies have focus on this aspect, and to the best of our knowledge, no Indian study has addressed this issue. Ting et al. (2009) claimed that firms with positive DAC have high default risk than firms with negative DAC. While Habib et al. (2013) found that high distressed firms generally use negative DAC strategies. Also, DeAngelo et al. (1994) and Jaggi and Lee (2002) found that the high distressed firms use negative DAC to renegotiate debt contracts. Therefore, it is conjectured that the lower the level of distress, the more is the use of positive DAC, whereas the higher the level of distress, the more is the use of negative DAC. Therefore, the following hypothesis is formulated:
H3: Low distressed firms are engaged in income-increasing earnings management (i.e., positive DAC) and high distressed firms are engaged in income-decreasing earnings management (i.e., negative DAC).
Research Objectives
The central objective of this paper is to empirically examine the linkage between financial distress and earnings management for firms in an emerging economy, India. Further, we investigate whether the linkage between financial distress and earnings management varies according to the severity/degree of financial distress of firms. Finally, we try to explore what type of firms (high/low distressed) is engaged in income-increasing and income-decreasing earnings management.
Database and Research Methodology
Sample Selection
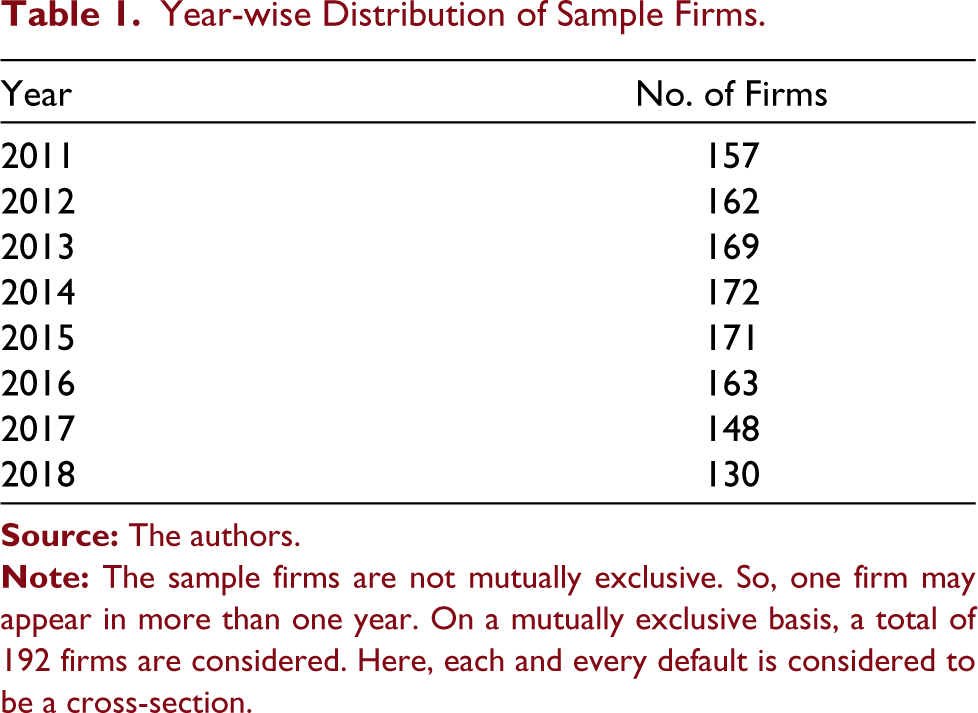
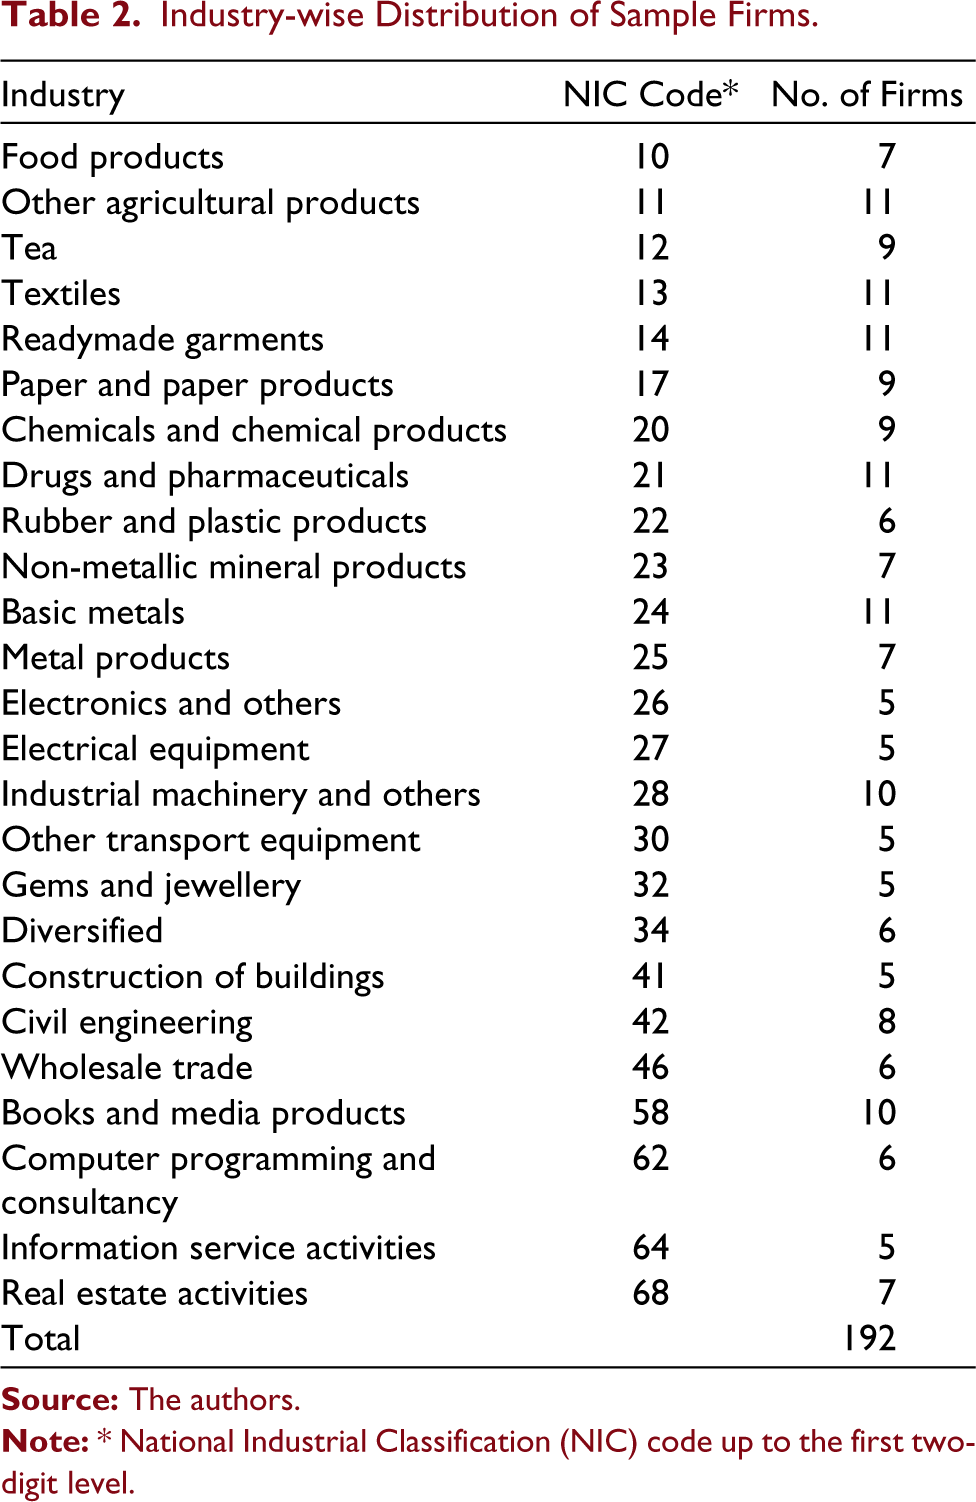
This study is based upon a secondary database. The sample consists of financially distressed Indian firms that are assigned a ‘D’ rating by the credit rating agencies in India, namely, Investment Information and Credit Rating Agency of India Ltd. (ICRA), Credit Rating Information Services of India Ltd. (CRISIL), Fitch Ratings Private Ltd. and Credit Analysis and Research (CARE). The companies that are either in default or are expected to be in default are rated ‘D’ by these credit rating agencies. When a company is getting a ‘D’ rating, it is assumed that the company is in financial distress. A period of eight years is covered in this study ranging from 2011 to 2018. CMIE Prowess database is used to collect the data set for the financial variables used in this study. Each company is considered only for those years in which it is rated ‘D’ by the credit rating agencies. Table 1 present the year-wise distribution of the sample firms. These firms are not mutually exclusive. One firm may appear in more than one year. The study considers each and every default as a cross-section. Hence, cross-sectional regression has been used for analysis purposes. The sample is confined to a total of 192 financially distressed companies (on mutually exclusive basis) that are spread across 25 different industrial sectors based on the 2-digit National Industrial Classification (NIC) code presented in Table 2.
Year-wise Distribution of Sample Firms
Industry-wise Distribution of Sample Firms
Measurement of Earnings Management
DAC is considered an important measure for detecting earnings management by several prior studies (Chen, 2010; Dechow et al., 1995; Habib et al., 2013). So, this study also considers DAC as a proxy for earnings management. In the existing literature of earnings management, there are several models for computing DAC but the Modified Jones model is the most widely used since it is found to be an efficient model by several researchers (Chen, 2010; Dechow et al., 1995). However, Chen (2010) argued that along with the Modified Jones model, another model should also be used to estimate DAC since results deriving from a single model is inadequate to prove anything. Therefore, two models of earnings management are used in this study to compute DAC, that is, Modified Jones Model and Raman and Shahrur (2008) model. Raman and Shahrur’s (2008) model is a fairly recent model that extends the Modified Jones model by controlling for firm performance (consistent with Kothari et al. model) and growth opportunities.
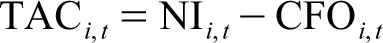
For estimating DAC, first, total accruals need to be detected for each firm ‘i’ for each year ‘t’ for a specific industry. Total accruals are estimated as follows:
Where for firm i in year t,
TAC
i,t
= Total accruals NI
i,t
= Net income CFO
i,t
= Cash flow from operations
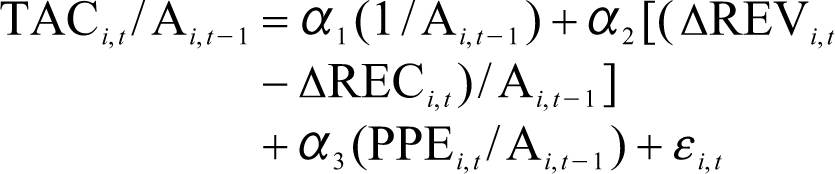
In the second step, for estimating non-discretionary accruals two different models are used in this study. Industry-wise regression equations are run to determine the coefficients of the following models.
Modified Jones (1995) Model
Raman and Shahrur (2008) Model
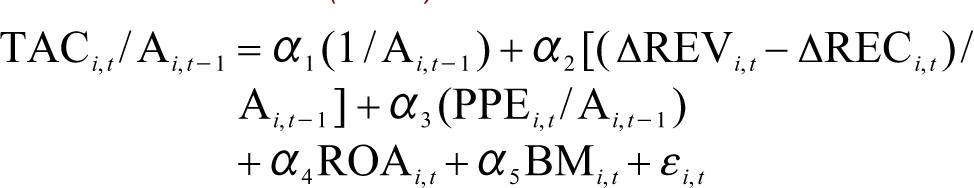
Where for firm i,
ΔREV
i,t
= Revenues in year t less revenue in year t–1 ΔREC
i,t
= Receivables in year t less receivables in year t–1 PPE
i,t
= Gross plant, property and equipment in year t ROA
i,t
= Return on asset in year t BM
i,t
= Ratio of total assets to (total assets minus book value of equity) in year t Ai,t–1 = Total assets in year t–1 εi,t = Error term in year t
The estimated coefficients are put in the above regression equations to derive the non-discretionary accruals, representing the estimated value of total accruals for each model. Then the DAC is computed for each model as:

Where, DAC i,t = Discretionary accruals for firm i in year t
NDA i,t = Non-discretionary accruals for firm i in year t
Measurement of Financial Distress
The present study considers the following two popular models for predicting the degree of financial distress.
Altman’s Z-score Model
Altman’s Z-score is the most globally recognized and widely used model for measuring financial distress (Charitou et al., 2011; Chhillar, 2016; Ghazali et al., 2015). The lower the Z-score value, the higher the probability of distress and vice versa (Altman, 1968). The Z-score can be estimated as:
Where, WC = Working capital, that is, current assets minus current liabilities
RE = Retained earnings EBIT = Earnings before interest and tax MVE = Market value of equity BVL = Book value of liabilities TA = Total assets
Distance-to-default Model
Merton’s distance-to-default (DD) is another popular model for measuring financial distress. The lower the value of the DD variable, the higher the probability of distress, and vice versa. DD variable can be calculated as (Bystrom, 2006):
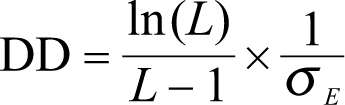
Where, L = leverage ratio computed as D/(VE + D)
Where VE is the market value of equity and D is the book value of debt
σE = volatility of the firm’s equity
Regression Specifications
Multiple regression analysis is used to examine the linkage between earnings management and financial distress. Five regression models are considered in this study. The control variables are added to the regression models as it is conjectured that these variables increase the strength of the association.
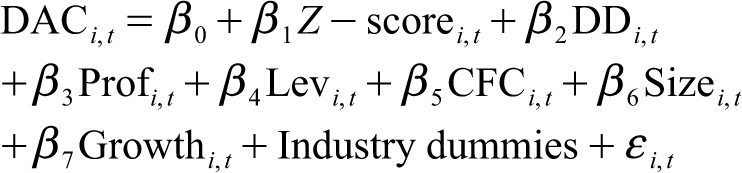
The nature of association between earnings management and financial distress is detected in the first two models by considering the actual values of Z-score and DD. Also, it is investigated whether this relation differs across earnings management measures. Therefore in the first model, DAC is estimated using the Modified Jones model, and in the second model, DAC is estimated following Raman and Shahrur model.
Regression Model 1
Regression Model 2
Where for firm i in year t,
DACmj = Discretionary accruals computed following Modified Jones Model DACrs = Discretionary accruals computed following Raman and Shahrur model Z-Score = Altman’s Z-score DD = Distance-to-default value Prof = Profitability measured by return on assets computed as (net income/total assets) ×100 Lev = Leverage computed as long-term debts/total assets CFC = Cash flow coverage computed as (cash flow from operations + cash and cash equivalents)/interest Size = Firm size measured by natural log of total assets Growth = Firm growth measured by market value of equity/book value of assets ε = Other factors not captured by the model
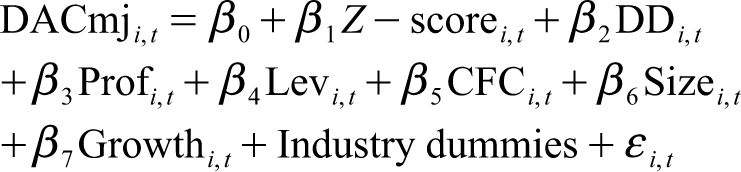
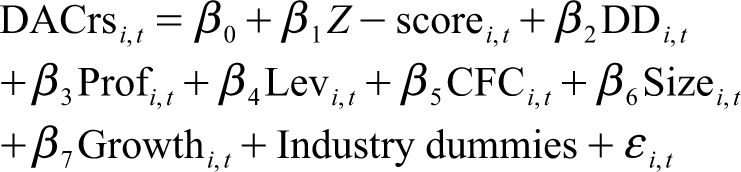
The next two regression models are used to explore whether the relationship between earnings management and financial distress varies based on the severity of financial distress. The sample consists of financially distressed firms. Some firms are severely distressed, and some are not so severely distressed. According to Altman’s model, firms with Z-score below 1.81 fall in the distressed zone and above 2.99 falls in the healthy zone. If the Z-score lies between 1.81 to 2.99, the firm is in a grey zone. Among the sample firms, 85.06% of firms are in the distressed zone (i.e., 1,082 firm-year observations out of 1,272 firm-year observations), 10.77% of firms are in the grey zone (i.e., 137 firm-year observations out of 1,272 firm-year observations) while only 4.17% of firms are in healthy zone (i.e., 53 firm-year observations out of 1,272 firm-year observations). So, this criterion of differentiating the firms into high and low distressed firms has not been considered in this study as most of the sample firms are already distressed firms. Hence, to distinguish between high distressed and low distressed firms, respective median values of Z-score and DD are considered for the distressed sample firms only (i.e., 1,082 firm-year observations) following Agrawal and Chatterjee (2015). Firms having Z-score and DD values higher than their respective median values are identified as low distressed firms, and the firms with Z-score and DD values lower than their respective median values are categorized as high distressed firms. In these models, dummy variables for Z-score and DD are used to identify low distressed and high distressed companies. The third model uses DAC computed using the Modified Jones model, and the fourth model uses DAC computed following Raman and Shahrur model.
Regression Model 3
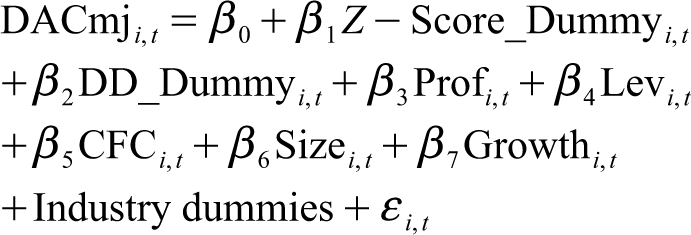
Regression Model 4
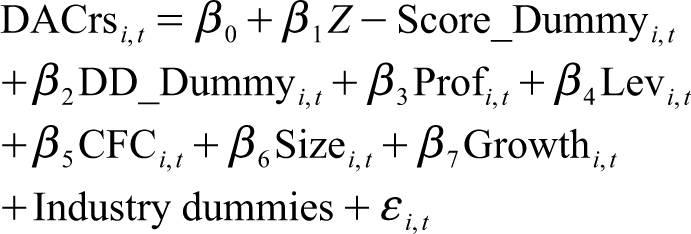
Where, Z-Score_Dummy = Dummy variable for Z-Score which carries the value 1 if Z-score is higher than median Z-score (i.e., for low distressed firm) and 0 otherwise (i.e., for high distressed firm).
DD_Dummy = Dummy variable for DD which carries the value 1 if DD is higher than median DD (i.e., for low distressed firm) and 0 otherwise (i.e., for high distressed firm).
The dependent variable and the other independent variables remain the same as Equations (5) and (6).
The next regression model is used to examine whether the relation between earnings management and financial distress varies according to the firms’ upward and downward earnings management behaviour. Accordingly, the entire sample is divided into two sub-samples based on the DAC signs, that is, positive DAC and negative DAC for each model of earnings management. The following regression model is run twice for the positive and negative DAC sample separately for each earnings management model.
Regression Model 5
Where the dependent and independent variables remain the same as the Equations (4) and (5).
Research Variables Description
Dependent variable
Discretionary accruals, the proxy for earnings management, are considered as the dependent variable, estimated using the Modified Jones model and Raman and Shahrur model.
Independent variables
Altman’s Z-score and Merton’s distance-to-default are the two independent variables that are used to measure the level of financial distress.
Control variables
Five control variables are used in this study to control for other factors that might affect the degree of earnings management in firms. These variables are drawn from the existing literature and are briefly explained below.
Return on assets (ROA) is taken as the measure of profitability. Profitability is likely to affect the degree of earnings management in firms (Chatterjee & Rakshit, 2020). It is expected that firms with higher financial performance have lower DAC, and firms with poor performance indulge more in earnings management to portray a better financial position and achieve the targeted earnings level (Chen et al., 2010; Hutchinson et al., 2008). Therefore, the present study considers ROA as a control variable.
Leverage is considered as the measure of firms’ capital structure (Chatterjee & Rakshit, 2020; Habib et al., 2013). It is argued that high leveraged companies have strong incentives to involve in earnings management to avoid the risk of violating debt covenants (DeFond & Jiambalvo, 1994; Kalgo et al., 2019). Conversely, Muljono and Suk (2018) stated that the level of monitoring activities rises in high leveraged firms thus restricting managerial earnings management behaviour. Hence, leverage is taken as a control variable.
Cash flow coverage (CFC) is expected to influence the extent of earnings management in firms (Agrawal & Chatterjee, 2015) and is considered as the third control variable. Cash flow from operations is found to be inversely related to earnings management since firms may use DAC to compensate for problems related to cash flows and expenses (Chen et al., 2010; Habib et al., 2013). Generally, firms with regular and adequate operating cash flows are less likely to indulge in earnings management (Jiang & Anandarajan, 2009).
Firm size is also expected to impact the level of earnings management (Charitou et al., 2011; Chen et al., 2010). Some researchers claim that larger firms have high-quality auditing, robust corporate governance mechanisms, lower level of information asymmetry, better internal control, and concern for reputation loss. Hence they involve less in earnings management. Contrarily, it is argued that high pressure from investors and financial analysts to meet or beat the earnings forecast and high bargaining power with auditors force the large-sized firms to engage in earnings management (Campa & Donnelly, 2014; Habib et al., 2013). Therefore, firm size is taken as a control variable.
Growth opportunity is likely to influence the quality of earnings and is used as the fifth control variable. The scope of investment opportunities is limited in firms with low growth opportunities, and subsequently, they have more free cash flows, which induce managers to distort the earnings figure (Hutchinson et al., 2008). Conversely, as per the contracting theory, firms with high growth opportunities, high future discretionary investment expenditure by management, and low asset value are hard to observe and monitor, resulting in higher earnings management (Habib et al., 2013).
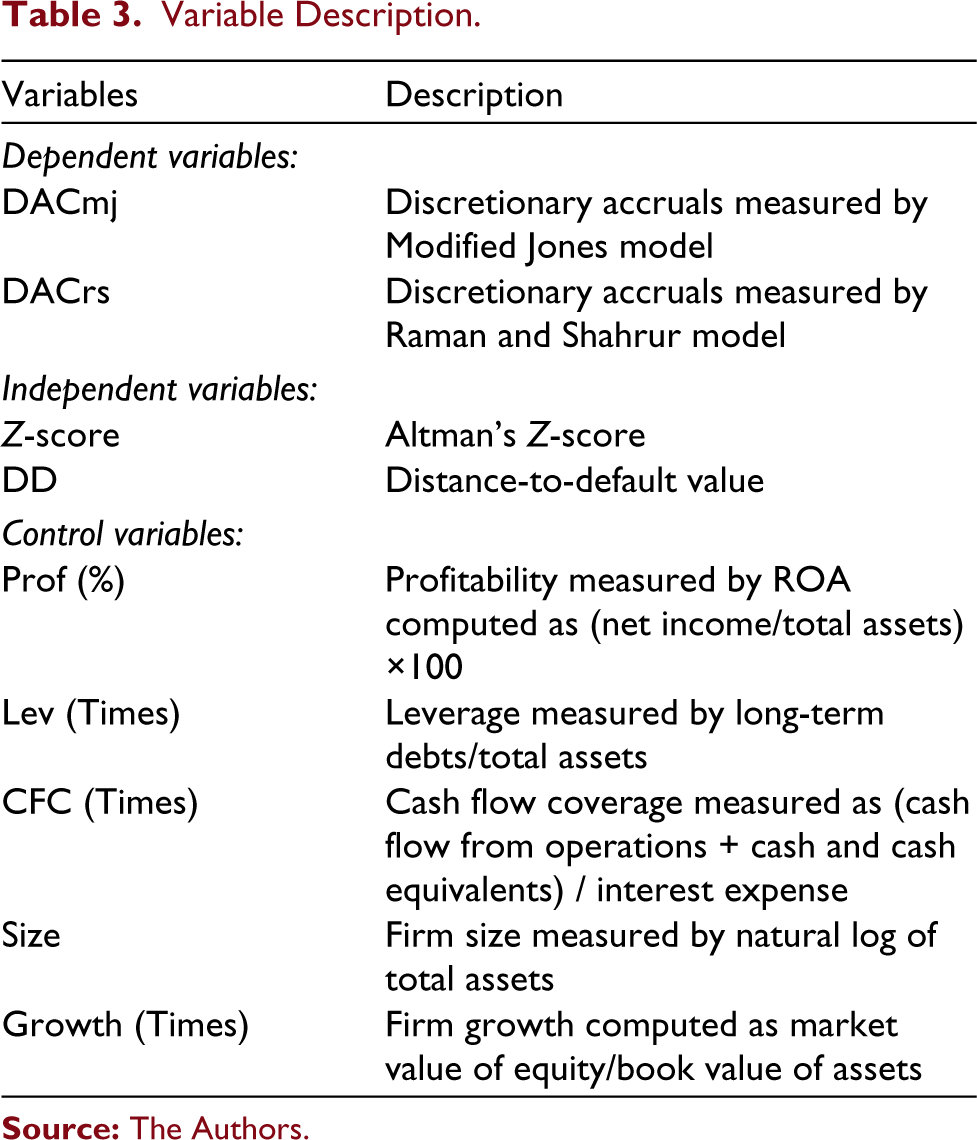
Industry dummies are included in all the regression models to capture unobserved industry effects. The definitions of the research variables considered in this study are depicted in Table 3.
Variable Description
Empirical Results and Analysis
Descriptive Statistics
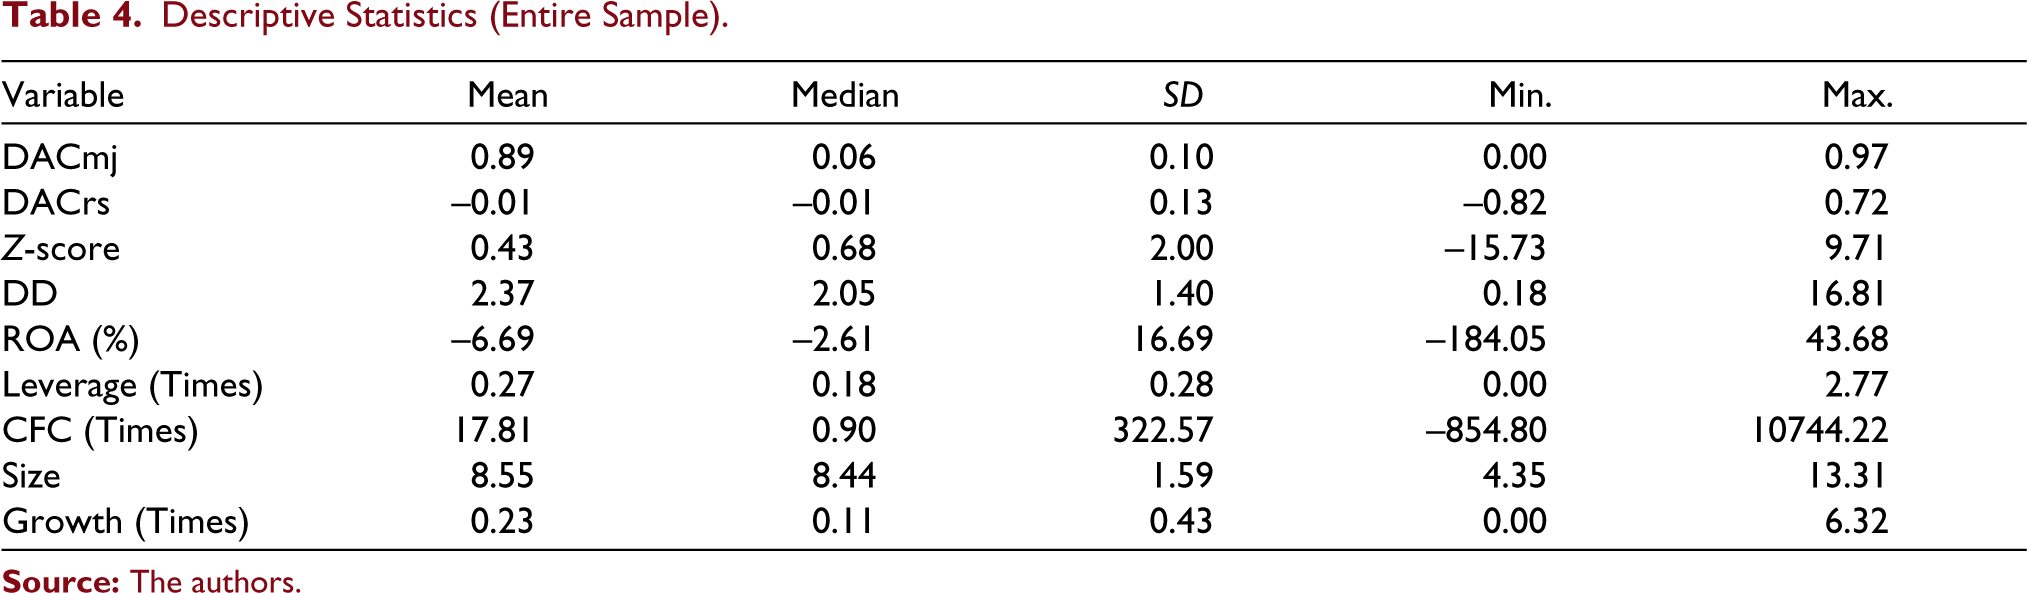
Table 4 presents the descriptive statistics of the variables used in this study. The mean value of DAC as per the Modified Jones model (DACmj) is positive (0.89), and the minimum value of DACmj is zero, which signifies that as per the Modified Jones model, all the distressed firms indulge in income-increasing earnings management. Simultaneously, the mean DAC as per Raman and Shahrur model (DACrs) is negative (–0.01), implying that overall the firms engage in income-decreasing earnings management. Also, the minimum value of DACrs is negative (–0.82), and the maximum value is positive (0.72), indicating that as per Raman and Shahrur model, firms engage both in income-inflating and income-deflating earnings management. The mean Z-score (0.43) denotes that, on average, the sample firms have a poor financial condition. Firms’ profitability (measured by ROA) has a wide gap between the maximum value (43.68%) and minimum value (–184.05%) with a high value of standard deviation (16.69), indicating that profitability varies widely across sample companies. Moreover, the mean value of profitability is negative (–6.69%), implying that overall the sample companies are loss-making. Firms’ CFC also has a very high standard deviation (322.57) with a wide range of differences between the maximum value (10744.22 times) and minimum value (–854.80 times). It signifies that CFC also varies widely across sample companies. It can be noted from the mean leverage value (0.27 times) that overall the sample firms are low leveraged.
Descriptive Statistics (Entire Sample)
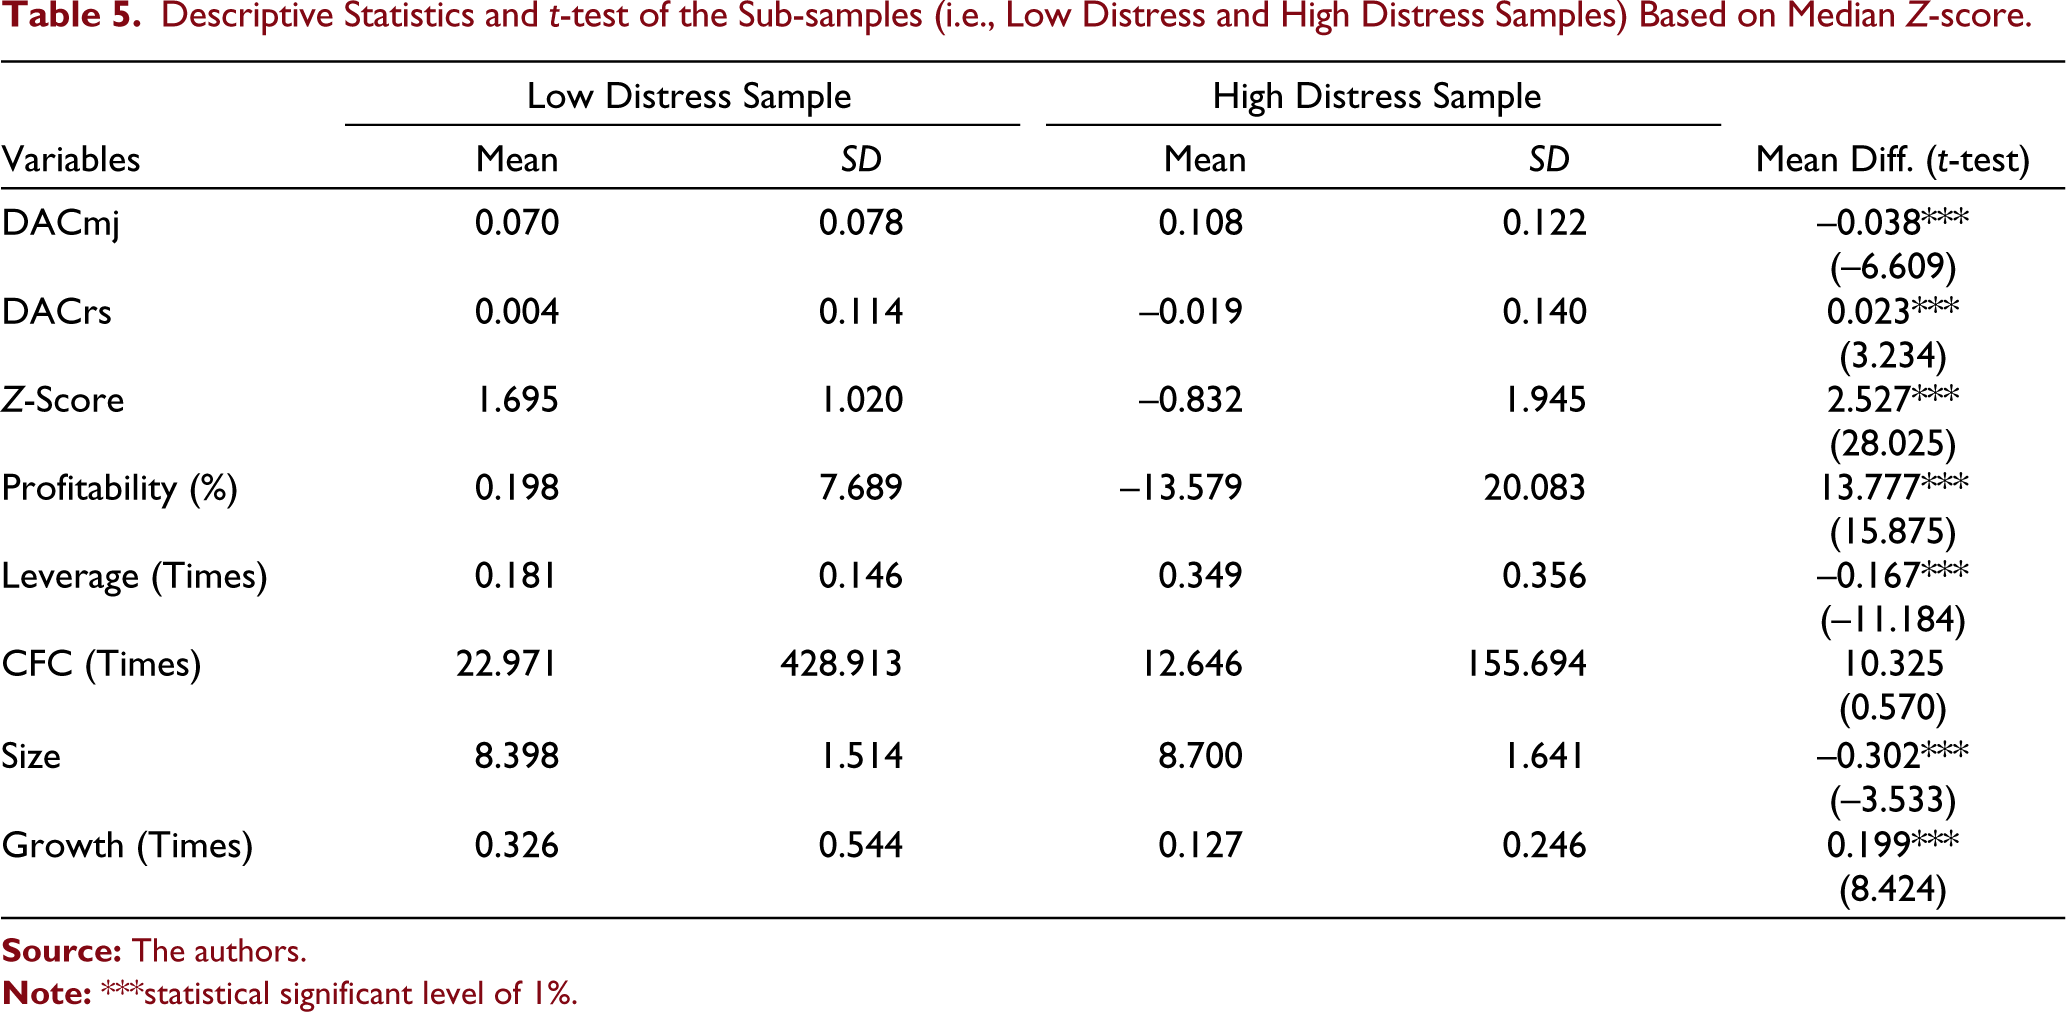
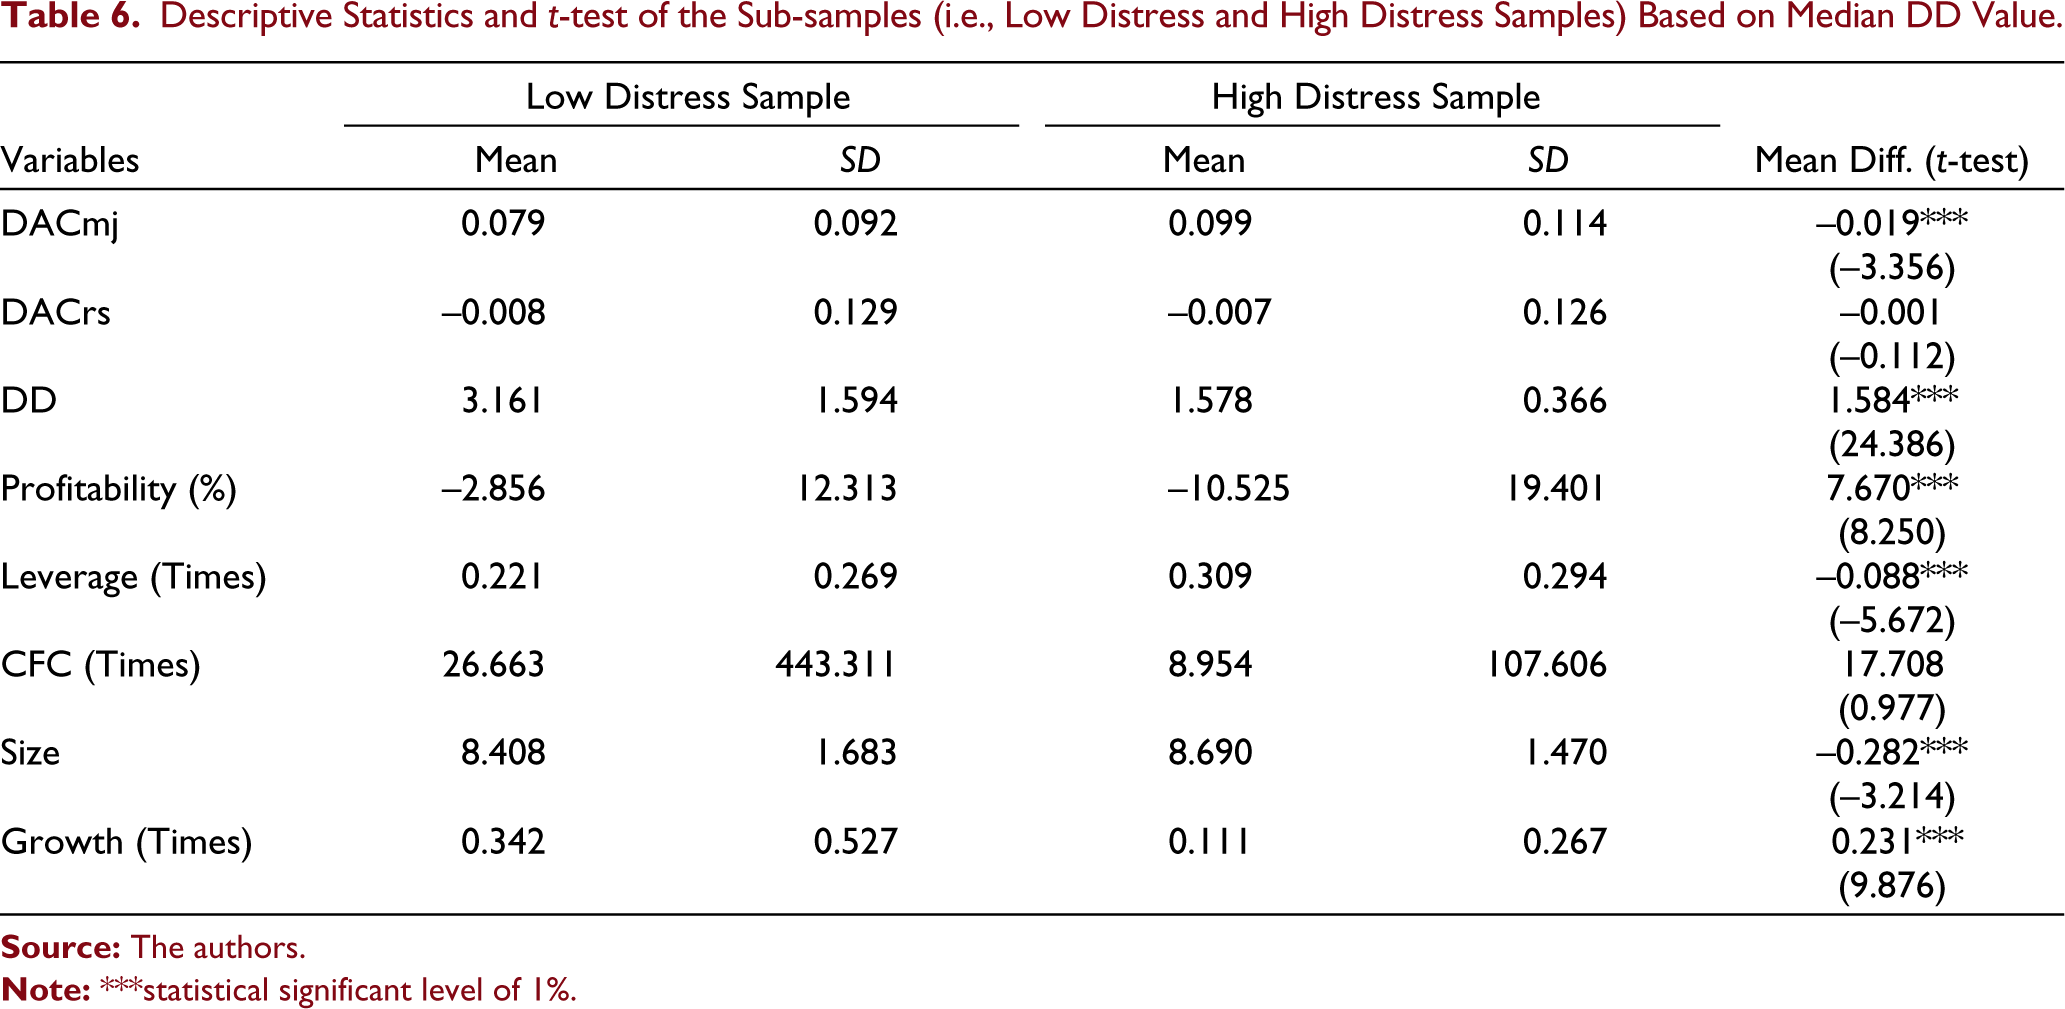
The summary statistics and t-test for mean differences for the variables after classifying the distressed sample into two sub-samples, high distressed and low distressed firms, based on median Z-score and median DD, are portrayed in Tables 5 and 6, respectively. From Table 5, it is evident that DACrs is positive (0.004) for low distressed firms and negative (–0.019) for high distressed firms, and the mean difference is statistically significant at 1% level. Also, the mean difference of Z-score is statistically significant at 1% level, and the mean Z-score is significantly higher for low distressed firms than that of high distressed firms. It implies that low distressed firms indulge in income-inflating earnings management, whereas the high distressed firms adopt income-deflating earnings management. This confirms the findings of Jaggi and Lee (2002). They argued that managers’ use of DAC to distort the earnings figure depends on the intensity of financial distress. It is perceived from Table 6 that mean DACmj is positive for both low distressed (0.079) and high distressed firms (0.099) while mean DACrs is negative for both low distressed (–0.008) and high distressed firms (–0.007). The mean difference for DACmj is statistically significant at 1% level, whereas the mean difference of DACrs is found to be statistically insignificant. The mean DD of low distressed firms is significantly higher (statistically significant at 1% level) than high distressed firms. Table 5 reveals that, on average, firms’ profitability (ROA) is highly negative (–13.579%) for high distressed firms and positive (0.198%) for low distressed firms, which indicates that high distressed firms are suffering high losses. On the other hand, Table 6 discloses that mean ROA is negative for both low distressed (–2.856%) and high distressed (–10.525%) firms. However, the high distressed firms are experiencing higher losses than the low distressed firms. Both Table 5 and Table 6 depict that there exist significant differences in mean for firms’ leverage, size, and growth opportunities for the two sub-samples based on Z-score and DD.
Descriptive Statistics and t-test of the Sub-samples (i.e., Low Distress and High Distress Samples) Based on Median Z-score
Descriptive Statistics and t-test of the Sub-samples (i.e., Low Distress and High Distress Samples) Based on Median DD Value
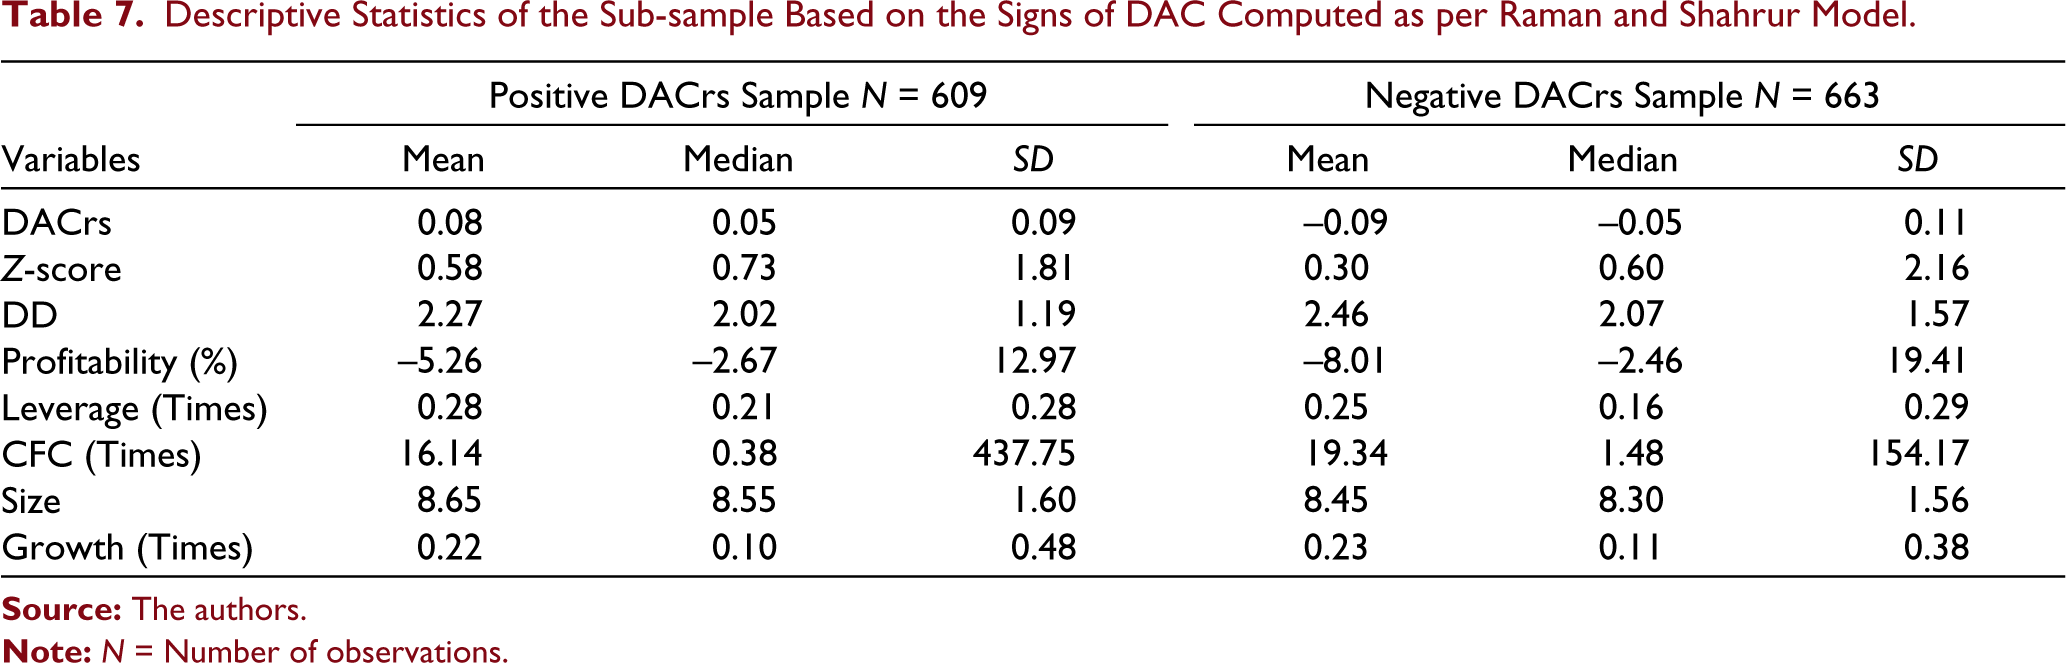
Different signs of DAC manifest dissimilar opportunistic behaviour of the managers. Accordingly, the whole sample is divided into positive DAC and negative DAC based upon the signs of DAC calculated as per Raman and Shahrur model only since DAC value is positive for all the firm-year observations as per the Modified Jones model. The descriptive statistics of the variables after such classification are presented in Table 7. The mean value of the Z-score for positive DACrs firms (0.58) is higher than negative DACrs firms (0.30), whereas the DD of negative DACrs firms (2.46) is slightly higher than positive DACrs firms (2.27). The firms’ profitability, on average, for both the sub-sample is negative, but firms with negative DACrs are suffering higher losses (–8.01%) than firms with positive DACrs (–5.26%). The CFC, on average, is slightly higher for firms with negative DACrs (19.34 times) than positive DACrs (16.14 times). However, both the samples have a high standard deviation for CFC, indicating CFC varies widely across both positive and negative DACrs samples. However, the standard deviation of the positive DACrs sample (437.75) is much higher than the negative DACrs sample (154.17). It is also evident from Table 7 that the mean values of other variables-leverage, size, and growth, for both the samples are close to each other.
Descriptive Statistics of the Sub-sample Based on the Signs of DAC Computed as per Raman and Shahrur Model
Diagnostic Tests
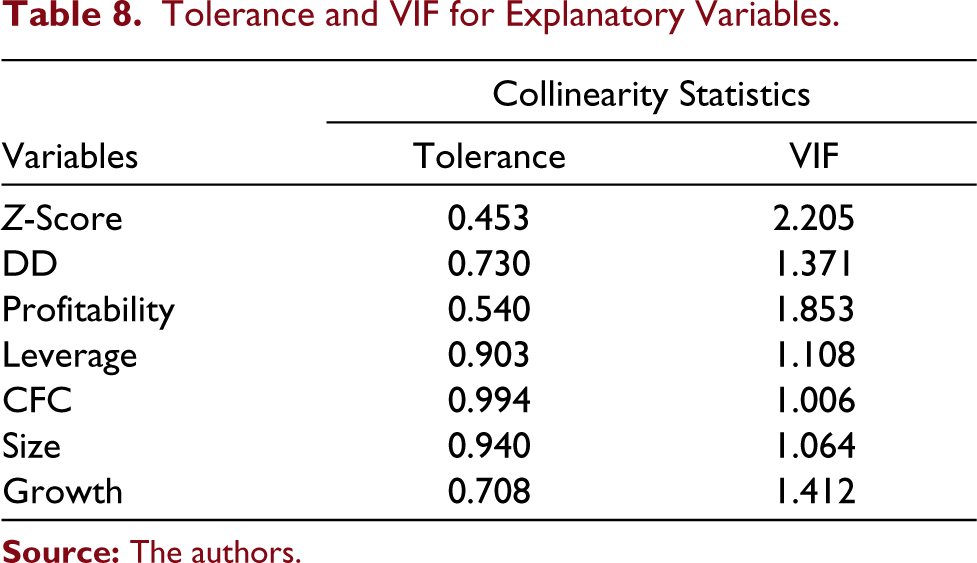
Before proceeding with the regression analysis, the validity of basic assumptions of regression (namely multicollinearity, linearity and homoscedasticity) has been checked. Two statistical tests: Variance inflation factor (VIF) and tolerance are used to address the multicollinearity problem, the results of which are reported in Table 8. From Table 8, it is evident that in the specified regression models, the tolerance values are more than 0.1 (ranging from 0.453 to 0.994), and the VIF values are less than 10 (ranging from 1.006 to 2.205), indicating the absence of a severe multicollinearity problem. To check the problem of heteroskedasticity, White’s test for heteroskedasticity is applied. If the probability (p) values of chi-square are less than 0.05, it signifies that the null hypothesis is rejected, specifying the presence of heteroskedasticity in the residual values. From this test, it is found that p-values against chi-square for all the models are more than 0.05 (unreported), implying that the residuals are not heteroscedastic. Besides, residual plots have been analyzed to examine homoscedasticity and linearity. The results (unreported) depicted that the residuals of the dependent variable showed a generally random pattern and portrayed no pattern of increasing or decreasing residuals. Hence, the assumptions of homoscedasticity and linearity are confirmed.
Tolerance and VIF for Explanatory Variables
Regression Results
Table 9 exhibits the regression results of Models 1 and 2, which use actual Z-score and DD variables, to test H1. In Model 1, the Z-score coefficient (–0.002) is negative, while the DD coefficient (0.001) is positive. However, both the coefficients are not found to be statistically significant. In Model 2, the Z-score coefficient (0.006) is positive, and the DD coefficient (–0.007) is negative, and both the coefficients are statistically significant at 5% level. It signifies a significant positive relationship between Z-score and DACrs and a significant negative relationship between DD and DACrs. Thus, H1, which states that a significant relationship exists between earnings management and financial distress, is accepted for both the distress measures. However, the direction of the relationship is not the same across the distress measures. Firms with higher Z-score values indicate a lower degree of financial distress and indulge in higher earnings management, while firms with lower Z-score are involved in lower earnings management. Thus, showing a negative association between earnings management and financial distress. Alternatively, firms having higher DD values indicate a lower degree of financial distress and indulge in lower earnings management, whereas firms with lower DD value engage in higher earnings management. Thus, indicating a positive association between earnings management and financial distress. The results highlight that the relationship between financial distress and earnings management varies across distress measures.
Regression Results Using Actual Z-score and DD Variables
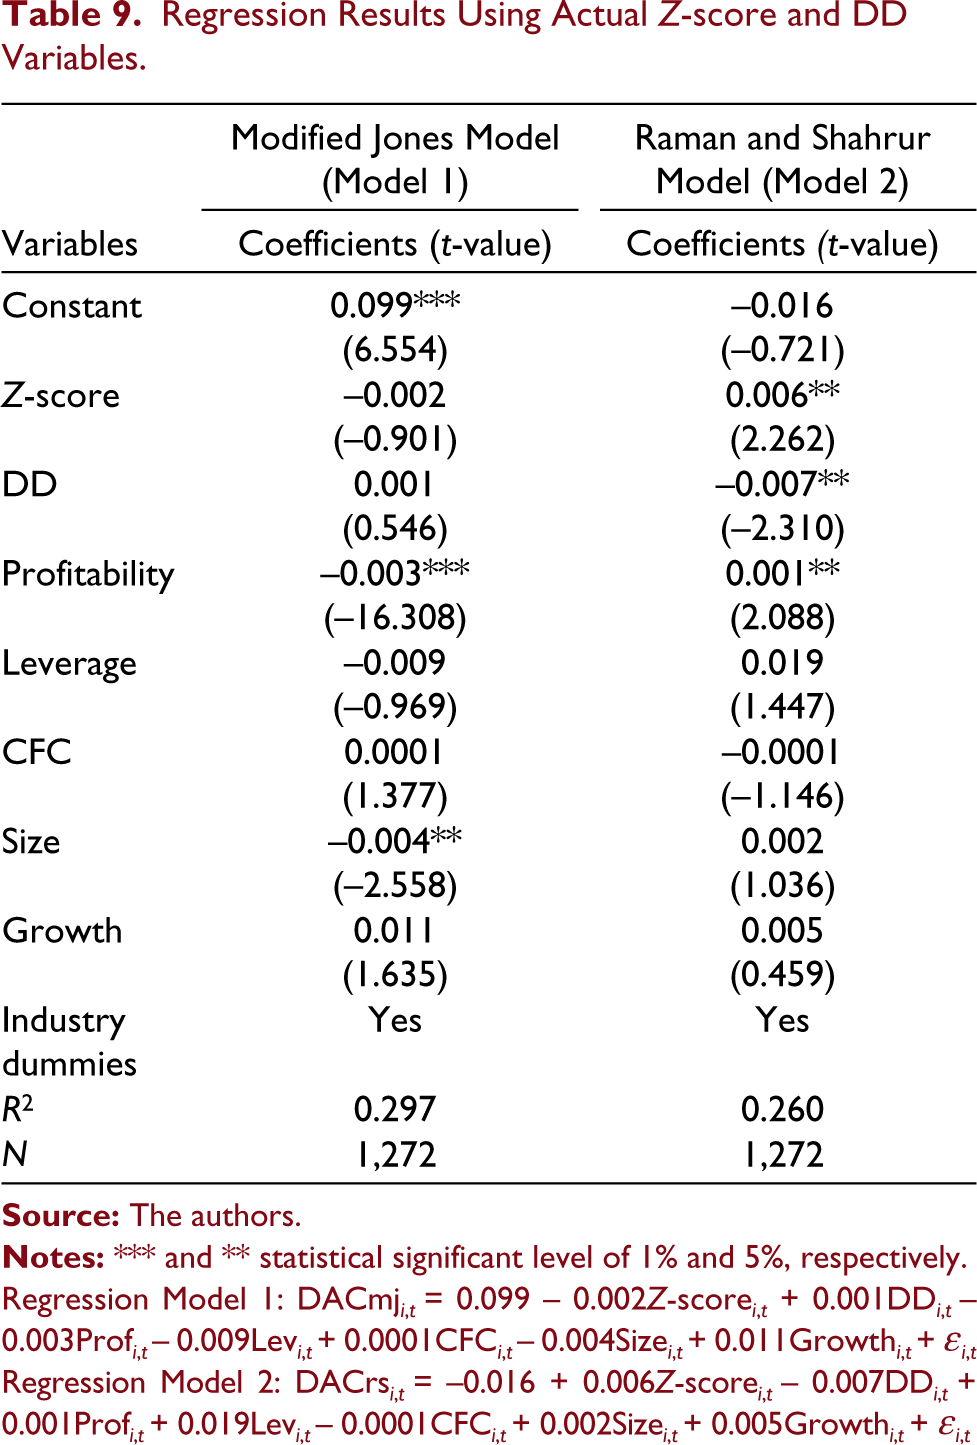
Regression Model 1: DACmj i,t = 0.099 – 0.002Z-score i,t + 0.001DD i,t – 0.003Prof i,t – 0.009Lev i,t + 0.0001CFC i,t – 0.004Size i,t + 0.011Growth i,t + εi,t
Regression Model 2: DACrs i,t = –0.016 + 0.006Z-score i,t – 0.007DD i,t + 0.001Prof i,t + 0.019Lev i,t – 0.0001CFC i,t + 0.002Size i,t + 0.005Growth i,t + εi,t
As for the control variables, firms’ profitability is found to be negatively related with DACmj (–0.003) and positively related with DACrs (0.001), and the coefficients are statistically significant at 1% and 5% levels respectively. The negative association between profitability and DACrs signifies that the managers of firms undergoing better financial performance are not motivated towards managing earnings while firms with poor performance indulge more in earnings management to achieve targeted earnings (Hutchinson et al., 2008). On the other hand, a positive association between profitability and DACrs denotes that profitable firms tend towards earnings management to attain the desired earnings level and gain investors’ confidence. In contrast, less profitable firms prefer to reveal their true financial position to obtain better debt renegotiation terms (Chen et al., 2010). Firm size is negatively associated with DACmj (–0.004) and is statistically significant at 5% level, while it is positively associated with DACrs (0.002) but is statistically insignificant. The negative association between firm size and DACmj implies that large-sized firms have a strong corporate governance structure, high audit quality, better internal control, and concern for reputation loss, hence they are less likely to indulge in earnings management (Campa & Donnelly, 2014). It conveys that earnings management is more pervasive among small-sized firms, while larger firms restrict such managerial activities. From these findings, it can be concluded that the results are not consistent across earnings management measures for both the control variables. However, for other control variables-leverage, CFC, and growth, no statistically significant relationship is found with both DACmj and DACrs. Further, the results show the existence of industry effect on both the measures of DAC. Finally, the R2 values indicate the coefficient of multiple determination for multiple regression. Regression Models 1 and 2 explain 29.7% and 26% of the variability of the response data around the mean respectively. These signify that the goodness of fit of both the models is at an acceptable level.
Table 10 portrays the regression results of Models 3 and 4, which use Z-score_Dummy and DD_Dummy variables to test H2. Z-score_Dummy is positively associated with DACmj (0.005) and DACrs (0.020), and this relationship is statistically significant only for DACrs at 5% level. This signifies that less distressed firms are indulged in higher earnings management than the high distressed firms. Thus, H2 is accepted, which states that the lower (higher) the severity of financial distress, the higher (lower) the earnings management level. Alternatively, the coefficient of DD_Dummy is positive for DACmj (0.001) and negative for DACrs (–0.011), but both the coefficients are found to be statistically insignificant. This result confirms the findings of Jaggi and Lee (2002) who argued that if the distress is temporary, then firms resort to income-inflating earnings management to minimize the possibility of reputation loss, cut in bonus, or job loss and when the distress is severe, they disclose their actual financial position to get better terms in debt renegotiations.
Regression Results Using Z-score_Dummy and DD_Dummy Variables
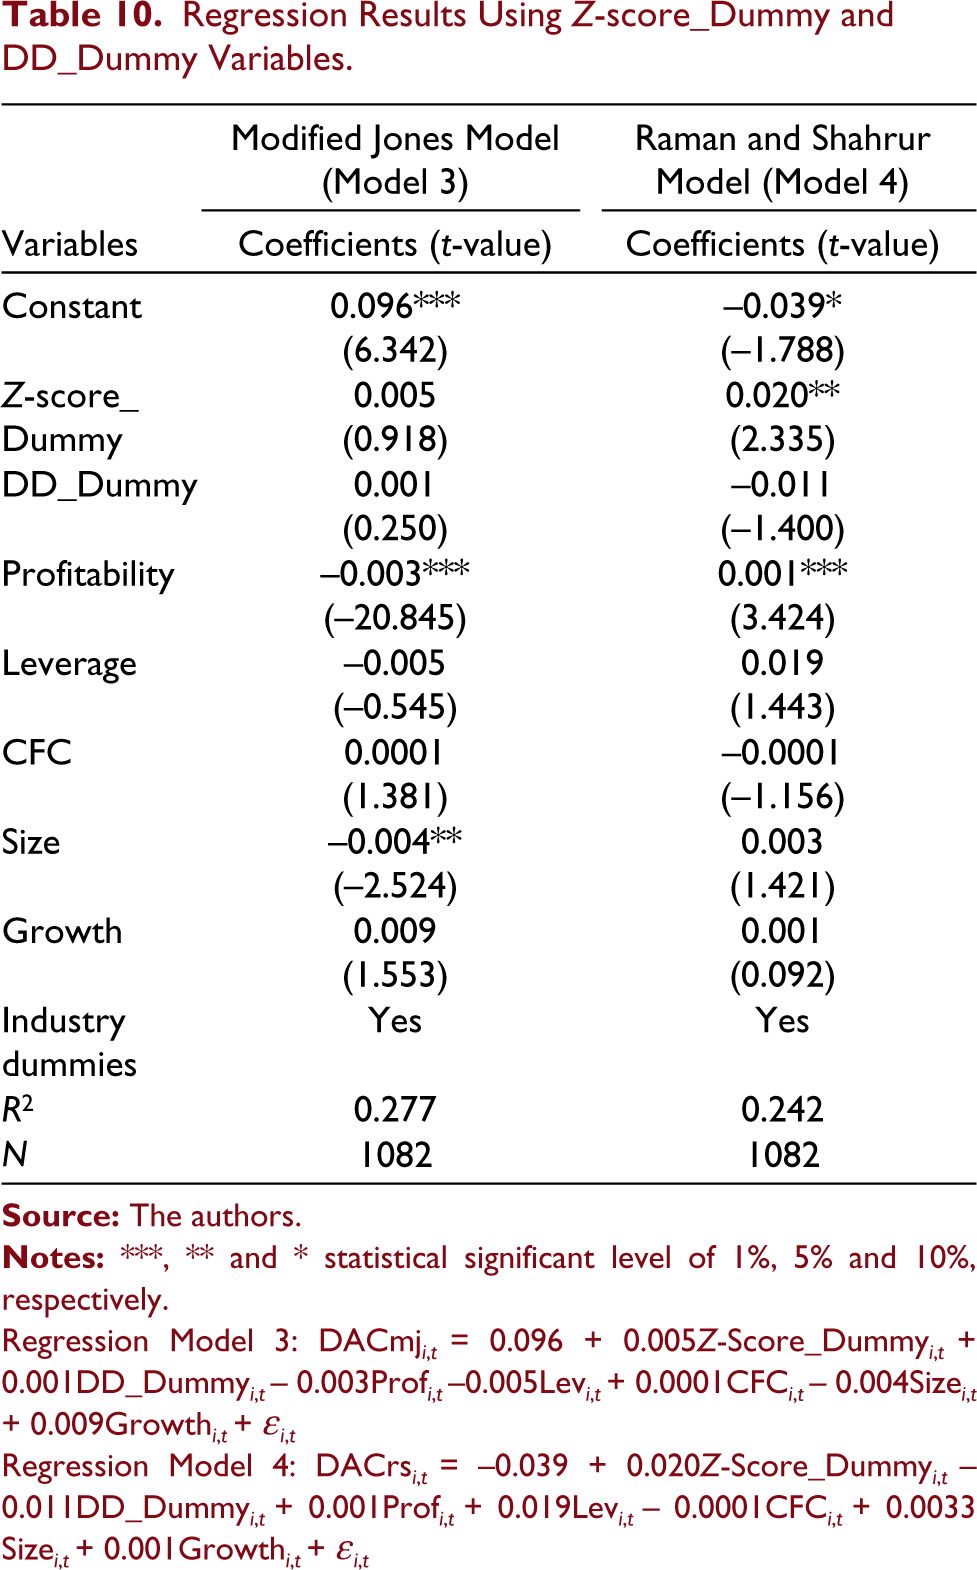
Regression Model 3: DACmj i,t = 0.096 + 0.005Z-Score_Dummy i,t + 0.001DD_Dummy i,t – 0.003Prof i,t –0.005Lev i,t + 0.0001CFC i,t – 0.004Size i,t + 0.009Growth i,t + εi,t
Regression Model 4: DACrs i,t = –0.039 + 0.020Z-Score_Dummy i,t – 0.011DD_Dummy i,t + 0.001Prof i,t + 0.019Lev i,t – 0.0001CFC i,t + 0.0033 Size i,t + 0.001Growth i,t + εi,t
Among the control variables, the results are the same as those of regression Models 1 and 2. Firms’ profitability is negatively associated with DACmj (–0.003) and positively associated with DACrs (0.001), and both the coefficients are statistically significant at 1% level. Similarly, firm size is found to be inversely associated with DACmj (–0.004) and is statistically significant at 5% level, while it is favourably associated with DACrs (0.003) but is statistically insignificant. Again, for the other control variables-leverage, CFC, and growth, no statistically significant relationship is found with DACmj and DACrs. Also, there is a presence of industry effect on both DACmj and DACrs. The R2 values for the regression Model 3 (27.7%) and Model 4 (24.2%) indicate that the goodness of fit of both the models is at an acceptable level.
Table 11 depicts the regression results after classifying the entire sample into two sub-groups, positive DACrs and negative DACrs, based on DAC’s signs computed as per Raman and Shahrur model to test H3. The Z-score coefficients are positive for both positive DACrs (0.0002) and negative DACrs (0.005) but are statistically significant only for negative DACrs at 10% level. This signifies that firms with higher Z-score or low distressed firms are involved more in income-decreasing earnings management, while high distressed firms engage less in income-decreasing earnings management. Hence, H3, which states that low distressed firms are engaged in income-increasing earnings management and high distressed firms are engaged in income-decreasing earnings management, is rejected. Overall the sample firms have a poor financial condition (since it is evident from Table 4 that the average Z-score is very low), so they resort to income-decreasing earnings management (which is also evident from Table 4 that mean DACrs is negative) to portray their true financial position. As per DeAngelo et al. (1994) and Jaggi and Lee (2002), firms experiencing severe distress use negative DAC to reveal their financial difficulties to obtain government support and renegotiate debt contracts. DD value is found to be positively associated with positive DACrs (0.002) and negatively associated with negative DACrs (–0.002), but both the coefficients are not found to be statistically significant.
Regression Results After Classifying the Entire Sample Based on the Signs of DACrs
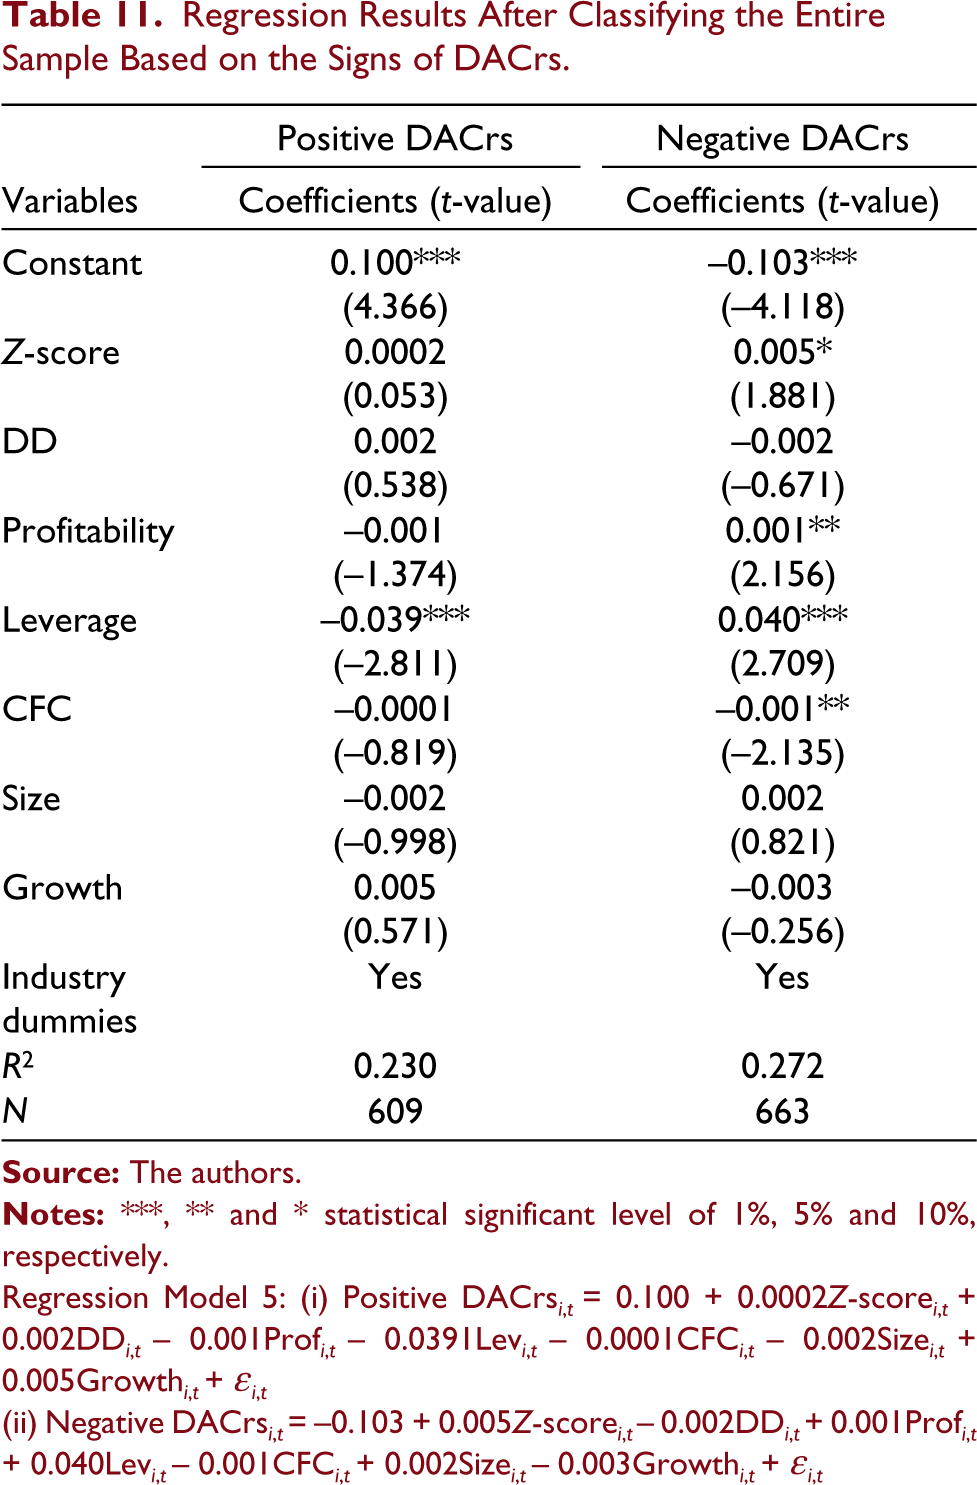
Regression Model 5: (i) Positive DACrs i,t = 0.100 + 0.0002Z-score i,t + 0.002DD i,t – 0.001Prof i,t – 0.0391Lev i,t – 0.0001CFC i,t – 0.002Size i,t + 0.005Growth i,t + εi,t
(ii) Negative DACrs i,t = –0.103 + 0.005Z-score i,t – 0.002DD i,t + 0.001Prof i,t + 0.040Lev i,t – 0.001CFC i,t + 0.002Size i,t – 0.003Growth i,t + εi,t
Among the control variables, firms’ profitability is negatively associated with positive DACrs (–0.001) and positively associated with negative DACrs (0.001), and this relationship is statistically significant only for negative DACrs at 5% level. It implies that profitable firms involve more in income-decreasing earnings management, while less profitable firms involve less in income-decreasing earnings management. For leverage, the coefficients are negative for positive DACrs (–0.039) and positive for negative DACrs (0.040), and both are statistically significant at 1% level. It signifies that high leveraged firms involve less in upward earnings management and more in downward earnings management while low leveraged firms engage more in upward earnings management and less in downward earnings management. The firms’ CFC is negatively associated with both positive DACrs (–0.0001) and negative DACrs (–0.001), but the relationship is statistically significant only for negative DACrs at 5% level. It denotes that firms with high CFC involve less in income-decreasing earnings management, while firms with low CFC involve more in income-decreasing earnings management. However, no significant association is found for firm size and growth with both positive and negative DACrs. Further, the results show the existence of industry effects on both positive and negative DACrs. The R2 value for the regression model with positive DACrs as dependent variable is 23%, while the R2 value for the regression model with negative DACrs as dependent variable is 27.2%. Both the values indicate that the goodness of fit of both the models is at an acceptable level.
From the above findings, it can be concluded that the relationship between earnings management and financial distress is not consistent across both earnings management and distress measures. Among earnings management measures, no significant relationship is found between financial distress and DACmj. For the distress measures, the results derived for Z-score support H1 and H2 and reject only H3. While the results derived for DD support only H1 and no statistically significant results are found for other hypotheses. The computation of DD is mainly based on the volatility of firms’ equity and market value of equity. The Indian capital market is inefficient, and share price fluctuates widely, so there exists inconsistency in DD values. Hence, the results for DD are mostly found to be insignificant. Therefore, the Z-score model can be considered more appropriate in the Indian context, while the DD measure would be more appropriate for countries with an efficient capital market.
Managerial and Practical Implications
This paper examines the relationship between earnings management and financial distress and considers whether this relationship varies based on the severity of financial distress and signs of DAC, which is considered a proxy for earnings management. The empirical analysis of the sample firms presents that DACrs have a significant positive relationship with Z-score and a significantly negative relationship with DD. Firms with a higher Z-score indicate a lower degree of financial distress and tend to involve more in earnings management. In comparison, firms with lower Z-score involve less in earnings management. Alternatively, firms with a higher DD indicate a lower degree of financial distress and indulge less in earnings management, while firms with lower DD engage more in earnings management. For Z-score_Dummy, a positive and significant association is found with DACrs, specifying that less distressed firms are involved in higher earnings management than the high distressed firms. While for DACmj, no concrete relationship is found with both the measures of financial distress and also with Z-score_Dummy and DD_Dummy since the coefficients are statistically insignificant. Also, DD_Dummy is insignificantly related to DACrs. Moreover, after dividing the entire sample based on the signs of DACrs, a significant positive relationship is found between Z-score and negative DACrs. It signifies that firms with higher Z-score or low distressed firms involve more in income-decreasing earnings management while high distressed firms engage less in income-decreasing earnings management. However, Z-score has no significant association with positive DACrs. Also, DD is insignificantly related to both positive and negative DACrs. These findings are partly in line with some of the prior studies.
These findings have significant implications for both current and prospective investors, lenders, managers, regulators, and policymakers who are responsible for monitoring the quality of financial reporting. Based on the severity of financial distress, the managers’ incentive for using DAC to manage the reported earnings may vary. Even the firms with lower intensity of financial distress may indulge in earnings management to conceal their true financial position, making it difficult for investors and creditors to understand their actual financial conditions. Therefore, careful attention is required while evaluating the creditworthiness of a firm. It will also help the managers of the distressed firms to improve their understanding regarding the probable repercussions of accounting choices made by them to manage the reported earnings. The findings will be useful to regulators and policymakers for designing suitable policies to ensure proper auditing and safeguard the quality of financial reporting which may reduce earnings management in firms.
Limitations and Future Scope of Research
This study assumes that firms that obtained a ‘D’ rating by the credit rating agency(s) are financially distressed, and based on this measure, the initial sample has been formed. However, different other parameters exist to judge whether a firm is financially distressed. This can be considered as a limitation of the study. However, the study uses Z-score and Distance-to-default (DD) measures to measure the degree of financial distress of sample firms for further analysis. Also, there is a linkage between financial distress and bankruptcy. A financially distressed firm may or may not go bankrupt in the future. Whether the sample firms are prone to bankruptcy is a separate question, which may be explored in separate studies. This is another limitation of this study. This study has mainly focused on the earnings management practices of financially distressed firms. Future research can be carried out in this field considering both accrual- and real activity-based earnings management as well as classification shifting-based earnings management. Studies can also use a larger sample size both in Indian and global contexts.
Footnotes
Declaration of Conflicting Interests
The authors declared no potential conflicts of interest with respect to the research, authorship and/or publication of this article.
Funding
The authors received no financial support for the research, authorship and/or publication of this article.