






Abstract
This study examines the interrelationship between capital adequacy ratio (CAR), profitability and other bank-specific and macroeconomic variables in Indian banks using a simultaneous equations framework. By disaggregating the sample into public, private and foreign banks, the analysis uncovers both commonalities and key differences in how these variables interact across ownership types. The findings challenge previous results observed at the aggregate level—for instance, the previously reported positive association between non-performing assets (NPAs) and CAR is not observed in any bank group. Our results challenge prior aggregate-level findings, as the purported positive association between NPAs and CAR does not hold for any bank group. These insights contribute to a more nuanced understanding of capital–profitability dynamics in a diverse banking system.
Keywords
Introduction
According to the financial intermediation theory, banks perform maturity transformation by accepting short-term deposits and extending long-term loans (as cited by Werner, 2016), exposing them to credit, liquidity and interest rate risks. To safeguard stability, regulators mandate a minimum level of regulatory capital—the capital adequacy ratio (CAR)—which represents the ratio of a bank’s capital to its risk-weighted assets (RWA). Under Basel III, banks must maintain a CAR of at least 8% plus a 2.5% capital conservation buffer, with additional countercyclical buffers for systemically important institutions (BCBS, 2020). While higher CAR requirements enhance solvency and strengthen systemic resilience (Rasyid et al., 2022), they may reduce profitability by constraining leverage and credit expansion (Berger & Bouwman, 2013). Conversely, higher profitability can strengthen CAR through retained earnings (Das & Rout, 2020), while losses erode equity and reduce CAR, potentially requiring recapitalization—a process fraught with moral hazard as banks tend to invest new capital in risky assets (Marisetty & Shoeb, 2024).
This bidirectional tension between profitability and capital adequacy lies at the core of modern banking stability debates. Recent evidence underscores that banks often engage in regulatory arbitrage—optimizing RWA to meet capital requirements without necessarily reducing true risk (Liu & Shim, 2024)—a practice regulators seek to prohibit (Rao, 2024, p. 7). Such behaviour complicates the relationship between CAR and profitability, which varies across jurisdictions, regulatory regimes and ownership structures.
Empirical findings remain inconclusive. Studies have alternately documented a positive (Aktas et al., 2015, Almaskati, 2022, Berger & Bouwman, 2013; O’Connell, 2023), negative (Alnajjar & Othman, 2021; Indriani et al., 2020) or neutral (Ercegovac et al., 2020) association between capital adequacy and profitability, suggesting that contextual factors—such as governance, risk appetite and market competition—play critical roles. Recent evidence from emerging economies (Abu Snobar & Al Hanini, 2025; Dao & Nguyen, 2020; Qehaja-Keka et al., 2023) further highlights heterogeneity driven by institutional differences and regulatory reforms.
In India, this relationship is particularly complex due to the coexistence of public sector banks (PSBs), private banks (PVBs) and foreign banks (FBs)—each operating under distinct governance, policy and market structures. PSBs often balance commercial and developmental objectives; PVBs are market-driven; and FBs typically target niche, high-margin segments. Moreover, technological innovation, changing preferences of consumers and availability of alternative business models have transformed the landscape of the Indian banking sector in the last decade (Das, 2024). Although previous Indian studies (Chaudhary & Kumar, 2023; Das & Rout, 2020; Singh, 2021) have explored aspects of bank performance, they either miss to incorporate the reforms, such as the Asset Quality Review (AQR), demonetization and the Goods and Services Tax (GST), or do not measure bi-directionality. These structural events have reshaped the Indian banking landscape, influencing profitability and capital management dynamics (Marisetty & Shoeb, 2024). Moreover, prior studies often treat banks as a homogeneous group, overlooking ownership-specific heterogeneity that may drive divergent capital and profitability behaviour (Bandyopadhyay, 2022).
This study addresses these limitations by:
employing a simultaneous-equation model (2SLS) to capture the bidirectional relationship between CAR and ROA, mitigating endogeneity; analysing a comprehensive data set from 2005 to 2024, encompassing major policy and structural shifts; and disaggregating results by ownership (PSBs, PVBs, FBs) to uncover institutional asymmetries in capital–profitability linkages.
Accordingly, this study poses two research questions:
RQ1: What are the key bank-specific and macroeconomic determinants of profitability (ROA) and capital adequacy (CAR), and how does their interdependence vary across public, private and FBs in India? RQ2: Did the relationship between ROA, CAR and other determinants change following the 2014 regime and subsequent regulatory reforms?
In preview, our results reveal substantial heterogeneity across ownership types: while profitability supports capital strengthening among PVBs, PSBs rely on external recapitalization and FBs exhibit risk-optimizing behaviour. These findings contribute to the theoretical understanding of ownership-contingent capital management and offer policy insights for capital regulation and macroprudential supervision in emerging markets.
The remainder of this article is structured as follows: The second section surveys the existing literature. The third section describes the empirical strategy followed to address the research questions. The fourth section presents and discusses the results, and the fifth section offers the conclusion.
Theoretical Underpinning and Review of Literature
Capital Adequacy and the Stability: Profitability Trade-off
Banks are required to maintain sufficient capital to absorb unexpected losses and safeguard systemic stability. The CAR serves as a crucial cushion against potential losses arising from various risks, thereby ensuring financial stability and protecting depositors’ interests (Fibriyanti & Nurcholidah, 2021; Rasyid et al., 2022). From a regulatory perspective, higher capital enhances resilience, whereas banks often perceive elevated capital requirements as constraining profitability and lending capacity. This divergence reflects the fundamental trade-off between prudential stability and profit maximization. When a bank’s CAR falls below the regulatory threshold, it is considered under distress, increasing the likelihood of systemic spillover (Acharya, 2009; Brownlees & Engle, 2017). Thus, theory predicts an inherently bidirectional relationship between capital adequacy and profitability, shaped by risk-taking incentives, regulatory constraints and market discipline.
Regulatory Reform and Capital Requirements
In response to the global financial crisis (GFC), regulators tightened capital norms under Basel III, effectively raising minimum requirements to 10.5% through the introduction of a 2.5% capital conservation buffer (BCBS, 2020). These reforms aimed to curb excessive risk-taking and improve banks’ loss-absorbing capacity. However, empirical evidence on the effectiveness and consequences of higher capital requirements remains mixed. Li et al. (2016) showed that most Taiwanese banks already exceeded Basel III thresholds, whereas Kartal (2019) reported that Turkish banks maintained unusually high CARs—around 19%. In the United States, Berger et al. (2008) demonstrated that high pre-crisis capitalization was not sufficient to shield banks from severe post-crisis losses, as mispriced risk-taking undermined the effectiveness of capital buffers. Similarly, Liu and Shim (2024) demonstrated that Chinese banks used off-balance-sheet or ‘shadow-loan’ channels to window-dress their capital positions.
Cross-country Evidence on CAR and Bank Performance
Cross-country findings remain equally inconsistent. Aktas et al. (2015) observed that profitability, liquidity and net interest margins increase CAR in Southeastern Europe, while leverage and size exert the opposite effect. In Vietnam, H. P. Nguyen (2019) reported a positive CAR–ROA relationship, but T. H. Nguyen (2020) showed this relationship holds good only for small banks. Abu Snobar and Al Hanini (2025) documented a similar positive association in Jordan, whereas Indriani et al. (2020) and Alnajjar and Othman (2021) identified negative effects in Indonesian and MENA banks, respectively. These contrasting results suggest that institutional quality, regulatory enforcement and banking structure critically mediate the capital–profitability nexus.
Evidence from India and the Role of Ownership Structure
The Indian banking system provides a particularly relevant context for examining these dynamics. The Reserve Bank of India (RBI) imposes a higher prudential standard than the Basel III minimum, requiring banks to maintain a CAR of 9% plus a 2.5% capital conservation buffer, resulting in an effective regulatory threshold of 11.5% (RBI, 2010, p. 253; 2021). This stricter standard reflects the RBI’s emphasis on resilience amid persistent credit-risk and asset-quality pressures.
India’s financial architecture comprises PSBs, PVBs and FBs—each with distinct governance frameworks and risk appetites. PSBs often implement government credit programmes and social-policy objectives that may constrain profitability and risk flexibility; PVBs operate under market discipline with efficiency-driven incentives; and FBs, though smaller in scale, typically maintain higher capital ratios. This structural heterogeneity suggests that the determinants of CAR and profitability are unlikely to be uniform across ownership types, underscoring the need for a disaggregated analytical approach.
Empirical evidence from India remains inconclusive. Das and Rout (2020) found a positive relationship between CAR and profitability as well as between CAR and non-performing assets (NPAs), implying that banks with higher capital may assume greater risk—a finding contrary to most global evidence. Similarly, Singh (2021) observed that CAR correlates positively with GDP growth but negatively with inflation, while Chaudhary and Kumar (2023) identified NPAs as a primary determinant of profitability. Such heterogeneity indicates that institutional structure, governance quality and regulatory stringency crucially shape the direction and strength of the CAR–profitability nexus. Marisetty and Shoeb (2024) further showed that although capital infusion into PSBs restored solvency, it also generated moral-hazard incentives that encouraged renewed risk-taking even outside crisis periods. Nevertheless, recapitalization can temporarily boost market capitalization and profitability (Bandyopadhyay, 2022), illustrating the inherent trade-off between prudential stability and profit maximization.
Research Gaps
Despite extensive literature, several gaps persist. First, ownership-specific dynamics among PSBs, PVBs and FBs have rarely been examined in a unified empirical framework. Second, most Indian studies rely on single-equation models that fail to account for endogeneity and bidirectional causality between CAR and profitability. Third, existing analyses largely overlook the post-2014 reform period, which includes the AQR, demonetization, GST implementation and the COVID-19 shock—events that significantly reshaped banks’ balance sheets and capital strategies (Chaudhary & Kumar, 2023; Das & Rout, 2020; Singh, 2021).
To bridge these gaps, the present study applies a 2SLS framework to panel data from 2005 to 2024, explicitly disaggregating banks by ownership type. This approach enables identification of how profitability, asset quality and macroeconomic conditions jointly determine capital adequacy—and how this interdependence has evolved in India’s post-reform period.
Empirical Strategy
Research Philosophy and Research Design
This study assumes that relationships among economic and financial variables can be objectively measured and statistically tested. Empirical evidence derived from observed data forms the basis for validating or refuting theoretical propositions.
In line with this philosophy, the study employs a quantitative and explanatory research design. The design focuses on identifying determinants and directionality within the CAR–profitability nexus while controlling for macroeconomic and bank-specific factors. The quantitative approach enables reproducibility using secondary data from the RBI’s Database on the Indian Economy.
The explanatory nature of the design allows us to explore causal relationships through econometric modelling. Specifically, a simultaneous equation model estimated via the two-stage least squares (2SLS) method addresses potential endogeneity between CAR and ROA. This design is consistent with established practices in empirical banking research and ensures the robustness of causal inference.
Data and Variable Construction
The data are collected from the RBI’s Database on Indian Economy—a highly reliable source of information on Indian banks. The data set constitutes an unbalanced panel of 46 scheduled commercial banks comprising 21 PSBs, 18 private sector banks (PVBs) and 7 FBs from 2005 to 2024 (the latest year for which data are available). This panel structure enables the study to exploit both cross-sectional and temporal variation in capital adequacy and profitability. The study also includes the six PSBs whose mergers came into effect on 1 April 2020. A list of all the banks, along with the acronyms used in the study, is provided in the Appendix. Merged banks are suffixed with ‘_M’. Small finance banks and payment banks are excluded, as the regulatory requirements are not the same as those for commercial banks in India. Additionally, banks with extreme values are also excluded to avoid distortion of result. The study also excludes Tobin’s Q and other market ratios due to the absence of listings for all banks involved. The selection of variables is guided by the existing literature and a comprehensive understanding of the banking business with the aim of identifying the determinants of CAR and profitability.
To examine whether the relationship between CAR and profitability varies across PVBs, PSBs and FBs, two dummy variables representing bank ownership types are added. Additionally, a time dummy variable is also introduced to assess whether the relationship changed after 2015, following the regime change in mid-2014 and a series of structural reforms initiated thereafter. The following variables have been used in the study:
GDP (at constant price) and inflation numbers are taken from the RBI’s website. Since the data set spans 2005–2024, it covers the base year revision introduced in 2015, when the constant price series was shifted from 2004–2005 to 2011–2012 as the base year.
DumEntity1 = 1 for PVBs, 0 for the rest
DumEntity2 = 1 for FBs, 0 for the rest
Dum_t = 1 after 2014, 0 on or before 2014
Exploratory Data Analysis
To examine how the variables evolve over time, CAR, ROA (a proxy for banks’ profitability) and other bank-specific indicators are plotted. Figure 1 illustrates the trends in CAR for each bank. The observations suggest that PSBs maintain the lowest CAR, followed by PVBs and FBs, which also show considerable variability. A slight increase in CAR is evident after 2008, coinciding with the introduction of Basel II requirements and the GFC. It also highlights that CAR has been the lowest between 2014 and 2018, possibly showing the impact of the rise in NPAs due to AQR, especially in the PSBs. The figure also indicates that, at times, some banks’ CARs fell below 10%. In contrast, after 2020, CAR has exhibited a steady upward trend across all banks, coinciding with the phased implementation of Basel III requirements, which were scheduled for full adoption in India in 2019 (RBI, 2014). However, the final tranche of the 0.625% capital conservation buffer was deferred and implemented only on 1 October 2021 (RBI, 2021). It is also noteworthy that FBs in India operate on a relatively smaller scale, typically through a limited branch network. Despite this, they consistently maintain CARs at an optimal level, suggesting greater efficiency in capital management.
Figure 2 presents the evolution of average CAR, ROA and NPAs over time for PSBs, PVBs and FBs. The plots highlight key differences in performance trajectories among bank groups, offering a visual overview of how capital adequacy and asset quality have evolved over time. It indicates that the average ROA for both PVBs and FBs remained relatively stable throughout the study period, with an exception of a modest decline for PVBs between 2015 and 2020. In contrast, PSBs experienced a much sharper decline in ROA, coinciding with a rise in their NPAs. NPAs have been increasing for both PSBs and PVBs since the GFC, but the increase was particularly pronounced for PSBs, especially after 2015, when the RBI initiated the AQR. The NPAs for PSBs peaked at 10% in 2018. The AQR compelled banks to recognize and report previously unacknowledged bad loans (Kaul, 2020). The surge in NPAs had a visible impact on CAR, particularly for PSBs and PVBs. While the PVBs continued to maintain CAR comfortably above the regulatory minimum despite rising NPAs, several PSBs experienced sharp reductions, prompting government-led recapitalization measures.
To better understand this relationship, Figure 3 plots CAR against NPAs at the bank level. The scales are adjusted at the entity level for more clarity. The results clearly highlight that the negative relationship between rising NPAs and declining CAR is more pronounced for PSBs. By contrast, PVBs and FBs generally maintain higher CARs relative to PSBs. Moreover, FBs sustain higher CARs and manage to contain their NPAs, making them appear relatively safer. Although Figure 2 shows that the average CAR across banks remained above 10%, Figure 3 reveals that some banks struggled to maintain the RBI’s minimum regulatory requirement of 9%.


To complement these visual trends, Tables 1 and 2 reports descriptive statistics for the main variables. The summary provides a quantitative snapshot of the distribution, highlighting the variation in capital, profitability and risk exposures across bank. Table 1 presents the descriptive statistics of the entire data set, comprising 828 observations across 46 banks. The average value of CAR is 14.4%, which is well above the regulatory minimum in India of 9–1 percentage point higher than the BCBS requirement—plus an additional buffer of 2.5%, resulting in an effective benchmark of 11.5%. This figure indicates that, on average, Indian banks uphold a strong capital buffer, reflecting a generally robust financial position (Alnajjar & Othman, 2021). However, as discussed further below, PVBs and FBs tend to maintain significantly more capital than required, and their disproportionately high CARs can slightly overstate the average when all banks are given equal weight. Similarly, gross NPAs to advances have a mean of 5.2%, which does not appear very high and fails to indicate the poor management of advances by Indian PSBs that were highlighted by AQR. However, a large standard deviation in NPAs highlights greater variability among the banks.
Descriptive Statistics at the Total Level.

Table 2 breaks down the descriptive statistics by bank ownership type: PSBs, PVBs and FBs. It reveals that the average CAR is more than 15.5% for FBs and PVBs, while for PSBs, it is at 12.7%. Additionally, FBs generally have smaller asset bases, while PSBs operate with substantially larger asset sizes. The standard deviation for CAR among PVBs is 4.8%, higher than that of FBs (3.2%) and PSBs (1.9%), highlighting the greater heterogeneity within PVBs.
Descriptive Statistics: Bank Category-wise Breakup.

Total assets are in crores (₹).
Similarly, the loans-to-total-assets ratio averages around 60% for both PVBs and PSBs, with a standard deviation of 5%. In contrast, FBs maintain a much lower ratio of 38%, accompanied by a larger standard deviation of 10%, reflecting their more conservative approach to lending in the Indian market. While the mean NPA-to-advances ratio is almost identical for FBs and PVBs (3.3% and 3.4%, respectively), PSBs show much higher NPAs at 7.3% when averaged across the period, indicating greater exposure to credit risk relative to their asset base.
These NPA figures paint a concerning picture of the Indian banking system, particularly highlighting the fragility of the PSBs. This situation is exacerbated by the fact that PSBs have historically struggled with asset quality, a challenge intensified by their lower profitability and efficiency compared to private and foreign counterparts. This increasing trend in NPAs for PSBs correlates negatively with their profitability, as evidenced by a decline in their ROA (Gaur & Mohapatra, 2021).
The mean value of NII_II is 31.5% for FBs, whereas it is much lower for PSBs and PVBs at 13.3% and 16.4%, respectively. This indicates FBs’ greater reliance on trading and fee-based income. The negative minimum value for FBs further suggests that trading activities can lead to losses and therefore do not necessarily contribute to a higher ROA. The non-interest income to interest income ratio that represents diversification shows that FBs rely more on dive. The credit-to-deposit ratio, reflecting a bank’s ability to convert deposits into loans, averages about 77% for PVBs and FBs, indicating a relatively more aggressive lending stance, whereas PSBs maintain a lower ratio of around 70%, consistent with their more conservative liquidity management. However, a greater standard deviation of 26% among the FBs shows greater variability in their lending behaviour. In summary, the descriptive analysis underscores clear ownership-specific patterns: PSBs struggle with persistently higher NPAs and weaker profitability, partly cushioned by government recapitalization; PVBs display greater variability, reflecting market-driven discipline and strategic differences; and FBs, despite their smaller scale, consistently maintain stronger capital ratios and lower NPAs. These contrasting profiles justify the need for disaggregated analysis, as pooled estimates risk masking crucial heterogeneity across bank types.
Model Specification
The established interdependence between CAR and profitability as documented in the existing literature suggests the existence of a two-way causal relationship that works as a feedback loop. In such cases, simultaneous equations are employed that jointly estimate endogenous and exogenous variables (Studenmund, 2014; Wooldridge, 2010).
Endogeneity is said to exist if an independent variable exhibits a correlation with the error terms. If endogeneity is found, ordinary least square (OLS) estimates become biased and inconsistent due to simultaneous bias. The issue can be corrected using the two-stage least squares (2SLS) method. In the first stage, the endogenous variable is regressed with instrumental variables (IV)—variables that are highly correlated with the endogenous regressor but uncorrelated with the error term—to obtain its predicted (fitted) values. In the second stage, these predicted values are substituted for the original endogenous variable in the structural equation to produce consistent estimates. Thus, the effectiveness of the 2SLS method hinges on the correct identification of strong and valid instruments. While the data set has a panel structure, firm and time fixed effects are not directly applied in the 2SLS estimation because the presence of endogenous regressors and instrumental variables makes within transformation inconsistent (Wooldridge, 2010).
To test for endogeneity, the Wu–Hausman test is conducted, which compares the consistency of the OLS and instrumental variable (IV) estimators. Under the null hypothesis, the OLS estimator is both consistent and efficient, implying the absence of endogeneity. Rejection of the null indicates that at least one explanatory variable is endogenous, necessitating the use of an instrumental variable approach such as 2SLS.
If the Wu–Hausman test indicates the endogeneity of an independent variable, it becomes necessary to ensure the instrument’s strength and validity using the F-test for instrument strength and the Sargan or J-test for overidentifying restrictions. To address the concern of weak instruments, limited information maximum likelihood and Fuller (1) estimators are employed, both of which are more robust to weak instruments. The results from these alternative estimators validate the reliability of the main 2SLS estimate.
The study uses the following two simultaneous equations, where ROA and CAR are treated as endogenous variables—ROA in Equation (1) and CAR in Equation (2). When estimating CAR (Equation (1)), ROA is treated as an endogenous variable via Equation (2). Conversely, when estimating ROA (Equation (2)), CAR is treated as the endogenous variable via Equation (1). This helps us in addressing RQ1, which focuses on identifying the individual determinants of each variable within the system.
Equations (1) and (2) examine the interdependence between CAR and ROA incorporating both bank-specific and macroeconomic variables. Here, β denotes the estimated coefficients, while subscripts i and t represent bank i and year t, respectively. Each construct is grounded in banking theory and prior empirical evidence, as outlined below.
ROA: Included as the core explanatory variable in the CAR equation. Higher profitability allows banks to internally generate capital through retained earnings. However, the relationship may differ across ownership types depending on dividend policy, government support and risk appetite.
CAR: Included as the core explanatory variable in the ROA equation. CAR reflects a bank’s overall solvency and capacity to absorb financial shocks. A higher CAR is generally associated with greater stability and lower default risk, though it may also limit profitability by constraining leverage and risk-taking opportunities.
CREDITG (Credit_Growth): Reflects expansion in loan portfolios. Rapid credit growth often signals increased risk exposure (Berger & Udell, 2004), which can negatively affect both profitability and capital adequacy if not matched with sound risk management.
Size (Log of total assets): Larger banks may enjoy better access to capital markets and diversification benefits (Berger & Bouwman, 2013) but may also operate with thinner capital buffers due to perceived regulatory protection.
NPA_A (Gross NPA to advances): Indicates asset quality and credit risk. Higher NPAs require provisioning, which reduces capital adequacy and profitability (Das & Ghosh, 2006). It also signals inefficient credit management, especially among PSBs.
Exp_Inc (Expense-to-income ratio): Serves as an efficiency indicator. A high ratio implies higher operational costs relative to income, which can erode profitability and restrict the ability to accumulate capital internally.
NII_II (Non-interest income to interest income): Measures income diversification. A higher ratio reflects a shift towards fee-based income or increase in trading income.
Leverage (Total liabilities to capital): Captures the bank’s reliance on debt financing. High leverage typically increases financial risk and reduces CAR, consistent with the risk–return trade-off theory (Modigliani & Miller, 1958).
Credit_Dep (Credit-to-deposit ratio): Represents intermediation efficiency and liquidity management. A high ratio indicates aggressive lending, which may enhance profitability in the short term but elevate credit risk, potentially lowering CAR.
GDP_G (GDP growth): A proxy for macroeconomic conditions.
INFL (Wholesale price index): Affects the real value of assets and liabilities.
Dummy 1, Dummy 2: Dummy variables for PVBs and FBs.
Dum_t: Time dummy to capture the impact of regime change of 2014.
To check how the relationship between CAR and ROA and other bank-specific variables changes across PVBs, PSBs and FBs, two entity-type dummy variables to the models are added. Dummy variables serve as a methodological tool to incorporate categorical factors into regression analysis, allowing us to capture shifts in the intercept across different categories (Gujarati & Porter, 2009). These dummy variables enable the model to account for systematic differences between bank groups that are not explained by other explanatory variables.
Furthermore, to explore whether there is any structural change in the relationships after the 2014 regime change, a time dummy variable is introduced. This variable takes the value 1 for years after 2014 and 0 for the rest, thus capturing the potential effect of policy reforms and macroeconomic changes initiated by the new government post-2014.
However, since dummy variables affect only the intercept and cannot fully capture differences in slope coefficients or structural behaviours, this study extends the analysis by splitting the data into three separate groups based on bank ownership—PVBs, PSBs and FBs. This study runs distinct sets of simultaneous equations for each group. This approach enables us to investigate whether the determinants of CAR and ROA differ significantly across these three categories of banks, beyond just a shift in intercept. However, equations and instrumental variable for each group are adjusted to ensure endogeneity and strong instrumental variable.
To ensure the reliability and robustness of our statistical inference, this study addresses potential issues of heteroskedasticity by reporting robust standard errors clustered at the bank level, which adjusts for intra-bank autocorrelation and ensures more accurate estimation of standard errors.
Results and Discussion
To ensure the reliability and validity of the regression results, it is essential to verify that the model is not affected by multicollinearity—a condition where independent variables are highly correlated with one another, potentially distorting the estimation of coefficients. As a preliminary step, multicollinearity among the explanatory variables is assessed using the variance inflation factor (VIF). A VIF value below 10 is generally considered acceptable, indicating that multicollinearity is not a concern (Wooldridge, 2009). Since VIF is calculated by regressing each independent variable on all the others, and because CAR and ROA are used as dependent variables in separate models, VIF values are calculated and reported separately for each equation. The results, summarized in Table 3, confirm that there is no issue of multicollinearity, as all values are below the conventional threshold.
Variance Inflation Factors (VIF) for Independent Variables in CAR and ROA Equations.

Additionally, this study employs a data set covering 19 years (T = 19) and 46 banks (N = 46). Panel unit root tests indicate no presence of unit roots, confirming the stationarity of the series. The next step is to address potential endogeneity between CAR and ROA to correctly model the feedback mechanism within the simultaneous equations’ framework. ROA is first treated as an endogenous variable in the CAR equation, followed by treating CAR as endogenous in the ROA equation. For both equations, endogeneity of the other variable is confirmed at all the four levels: aggregate, PSB, PVB and FB. To ensure the identification of strong instrumental variables, some of the variables are excluded from the main equation and used as instruments; coefficients for these variables are left blank in the results tables. In the CAR equation, lagged ROA is also included as an additional instrument. The dummy variables for entity type were excluded during the identification of the instrumental variable.
The Wu–Hausman test confirms endogeneity, justifying the use of instrumental variables, while the first-stage F-statistics exceed the conventional threshold of 10 (Staiger & Stock, 1994), indicating that the chosen instruments are sufficiently strong.
The regression results for the simultaneous equations estimating CAR are presented in Table 4. These results provide insights into the determinants of CAR across bank categories, while Table 5 presents the corresponding ROA equations. Together, they highlight how profitability and capital adequacy are interlinked and how other factors influence these relationships differently across ownership types.
Regression Results for CAR Equation (ROA Treated Endogenous).

Significance levels: **p < .01; **p < .05; *p < .10.
IV: Instrumental variable.
Table 4 demonstrates that, at the aggregate level, ROA exerts a negative influence on CAR, suggesting that as profitability increases, banks reduce their capital buffers. However, the disaggregated analysis reveals important heterogeneity: ROA has no significant impact on CAR for PSBs, a positive and significant effect for PVBs, and a negative and significant effect for FBs. This suggests that PVBs translate higher profitability into stronger capital adequacy, whereas FBs allocate earnings towards riskier investments, weakening capital ratios. By contrast, PSBs appear to rely less on profitability and more on external support (e.g., government recapitalization) and regulatory pressures to maintain their capital positions. For PVBs and PSBs, this finding contrasts with Setiawan and Muchtar (2021) and Das and Rout (2020). The latter argued that higher profitability boosts retained earnings and thereby strengthens the capital base.
The relationship between NPAs and CAR is negative at the aggregate, PSB and FB levels, which aligns with expectations: higher NPAs necessitate greater provisioning, thereby lowering CAR. At the disaggregated level, NPAs have no significant effect on PVBs, reinforcing the idea that these banks manage capital proactively in anticipation of asset quality deterioration. This behaviour is consistent with agency theory (Jensen & Meckling, 2019), which emphasizes information asymmetry—managers with inside knowledge of rising risks may adjust capital buffers in advance of observable deterioration.
This contrasts with Das and Rout (2020), who reported a positive relationship, suggesting banks might increase capital buffers while taking risk. The difference may reflect regulatory and temporal shifts: PSBs have continued to struggle with high NPAs, depressing their CAR, whereas PVBs—particularly in the post-2014 period—appear to engage in forward-looking capital planning consistent with stronger prudential norms under Basel III.
Among bank-specific controls, size, non-interest income and credit growth are insignificant, while leverage 1 is negative, consistent with the notion that higher reliance on debt reduces capital buffers. These findings suggest that structural factors such as scale and diversification play a limited role in determining capital buffers, in contrast to NPAs and profitability, which remain central drivers. The insignificance of size and diversification also reflects the post–Basel III environment, where capital requirements have been standardized across banks, reducing the advantage of scale or alternative income streams in shaping capital buffers.
The expense-to-income ratio reduces CAR only for FBs, implying that PSBs and PVBs manage their capital buffers in a way that insulates them from expense-to-income ratio. This again diverges from Das and Rout (2020). Credit growth shows no significant impact on CAR across bank categories. At the macro-level, GDP growth and inflation are positively associated with CAR for the aggregate sample and PSBs. This suggests that these PSBs build buffers during economic upswings in line with the BCBS guidance. By contrast, PVBs and FBs, which typically maintain higher baseline capital ratios, show no such procyclical adjustments.
The time dummy—insignificant at the aggregate level—is positive and significant for PSBs and PVBs, but insignificant for FBs. This suggests that the 2014 regime change and subsequent reforms had an overall favourable effect on the capital positions of domestic banks, while FBs remained unaffected.
Turning to the ROA equation (Table 5), the results highlight both commonalities and differences across ownership types. At aggregate as well as PSBs and PVBs levels, CAR has a positive and significant impact on ROA, suggesting that stronger capitalization improves credit ratings, lowers funding costs and provides buffers that support profitability. In contrast, for FBs, CAR has no effect on ROA, indicating profitability is being driven more by other factors such as operational efficiency, asset quality, income diversification or market strategy, not by capitalization, which is similar to the findings of Hastuti et al. (2024).
Regression Results for ROA Equation (CAR Treated Endogenous).
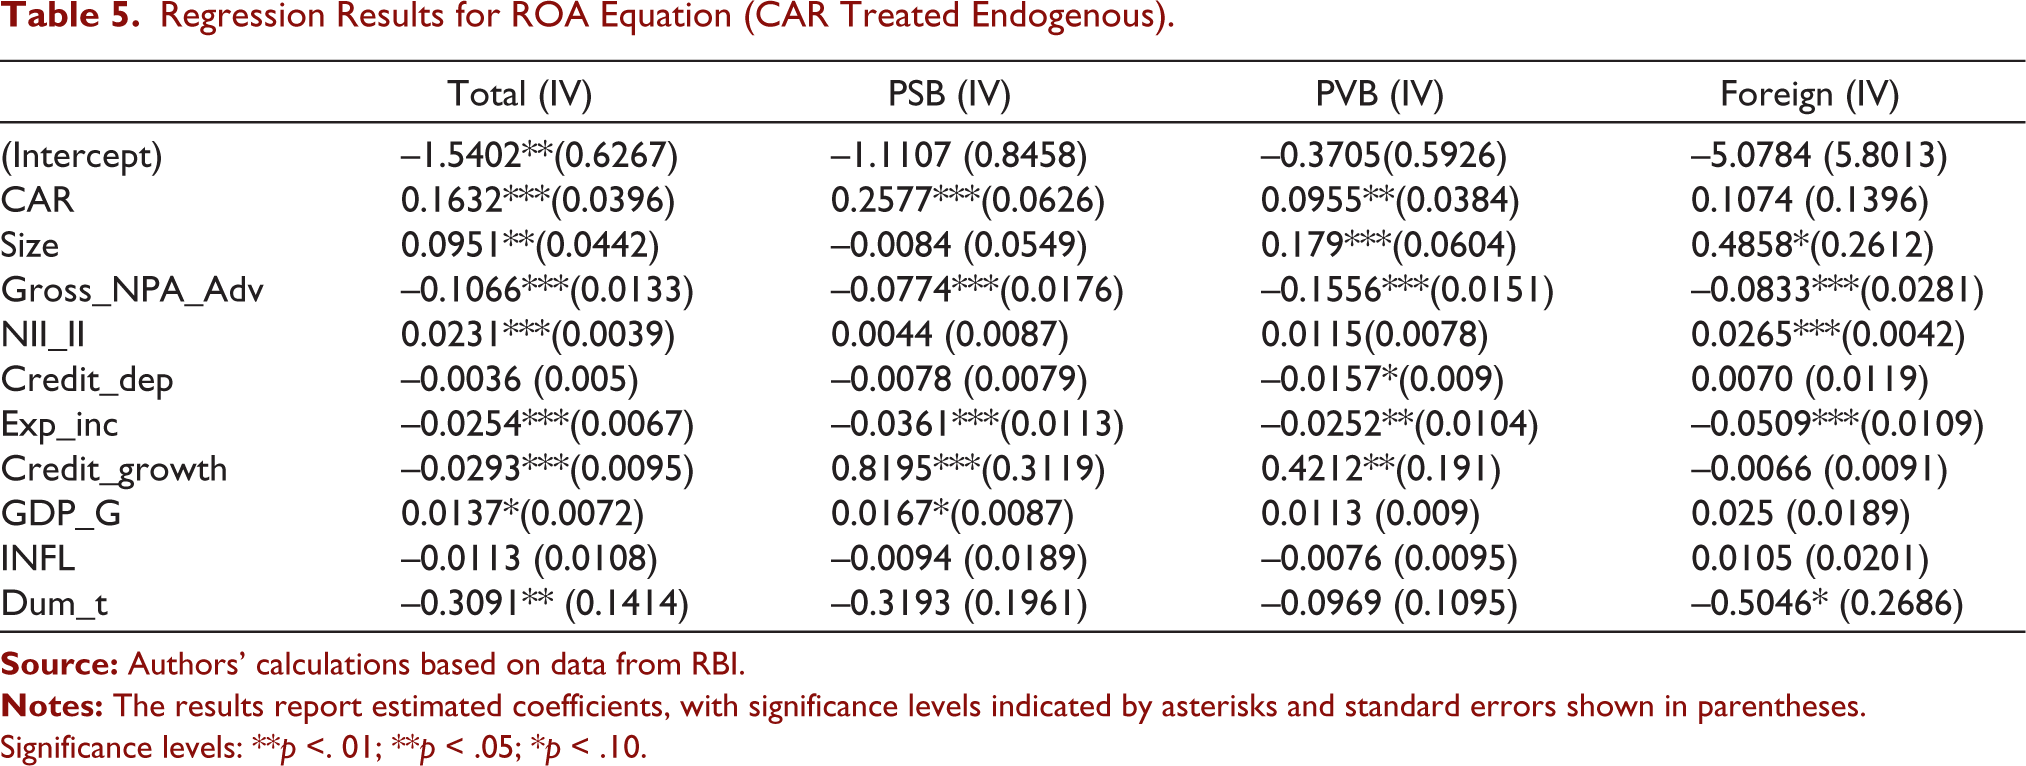
Significance levels: **p <. 01; **p < .05; *p < .10.
NPAs and expense-to-income ratios negatively influence profitability across all levels, consistent with prior findings (Chaudhary & Kumar, 2023; Das & Rout, 2020; Nguyen, 2024; Singh, 2021) that higher provisioning requirements and operating inefficiencies erode returns. Diversification into non-interest income improves profitability for FBs, but not for PSBs or PVBs—likely because the latter are less able to generate trading or fee-based income that would enhance ROA.
A positive and significant coefficient for size suggests that as PVBs and FBs grow larger, they are able to generate higher returns likely because larger banks can allocate and utilize their resources more efficiently. Credit growth enhances profitability in PSBs and PVBs, indicating that more aggressive lending supports higher returns. This pattern reflects the broader trend of private and foreign banks leveraging scale and growth opportunities in the post-reform period, while FBs rely more on diversification. In contrast, this relationship is absent for FBs, whose profitability instead benefits from diversification (NII_II).
Inflation has no significant impact on ROA across any bank category, suggesting that banks adjust their income and expenses in ways that offset inflationary pressures. The time dummy is insignificant for PSBs and PVBs, implying that the 2014 regime change did not materially alter their profitability dynamics. However, at the aggregate level and for FBs specifically, it is negative and significant, indicating that the 2014 policy shift adversely affected FBs’ profitability. This suggests that domestic banks adapted their profitability models to the post-2014 policy environment more smoothly than FBs.
Overall, the interdependence between profitability and capital adequacy is heterogeneous across ownership structures. For PVBs, a clear bidirectional positive relationship exists—profitability strengthens capital adequacy, and higher capitalization supports profitability. PSBs exhibit a one-sided effect, with capital adequacy improving profitability but profitability not significantly influencing capital buffers. In contrast, FBs display a trade-off: higher profitability reduces capital adequacy, whereas capitalization does not significantly affect profitability. These patterns reflect differences in business models, regulatory environments and risk management approaches, and highlight how recent reforms have played out unevenly across ownership groups.
At the disaggregated level, the results reveal both consistencies and differences compared with the aggregate findings. For example, NPAs are insignificant for PVBs in the CAR equation due to stronger capital planning, while size matters only for larger PVBs and FBs in driving higher returns without affecting CAR. Leverage reduces CAR across PSBs and FBs, consistent with the aggregate pattern. In contrast to previous studies, NPAs exert a negative impact on both PSBs and FBs, underscoring their vulnerability to asset quality deterioration.
Taken together, these findings underscore the importance of ownership-sensitive analyses rather than pooled estimates. The distinct determinants of CAR and ROA across PSBs, PVBs and FBs highlight how strategic orientation, regulatory compliance and governance structures shape the profitability–capital nexus. They also suggest that regulatory interventions should be tailored to ownership characteristics rather than uniformly applied. Moreover, the relatively limited influence of macroeconomic factors reinforces the notion that bank-specific characteristics remain the dominant drivers of financial performance in the Indian banking sector (Misra, 2015). Finally, the significance of the time dummy variable confirms that the post-2014 policy and regulatory environment—marked by structural reforms and Basel III implementation—has fundamentally reshaped the capital–profitability dynamics of domestic banks.
Theoretical Contributions
The findings offer several theoretical insights into the capital–profitability nexus within banking. First, the asymmetric relationship between ROA and CAR across ownership types challenges the traditional view that higher profitability universally leads to stronger capitalization through retained earnings. Instead, this study demonstrates that ownership structure mediates this link: PVBs exhibit behaviour consistent with buffer theory (banks build capital in anticipation of future shocks), whereas FBs align more closely with risk–return trade-off theory, using profitability to expand risk exposure rather than to build buffers. PSBs, meanwhile, reflect elements of regulatory capital dependence, where capital adequacy is externally maintained through policy intervention rather than internal earnings.
Second, the observed negative impact of NPAs on CAR reinforces the moral hazard and agency cost perspectives (Jensen & Meckling, 1979), highlighting how risk-taking behaviour and information asymmetry differ across ownership forms.
Collectively, these results contribute to a more nuanced understanding of the ownership-specific dynamics of capital adequacy, extending the theoretical discourse on bank behaviour under heterogeneous institutional settings.
Practical and Policy Contributions
From a practical standpoint, these findings have direct implications for bank managers, regulators and policymakers. For PSBs, profitability does not appear to translate into stronger capital adequacy, indicating a reliance on external recapitalization rather than internal capital generation. There is an urgent need to strengthen internal capital formation mechanisms and improve risk assessment frameworks. Enhancing profitability alone is unlikely to ensure financial resilience unless accompanied by reforms addressing structural inefficiencies and governance constraints. Furthermore, the Government of India’s ongoing plan to consolidate PSBs into a smaller number of large banks may not necessarily improve capital adequacy or profitability unless such mergers yield tangible cost efficiencies. Instead, PSBs should prioritize sustainable credit growth to enhance profitability while exercising caution in the rapid expansion of unsecured retail credit, consistent with the concerns raised by Das (2024).
For PVBs, the positive linkage between profitability and CAR indicates effective internal capital management. Policymakers could encourage this behaviour through incentive-based and principle-driven capital requirements, which reward proactive risk management and discourage regulatory arbitrage. As Rao (2024) notes, the regulatory framework itself must evolve from a rule-based to a principle-based approach as the financial system matures.
For FBs, the negative ROA–CAR link implies a greater tendency towards risk optimization. Regulators should therefore monitor FBs’ exposure to volatile earnings and ensure that capital adequacy reflects true risk-weighted exposures rather than global portfolio adjustments.
The post-2014 structural reforms appear to have had a stabilizing influence on capital adequacy, validating ongoing regulatory measures such as the AQR and recapitalization programmes.
In summary, the study contributes both theoretically and practically by showing that capital management behaviour is ownership-contingent, shaped jointly by internal profitability dynamics, external regulatory environments and macroeconomic conditions.
Conclusion
This study examines the interdependence between capital adequacy (CAR) and profitability (ROA) in the Indian banking sector using a simultaneous equations framework and ownership-disaggregated panel data from 2005 to 2024. By explicitly modelling bidirectional causality and institutional heterogeneity, the analysis provides new evidence on how capital buffers and profitability jointly evolve under differing governance and regulatory regimes.
The findings underscore that the capital–profitability nexus is fundamentally ownership-contingent. Rather than exhibiting a uniform relationship, banks respond to profitability, risk and regulatory incentives in ways shaped by their institutional mandates and strategic orientations. This heterogeneity highlights the limitations of pooled analyses and reinforces the importance of ownership-sensitive empirical modelling when assessing banking stability.
From a broader perspective, the results contribute to the banking literature by demonstrating that higher capitalization does not operate through a single theoretical channel. Instead, buffer-building, risk–return trade-offs and regulatory dependence coexist within the same financial system, depending on the ownership structure. These findings extend existing theories of bank behaviour by embedding them within a heterogeneous institutional setting.
While the post-2014 regulatory reforms appear to have strengthened capital adequacy across domestic banks, the analysis suggests that capital formation and profitability adjustment remain uneven across ownership types. This underscores the importance of incorporating institutional diversity when evaluating the effectiveness of prudential frameworks.
The study has certain limitations. First, the model uses annual data, which may mask short-term dynamics or crisis-specific responses. Second, the identification of instrumental variables, particularly for PSBs, posed challenges that led to the exclusion of certain regressors like leverage from some equations.
Future research can build on the findings of this study in several directions. First, deeper exploration is warranted into how bank managers of private banks manage capital buffers in anticipation of rising NPAs. This would help uncover the strategic and anticipatory nature of capital planning in Indian banks. Second, comparative analyses across other emerging economies could reveal whether the ownership-specific behavioural patterns identified here—especially regarding capital adequacy and profitability—are unique to India or indicative of broader trends in similar institutional and regulatory environments. Finally, future studies could examine how regulatory interventions or governance reforms influence the relationship between asset quality, capital and profitability over time.
Footnotes
Declaration of Conflicting Interests
The authors declared no potential conflicts of interest with respect to the research, authorship and/or publication of this article.
Funding
The authors received no financial support for the research, authorship and/or publication of this article.
Appendix A
Banks Names and Acronym with Entity Type.

| Banks | Entity Type | Acronym | Banks | Entity Type | Acronym |
| Allahabad Bank | PSB | AB_M | IDBI Bank Limited | PSB | IDBI |
| Andhra Bank | PSB | Andhra_M | Indian Bank | PSB | IB |
| Axis Bank Limited | PVB | Axis | Indian Overseas Bank | PSB | IOB |
| Bank of Baroda | PSB | BoB | Indusind Bank Ltd | PVB | Indusind |
| Bank of India | PSB | BoI | Jammu & Kashmir Bank Ltd | PVB | JK |
| Bank of Maharashtra | PSB | BoM | Karnataka Bank Ltd | PVB | KB |
| Barclays Bank Plc | FB | Barclays | Karur Vysya Bank Ltd | PVB | KVBL |
| BNP Paribas | FB | BNP | Kotak Mahindra Bank Ltd. | PVB | Kotak |
| Canara Bank | PSB | CB | Lakshmi Vilas Bank Ltd | PVB | LVBL_M |
| Central Bank of India | PSB | CBI | Oriental Bank Of Commerce | PSB | OBC_M |
| Citibank N.A | FB | CITI | Punjab And Sind Bank | PSB | PSB |
| City Union Bank Limited | PVB | CUB | Punjab National Bank | PSB | PNB |
| Corporation Bank | PSB | Corporation_M | RBL Bank Ltd | PVB | RBL |
| CSB Bank Limited | PVB | CSB | South Indian Bank Ltd | PVB | SI |
| DBS Bank India Limited | FB | DBS | Standard Chartered Bank | FB | SC |
| DCB Bank Limited | PVB | DCB | State Bank of India | PSB | SBI |
| Dena Bank | PSB | Dena_M | Syndicate Bank | PSB | SynBank_M |
| Deutsche Bank Ag | FB | DB | Tamilnad Mercantile Bank Ltd | PVB | TMBL |
| Dhanlaxmi Bank Limited | PVB | DLBL | UCO Bank | PSB | UB |
| Federal Bank Ltd | PVB | Federal | Union Bank of India | PSB | UBI |
| HDFC Bank Ltd. | PVB | HDFC | United Bank of India | PSB | UBI_M |
| HSBC Bank | FB | HSBC | Vijaya Bank | PSB | Vijya_M |
| ICICI Bank Limited | PVB | ICICI | Yes Bank Ltd. | PVB | Yes |