
Abstract
Purpose:
Cardiovascular diseases (CVDs) are a significant cause of death, with health conditions and lifestyle behaviors playing essential roles. We sought to explore CVD risk classes, their associations with self-reported CVD, and differences among classes as a function of intersectional minority stressors (IMS) among sexual and gender minority people of color (SGM POC).
Methods:
A sample of 232 SGM POC (mean age = 33.50 ± 9.77) completed an online survey in 2020 assessing CVD risk indicators and specific IMS, measured using the LGBT People of Color Microaggressions Scale subscales. Latent class analyses were conducted to identify CVD risk classes, followed by logistic regressions to examine associations between classes and self-reported CVD, classes and IMS on self-reported CVD, and interactions between the classes and IMS on self-reported CVD.
Results:
Three classes emerged: a low-risk class with low probabilities for all indicators, a lifestyle-risk class with high probabilities for smoking, alcohol use, and substance use, and a high-risk class with greater probabilities for most CVD indicators. Significant interactions showed that increased LGBT racism was associated with a lower likelihood of self-reported CVD (b = −0.40, standard error [SE] = 0.19, adjusted odds ratio [aOR] = 0.67, p = 0.036) whereas greater heterosexism within communities of color (b = 0.57, SE = 0.22, aOR = 1.77, p = 0.008) was associated with a higher likelihood of self-reported CVD in the high-risk compared with the low-risk class.
Conclusion:
These exploratory findings support the existence of three distinct CVD risk classes among SGM POC and highlight that specific IMS moderate CVD risk for SGM POC.
Keywords
Introduction
According to the American Heart Association, cardiovascular diseases (CVDs) remain a leading cause of death in the United States, with a rate of 224.3 per 100,000. 1 Risk factors include both health conditions and lifestyle behaviors.2–4 Sexual and gender minority (SGM) persons face elevated traditional and nontraditional CVD risks compared with cisgender heterosexual individuals, often due to systemic oppression.5–7 Among SGM people of color (POC), CVD risk reflects not only individual factors but also psychosocial influences, including intersectional minority stressors (IMS) arising from heterosexism, cissexism, and racism, which manifest as harmful interpersonal experiences.8,9 These stressors significantly contribute to CVD risk disparities.10–14
Traditional CVD risk factors are important indicators among SGM persons; however, differences exist compared to cisgender heterosexual individuals.15–17 Bisexual and gay men often have better CVD health scores than heterosexual men, whereas bisexual and lesbian women tend to have worse scores than heterosexual women. 15 Transgender women show more CVD risk factors than cisgender men and women. 17 Mental health conditions, including depression, may also increase CVD risk. 18 This is notable as SGM individuals experience higher levels of psychological distress than cisgender heterosexual individuals.10,19,20 They are also more likely to engage in substance use, further elevating CVD risk.10,12,16,17
Although SGM individuals have greater CVD risk burdens than cisgender heterosexual individuals, added complexity exists for SGM POC. Evidence indicates differences in both the direction and magnitude of risk factors compared with White SGM individuals and their cisgender heterosexual POC counterparts.7,12 However, limited research has examined whether IMS moderate health disparities among SGM POC populations. 21
Categorizing CVD risk
Given the complexities of CVD risk factors among SGM persons, 10 there are varying approaches to comparing SGM individuals with their cisgender heterosexual counterparts. For example, such comparisons focus on each indicator or on the composite scores of all indicators of CVD risk.6,15,18,19,22 Although these approaches provide statistically significant differences, they fall short of identifying CVD risk classes within SGM POC populations. One approach to clustering risk classes is latent class analysis (LCA), a person-centered quantitative technique for examining IMS using an intersectional framework 21 ; however, there is no consensus on which indicators to use in the existing CVD risk literature. Some studies examined a combination of health conditions and lifestyle indicators (i.e., health behaviors that an individual typically engages in),23–25 whereas others focus on lifestyle indicators.26,27
Findings from these studies suggest that CVD risk levels vary with combinations of risk factors. Moreover, what is clear is that the most at-risk group tends to have a high number of risk factors (e.g., cholesterol, high blood pressure, obesity, and diabetes).23,25 The literature on lifestyle factors is highly variable, with classes largely driven by smoking in some populations.24,25 At the same time, other studies have not identified smoking as a strong indicator in any class.23,26,27 Additional indicators that appear in different combinations of classes include substance use, physical inactivity, and diet.24–27 Given that these studies’ samples are outside the United States,25,26 do not report race demographics,23,25,26 or are primarily heterosexual White samples, 27 there is a need to investigate how CVD risk factors cluster to create risk classes in U.S.-based SGM POC samples.
IMS and cardiovascular disease
The risk of CVD among SGM POC is further exacerbated by the presence of IMS linked with health disparities. 28 Specifically, minority stressors that include stigmatizing social environments are associated with increased inflammation among sexual minority persons. 29 In contrast, for gay men, the act of concealing one’s identity appears to buffer the relationship between discrimination and inflammation. 30 In addition, these stressors can contribute to a greater risk of CVD by diminishing an individual’s self-efficacy or sense of control over their life. 31 Recently, IMS has been linked to higher cortisol concentrations among SGM POC, 13 as well as greater self-report CVD risk in bisexual POC. 14 Thus, there is emerging interest in centering the IMS experiences of SGM POC within the context of CVD risk.
Current study
The current study aimed to explore CVD risk classes based on empirically relevant indicators and to compare these classes with respect to differences in self-reported CVD within our SGM POC sample. Given previous literature suggesting that CVD risk is influenced by both health conditions and lifestyle indicators,2–4 our study examined both health condition indicators and lifestyle risk indicators in a sample of SGM POC due to the lack of representation of these communities in the CVD health literature. Guided by minority stress theory, the secondary exploratory purpose of this study was to investigate whether IMS (racism within the LGBT community, heterosexism in communities of color, and LGBT relationship racism) exacerbates the differences between CVD risk classes and self-reported CVD for SGM POC.
Methods
Participants and procedures
A total of 232 SGM POC took part in this study. Participants provided informed consent to participate in the study during the summer of 2020 through Amazon’s Mechanical Turk. After completing the study, they were directed to their Mechanical Turk account to receive $0.10 in compensation, consistent with 10–15-minute tasks on Mechanical Turk. 32 To ensure data quality, only participants with a task completion rate/reputation score of 95% were selected to take the survey. 33 Response accuracy and reliability were assessed using nine attention-check items inserted randomly throughout the survey to enhance response quality. 34 This study was reviewed and approved on July 14th, 2020, by the University of La Verne institutional review board (Protocol no. 2020-35-CAS), where the third author previously held an academic position.
Measures
Demographic information
Participants filled out demographic information (see Table 1 for all response options for each variable). Sexual orientation and gender identity were assessed using the Williams Institute guidelines. 35 Sexual orientation was asked with the question, “Do you think of yourself as…,” followed by the response options shown in Table 1. Gender identity was assessed with the question “How do you describe your gender identity?” and sex assigned at birth was assessed with the question, “What sex were you assigned at birth, on your original birth certificate?” Response options are shown in Table 1.
Demographic Information for the Sexual and Gender Minority People of Color Sample (N = 232)
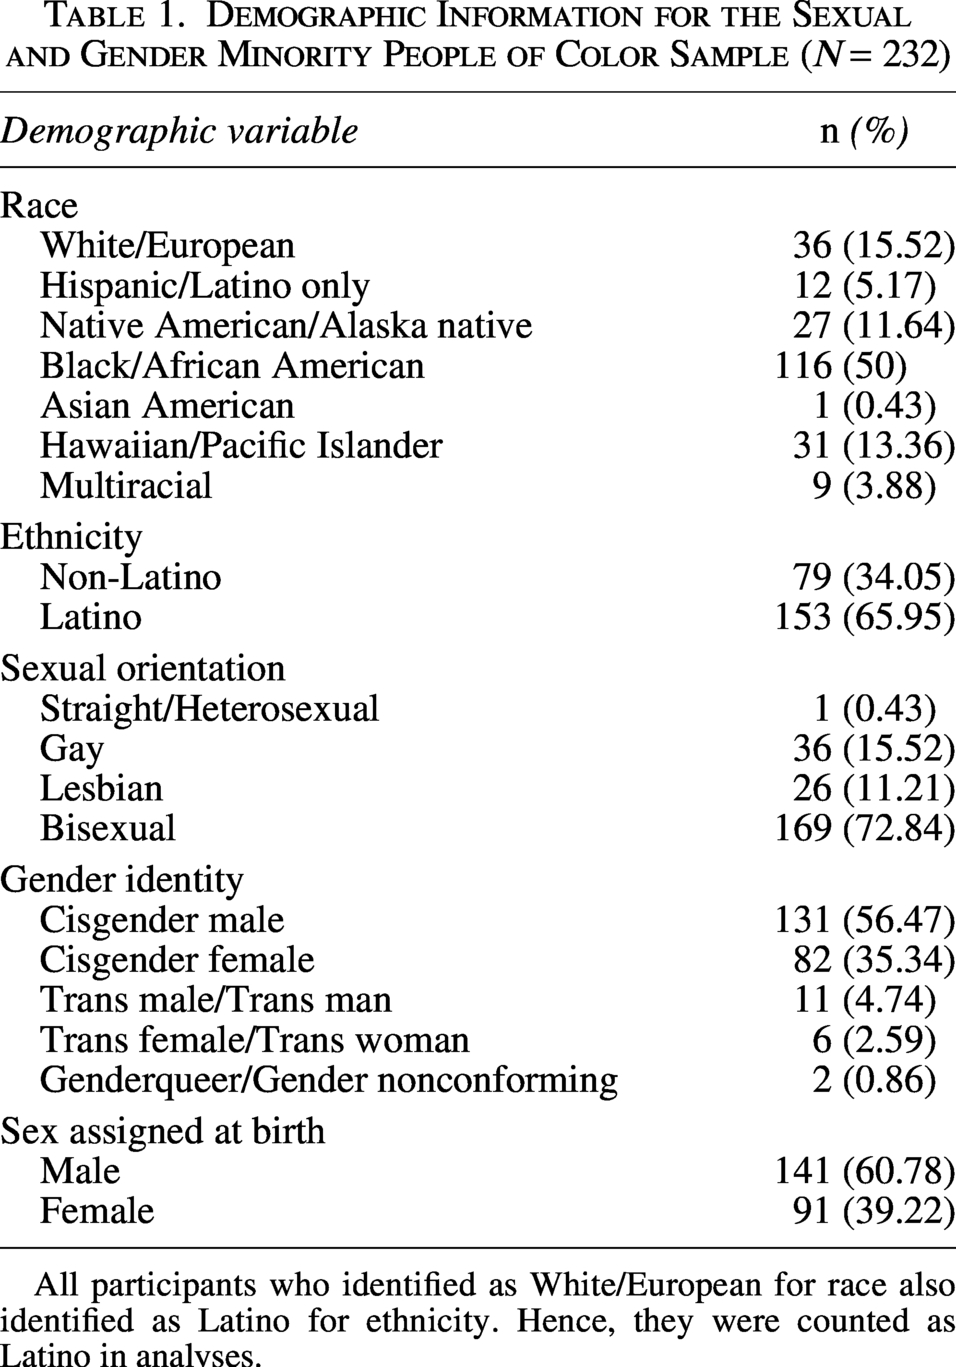
All participants who identified as White/European for race also identified as Latino for ethnicity. Hence, they were counted as Latino in analyses.
Race and ethnicity were assessed in accordance with modified U.S. federal guidelines. 36 Questions on self-identified ethnicity (Latino/a/x persons or not) and race were asked as two separate items, with options listed in Table 1. Multiracial persons were coded if multiple races were selected. All Latino/a/x respondents were classified as Latina/o/x people regardless of race (including White/European). There were no monoracial White/European persons in this sample, as this study was exclusively focused on SGM POC.
Cardiovascular risk indicators
We used nine indicators to assess CVD risk, six of which were health-related items, consistent with the Framingham Heart Study. 37 Health condition items included assessments of self-reported family history of CVD (“Do you have a family history of heart disease?”), high blood pressure (“Have you ever been told by a medical professional that you have high blood pressure?”), high cholesterol (“Have you ever been told by a medical professional that you have high cholesterol?”), diabetes (“Have you ever been told by a medical professional that you have diabetes?”), cardiac surgery (“Have you had any cardiac surgeries [e.g., stenting, heart bypass]?”), and depressive symptoms. We used the Patient Health Questionnaire 38 to get a composite score, which was dichotomized, where scores of 15 or greater (moderately severe depression or severe depression) indicated high depressive symptoms.
We also focused on lifestyle risk (i.e., health-eroding behaviors in which individuals typically engage). Lifestyle risk indicators included self-reported current cigarette use, illicit drug use, and alcohol use. For cigarette use, participants were asked about their current smoking status (“Do you NOW smoke cigarettes every day, some days, or not at all?”). The indicator was recoded to combine “every day” and “some days” to “currently smoking” and “not at all” to “not smoking.” We used the Drug Screening Questionnaire to assess substance use. 39 We summed the items and dichotomized the total at a cutoff score of 3 or greater, indicating moderate to severe risk. The Alcohol Use Disorders Identification Test-Concise was used to measure alcohol use. 40 Items were summed, and the total score was dichotomized, with moderate risk and greater indicating greater risk of alcohol use.
A score of 3 or 4 was considered moderate risk for women or men, respectively. We tested whether a cutoff score of 3 performed well across our sample. This was done because 8.19% of participants were not cisgender. 41
Intersectional minority stress
The LGBT POC Microaggression Scale (LGBT-PCMS) was used to measure IMS for SGM POC. 8 The LGBT-PCMS has 18 items that measure IMS through three subscales (LGBT racism, heterosexism in communities of color, and LGBT relationship racism). Total scores were calculated for each subscale, with higher scores indicating greater IMS. The LGBT-PCMS has shown acceptable reliability and construct validity. 8 Internal consistency across the three subscales was adequate (LGBT racism, α = 0.89; heterosexism in communities of color, α = 0.90; and LGBT relationship racism, α = 0.90).
Self-reported CVD diagnosis
CVD was measured using a single dichotomous item (“Have you ever been told by a medical professional that you have any cardiovascular-related condition?”).
Data diagnosis and analytic strategy
All analyses were conducted using R. 42 Sixty-three participants were removed due to facetious responses for other gender identities (21.21%). One participant was removed for inattention throughout the survey, and one participant was excluded from the analyses due to missing age data.
The first aim of the study was addressed through a series of LCA. Following guidelines for conducting LCA, 43 we selected nine empirically relevant indicators of CVD risk (see Table 2) with latent classes ranging from 1 to 5. Each LCA was run with 30 replications to prevent local maxima, 35 with age as a covariate. We generated 1000 datasets from correlations between our indicators for sample sizes of 200 and 250 to explore whether our data would meet recommendations for LCA (i.e., acceptable entropy, fit indices, and proportion within the smallest class).43,45,46 Our simulations were not designed to find the true number of classes; instead, they were to support the feasibility of conducting LCA with our sample and suggest the best-fitting model based on fit indices comparisons, parsimony, interpretability, and Vuong–Lo–Mendel–Rubin (VLMR) tests to test model fit between sequential classes models (see Supplementary Table S1). 43 Class membership was determined by the highest posterior probability per participant.
Indicators and Outcome Counts and Percentages Used for the Latent Class Analysis
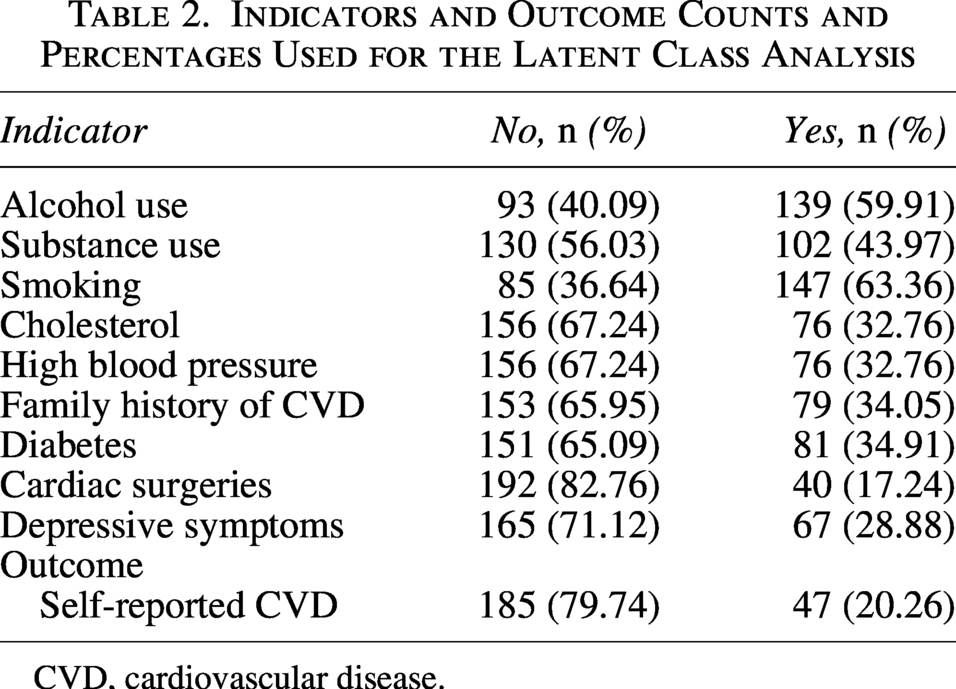
CVD, cardiovascular disease.
To address the second aim of this study, logistic regression analyses were conducted to examine the relationships between the latent classes and self-reported CVD. We then included the IMS into the model. Finally, we included interactions between the latent classes and IMS on self-reported CVD. Predicted probabilities were calculated for significant interactions to visualize the likelihood of self-reported CVD at each IMS value for each class. The low-risk class was considered the reference group for analyses comparing the latent classes.
Results
Sample demographics
Participants’ ages ranged from 19 to 68 (mean age = 33.50 years, standard deviation = 9.77). Most participants self-identified as bisexual (72.84%), cisgender men (56.47%), and Black/African American (50%). Table 1 presents additional demographic information.
Latent class analysis findings
Comparisons between the LCA models using the alcohol use indicator based on sex assigned at birth and those using a cutoff of 3 across different gender identities suggested that a cutoff of 3 showed a better fit across all models tested. Therefore, we proceeded with the model that included the alcohol use indicator using the same cutoff across all gender identities. Table 3 presents the fit indices, relative entropy, and VLMR test significance findings for the LCA tested. We decided on the three-class model because it was slightly better fitting according to the fit indices. The four-class model was not chosen because one class accounted for only 3% (n = 7) of the sample and lacked sufficient power to test associations with self-reported CVD. In the final three-class model, participants in the lifestyle-risk class (b = 0.06, standard error [SE] = 0.02, p = 0.004) and the high-risk class (b = 0.05, SE = 0.02, p = 0.048) were older than those in the low-risk class.
Fit Indices for the Latent Class Analysis Models Tested
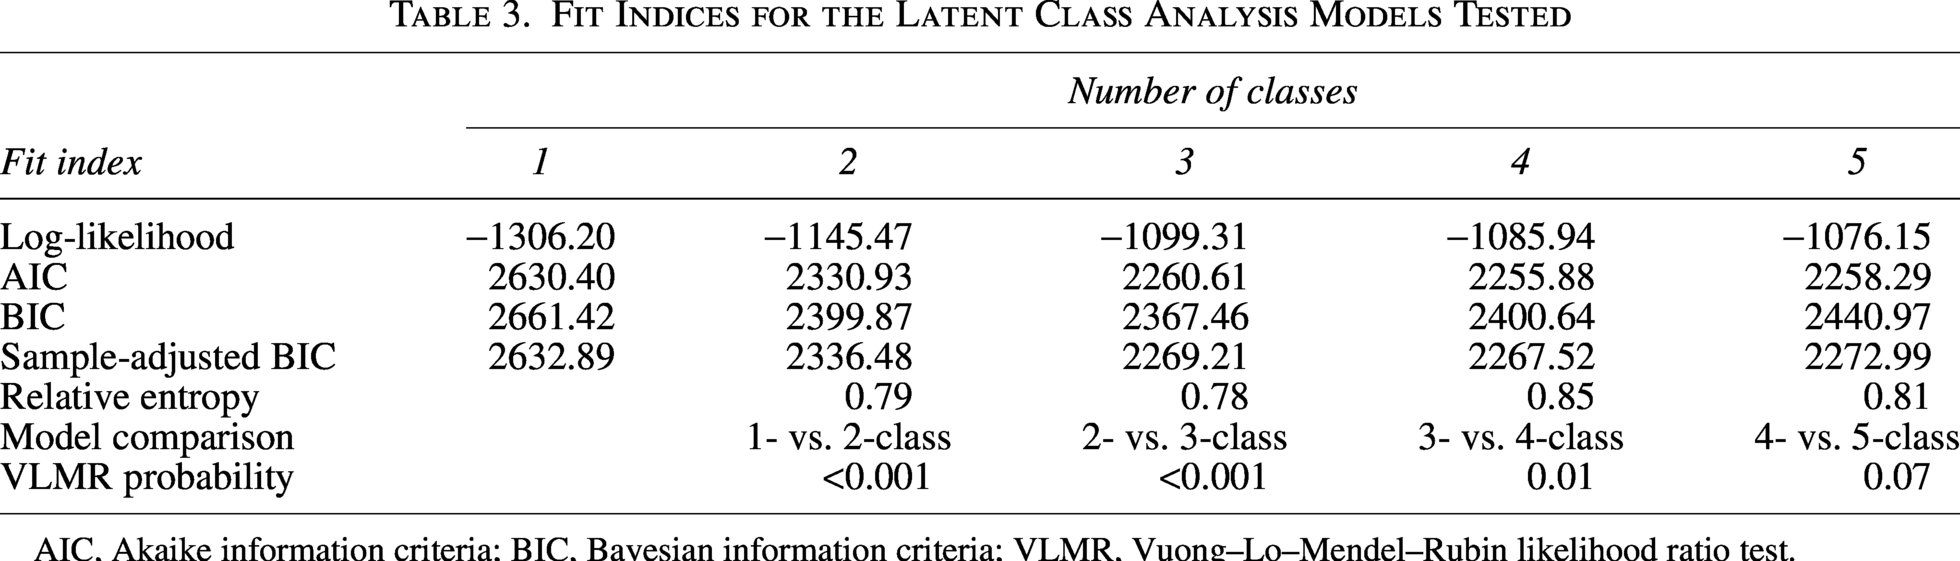
AIC, Akaike information criteria; BIC, Bayesian information criteria; VLMR, Vuong–Lo–Mendel–Rubin likelihood ratio test.
Table 4 and Figure 1 show the item-response probabilities for the three classes and their respective sample proportions. The low-risk class had minimal health or lifestyle risks. The lifestyle-risk class showed higher rates of alcohol use, substance use, and smoking. The high-risk class had elevated probabilities across most conditions, with the exception of moderate-to-severe depressive symptoms.
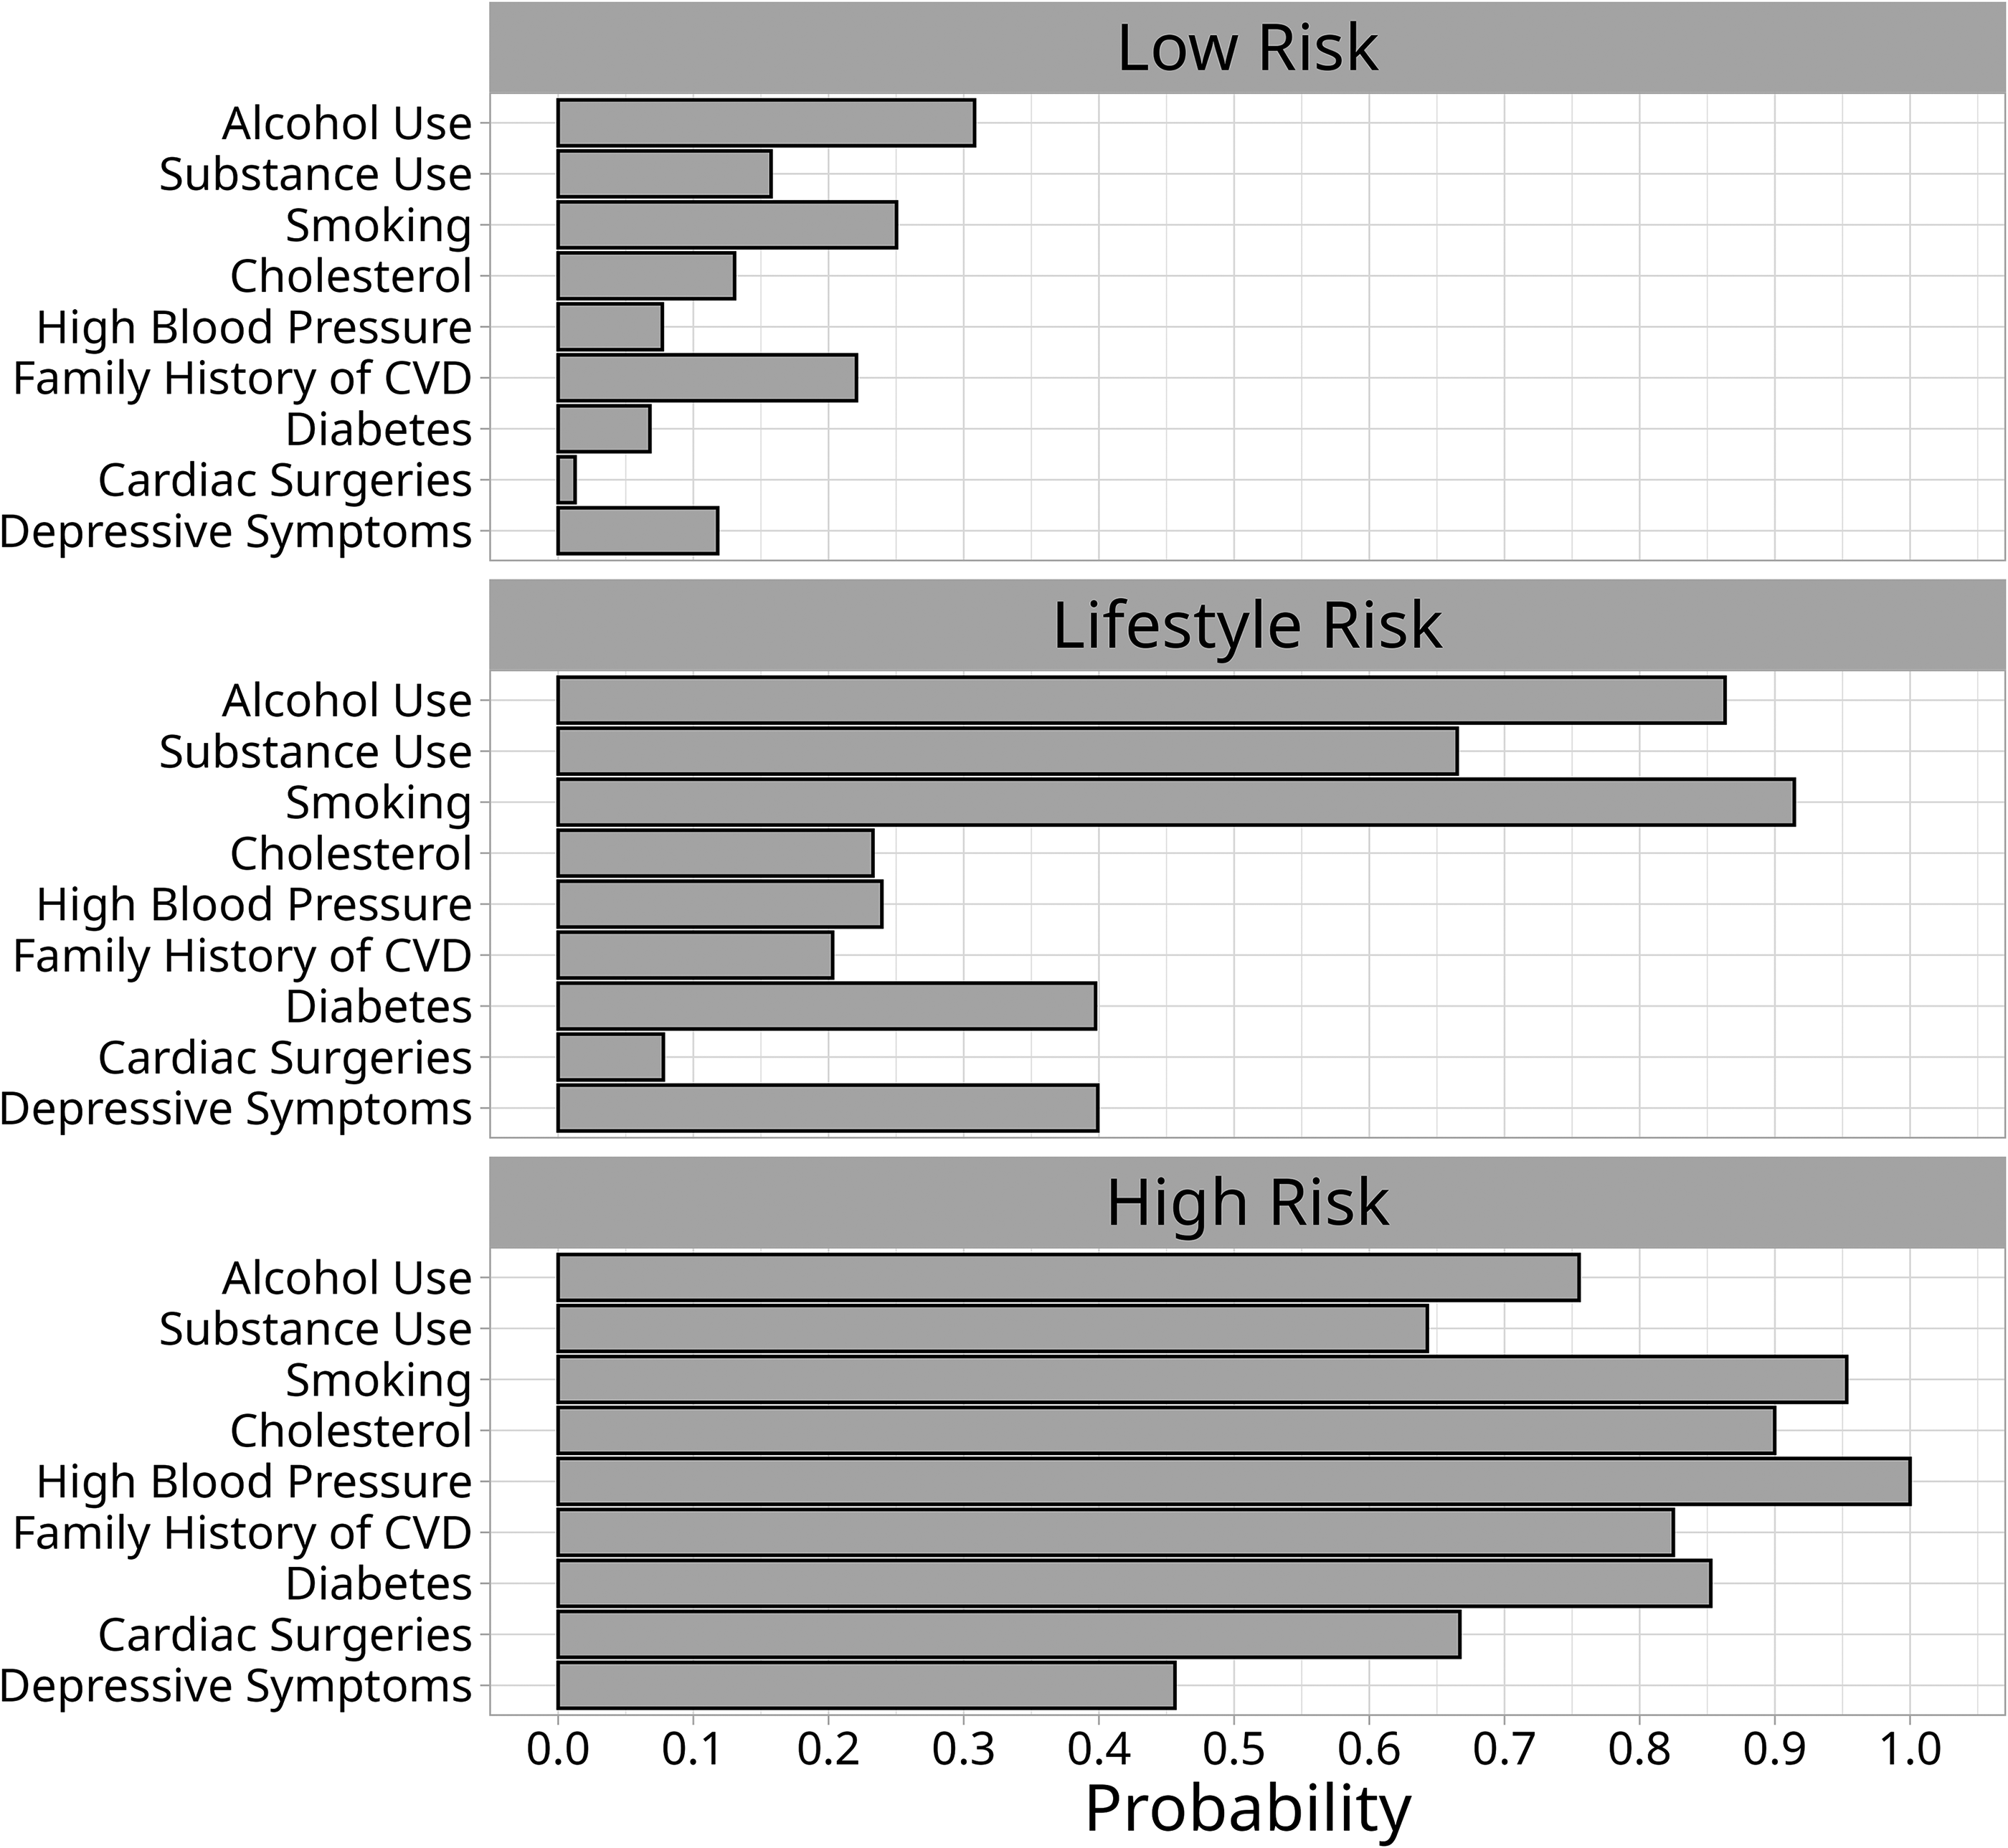
Indicator probabilities in the final three-class model. CVD, cardiovascular disease.
Proportions of Class Membership from the Total Sample and Indicator Probabilities of Cardiovascular Disease Risk
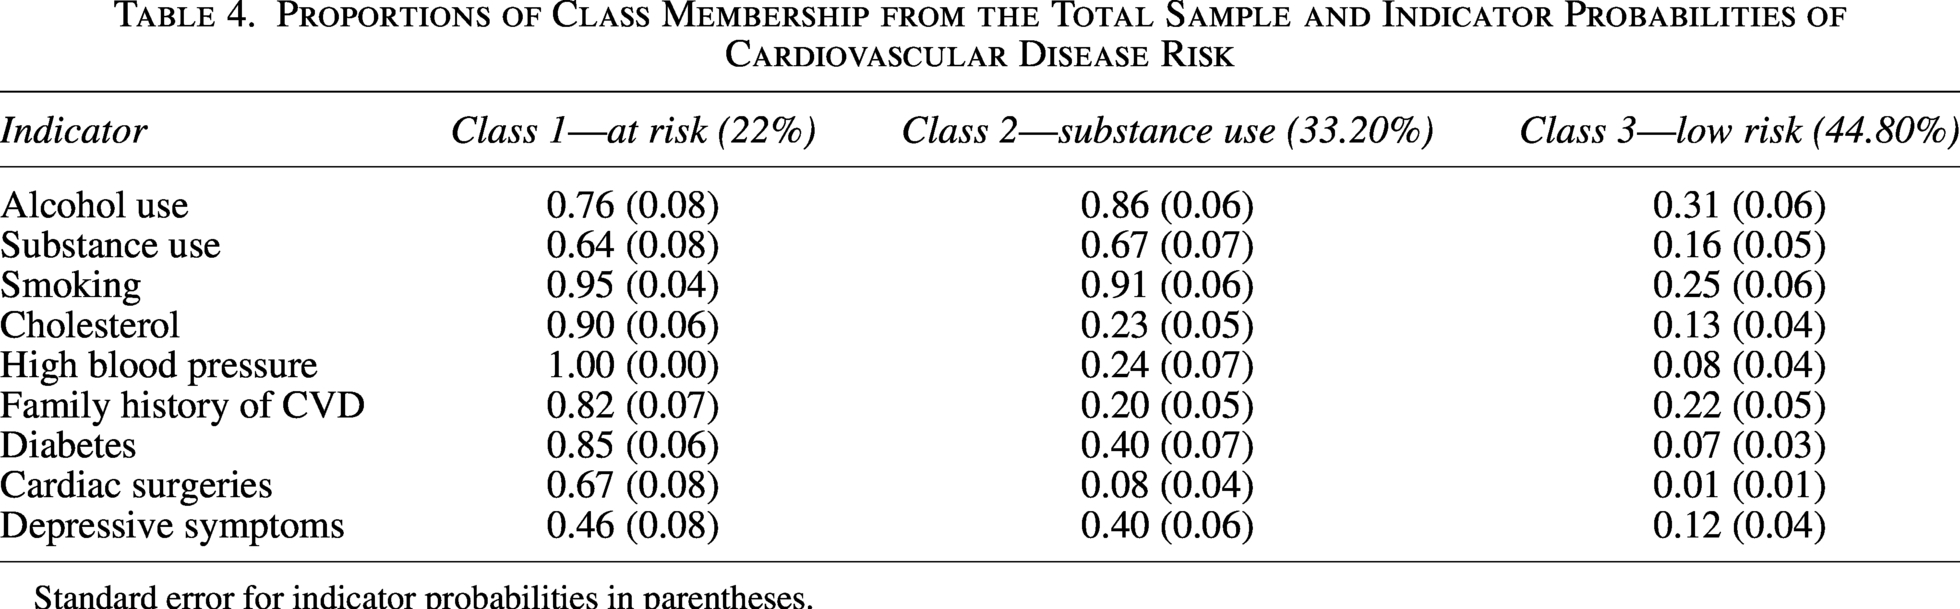
Standard error for indicator probabilities in parentheses.
Table 5 presents the associations between the latent classes and self-reported CVD. Both the high-risk (p < 0.001) and lifestyle-risk (p = 0.029) classes had greater odds of self-reported CVD compared with the low-risk class after adjusting for age. The inclusion of IMS resulted in a statistically significant difference between the low- and high-risk classes (p < 0.001), but not between the lifestyle- and low-risk classes (p = 0.053). The high-risk class had 36.60 times greater odds of self-reporting CVD compared with those in the low-risk class.
Log Odds and Odds Ratios for Predictors of Self-Reported Cardiovascular Disease
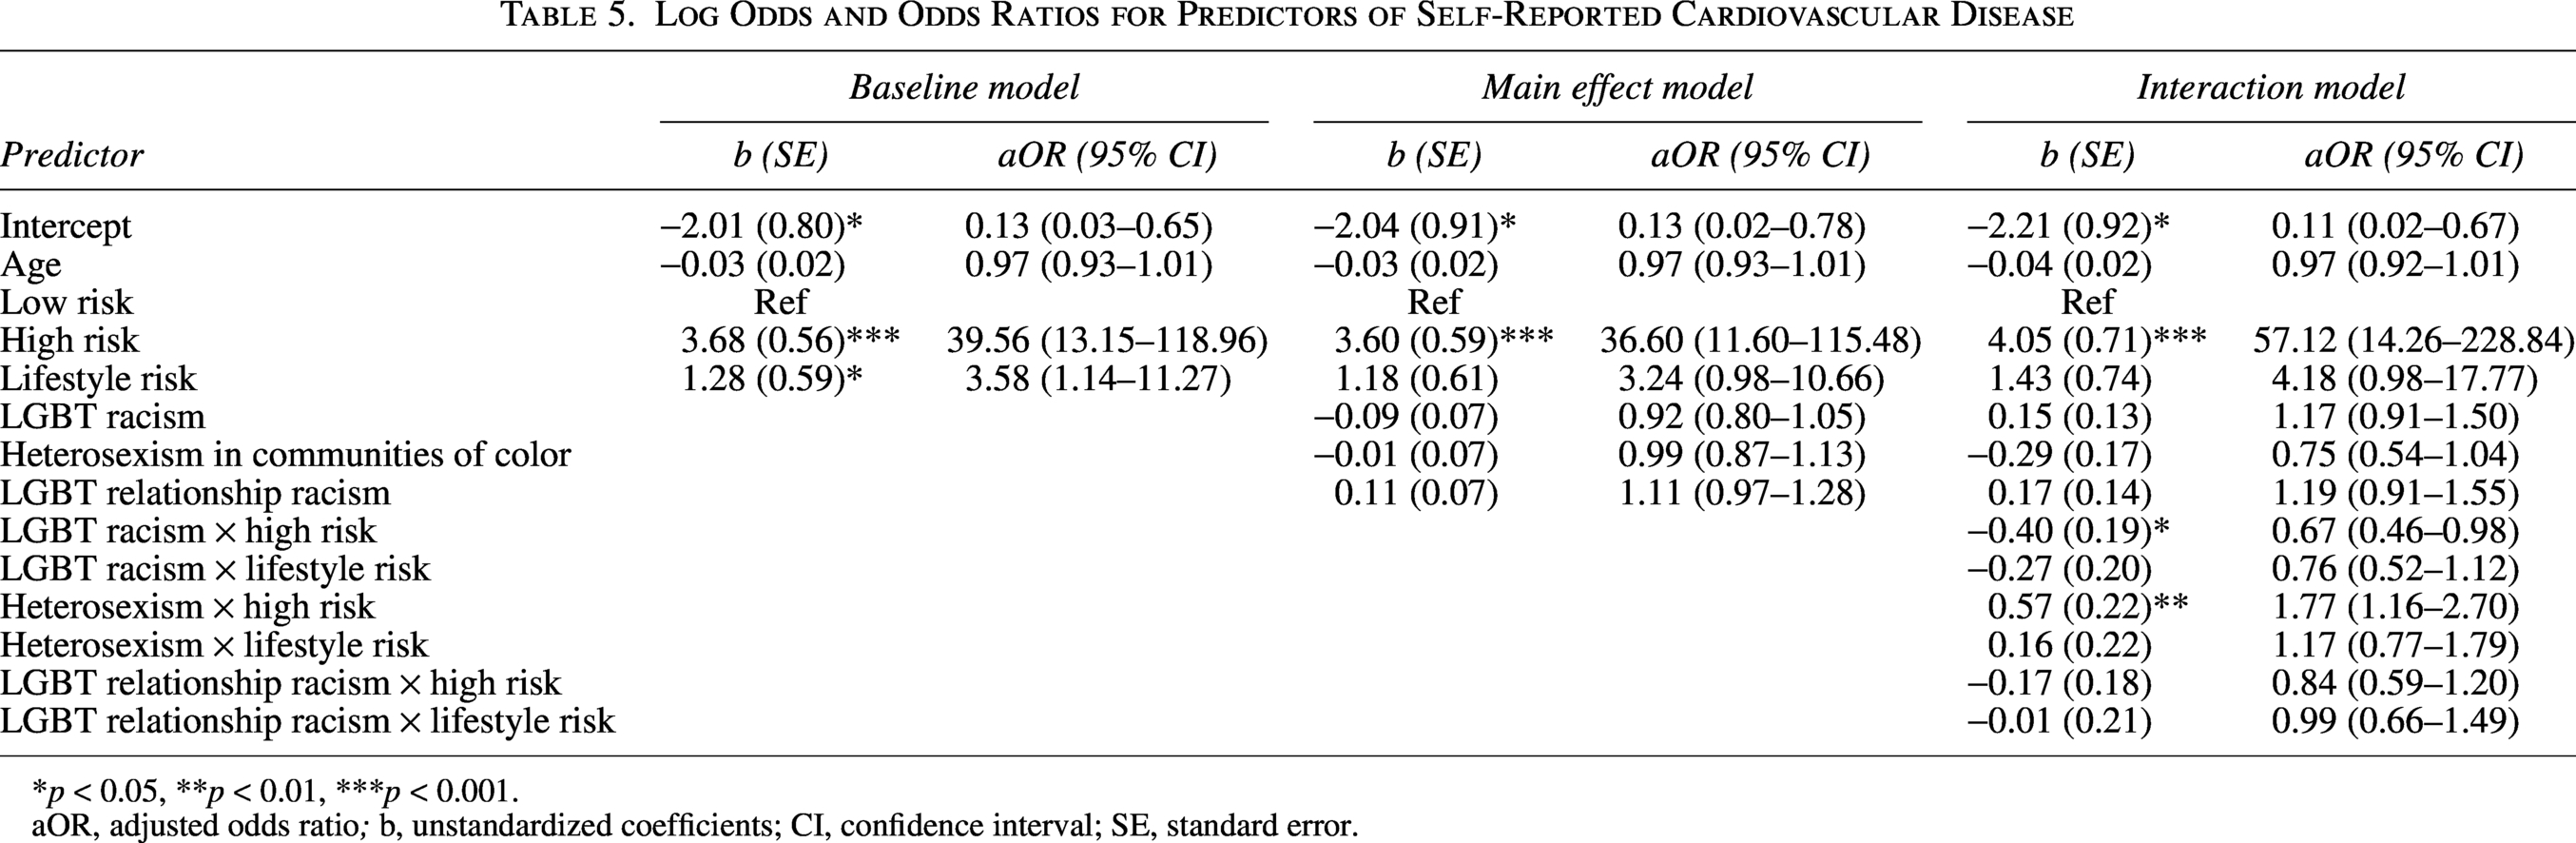
*p < 0.05, **p < 0.01, ***p < 0.001.
aOR, adjusted odds ratio; b, unstandardized coefficients; CI, confidence interval; SE, standard error.
Testing interactions between IMS and latent classes on self-reported CVD revealed interactions between the high-risk class and LGBT racism (b = −0.40, SE = 0.19, adjusted odds ratio [aOR] = 0.67, p = 0.036), as well as heterosexism in communities of color (b = 0.57, SE = 0.22, aOR = 1.77, p = 0.008), but not relationship racism (p = 0.308), in comparison to the low-risk class. Figure 2 presents the predicted probabilities between LGBT racism and self-reported CVD for the risk classes. As LGBT racism increased, the probability of self-reported CVD decreased for participants in the high-risk class. Figure 3 presents the predicted probabilities of heterosexism in communities of color and self-reported CVD across risk classes. The probability of self-reported CVD increased as heterosexism in communities of color increased for participants in the high-risk class. There were no statistically significant interactions between the lifestyle-risk and low-risk classes.
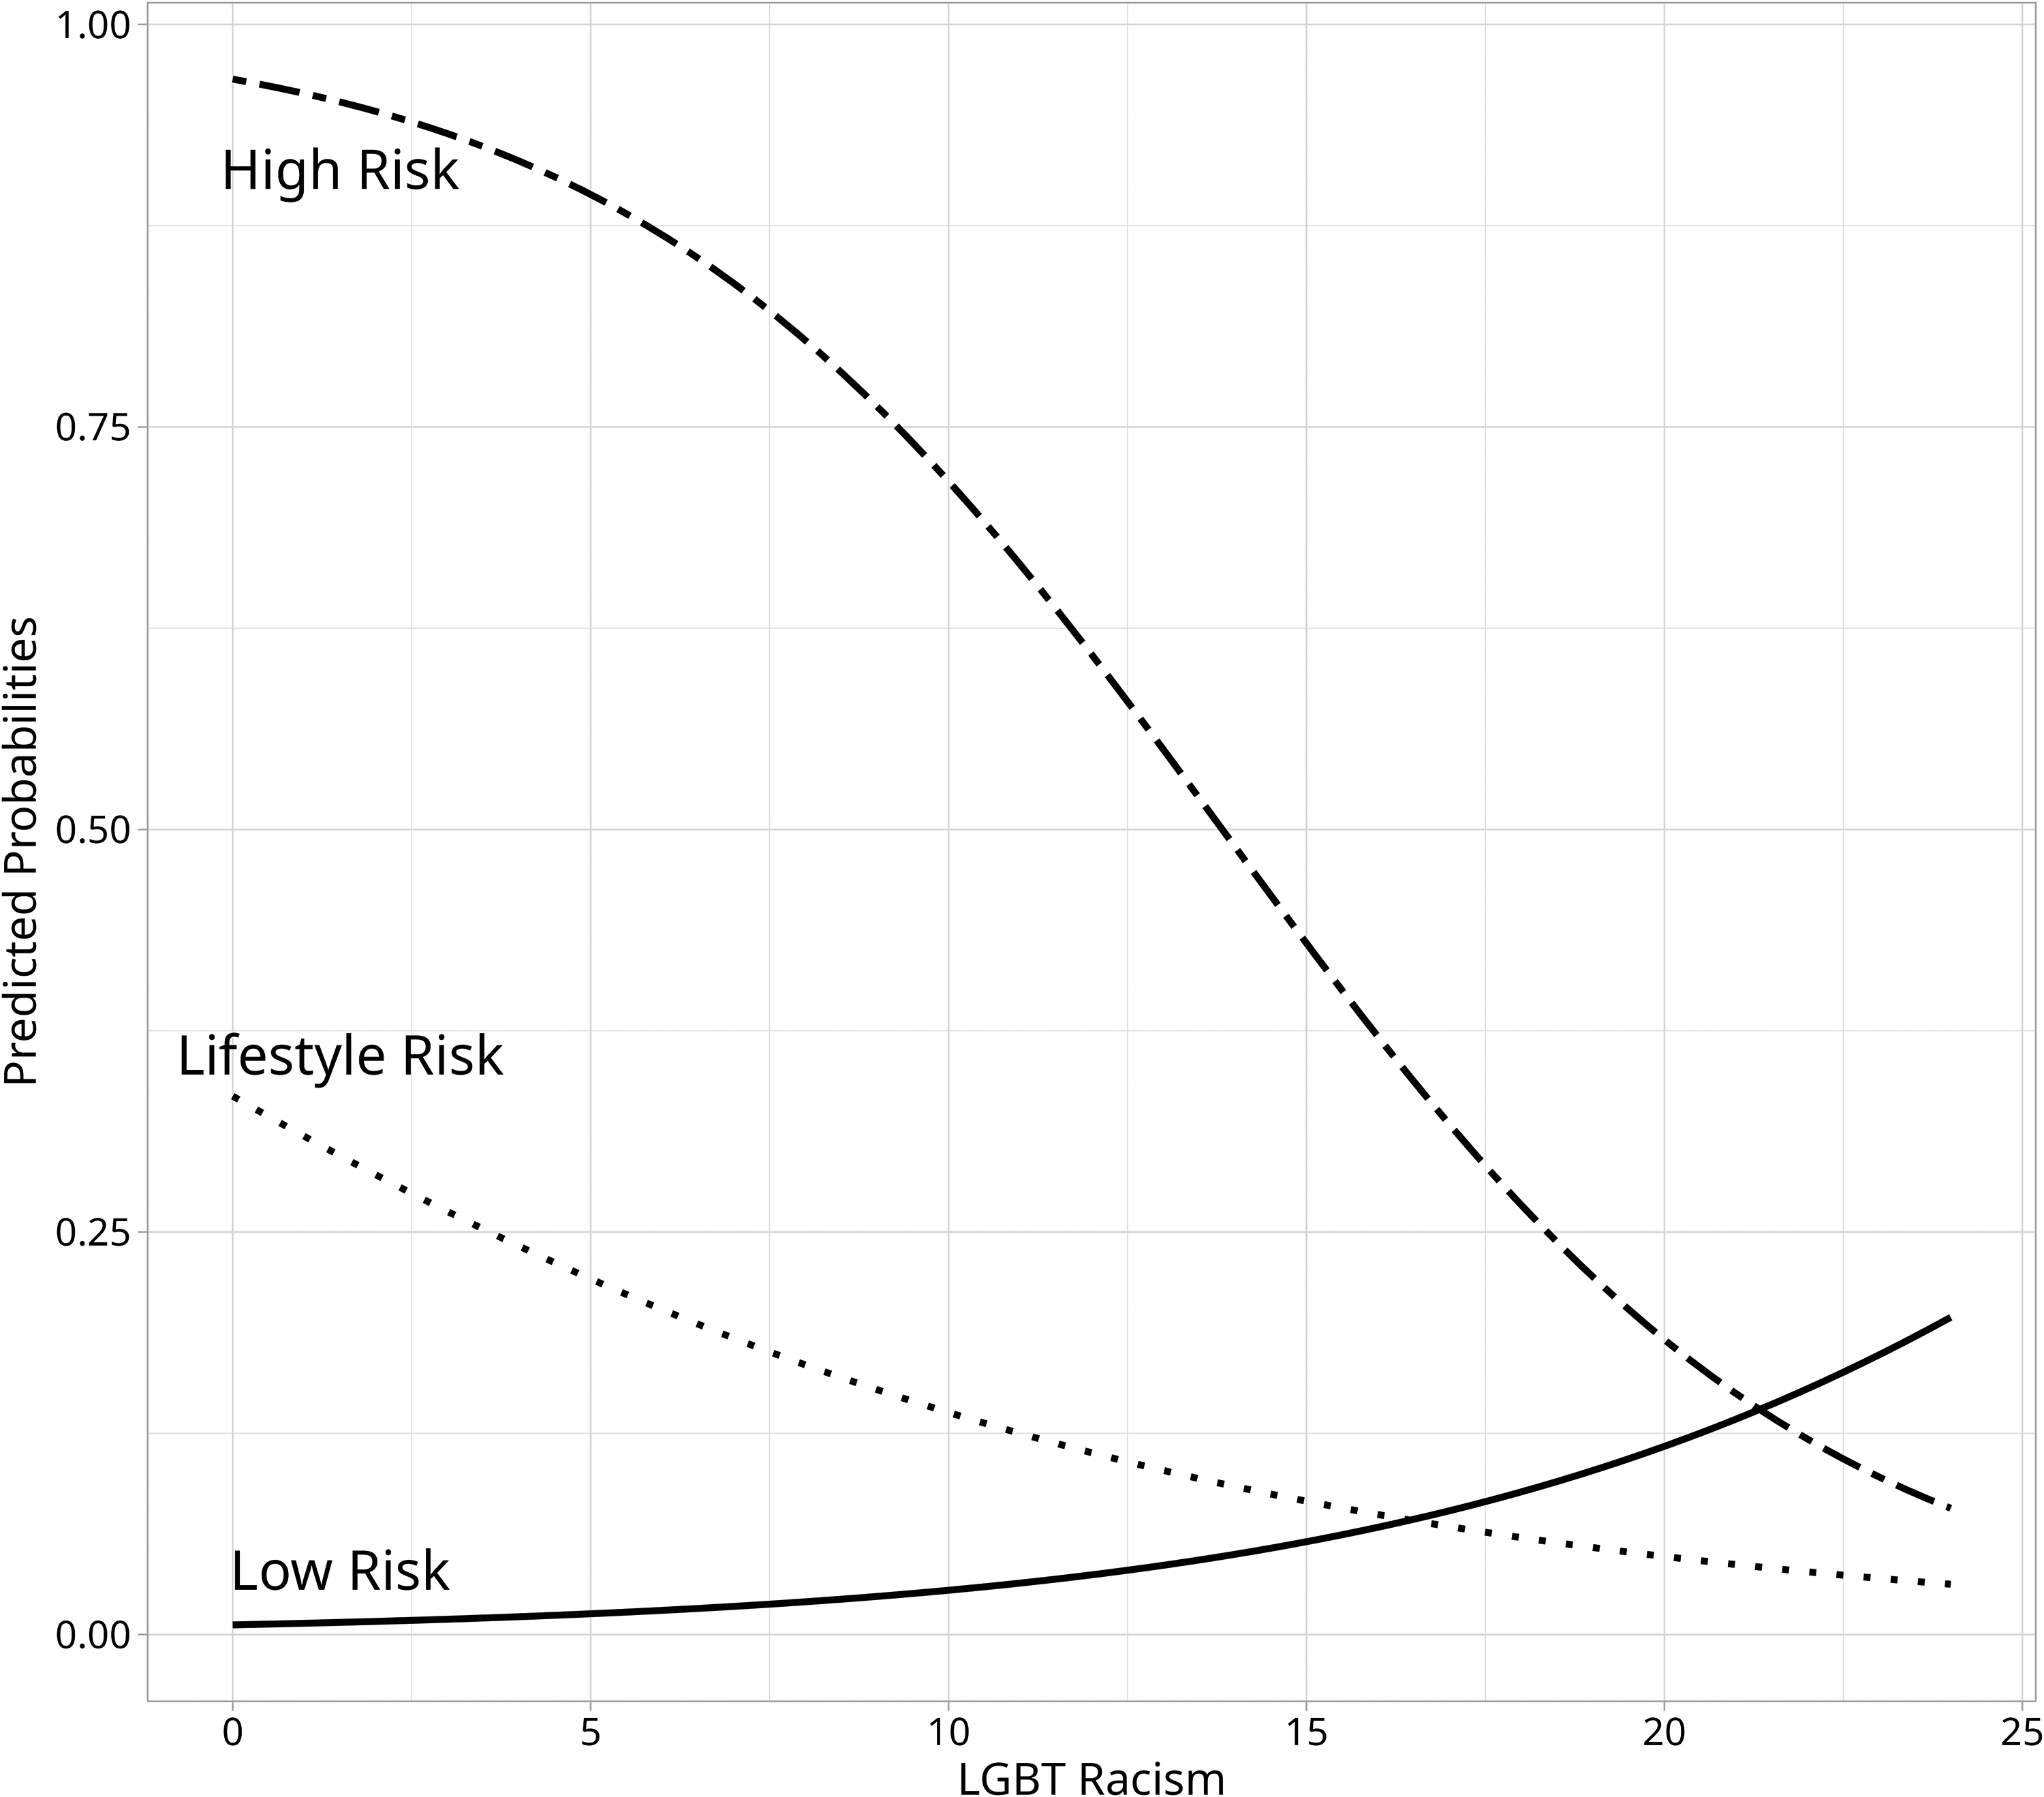
Predicted probabilities of self-reported cardiovascular disease based on LGBT racism among latent classes. Statistically significant difference between the low- and high-risk classes (p = 0.036).
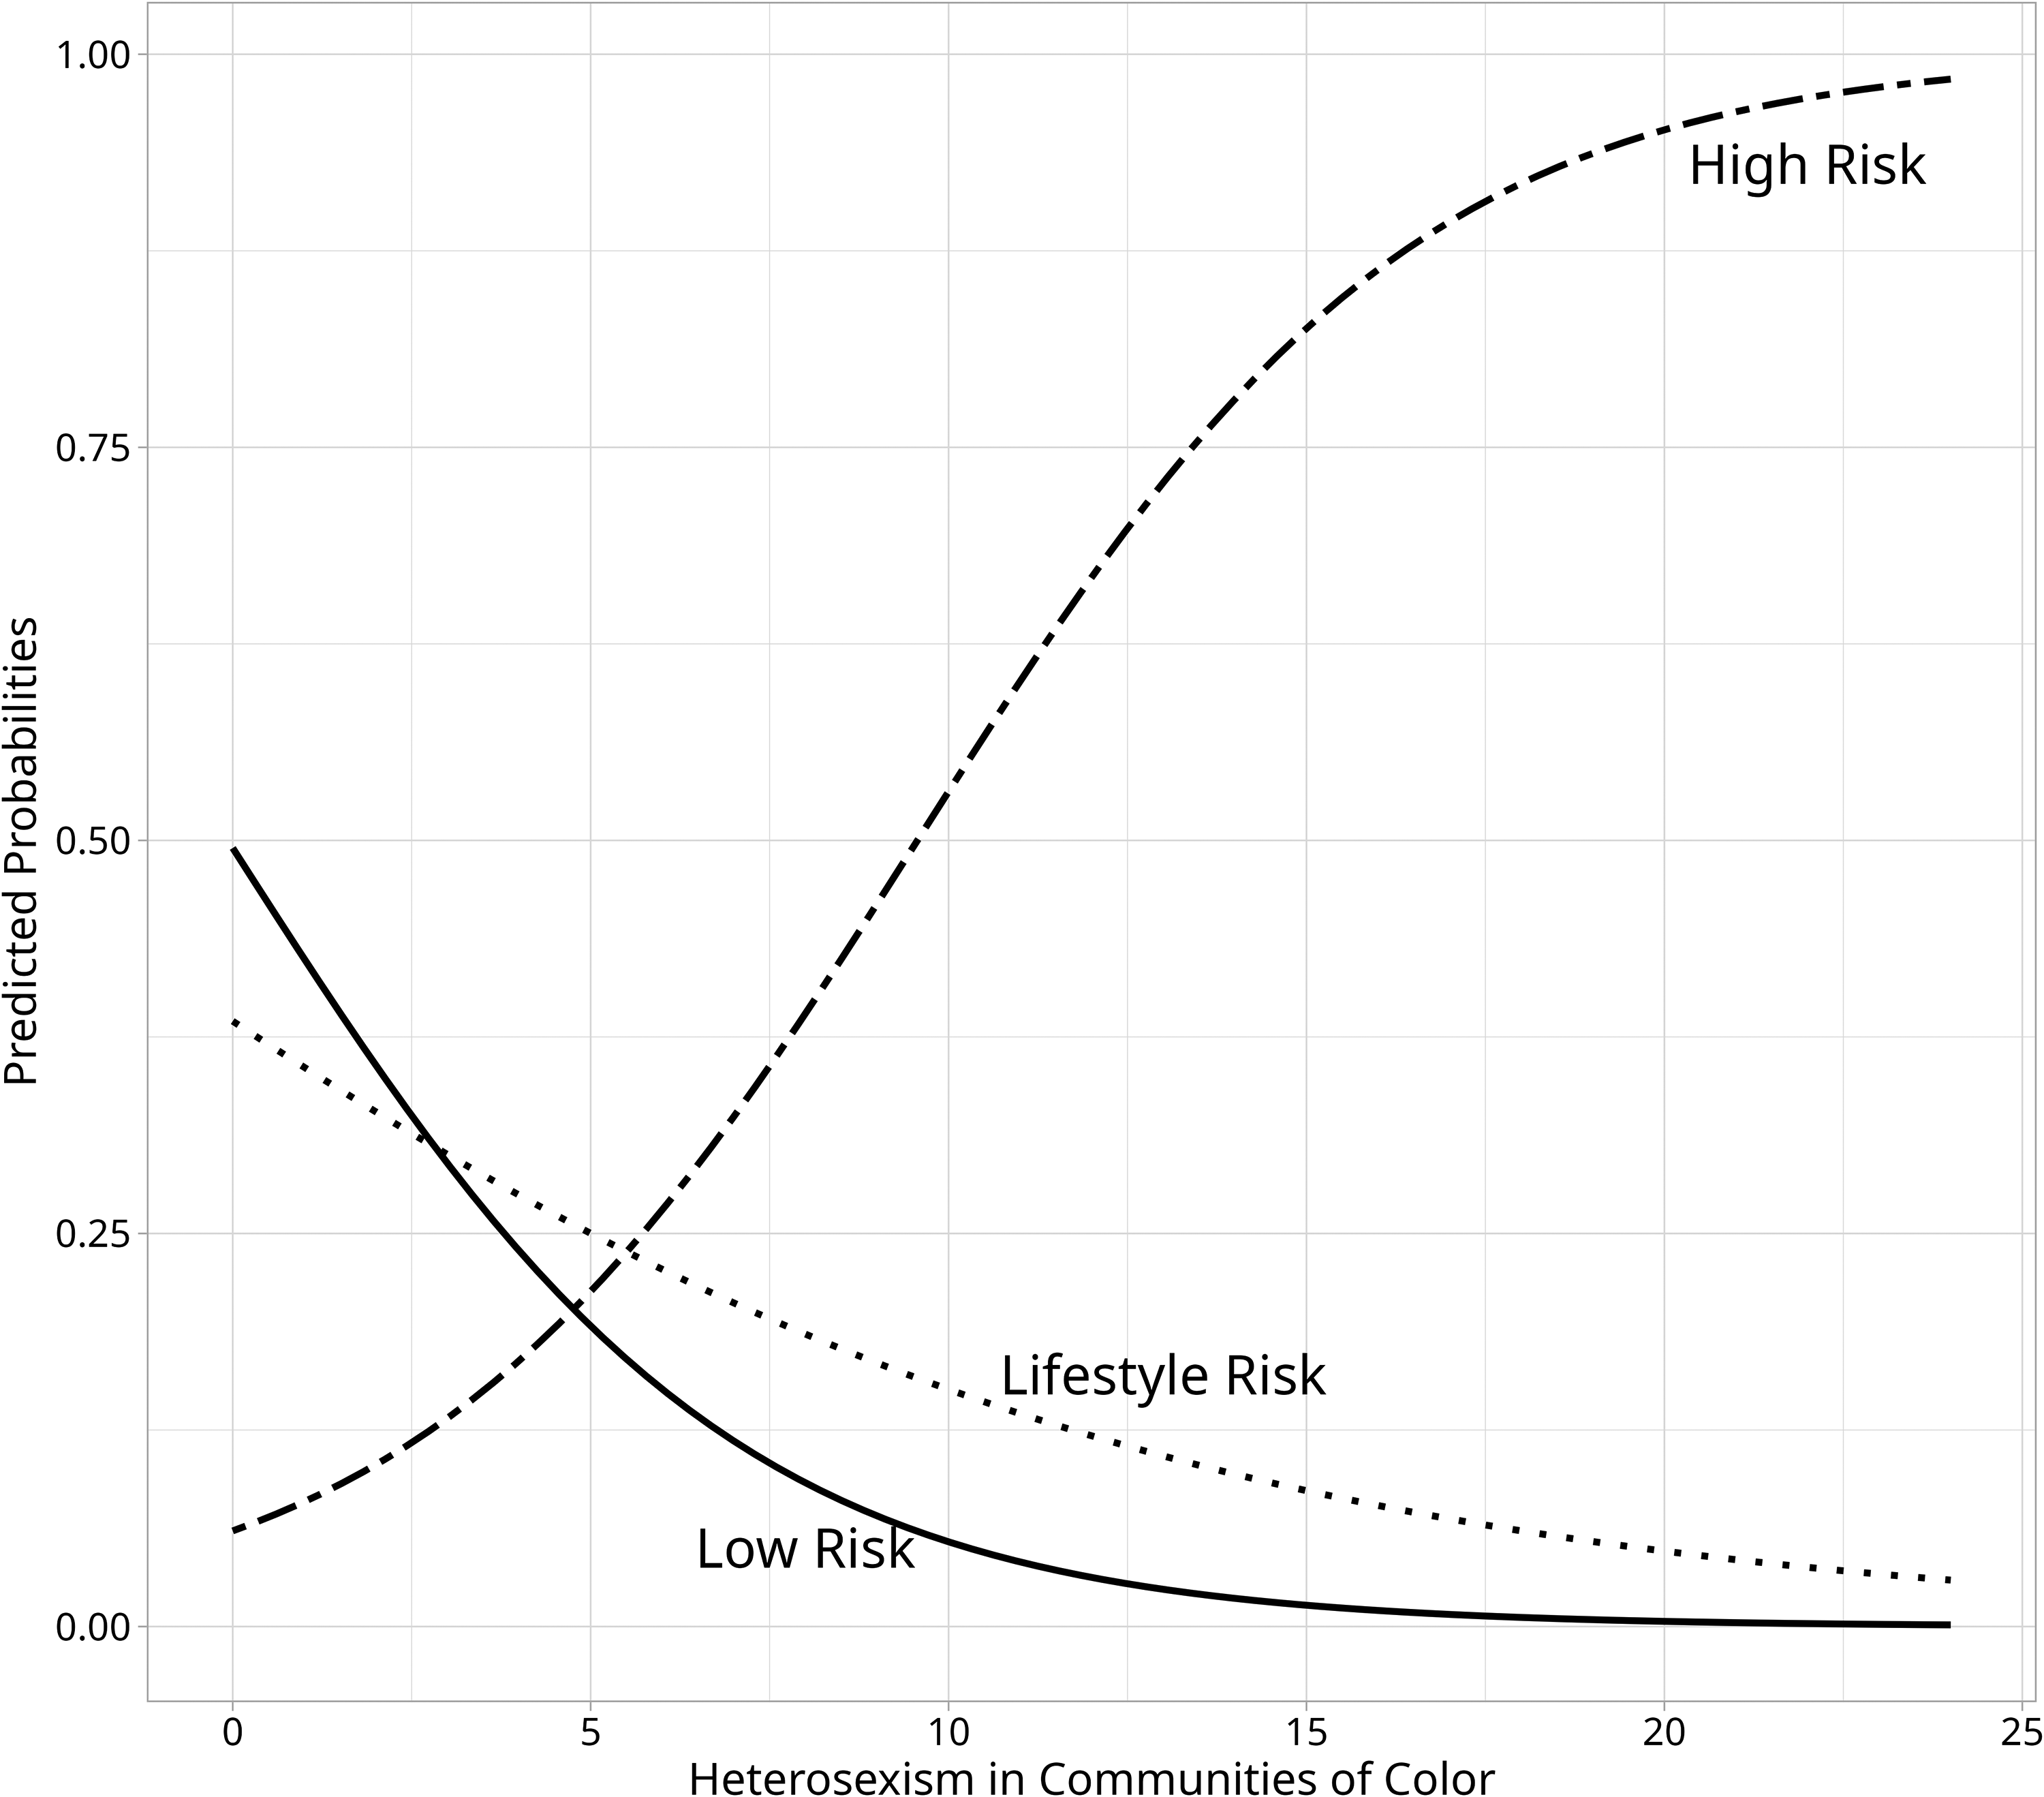
Predicted probabilities of self-reported cardiovascular disease based on heterosexism in communities of color among latent classes. Statistically significant difference between the low- and high-risk classes (p = 0.008).
Discussion
The purpose of our exploratory study was to identify different levels of CVD risk using health conditions and lifestyle risk factors as indicators. We found evidence for three distinct latent classes (low risk, lifestyle, and high risk), corresponding to varying CVD risk levels. We also examined whether these classes differed in self-reported CVD depending on IMS. Our findings suggest that, compared with the low-risk class, participants in the high-risk class were less likely to self-report CVD as LGBT racism increased. In addition, participants in the high-risk class (compared to the low-risk class) were more likely to report CVD as heterosexism in communities of color increased.
First, our LCA findings identified three CVD risk classes, low-, lifestyle-, and high-risk, consistent with previous literature. 25 Our study suggests that both lifestyle and health condition indicators are needed to identify true risk classes. With scarce literature on CVD risk factors for SGM POC, this study expands on the role of lifestyle indicators in CVD risk among SGM POC, 19 in addition to traditional CVD risk factors. 3
Second, our study had both unexpected and expected findings. Specifically, SGM POC in the high-risk class were less likely to report CVD as LGBT racism increased, while also being more likely to report CVD when heterosexism in communities of color increased. Given that our interactions controlled for the other variables, these findings may suggest that an additional construct could affect these associations. For example, although SGM POC experience IMS, they may cope with racism within SGM communities by seeking support from their socially integrated networks within their SGM POC communities. 47 Indeed, social integration is strongly linked to reductions in CVD risk and mortality.48,49 This could be a reason why the high-risk class was less likely to report CVD, as a function of increased LGBT racism, in our sample.
Whereas items for the LGBT racism subscale ask about SGM POC views of White SGM individuals, the heterosexism in communities of color subscale assesses whether SGM POC feel excluded from their own racial/ethnic community and experience heterosexism via invalidation of their SGM identities. Conceivably, not feeling part of their racial/ethnic community could act as a larger stressor in magnitude (compared to racism within SGM communities),50,51 but this has not been examined in the context of SGM POC CVD health. Further investigation is needed into how other social factors (i.e., social support, social integration) and coping strategies relate to CVD health among SGM POC.
Limitations
First, this study had a small sample size (N = 232), which has been suggested to be insufficient for correctly identifying latent classes. 52 Although we conducted 1000 simulations to show that two-, three-, and four-class models were viable, this method does not support finding “true” risk classes, which would require large and more representative samples. Second, our CVD risk factors were self-reported, which tend to overestimate risk compared to objective measures.53,54 The inclusion of other lifestyle-related CVD risk factors, such as physical inactivity, diet, and sleep,24–27 may have led to different latent class solutions in our sample.
Although our sample includes SGM POC, it is essential to draw attention to the fact that our findings are predominantly based on our sample, which is cisgender and bisexual, which limits generalizability to gender minority POC, as the CVD health of transgender and gender diverse POC is an understudied, 55 yet emerging literature.17,56 Due to small sample sizes, we could not explore the intersectional nature of race/ethnicity and SGM groups for our LCA and how IMS impacted these groups in relation to CVD diagnosis.
Future research should use LCA with more representative SGM POC samples to identify risk classes using standardized CVD risk factor indicators, including those listed in the Life’s Essential 8 framework, to promote reproducibility. 4 Although attention checks/filtering were included, data collected via MTurk should be examined with caution for reproducibility. Last, although our study did not directly incorporate intersectionality as a framework, there is considerable debate about the adequacy of quantitative methods for capturing it. 57
Conclusions
Our exploratory findings indicate three distinct levels of CVD risk among SGM POC. The high-risk class showed a greater clustering of multiple CVD risk factors. In contrast, the lifestyle-risk class exhibited higher levels of smoking, alcohol consumption, and illicit substance use. Individuals in the high-risk class had higher odds of self-reported CVD than those in the low-risk class, supporting evidence that combined risks elevate CVD vulnerability. When considering IMS, the high-risk class reported lower CVD as LGBT racism increased, but higher CVD likelihood as heterosexism within communities of color increased overall.
Authors’ Contributions
J.A.P.: Conceptualization (equal), formal analysis (lead), validation (lead), visualization (lead), and writing—original draft (equal) and reviewing and editing (equal). D.G.S.: Significant writing—review and editing (supporting). J.J.G.-G.: Conceptualization (lead), data curation (supporting), formal analysis (supporting), investigation (lead), methodology (lead), project administration (lead), supervision (lead), validation (lead), and writing—original draft (equal) and reviewing and editing (equal). D.G.Z.: Writing—review and editing (supporting). M.S.A.: Investigation (supporting) and writing—review and editing (supporting). K.K.: Writing—review and editing (supporting).
Ethical Considerations
This study was reviewed and approved on July 14, 2020, by the Institutional Review Board of the University of La Verne (Protocol No.: 2020-35-CAS).
Consent to Participate
All participants provided their written informed consent to participate in this study.
Consent for Publication
All participants provided their written informed consent for the publication of the results of this study.
Data Availability
De-identified data may be provided by the corresponding author upon reasonable request.
Footnotes
Acknowledgments
The authors thank the participants for their participation in this study.
Declaration of Conflicting Interest
The authors declare no potential conflicts of interest with respect to the research, authorship, and/or publication of this article.
Funding Statement
The authors received no financial support for the research, authorship, and/or publication of this article.
Supplemental Material
Supplemental Material
References
Supplementary Material
Please find the following supplemental material available below.
For Open Access articles published under a Creative Commons License, all supplemental material carries the same license as the article it is associated with.
For non-Open Access articles published, all supplemental material carries a non-exclusive license, and permission requests for re-use of supplemental material or any part of supplemental material shall be sent directly to the copyright owner as specified in the copyright notice associated with the article.