
Abstract
Background:
While return to performance has been characterized after primary ulnar collateral ligament (UCL) surgery, it has not been well defined after revision UCL reconstruction (rUCLR), particularly in Major League Baseball (MLB) pitchers.
Purpose:
To evaluate return to performance in MLB pitchers after rUCLR.
Study Design:
Descriptive epidemiology study.
Methods:
Return-to-play (RTP) analysis was conducted on 61 MLB pitchers who underwent rUCLR from January 2014 to November 2024 and compared to the results of 129 MLB pitchers who underwent primary UCL surgery during the 2018 to 2023 seasons, when pitch-tracking metrics became widely available and were used in a previous study. Return-to-performance analysis was then conducted according to inclusion criteria on 20 MLB pitchers who underwent rUCLR compared to 40 uninjured controls and 54 pitchers who underwent primary UCL surgery. Paired and unpaired t tests were conducted to compare pre- to postoperative metrics and between groups. The percentage of pitchers who returned to their preoperative performance in each metric was also recorded. The penalized likelihood logistic regression of Firth was used to evaluate for predictive factors.
Results:
The mean age was 28.00 ± 4.16 years. After rUCLR, 1.6% returned to play at 1 year, 44.1% at 2 years, and 63.2% at 3 years postoperatively, with a mean of 605 ± 163 days. Revision UCLR resulted in significantly reduced RTP rates at 2 years (P < .001) and 3 years (P = .01) compared to 71.9% and 82% at 2 and 3 years, respectively, after primary UCL surgery. Overall, 14.3% of pitchers returned to their pre-revision FanGraphs wins above replacement (fWAR) 3 seasons after surgery, suggesting that only a small proportion of pitchers ultimately provide the same value to teams after rUCLR. Stuff+ demonstrated the clearest decline after revision UCLR compared to matched controls and pre-revision levels (P < .05). Fastball velocity, Pitching+, and fWAR return to performance were reduced in the second or third season back compared to primary UCL surgery (P < .10). Only 16.7% of pitchers returned to full performance during their third season back from injury. No preoperative pitching factors were identified as predictors of return to fWAR or full performance.
Conclusion:
Only 63% of MLB pitchers returned to play after rUCLR, and a majority did not return to full performance, defined as returning to 5 key preoperative metrics (expected fielding-independent pitching, fWAR, velocity, fastball velocity, and spin rate). These data suggest that after rUCLR, MLB pitchers RTP at lower rates and typically at decreased performance compared to pre-revision levels and after primary UCL surgery.
Keywords
The increasing rate of ulnar collateral ligament (UCL) injuries over the past decade has been well documented12,16,25,32,33,34 and represents a significant concern throughout all levels of baseball, including Major League Baseball (MLB). In 2024, approximately 38% of all currently active MLB pitchers had undergone UCL surgery at some point in their playing careers, while the rate of UCL surgeries has increased 25% over the past decade.25,32 While the revision rates after UCL surgery were previously thought to be low, one recent study found a revision rate of 13% in MLB pitchers from 1999 to 2014, 22 and the number of revision surgeries is expected to continue to increase as the rates of primary UCL surgeries continue to increase.
A pitcher reinjuring his UCL can be a devastating blow to both the player and team, dramatically decreasing the pitcher’s value even more so than a primary UCL surgery. While return-to-play (RTP) rates from primary UCL surgery have been reported to be 80% to 90%, 28 recent studies have shown that only 58% of pitchers return to the MLB after revision UCL reconstruction (rUCLR). 10 For those who do return, it is critical to understand whether surgery can restore the pitcher’s pre-revision performance level. Only recently did Mastroianni et al 28 report on overall RTP and performance using modern pitch-tracking and advanced analytic metrics in an MLB cohort who underwent primary UCL surgery. Overall, pitchers returned to provide only half their preinjury value, secondary to a significant decrease in their workload and a more mild decrease in their performance after returning from primary UCL surgery. Another recent study found that the estimated mean cost of a primary UCL surgery was approximately $18.5 million in salary and performance value lost, while the estimated mean cost of recovery for an rUCLR was $23 million. 25 This reality is critical for teams and players to realize when investing millions of dollars into a player and when weighing treatment options after already recovering from one career-threatening UCL injury.
Despite the known financial implications of rUCLR surgery and the more discouraging RTP rates, it is currently not well understood how MLB pitchers return to performance after rUCLR. We previously overviewed the state of advanced data now available in MLB and highlighted the need for future studies to use these more objective data to evaluate risk factors and surgical outcomes.26-29 Therefore, the primary objective of this study was to evaluate return to performance using advanced analytic and pitch-tracking outcomes after rUCLR, compared to both uninjured controls and a recent MLB pitcher cohort that underwent primary UCL surgery. 28 Overall, this study will better inform current players and teams about expectations for returning to performance after rUCLR using outcomes that help drive player evaluation throughout the league.
Methods
Study Design
Our study was deemed exempt as not human subjects research under 45 Code of Federal Regulations 46.102 by the Institutional Review Board at Columbia University Medical Center. We conducted a retrospective analysis using entirely public data on 61 MLB pitchers who underwent rUCLR performed by multiple surgeons across the league from January 2014 to November 2024, when data collection for this study were conducted. Baseball Savant (https://baseballsavant.mlb.com) and FanGraphs were used to obtain pitch-tracking data. Baseball Savant utilizes StatCast’s Trackman high-resolution camera system to track pitches. The data from these systems are compiled by MLB and released to teams and the public.1-3,11,23
Data Collection
Data collection was performed similarly to previous studies.27-29 There were 61 MLB pitchers identified with recurrent UCL injuries requiring rUCLR from January 2014 to November 2024 using a public database, which has been used previously in other studies and cross-referenced with official press releases.7,25-29,31 Descriptive data and RTP rates were collected while return-to-performance analysis required pitchers to have at least 1 qualifying season (≥100 pitches thrown) of both preoperative and postoperative pitch-tracking data, resulting in 20 pitchers included (41 pitchers excluded). RTP rates and return-to-performance analyses were conducted using data up to December 2025 and using similar methods to previous studies.27-29 The index season was defined as the qualifying season in which surgery occurred.
RTP rates at 1, 2, and 3 seasons postoperatively were determined, with RTP defined as pitching in 1 MLB game within the designated time frames for all pitchers who had revision surgery. Pitchers must have returned to the same level of competition to be counted as successfully returning to play (eg, those who only pitched in Minor League Baseball did not successfully return), and they must have surpassed the yearly time point from the surgery to be included in RTP analysis at 1, 2, or 3 years. Various advanced analytic and pitch-tracking metrics were previously defined (Table 1, Figures 1 and 2). 27 Yearly data were obtained via Baseball Savant from April 2011 to July 2025 (the index seasons were between 2014 and 2024, but preoperative and postoperative seasons required a wider range of years) as previously described.3,27-29
Definitions of Commonly Used Advanced Analytics in MLB a
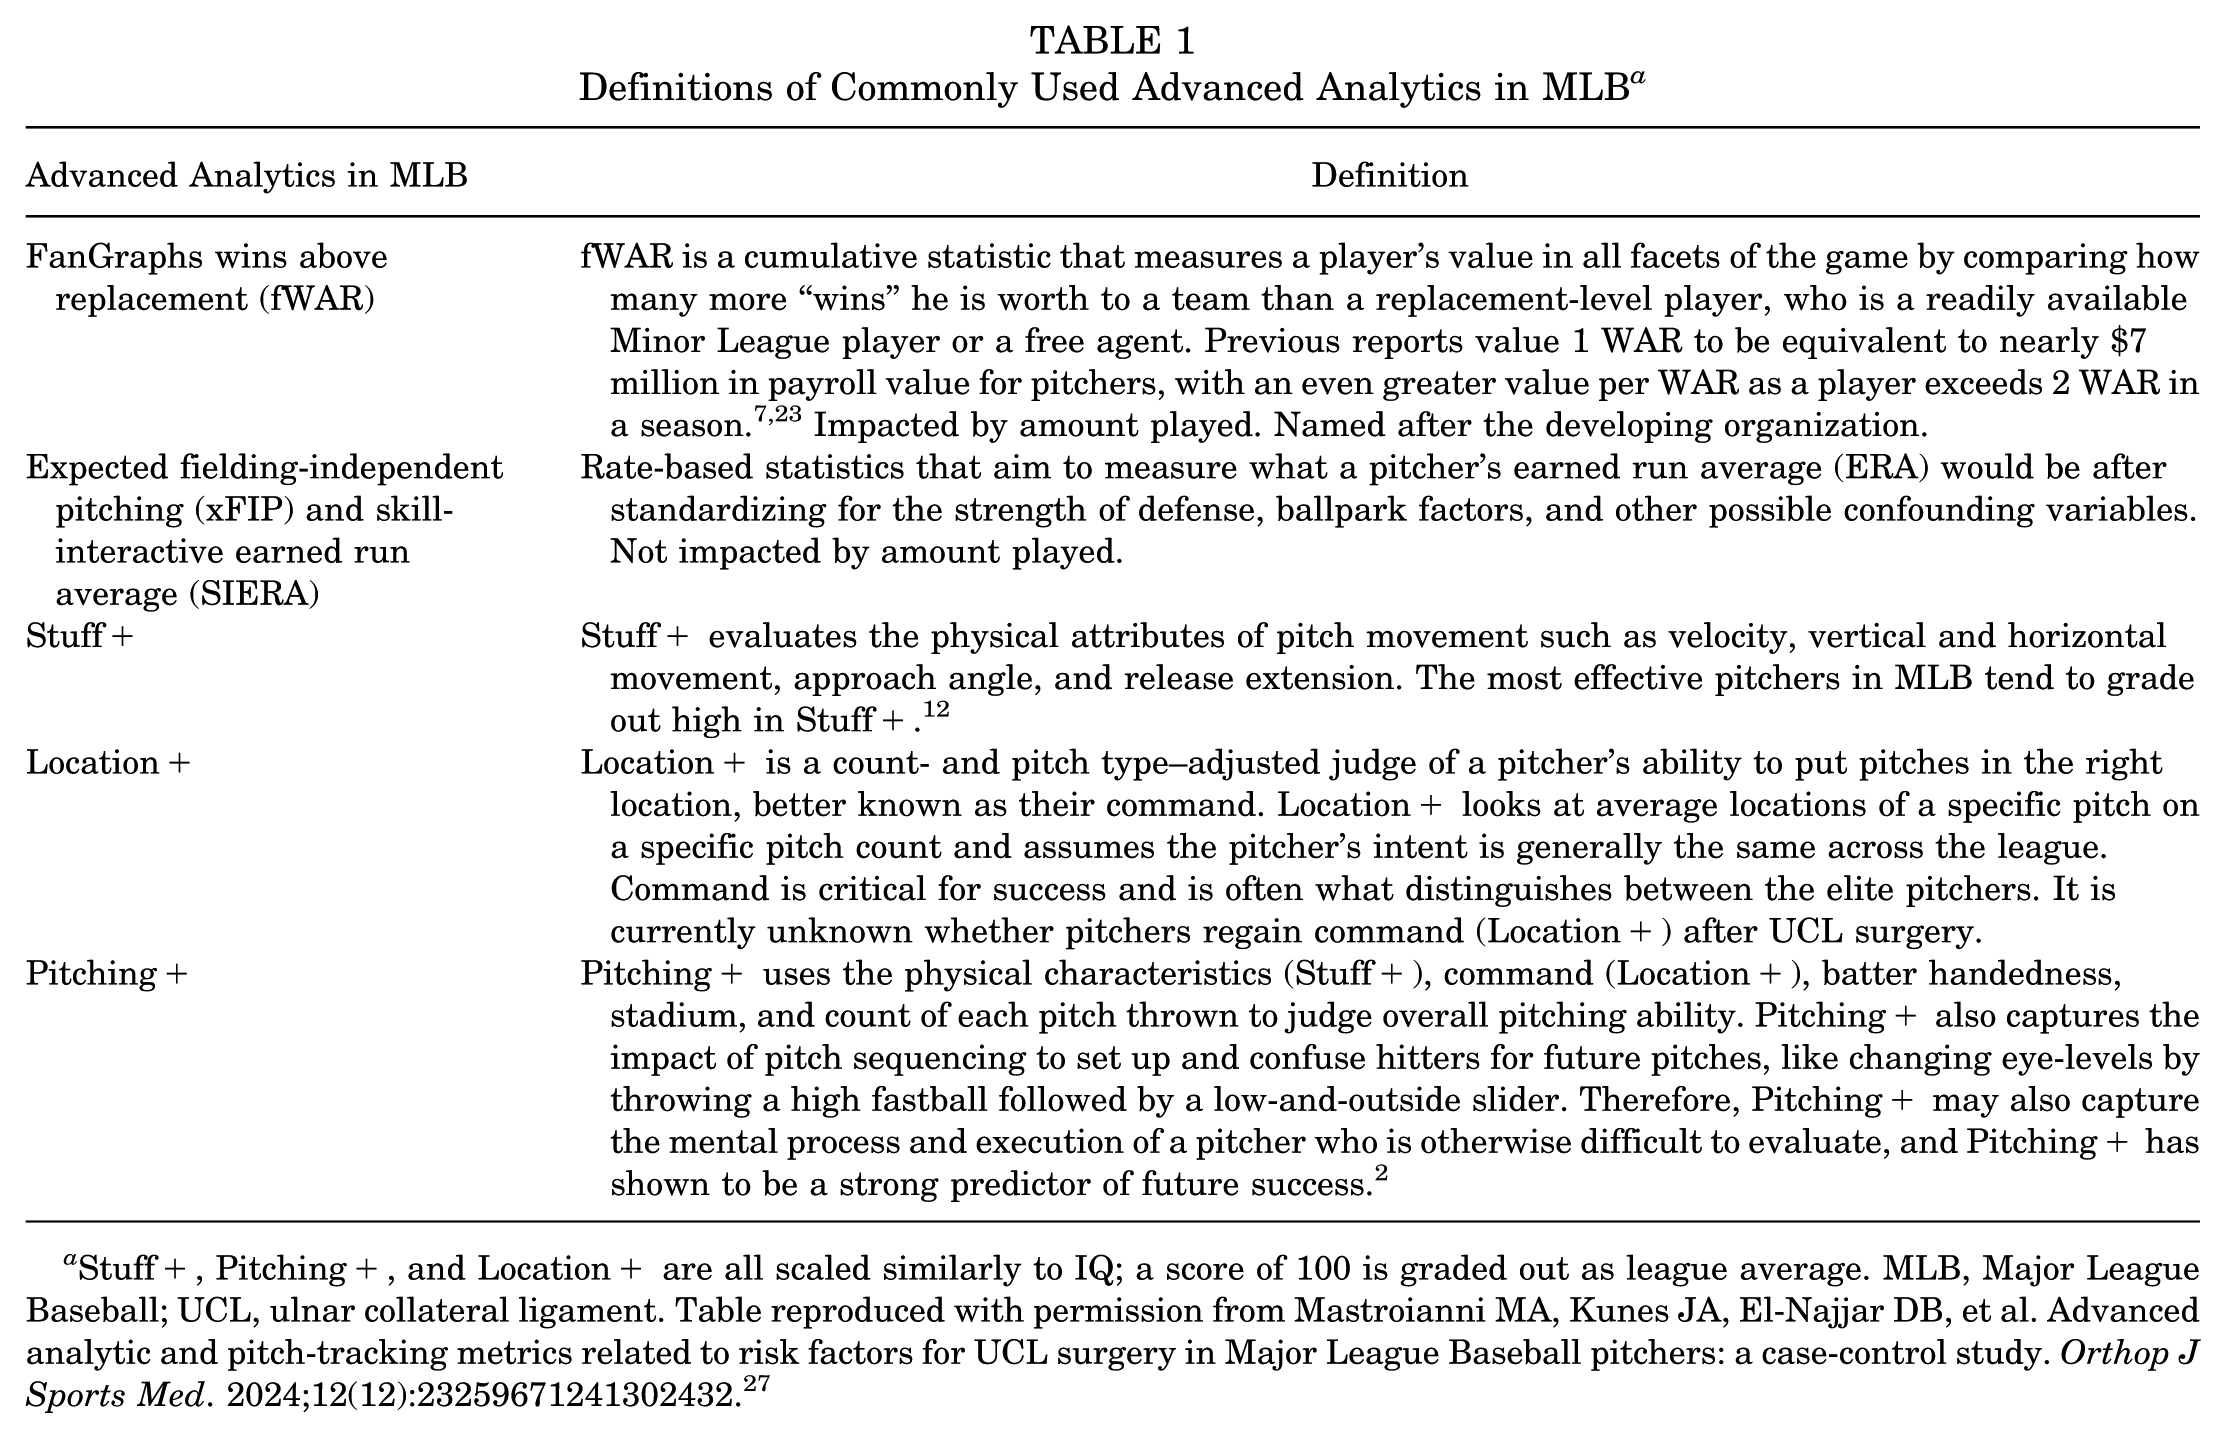
Stuff+, Pitching+, and Location+ are all scaled similarly to IQ; a score of 100 is graded out as league average. MLB, Major League Baseball; UCL, ulnar collateral ligament. Table reproduced with permission from Mastroianni MA, Kunes JA, El-Najjar DB, et al. Advanced analytic and pitch-tracking metrics related to risk factors for UCL surgery in Major League Baseball pitchers: a case-control study. Orthop J Sports Med. 2024;12(12):23259671241302432. 27
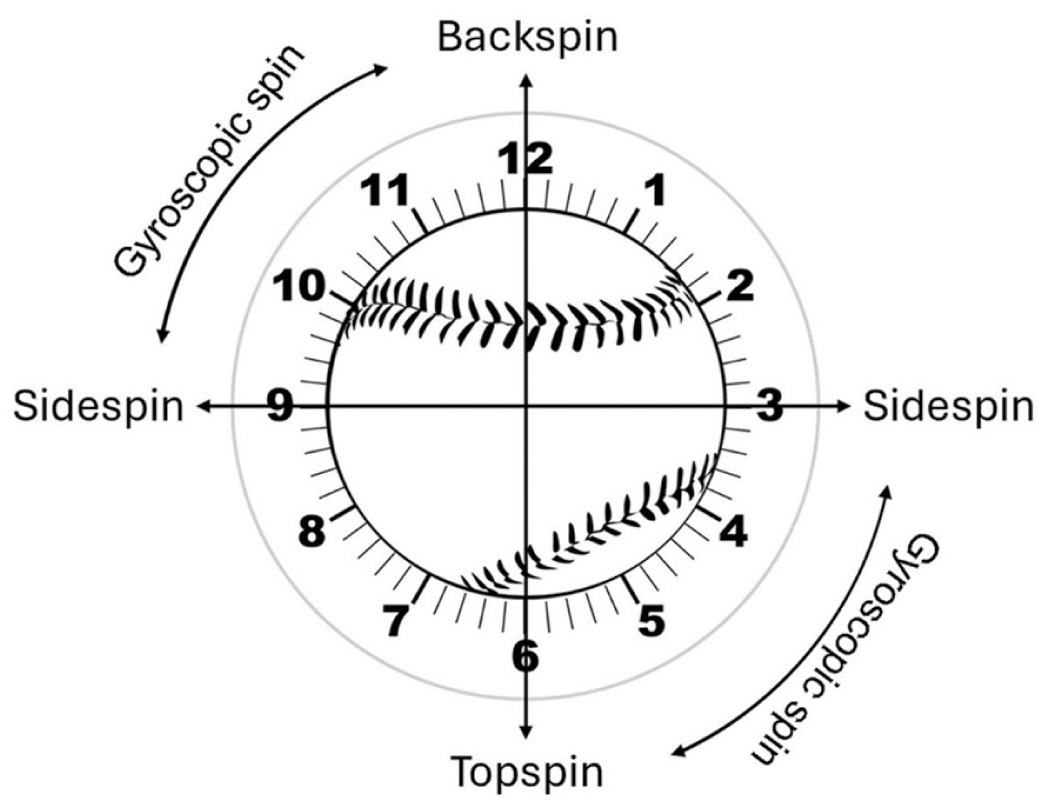
Spin pitch-tracking data. Spin rate measures revolutions of the baseball per minute. Active spin measures the percentage of spin that contributes to movement, while spin axis measures a baseball’s direction of spin in 3 dimensions. Spin axis is often described similarly to a clock (ie, 5 o’clock), which we converted into degrees to facilitate statistical analysis. Figure reproduced with permission from Mastroianni MA, Kunes JA, El-Najjar DB, et al. Advanced analytic and pitch-tracking metrics related to risk factors for UCL surgery in Major League Baseball pitchers: a case-control study. Orthop J Sports Med. 2024;12(12):23259671241302432. 27
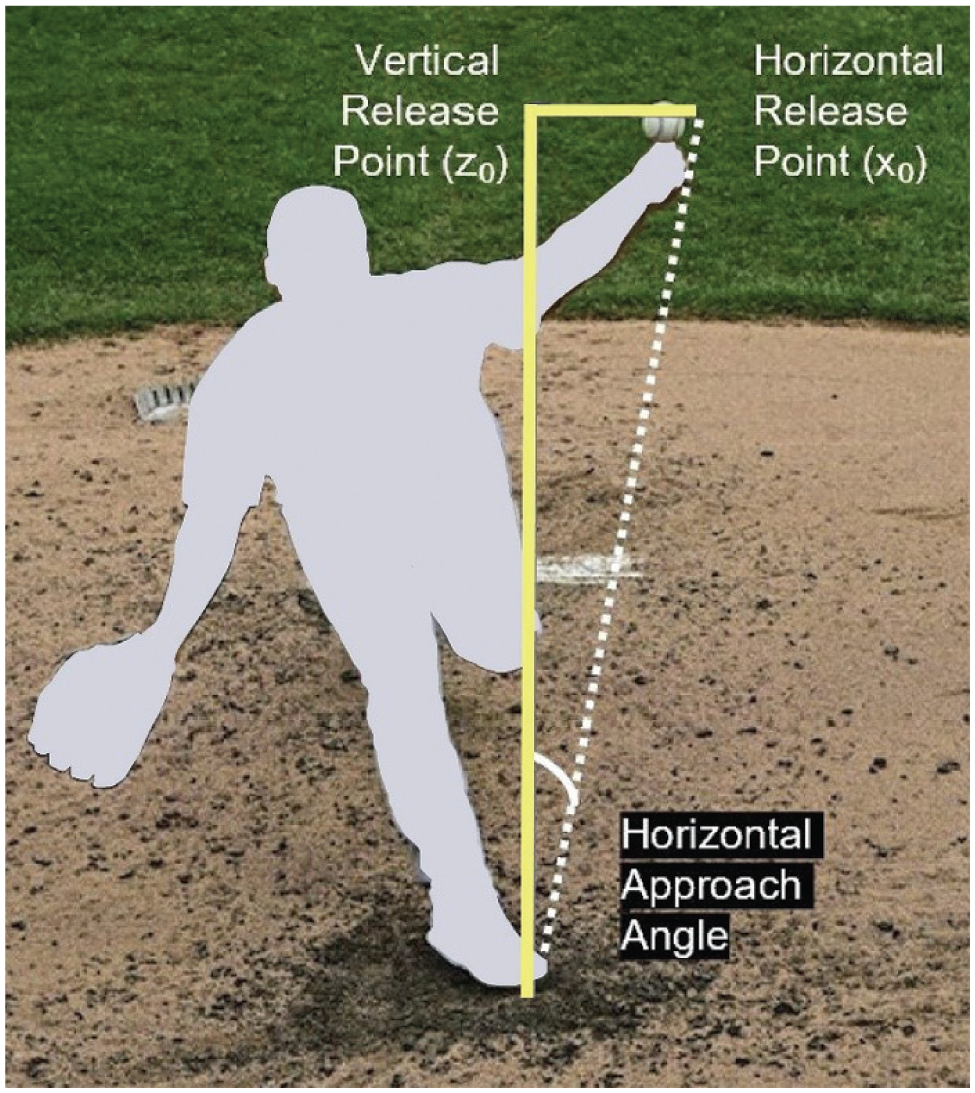
Release point, approach angle, and movement pitch-tracking data. These metrics are measured from the catcher’s point of view. Horizontal and vertical release points are measured as the relative distances between the point in which a pitcher releases the ball relative to home plate. Horizontal and vertical movements are the amount a pitch moves from the time a pitcher releases the ball to the moment it crosses home plate. Vertical approach angle describes the angle from which a pitcher releases the ball to when it crosses home plate vertically, while horizontal approach angle captures the same horizontally. Release extension quantifies how close a pitcher’s release point is to home plate; a pitcher with a longer release extension shortens the distance between them and the batter, leading to an increased perceived velocity of the pitch. Figure reproduced with permission from Mastroianni MA, Kunes JA, El-Najjar DB, et al. Advanced analytic and pitch-tracking metrics related to risk factors for UCL surgery in Major League Baseball pitchers: a case-control study. Orthop J Sports Med. 2024;12(12):23259671241302432. 27
Control Group
An uninjured cohort matched 2:1 by season, age, position, handedness, and pitch count was selected randomly as controls, consistent with prior studies to control for known risk factors of UCL injury.7,26,27,29,31 Uninjured controls were selected first by index year of surgery as the matched pitcher in the rUCLR surgery cohort. Next, pitching position (starting or relief) and handedness, followed by age and the most comparable number of pitches in the index season, were used to generate our matched control group after randomly selecting eligible controls. Descriptive and pitch-tracking data for the control pitchers were collected in the same way as for the rUCLR cohort. Matched uninjured controls were used to establish a baseline for normal season-to-season variation in each metric to be used for comparison to rUCLR. We also compared RTP and performance after rUCLR to RTP and performance after primary UCL surgery in a cohort of 129 MLB pitchers reported in a previous study from the 2018 to 2023 seasons, when the majority of public pitch-tracking metrics became public. 28
Statistical Analysis
The pre-revision season (T1) was compared to the index season of injury and the first (M1), second (M2), and third (M3) postoperative qualifying seasons (ie, seasons with ≥100 pitches thrown). The means for each season and then the means for changes in between seasons were compared using paired t tests, while proportions were compared using chi-square tests. Further return-to-performance analysis was conducted for the M1, M2, and M3 seasons to illustrate the percentage of pitchers who returned to their T1 performance for a number of important metrics, as previously defined. This analysis provides insight into the proportion of pitchers who adequately return to performance, rather than standard means and standard deviations that can be impacted by outliers. Returning to performance for each metric was defined similarly to previous studies.27-29
Binary logistic regression was used to identify predictors of return to performance of FanGraphs wins above replacement (fWAR) in any postoperative season (M1, M2, or M3). We selected fWAR to evaluate return to performance because it represents both cumulative and qualitative performance metrics and is largely utilized throughout the MLB to determine a player’s value in a particular season.2,3,13 To complement fWAR, which is workload dependent, we utilized expected fielding-independent pitching (xFIP) as a rate-based secondary endpoint. Expected FIP is a defense and sequence-adjusted estimator of a pitcher’s run prevention skill measured similarly to earned run average (ERA), but is widely regarded as a more accurate advanced analytic measure of pitching performance.
To address the limited number of events for both of our logistic regression models, we used the penalized likelihood logistic regression of Firth, a bias reduction method that applies a Jeffreys prior penalty to the likelihood. Compared with standard maximum-likelihood estimates, Firth regression yields finite, less biased coefficient estimates in small samples and produces more reliable inferences under sparse data conditions. We report odds ratios with 95% confidence intervals calculated using the Firth penalized likelihood method. In the model, return to performance was defined as achieving ≥90% of preoperative fWAR in any postoperative season (M1, M2, or M3). Firth logistic regression modeled return to performance with age, position (starter vs reliever), career innings pitched, velocity, and spin rate as predictors.
To account for the longitudinal structure and repeated measurements within pitchers, separate linear mixed-effects models were fit for each performance metric. Each model included fixed effects for time point (T1, index season, M1, and M2), age, and position (starter vs reliever), with age and position coded at each time point to allow these covariates to vary across seasons. A random intercept for pitcher was specified to account for within-player correlation due to repeated measures. This framework estimates mean changes in each performance metric over time while controlling for age and position at each time point, and adjusts simultaneously for between-pitcher differences (eg, some players are older or typically starters) and within-pitcher changes (eg, role transitions and aging) over time.
All data analyses were performed using Python statistical software and Microsoft Excel. Statistical significance was set at a P value of .05; P values between .05 and .10 were interpreted as trend-level evidence for logistic models with sparse events.
Results
Characteristics and RTP
Characteristics and RTP outcomes were evaluated in 61 MLB pitchers who underwent rUCLR from January 2014 to November 2024 compared to 122 matched uninjured controls and 129 MLB pitchers who underwent primary UCL surgery from the 2018 to 2023 seasons (Table 2). Return-to-performance outcomes were evaluated in 20 MLB pitchers who underwent rUCLR compared to 40 uninjured matched controls and 54 MLB pitchers who underwent primary UCL surgery after meeting inclusion criteria. The mean age in the rUCLR cohort was 28.00 ± 4.16 years, 74% of included pitchers were right-handed, and 46% were starting pitchers. The mean age of primary UCL surgery for the rUCLR cohort was significantly younger than the mean age of the primary UCL surgery cohort (P < .001). Descriptive details including age, height, weight, handedness, and pitching role (starter vs reliever) for all cohorts are presented in Table 2. There were no other significant demographic differences in any of the cohorts, or in the cohorts analyzed for return to performance (P > .10). Of the 61 MLB pitchers who underwent rUCLR, 1.6% returned to play at 1 year, 44.1% returned to play at 2 years, and 63.2% returned to play at 3 years postoperatively, with a mean time to RTP of 605 ± 163 days (Table 2). When compared to pitchers who underwent primary UCL surgery, rUCLR resulted in significantly reduced RTP rates at 2 years (P < .001) and 3 years (P = .01). Pitchers who underwent rUCLR also had a significantly longer recovery after their primary UCL surgery than what was seen in the primary UCL surgery cohort (P = .02) (Table 2).
Characteristics and RTP of MLB Pitchers Who Underwent a UCL Repair or Reconstruction in the Past 5 Seasons a
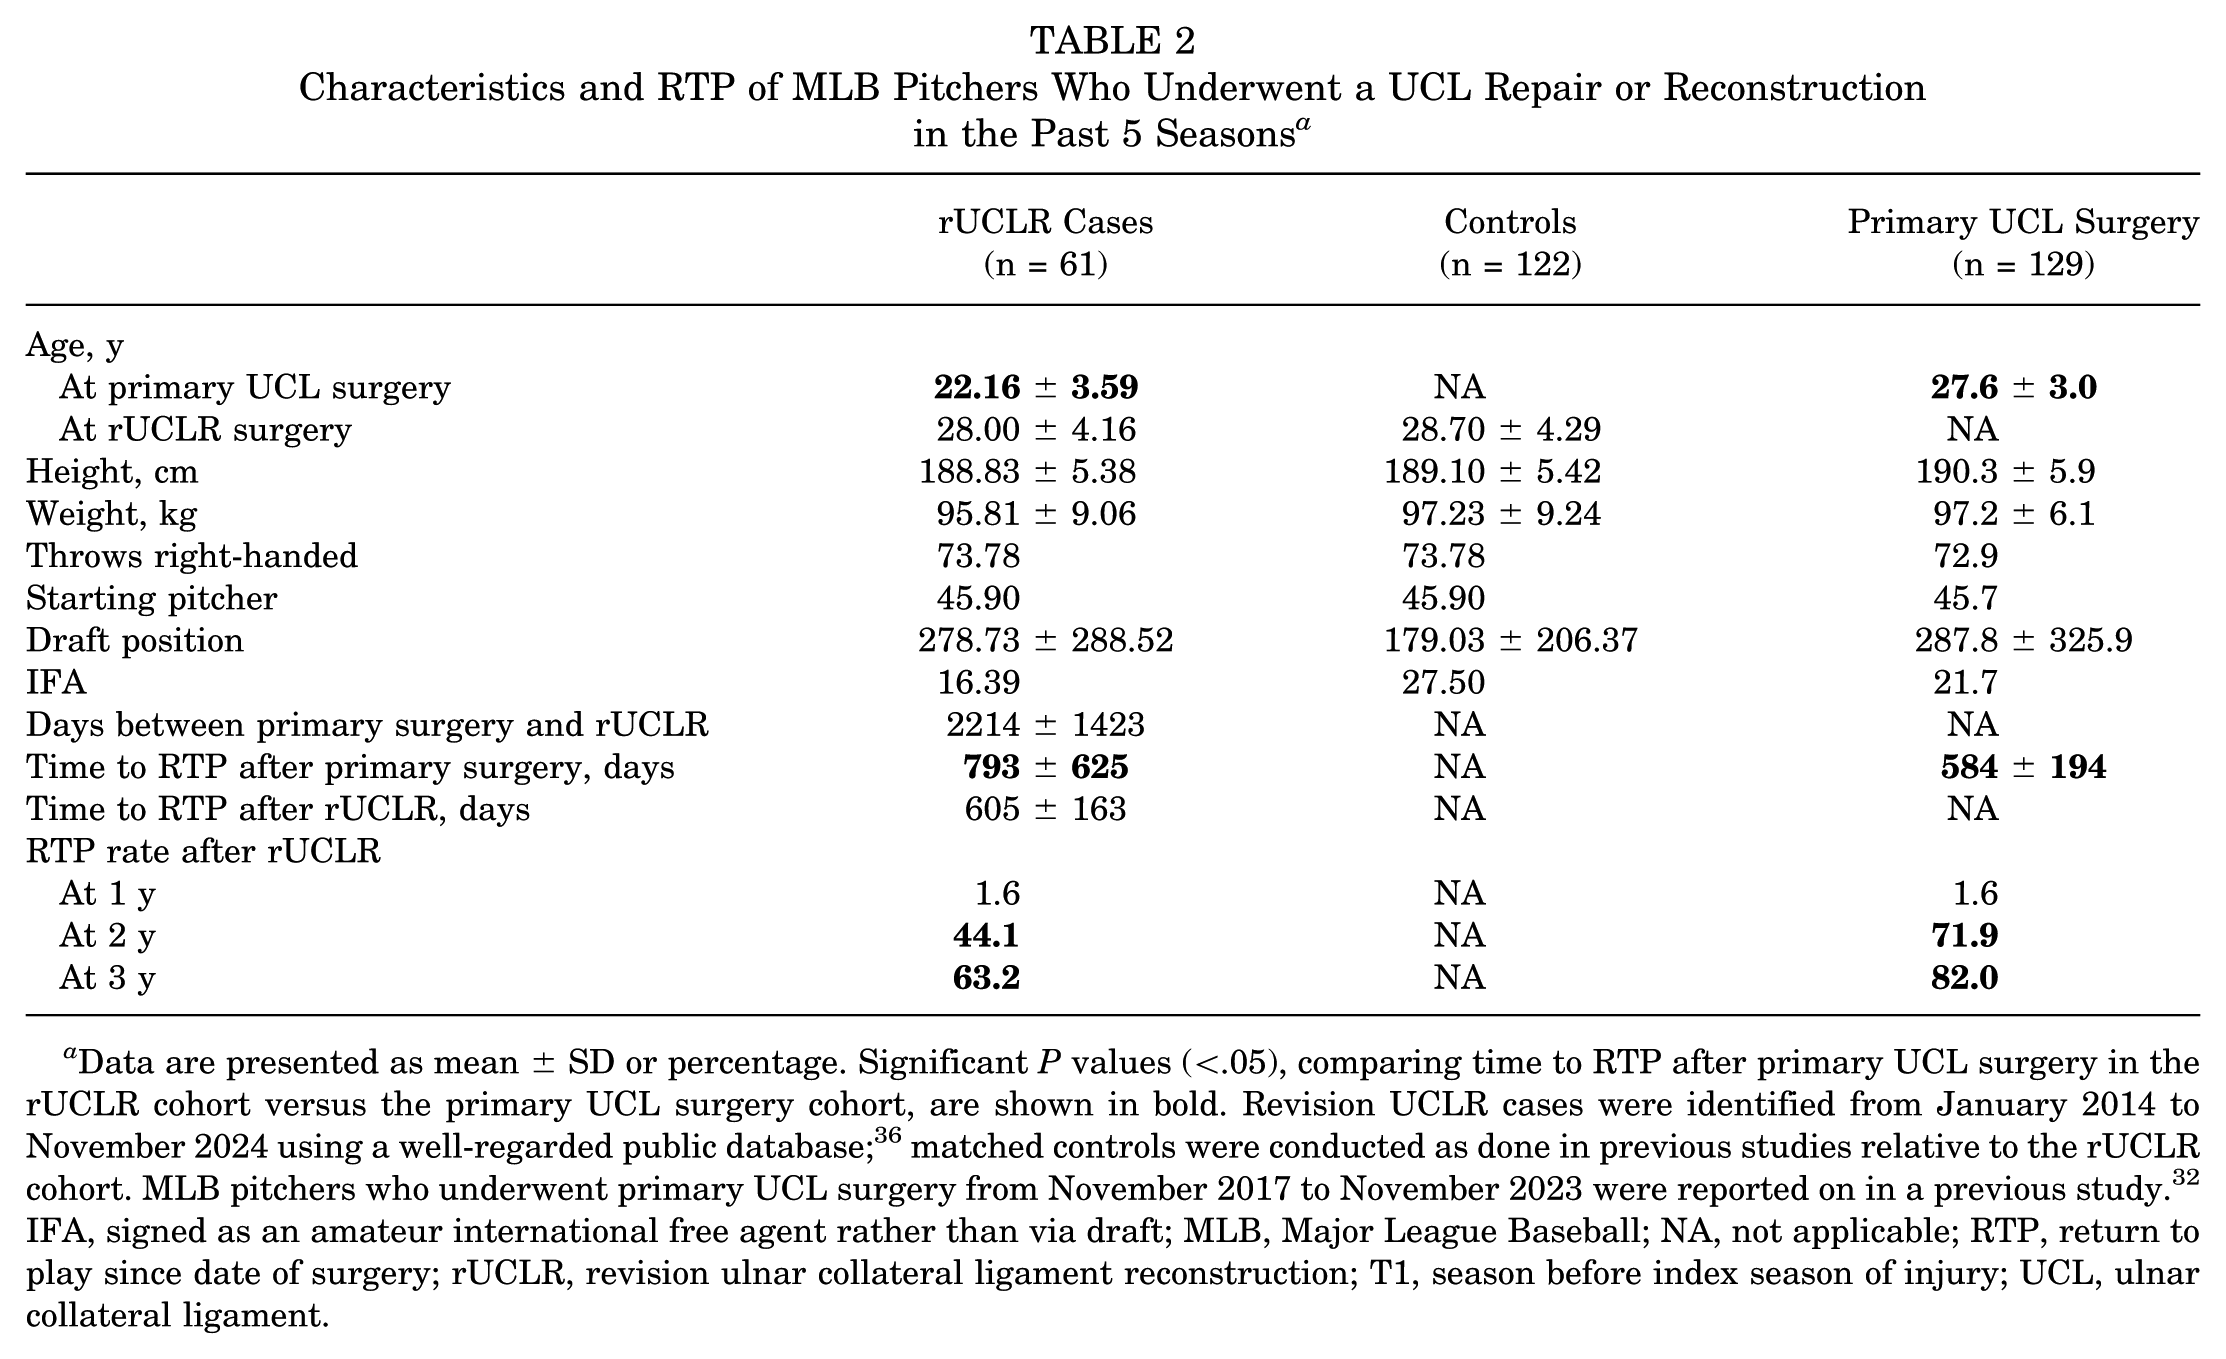
Data are presented as mean ± SD or percentage. Significant P values (<.05), comparing time to RTP after primary UCL surgery in the rUCLR cohort versus the primary UCL surgery cohort, are shown in bold. Revision UCLR cases were identified from January 2014 to November 2024 using a well-regarded public database;36 matched controls were conducted as done in previous studies relative to the rUCLR cohort. MLB pitchers who underwent primary UCL surgery from November 2017 to November 2023 were reported on in a previous study. 32 IFA, signed as an amateur international free agent rather than via draft; MLB, Major League Baseball; NA, not applicable; RTP, return to play since date of surgery; rUCLR, revision ulnar collateral ligament reconstruction; T1, season before index season of injury; UCL, ulnar collateral ligament.
Return to Performance
Compared with preoperative performance (T1), pitchers undergoing revision UCLR demonstrated significant declines in pitch count (P = .008), innings pitched (P = .009), and fWAR (P = .002) in their first postoperative season (M1), accompanied by increases in xFIP (P = .009) and SIERA (P = .019). There was also a reduction in Stuff+ (P = .021), but pitchers maintained their Pitching+ and Location+. In the second postoperative season (M2), fWAR (P = .014), xFIP (P = .010), and SIERA (P = .015) remained significantly worse than T1, while the decline in Stuff+ from T1 to M2 approached statistical significance (P = .053). Pitch count (P = .103) and innings pitched (P = .138) were no longer significantly different from T1, and Pitching+ and Location+ remained not significantly different from T1 (Table 3).
Pre- and Postoperative Advanced Analytic Performance Data After UCL Injury a
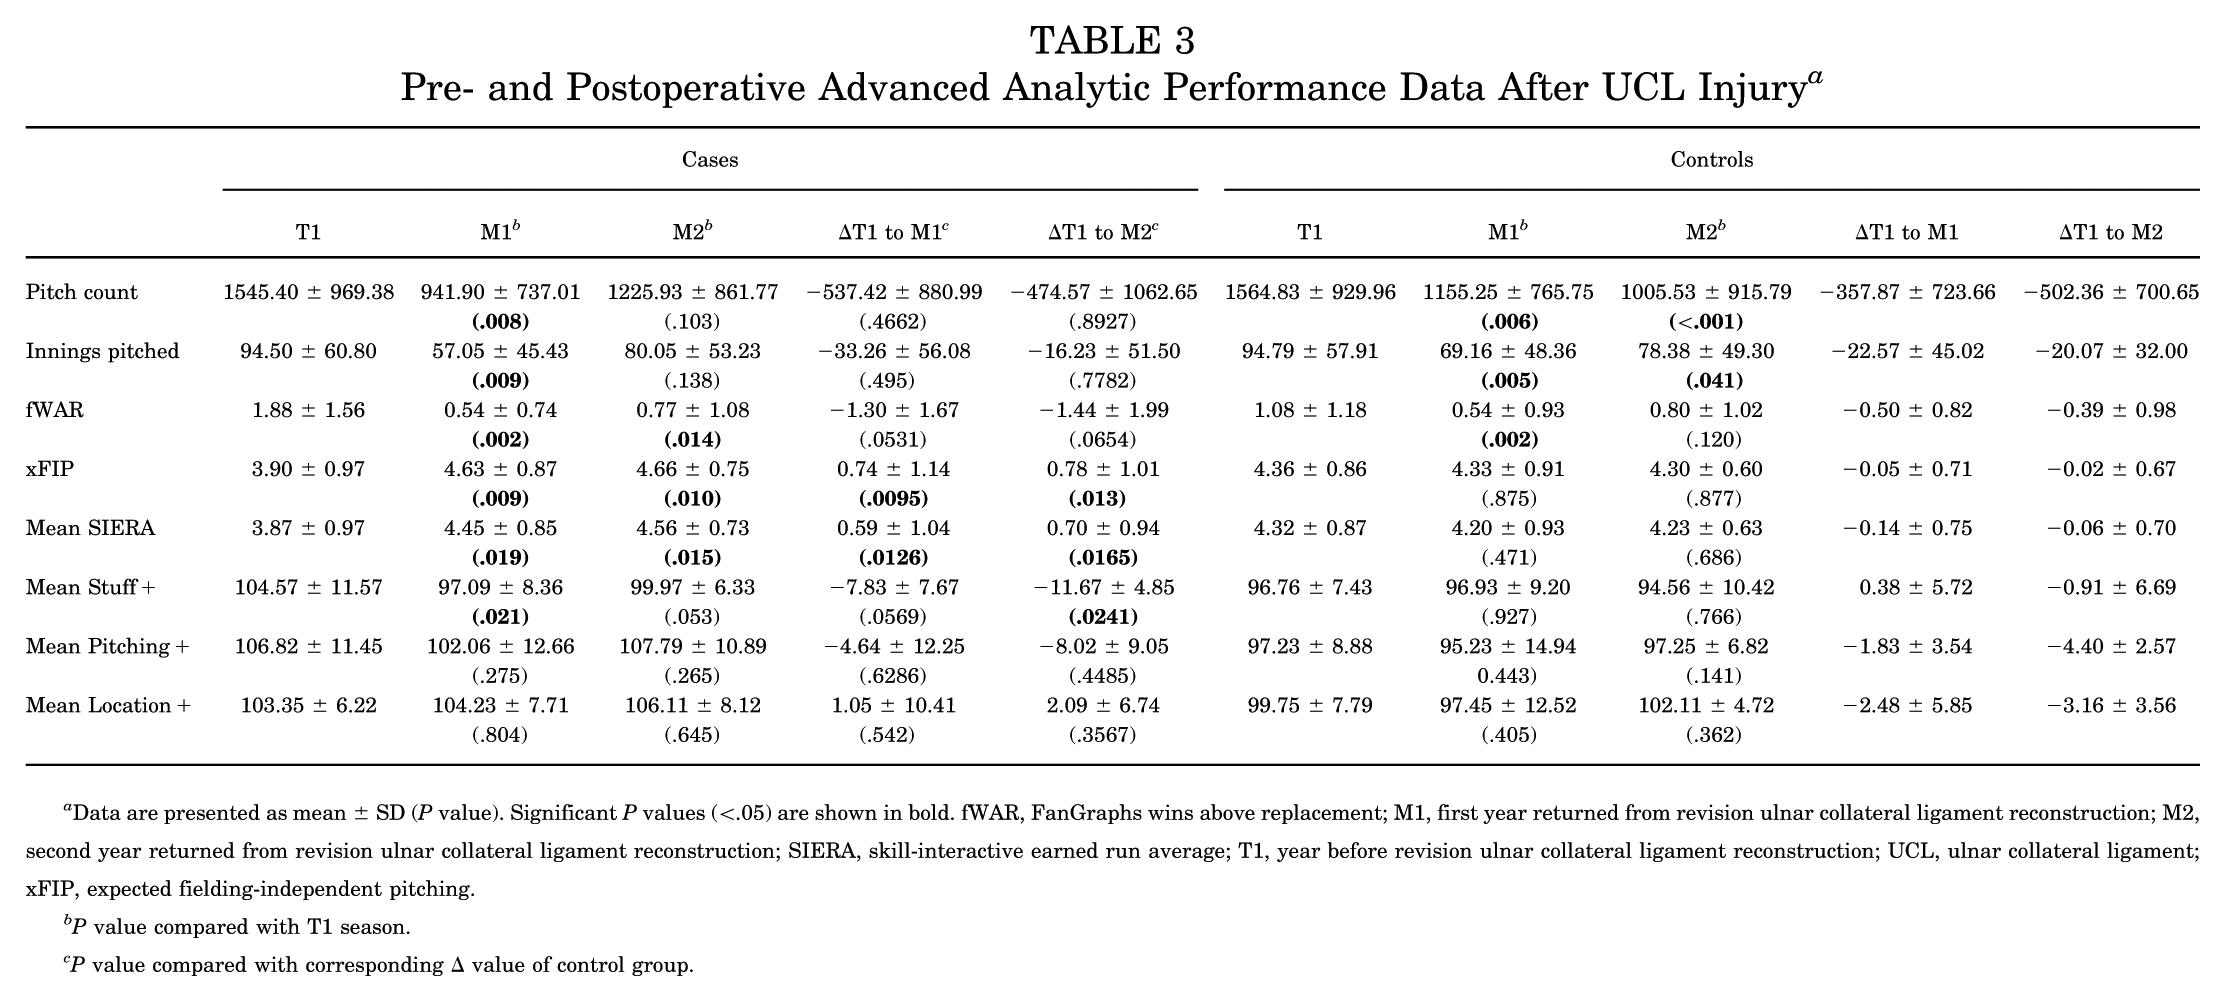
Data are presented as mean ± SD (P value). Significant P values (<.05) are shown in bold. fWAR, FanGraphs wins above replacement; M1, first year returned from revision ulnar collateral ligament reconstruction; M2, second year returned from revision ulnar collateral ligament reconstruction; SIERA, skill-interactive earned run average; T1, year before revision ulnar collateral ligament reconstruction; UCL, ulnar collateral ligament; xFIP, expected fielding-independent pitching.
P value compared with T1 season.
P value compared with corresponding Δ value of control group.
When comparing the change in workload and advanced analytic metrics from T1 to M1 between cases and matched controls (Table 3), cases showed significantly greater increases (worsening performance) in xFIP (P = .0095) and SIERA (P = .0126), while the declines in fWAR (P = .0531) and Stuff+ (P = .0569) approached significance. The change from T1 to M1 for pitch count and innings pitched showed no significant difference in cases when compared with controls, despite cases showing a significant decline in the paired t tests without controls for comparison. The change in Pitching+ and Location+ was not significant for cases compared to controls. Similarly, the change from T1 to M2 was significantly worse in cases for xFIP (P = .013), SIERA (P = .0165), and Stuff+ (P = .0241) compared with controls, while the change for fWAR (P = .0654) approached significance. No significant differences between cases and controls were observed for pitch count, innings pitched, Pitching+, or Location+.
On average, MLB pitchers retained their velocity, spin rates, active spin, spin axis, vertical and horizontal movement, horizontal release points, VAA, and VAA above average. Cases had a lower vertical release point, along with a greater HAA, HAA above average, and release extension (P < .05) (Table 4) during the M1 and M2 seasons.
Pre- and Postoperative Pitch-Tracking Data After rUCLR Versus Uninjured Matched Controls a
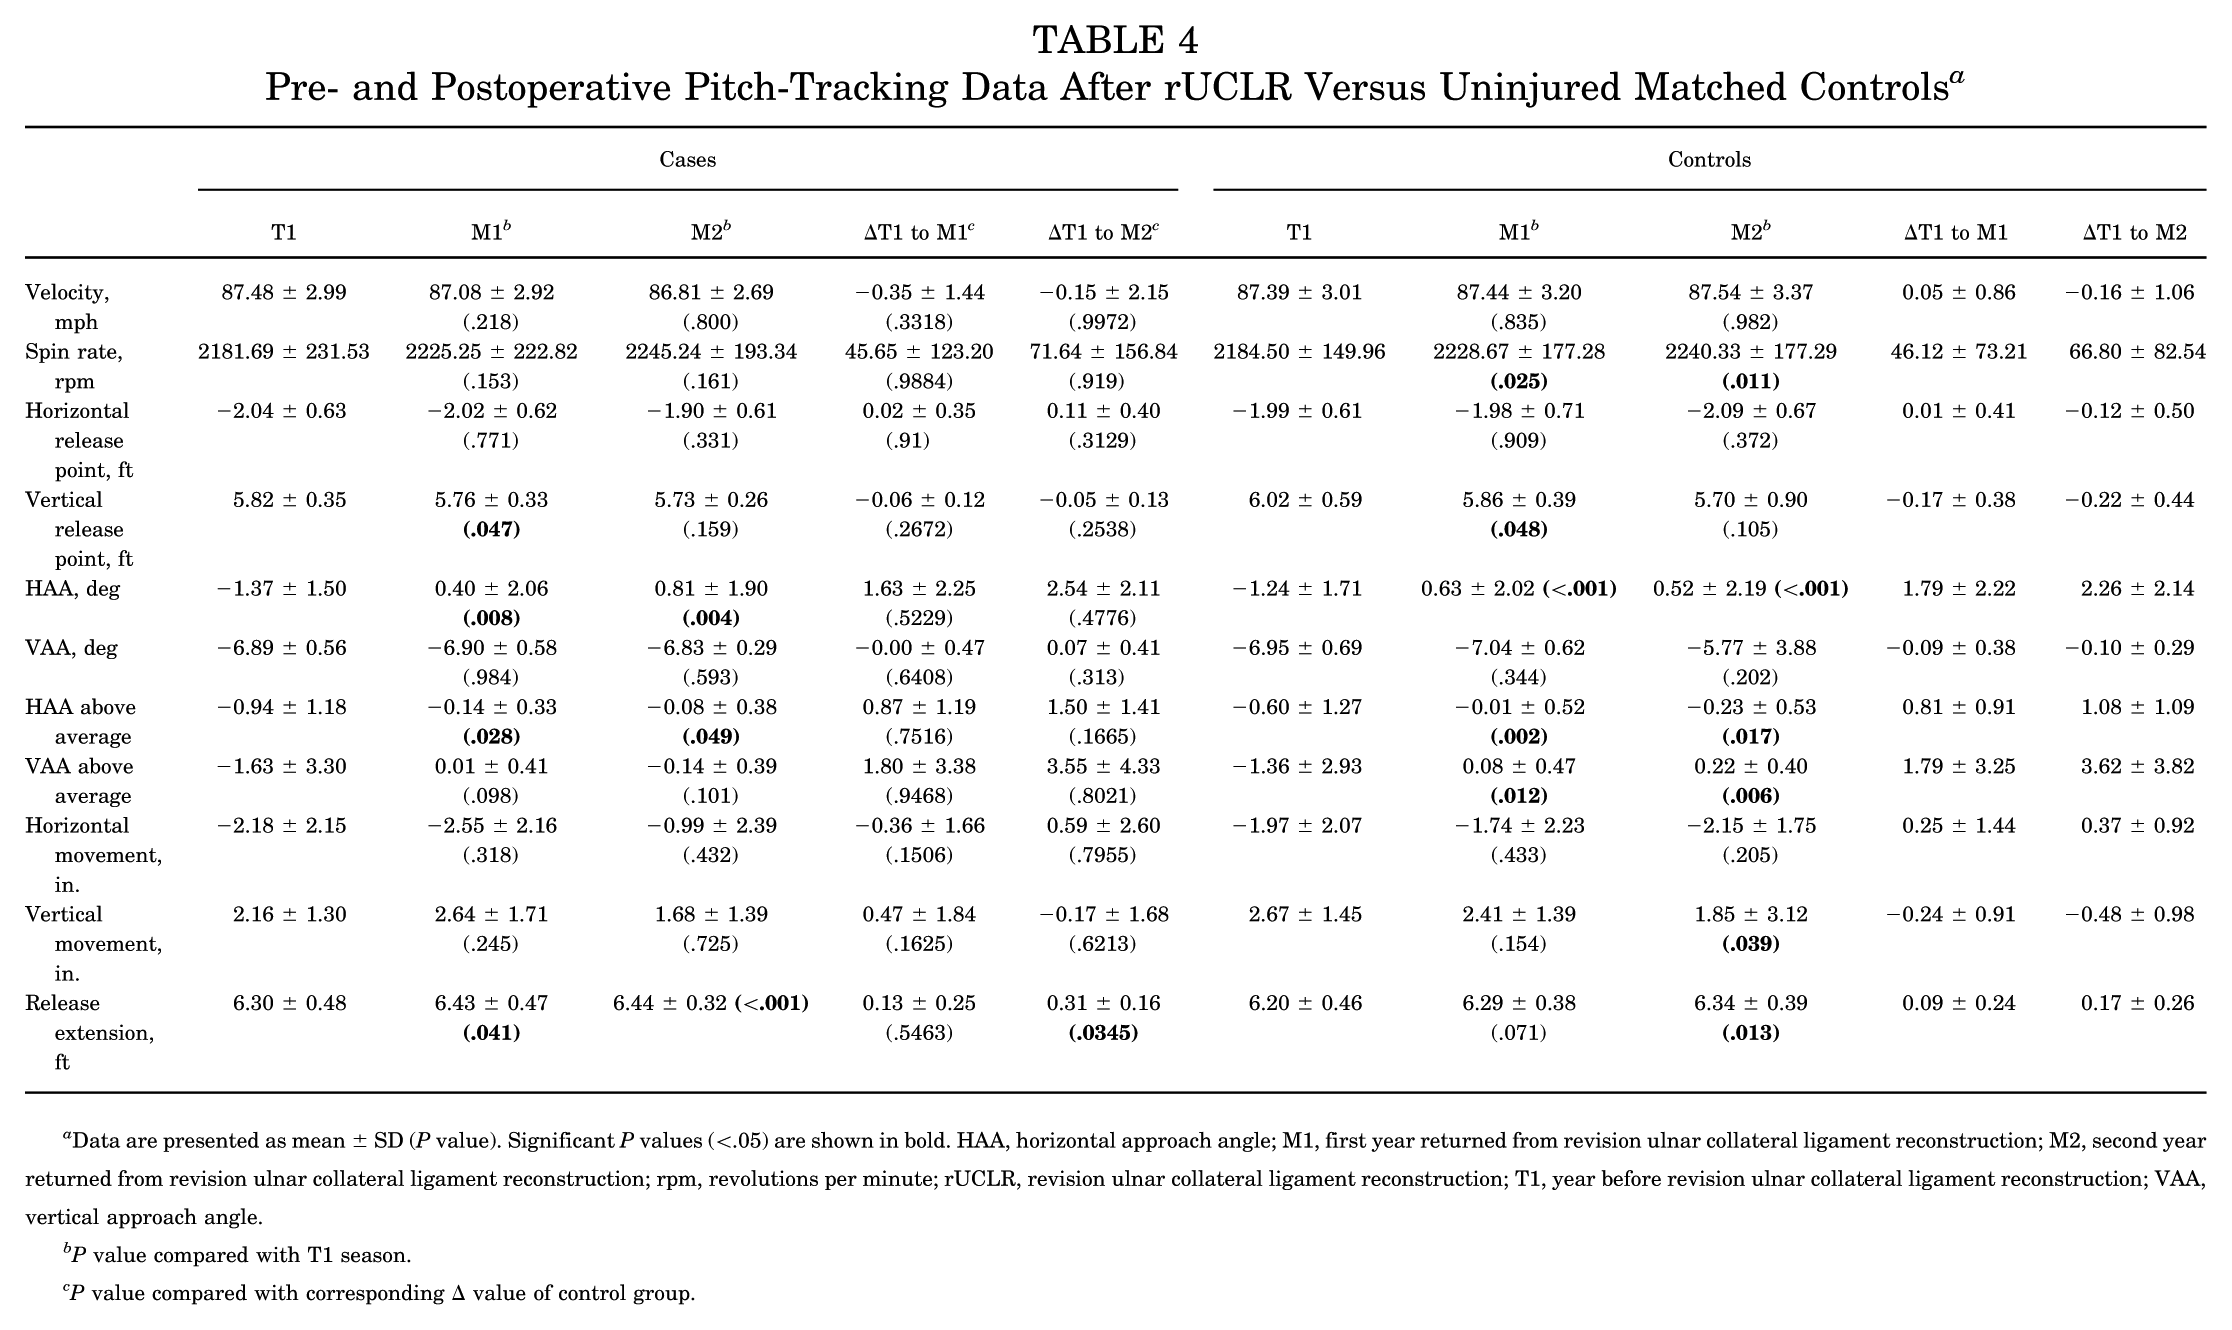
Data are presented as mean ± SD (P value). Significant P values (<.05) are shown in bold. HAA, horizontal approach angle; M1, first year returned from revision ulnar collateral ligament reconstruction; M2, second year returned from revision ulnar collateral ligament reconstruction; rpm, revolutions per minute; rUCLR, revision ulnar collateral ligament reconstruction; T1, year before revision ulnar collateral ligament reconstruction; VAA, vertical approach angle.
P value compared with T1 season.
P value compared with corresponding Δ value of control group.
Further return-to-performance analysis during the M1, M2, and M3 seasons was then conducted to evaluate when pitchers returned to a similar performance level as the season before injury (Table 5). During the M3 season, pitchers returned to performance compared with their pre-revision form in pitch count (42.9% of players successfully returned), xFIP (42.9%), fWAR (14.3%), velocity (85.7%), fastball velocity (71.4%), horizontal movement (42.9%), vertical movement (85.7%), spin rate (100%), Stuff+ (33.3%), Location+ (66.7%), and Pitching+ (33.3%) to varying degrees. Only 12.5%, 9.1%, and 16.7% of pitchers returned to full performance during the M1, M2, and M3 seasons, respectively. Firth penalized likelihood logistic regression (Table 6) did not identify any preoperative factors associated with return to fWAR in any postoperative season (M1, M2, or M3); however, increased spin rate demonstrated a positive association with return to performance and trended toward significance (OR, 1.004; P = .07).
Return to Performance of Advanced Analytic and Pitch-Tracking Metrics for the First 3 Seasons After Returning From rUCLR a
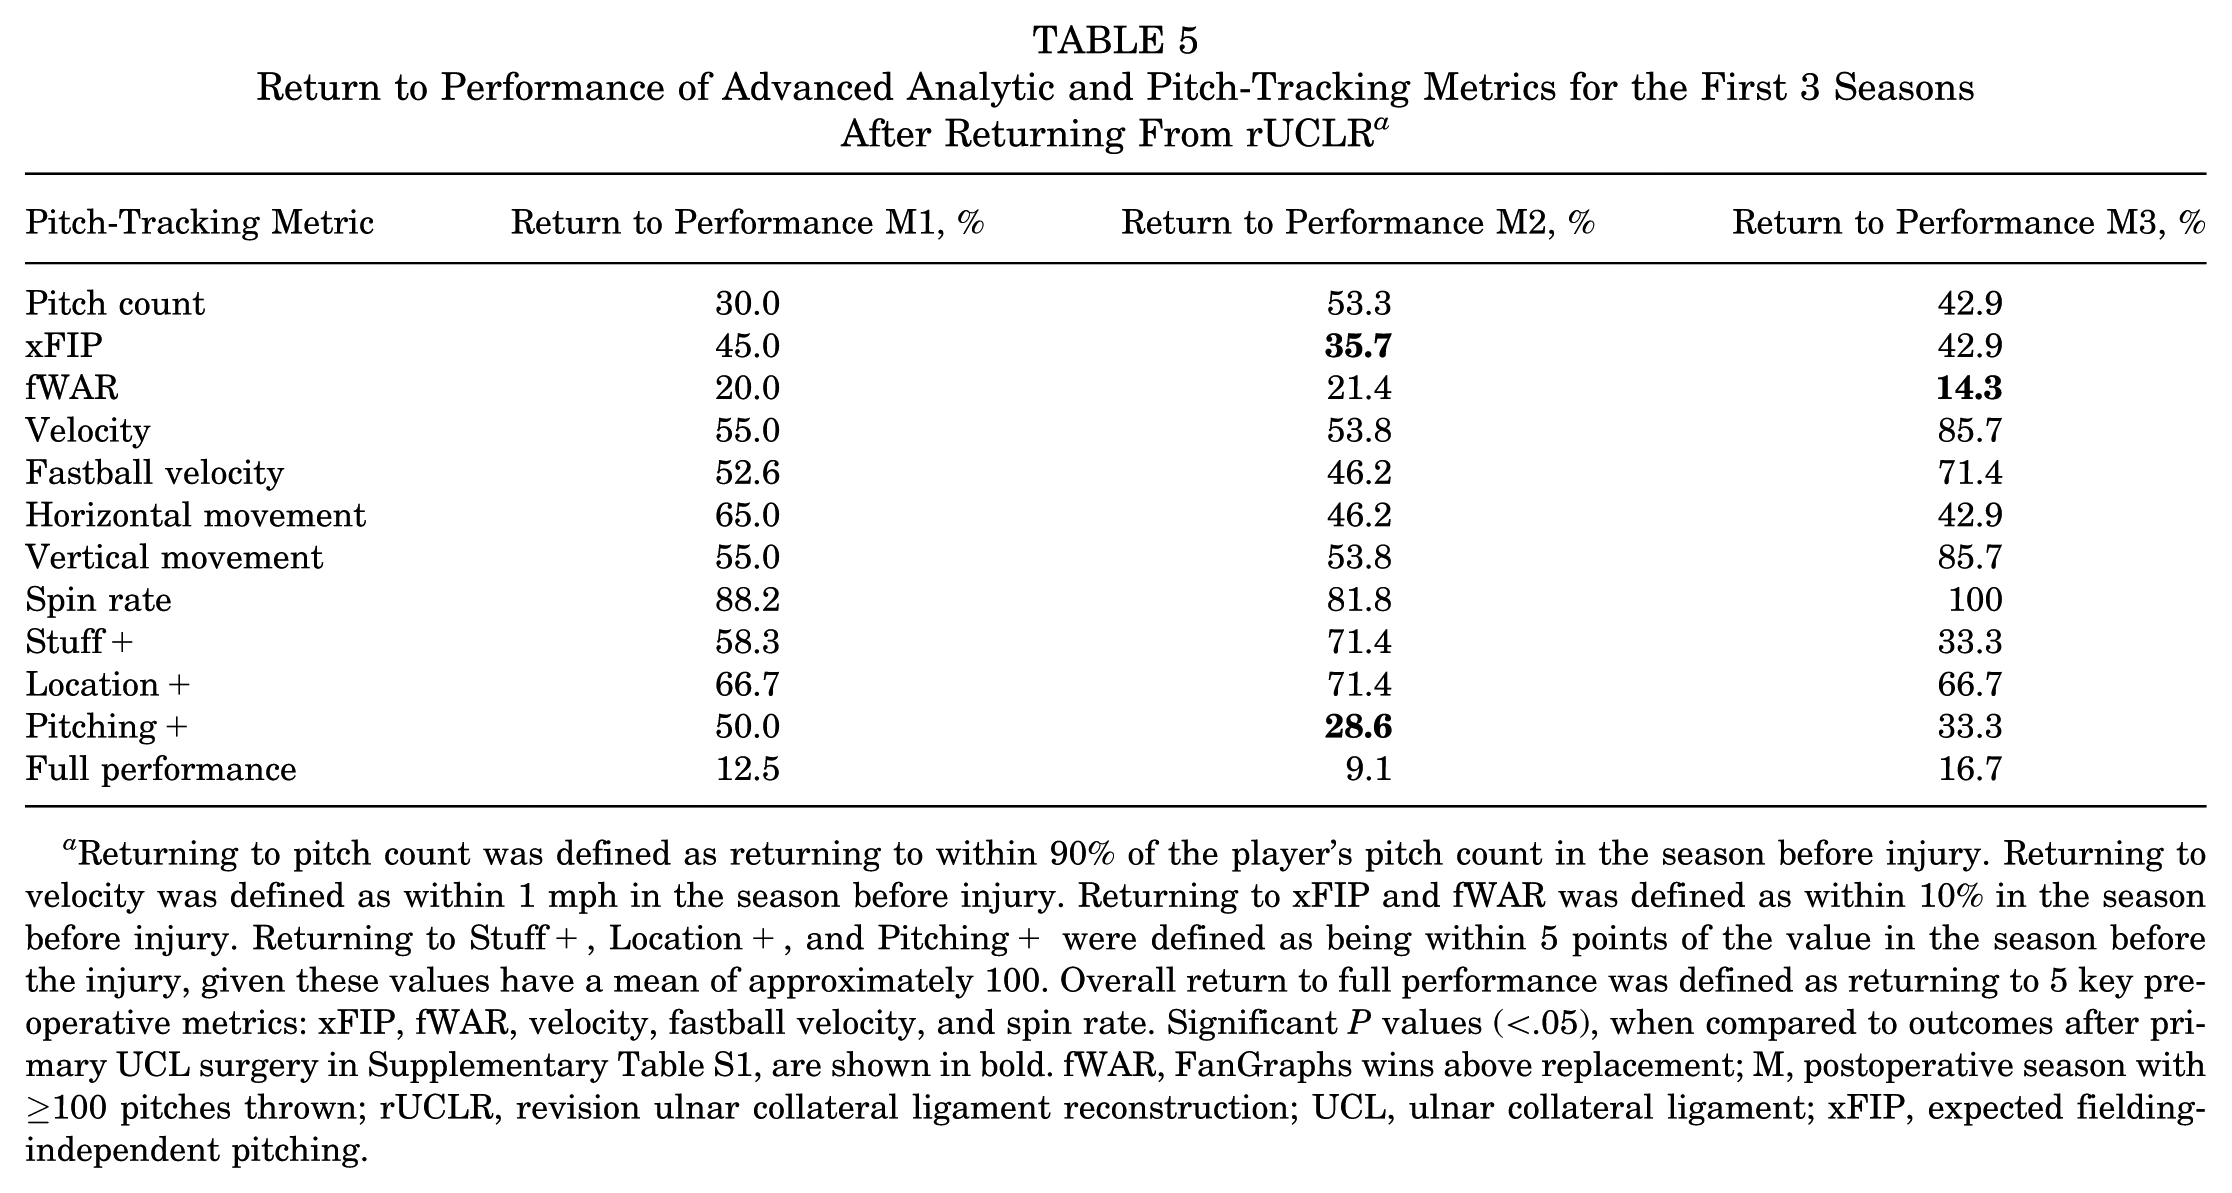
Returning to pitch count was defined as returning to within 90% of the player’s pitch count in the season before injury. Returning to velocity was defined as within 1 mph in the season before injury. Returning to xFIP and fWAR was defined as within 10% in the season before injury. Returning to Stuff+, Location+, and Pitching+ were defined as being within 5 points of the value in the season before the injury, given these values have a mean of approximately 100. Overall return to full performance was defined as returning to 5 key preoperative metrics: xFIP, fWAR, velocity, fastball velocity, and spin rate. Significant P values (<.05), when compared to outcomes after primary UCL surgery in Supplementary Table S1, are shown in bold. fWAR, FanGraphs wins above replacement; M, postoperative season with ≥100 pitches thrown; rUCLR, revision ulnar collateral ligament reconstruction; UCL, ulnar collateral ligament; xFIP, expected fielding-independent pitching.
Preoperative Pitching Metrics Associated With Return to fWAR in M1, M2, or M3 Season After rUCLR a
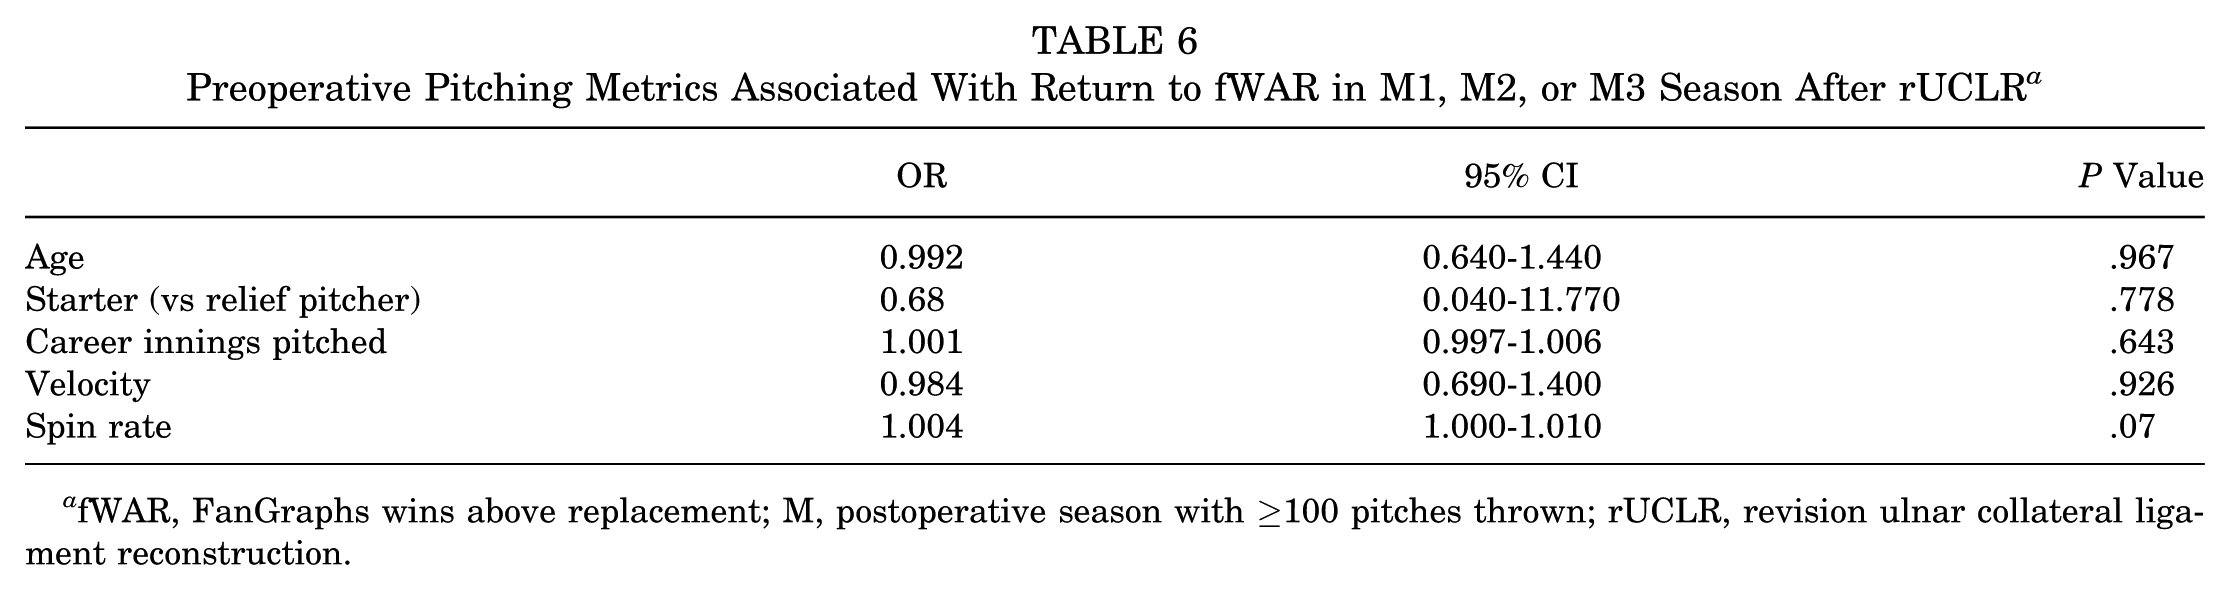
fWAR, FanGraphs wins above replacement; M, postoperative season with ≥100 pitches thrown; rUCLR, revision ulnar collateral ligament reconstruction.
When comparing return-to-performance percentages after rUCLR versus primary UCL surgery (Supplementary Table S1, Table 5), significantly fewer pitchers returned to performance in xFIP (P = .05) during the M2 season. There was a trend toward fewer pitchers returning to performance in Pitching+ (P = .10) during the M2 season and fWAR (P = .10) during the M3 season after rUCLR compared to primary UCL surgery as well. Although pitchers generally fared better after primary UCL surgery, there were no significant differences in innings pitched (P = .67 during M2), overall velocity (P = .43), fastball velocity (P = .12), movement (P = .47), spin rate (P = .78), Stuff+ (P = .31), Location+ (P = .58), or full performance (P = .31) during any of the M1 to M3 seasons.
Linear mixed-effects models were used to assess longitudinal changes in workload, performance, and pitch characteristics relative to the preinjury reference season (T1), adjusting for age at surgery and pitching role (starter vs reliever). Pitchers demonstrated lower workload after surgery (Table 7). Pitch count was significantly reduced at index (β = −912.0; P < .001) and M1 (β = −559.9; P = .006) versus T1, with no significant difference by M2 (β = −284.6; P = .206). Pitchers also showed a significant reduction in performance-based metrics after surgery. FanGraphs WAR (Table 8) was lower at index (β = −1.46; P < .001), M1 (β = −1.38; P < .001), and M2 (β = −1.20; P = .001). Additionally, xFIP (Table 9) increased at M1 (β = 0.85; P = .001) and M2 (β = 0.91; P = .002), and SIERA (Supplementary Table S2) also increased at M1 (β = 0.72; P = .001) and M2 (β = 0.85; P = .001).
Linear Mixed-Effects Models for Pitch Count a
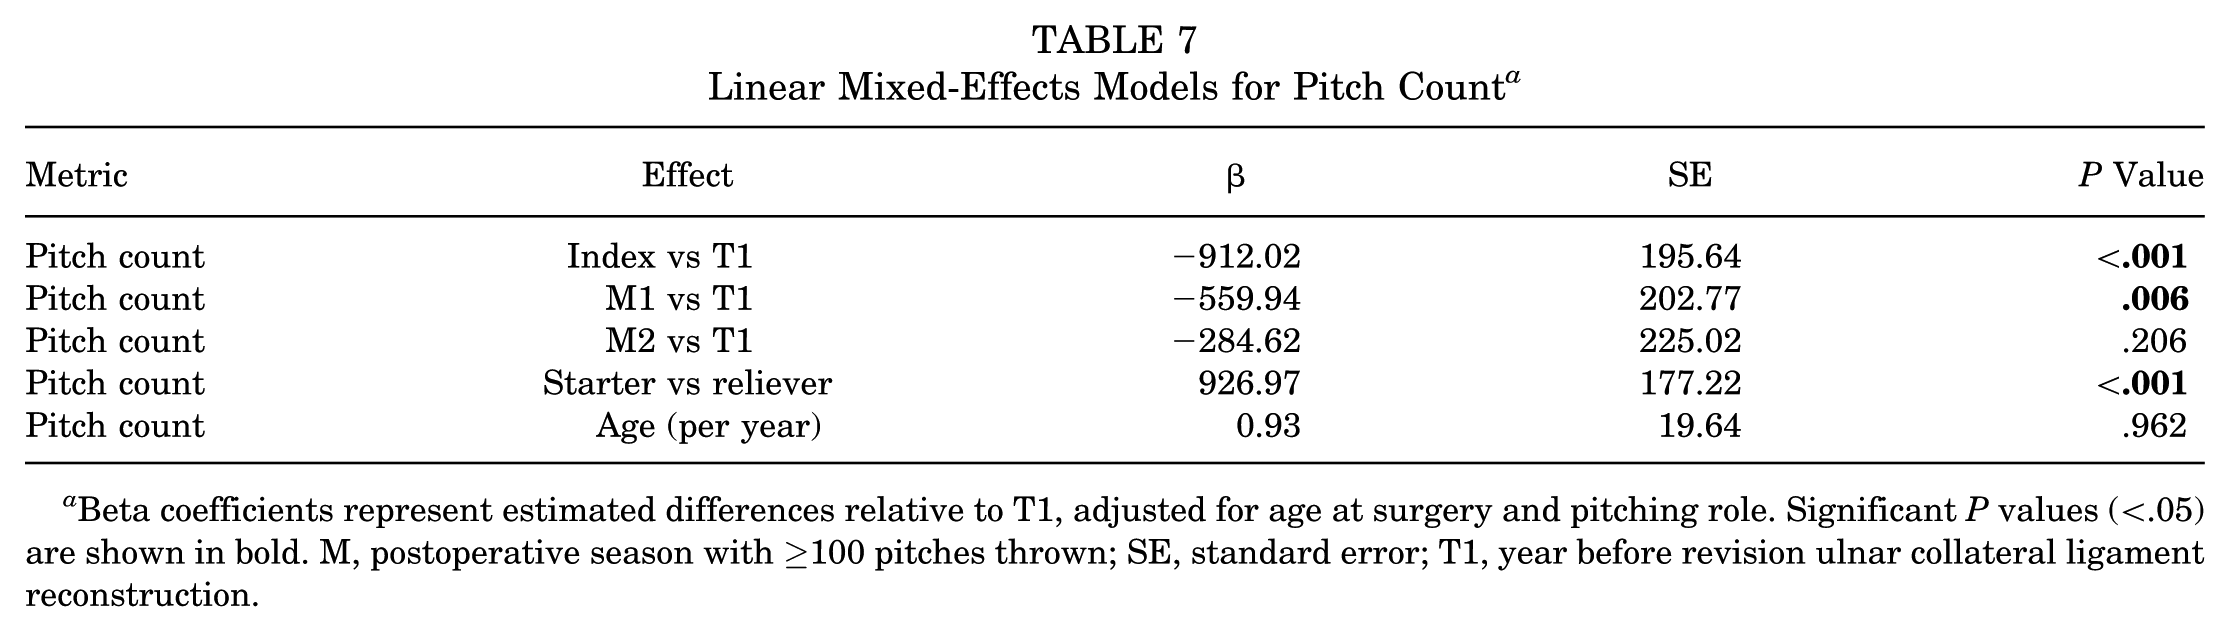
Beta coefficients represent estimated differences relative to T1, adjusted for age at surgery and pitching role. Significant P values (<.05) are shown in bold. M, postoperative season with ≥100 pitches thrown; SE, standard error; T1, year before revision ulnar collateral ligament reconstruction.
Linear Mixed-Effects Models for fWAR a
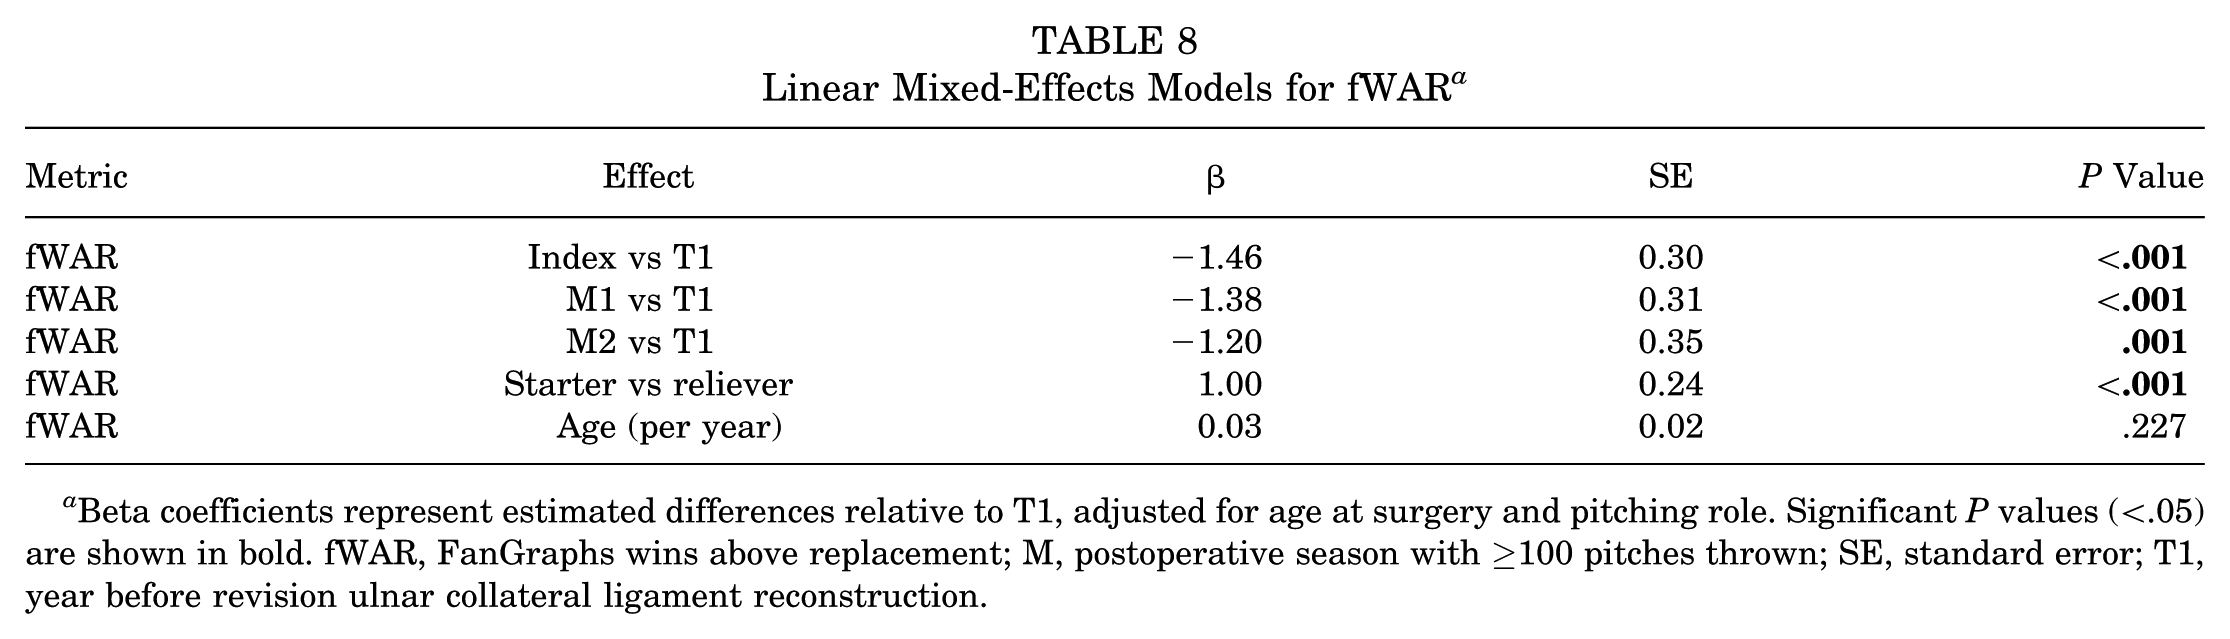
Beta coefficients represent estimated differences relative to T1, adjusted for age at surgery and pitching role. Significant P values (<.05) are shown in bold. fWAR, FanGraphs wins above replacement; M, postoperative season with ≥100 pitches thrown; SE, standard error; T1, year before revision ulnar collateral ligament reconstruction.
Linear Mixed-Effects Models for xFIP a
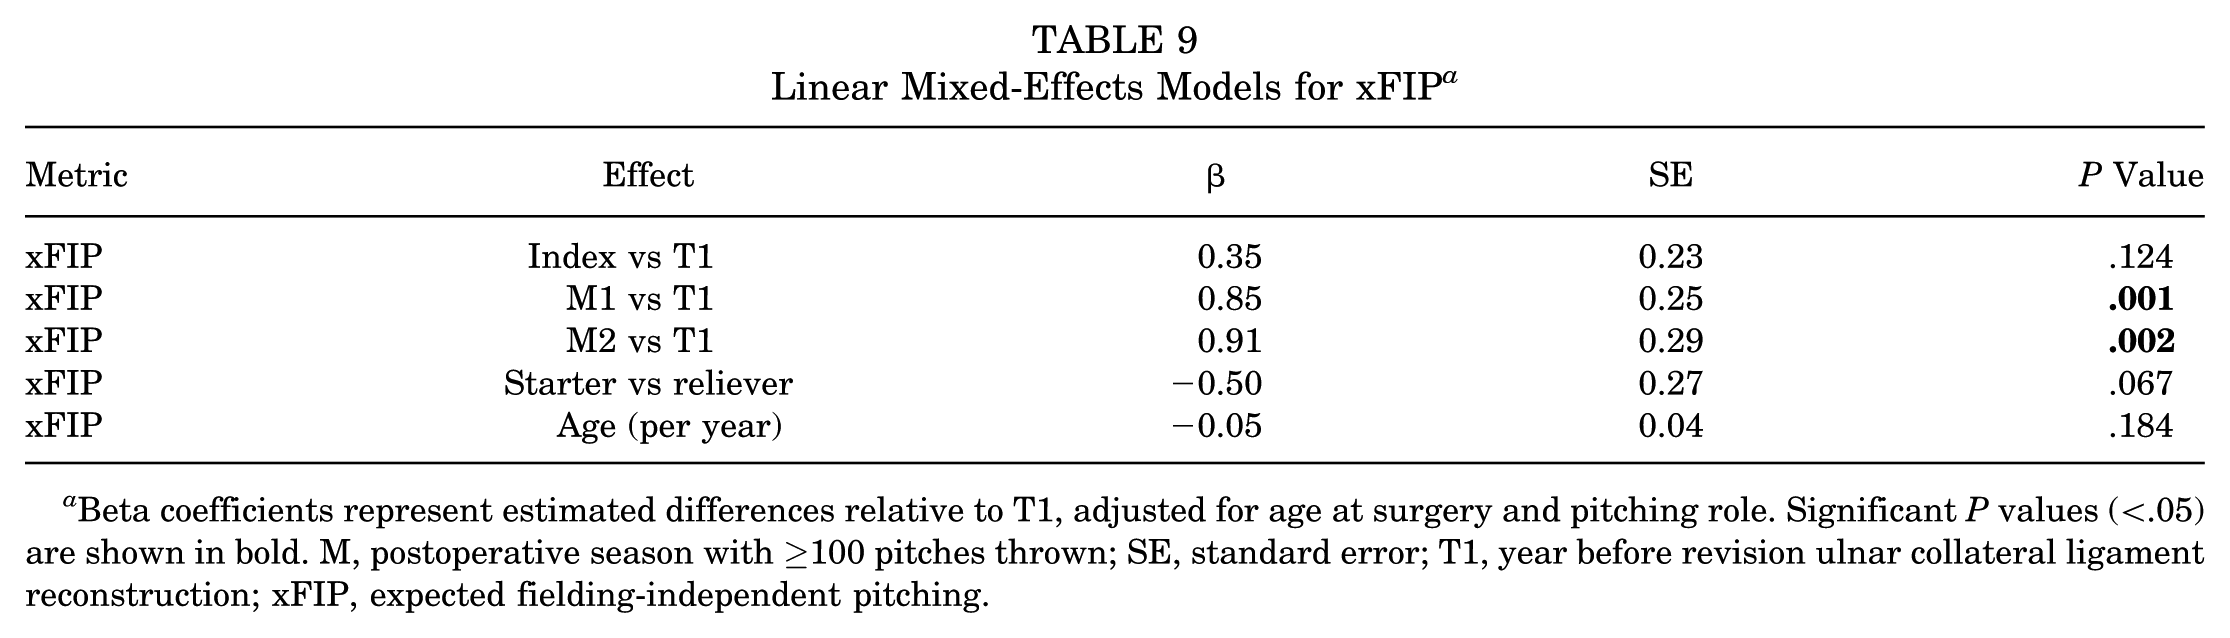
Beta coefficients represent estimated differences relative to T1, adjusted for age at surgery and pitching role. Significant P values (<.05) are shown in bold. M, postoperative season with ≥100 pitches thrown; SE, standard error; T1, year before revision ulnar collateral ligament reconstruction; xFIP, expected fielding-independent pitching.
For pitch quality, Stuff+ (Table 10) significantly declined at M1 (β = −9.02; P = .001) and M2 (β = −9.24; P = .005), while Pitching+ significantly decreased at M1 (β = −6.84; P = .032) and trended toward a significant decrease at M2 (β = −7.67; P = .054). Location+ had no significant difference at any time points. For approach angles, HAA was significantly higher at M1 (β = 1.52; P = .009) and M2 (β = 2.11; P = .002), while HAA above average (β = 0.59; P = .015) and VAA above average (β = 1.44; P = .028) were both significantly higher during the index season. No significant differences were observed for velocity, fastball velocity, spin rate, horizontal release point, vertical release point, VAA, horizontal movement, vertical movement, and release extension at any time points (Supplementary Table S2).
Linear Mixed-Effects Models for Stuff+ a
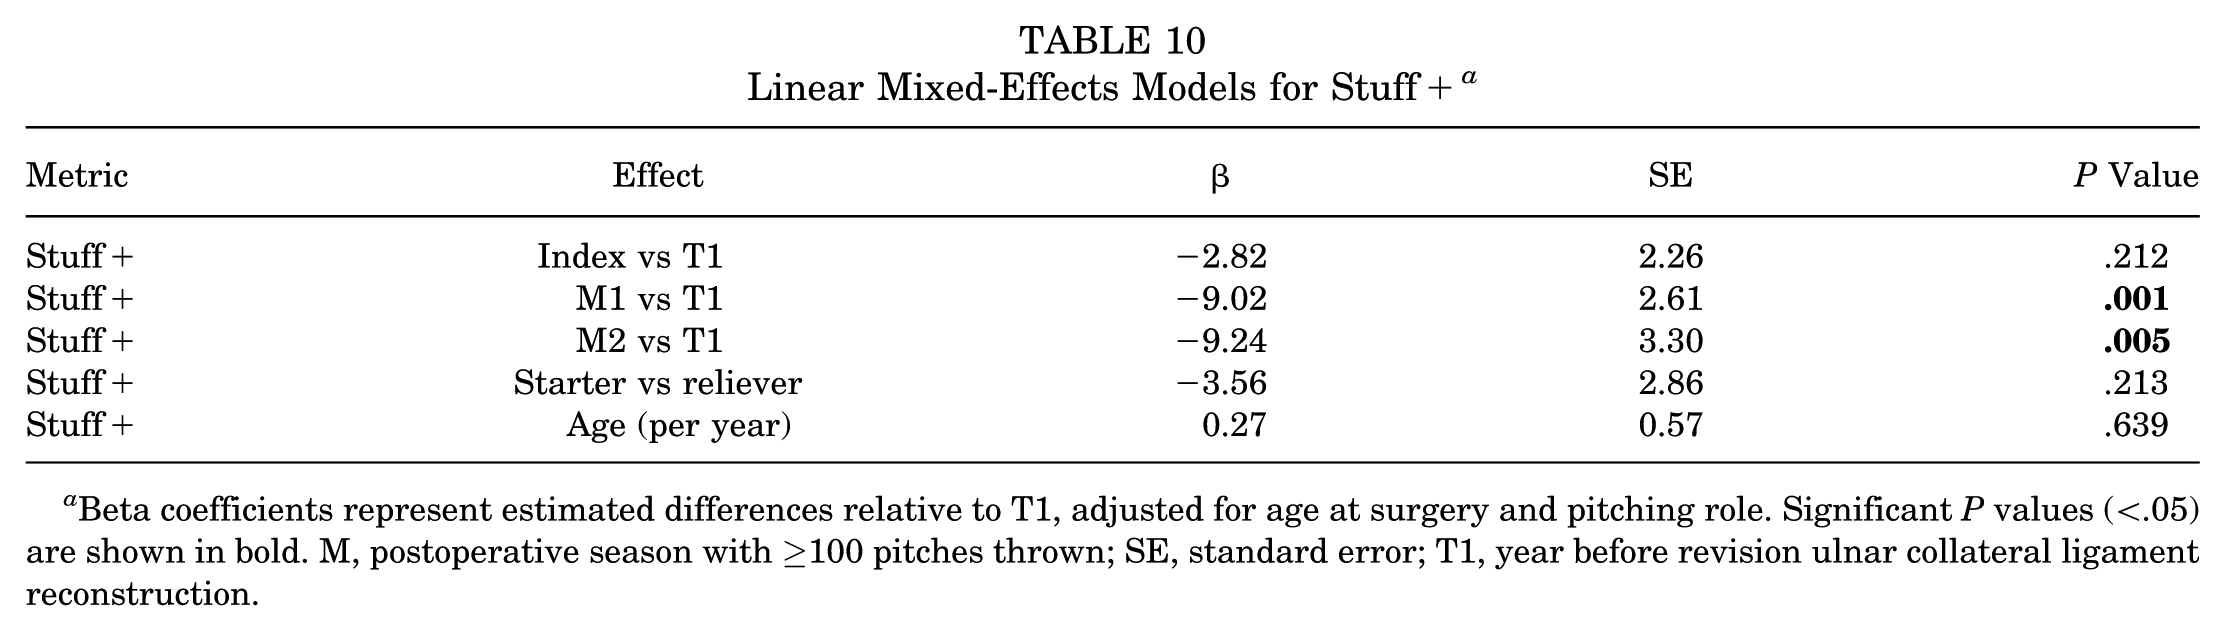
Beta coefficients represent estimated differences relative to T1, adjusted for age at surgery and pitching role. Significant P values (<.05) are shown in bold. M, postoperative season with ≥100 pitches thrown; SE, standard error; T1, year before revision ulnar collateral ligament reconstruction.
Discussion
Only 63% of MLB pitchers returned to play after rUCLR, and a majority did not return to full performance, reinforcing that pitchers often do not immediately regain their preinjury form despite returning to play. Overall velocity (85.7%), fastball velocity (71.4%), vertical movement (85.7%), and spin rate (100%) all recovered well in a majority of pitchers after returning from rUCLR. Pitchers did not return to performance well in xFIP (42.9%), Stuff+ (33.3%), or Pitching+ (33.3%) by their third season back from injury, with only 16.7% returning to full performance. Importantly, only 14.3% of pitchers returned to their pre-revision fWAR by their third season back playing, providing, on average, 41% of their pre-revision value in their second season back from injury. There were no preoperative factors that predicted return to fWAR or full performance. Overall, pitchers demonstrated a mixed pattern of recovery after rUCLR. Rate-based quality metrics such as xFIP and SIERA remained worse than pre-revision levels for most pitchers, and longitudinal modeling identified persistent declines in performance metrics such as Stuff+ and workload measures such as pitch count. Our data suggest that after rUCLR, MLB pitchers RTP at lower rates and typically at decreased performance compared to pre-revision levels and after primary UCL surgery. To our knowledge, this is the largest and most up-to-date RTP and performance analysis evaluating several outcomes after rUCLR surgery for the first time.
Our secondary objective was to evaluate RTP rates over the past 10 seasons, providing an up-to-date analysis during a period focused on value and advanced analytics. Overall, 1.6%, 44.1%, and 63.2% of MLB pitchers returned to play in the MLB at 1, 2, and 3 years postoperatively, respectively, with a mean of 605 days after rUCLR from January 2014 to November 2024. Camp et al (2010-2017) 4 investigated 69 MLB pitchers who underwent rUCLR, finding that only 55.3% of pitchers were able to return to the MLB at a mean time of 518 days. Similar to other studies, Liu et al (1996-2012) 22 found a mean RTP time of >600 days and that pitchers subsequently had shorter careers along with fewer pitches thrown compared to age-matched controls.9,22 In the most updated analysis at the time of this paper, Erickson et al 10 found that 58% were able to return to the same level of play at a mean of 604 days from 2010 to 2023. This is compared to primary UCL surgery, in which 72% and 82% of MLB pitchers returned to the MLB by 2 and 3 years postoperatively, respectively, at a mean of 584 days. Notably, many of the pitchers in our cohort likely overlap with the sample of Erickson et al given the overlapping study periods; however, our study extends beyond RTP rates by providing the first comprehensive return-to-performance analysis using advanced analytic and pitch-tracking outcomes after rUCLR.
There is substantial evidence that needing an rUCLR is a much higher risk to a player’s career than a primary UCL surgery. 9 Unsurprisingly, pitchers who had significantly longer recoveries and at a younger age at the time of their primary UCL surgery were more likely to undergo revision, indicating potential complications or setbacks that delay recovery as a warning sign for reinjury or a potentially failed primary surgery that may require revision. The younger a pitcher is, the more likely they are to RTP and performance, 28 so it makes sense that this rUCLR population was younger at the time of primary UCL surgery and thus had a long enough career where reinjury risk and the perceived benefits of rUCLR surgery increase to prolong their careers. If a player is 28 years (mean age at the time of rUCLR in our cohort) and receives rUCLR, they can be back pitching by their age 30 season, with rUCLR substantially prolonging their careers. Players who were older, in their mid to late 30s, may opt out of surgery and just retire, creating a selection bias in this cohort.
While RTP after rUCLR has been investigated, there are minimal studies evaluating return to performance after rUCLR specifically. Andrews et al 1 evaluated various patient-reported outcomes after rUCLR, finding that patient-reported outcomes including the Conway-Jobe score, Disabilities of the Arm, Shoulder and Hand score, and a subjective satisfaction rating were generally lower after revision compared to primary UCL surgery, with only half of baseball players undergoing rUCLR reporting a return to their previous level of play. Recently, LaPrade et al20,21 highlighted the need to incorporate advanced technology and pitch tracking into injury and RTP analyses in MLB. To date, most studies on pitchers have focused primarily on traditional counting or rate-based statistics (eg, wins, innings pitched, ERA, etc) that are highly volatile season to season due to a number of extrinsic factors4,6,8-10,14,15,17-19 Studies reporting risk factors and treatment outcomes lack advanced analytic and pitch-tracking data after rUCLR. These advanced metrics are important because they isolate pitcher-specific performance by directly evaluating the quality of pitch characteristics such as spin, velocity, and location, independent of confounders such as batter quality, defensive support, and opposing team strength. Traditional counting and rate-based statistics such as ERA, walks and hits per innings pitched, and win-loss records are inherently affected by these extrinsic factors, making pitch-tracking and advanced analytics essential for assessing true changes in a pitcher’s ability after surgery.
Until a recent analysis, outcomes looking at return to performance after primary UCL surgery were limited, and even more so after rUCLR. LaPrade et al 20 utilized early pitch-tracking data to find that pitchers were able to recover their fastball velocity but had decreased fastball usage after rUCLR. Marshall et al 24 found that MLB pitchers had shorter careers and decreased workload compared to matched controls, but had similar performance in several statistics such as ERA and WAR. Jones et al 17 also found decreased workload, and that relievers tended to maintain their ERAs better than starting pitchers after rUCLR.
In our study, 14.3% of pitchers returned to their preinjury fWAR in their third season after surgery, suggesting that only a small proportion of pitchers ultimately provide the same value to teams after rUCLR. On average, pitchers provided only 41% of their pre-revision value in their second season back from injury, both significant decreases from the primary UCL cohort and their pre-revision value, respectively. Rate-based performance metrics demonstrated a similar pattern, with both mean xFIP and mean SIERA significantly worsening postoperatively compared with pre-revision levels. Expected FIP and SIERA are regarded as more predictive than FIP or ERA, as xFIP and SIERA take into account the expected outcomes based off batted ball data rather than the actual outcomes. This suggests that pitching performance was truly declining after rUCLR. After primary UCL surgery, there was a large decrease in workload and a more mild decrease in pitching performance compared to their preinjury levels. After rUCLR, there seems to be no difference in workload reduction but an even larger decrease in pitcher performance compared to primary UCL surgery. There were no preoperative factors that predicted return to fWAR by their third season back from surgery.
In addition, there is no consensus on the impact of rUCLR surgery on velocity. Our pitch-tracking data have found that pitchers were able to recover their fastball velocity at rates of 53.1%, 71.4%, and 80% at 1, 2, and 3 seasons, respectively, after primary UCL surgery. 28 Only LaPrade et al 20 examined postoperative fastball velocity after rUCLR, finding maintained velocity. In our cohort, we observed no significant changes in velocity or fastball usage in early postoperative seasons, and return-to-performance rates in fastball and overall velocity (85.7% and 71.4%, respectively) were similar to those reported after primary UCL surgery by their third season after returning. However, fewer pitchers who underwent rUCLRs returned to their pre-revision fastball velocity levels by their second season back compared to primary UCL surgery, suggesting that pitchers may require more time to return to fastball performance after rUCLR.
Two previous studies have investigated pitch-tracking factors such as spin and pitch movement after primary UCL surgery,14,28 but there are no reports investigating these metrics after rUCLR. In our study, the mean overall spin rate was not significantly different after returning from rUCLR, and all pitchers had returned to their pre-revision spin rate by their third season back. In addition, increased spin rate was the only factor that trended toward being a positive predictor for return to performance in our rUCLR cohort, which is in line with the league-wide emphasis on maximizing spin. Pitch movement generally demonstrated good recovery even compared to uninjured matched controls, although the proportion of pitchers who recovered horizontal movement decreased with each successive postoperative season. This trend may be worth monitoring, but it also could be secondary to altered pitching arsenals. Overall, pitchers largely maintain their pitch movement profiles after rUCLR. Of note, our pitch-tracking analysis focused on overall velocity and spin rate across all pitch types; pitch-specific velocity data on individual secondary pitches (eg, slider, curveball, and changeup) were beyond the scope of this study but represent an important area for future investigation.
MLB pitchers retained their horizontal release points, VAA, and VAA above average, while several other release-point characteristics demonstrated postoperative changes. Pitchers showed a lower vertical release point, increased release extension, and more positive horizontal approach angle during the M1 and M2 seasons compared to pre-revision levels. However, matched controls exhibited a similar trend, indicating a likely league-wide trend not specific to pitchers who underwent rUCLR or a standardized change in how these metrics were measured, given the league’s transition to Trackman in 2017 and Hawkeye camera systems in 2020. The clinical significance of these findings is unclear; greater release extension increases perceived velocity, while some pitch types and movement profiles have been shown to be more effective at certain release points and approach angles.5,30
Our study also reports on key advanced metrics such as Stuff+, Location+, and Pitching+, which were developed in 2020. 30 These metrics are highly valued throughout the league for being highly predictive of future success for MLB pitchers,13,30 and thus it is critical to understand how pitchers fare in these metrics after rUCLR. Stuff+ demonstrated the clearest decline after revision UCLR compared to matched controls and pre-revision levels. The mean Stuff+ decreased significantly in seasonal averages and longitudinal modeling after RTP, and return-to-performance rates were low, with only 33.3% returning to their pre-revision levels by their third season back. In contrast, Pitching+ demonstrated no significant postoperative change in mean values, but return-to-performance rate was low and significantly worse than after primary UCL surgery at 28.6% in their second season back from injury. Pitching+ is important and measures overall pitching ability, signaling that fewer MLB pitchers return to their same pitching ability after rUCLR compared to primary UCL surgery. Reassuringly, pitchers recovered their strike-zone command well after rUCLR, with mean Location+ showing no significant differences in postoperative means and high return-to-performance rates across their first 3 seasons back from surgery.
Lastly, return to full performance was defined as returning to 5 key preoperative metrics (xFIP, fWAR, velocity, fastball velocity, and spin rate). Metrics such as spin, Stuff+, Location+, and Pitching+ were developed after 2020 and were excluded due to limited sample size. Movement metrics were also excluded because they vary across pitch types, which makes, it hard to directly relate overall values to pitching effectiveness. While returning to play and workload is important, the ultimate goal of a former star pitcher is to return to their previous form, which has significant implications for both the player and team. In our study, only 16.7% of pitchers returned to full performance by their third season back from injury, which is less than after primary UCL surgery, albeit the differences were not significant. While many pitchers recovered isolated components of performance, it was rare for all key aspects of pitching to be restored simultaneously, indicating that a full return to pre-revision form is rare within 3 seasons back from rUCLR. Notably, several extrinsic factors beyond surgical recovery may influence postoperative workload and performance metrics, including changing teams, changes in pitch mix or pitching style, role changes between starting and relief, and the normal developmental trajectory of a pitcher’s career.
Overall, this study is not without limitations. Given that the majority of these pitch-tracking metrics have only recently become publicly available, a majority of pitchers who underwent rUCLR during the study’s time period did not meet inclusion criteria for further return-to-performance analysis. Although statistical significance was obtained for some metrics, the clinical significance of our findings is unknown and has not been established in the literature. We were only able to obtain data from 2015 and later, when StatCast data first became public, which compare favorably to similar studies but ultimately limited our sample size. As a result, this study may have been underpowered to identify all true differences of the evaluated parameters pre- and post-rUCLR. Data were also obtained entirely from public sources, which prevented us from obtaining surgical details such as graft used and tear characteristics and has its inherent flaws. 35 However, some of these public sources are affiliated with MLB and all have been widely used by the public and in previous studies.7,25-29,31 Additionally, because rUCLR procedures were performed by numerous different surgeons throughout the league, we were unable to account for variability in surgeon skill and experience, surgical technique, or graft choice. Rehabilitation protocols likely varied considerably across players, including differences in supervision, location, and adherence; some players may have undergone unsupervised rehabilitation or sought care outside of the United States. Our reliance on publicly available data also precluded in-person clinical follow-up, and we lack objective clinical examination data such as range of motion, elbow laxity, and grip strength. Furthermore, the low RTP rate may not solely reflect surgical failure; some players may have chosen to retire, transitioned to nonplaying roles, or elected surgery without the intention of returning to professional competition. Despite these limitations, we believe our study contributes substantially to the literature on surgical outcomes after rUCLR in MLB pitchers.
Conclusion
Only 63% of MLB pitchers returned to play after rUCLR, and a majority did not return to full performance, defined as returning to 5 key preoperative metrics (xFIP, fWAR, velocity, fastball velocity, and spin rate). Our data suggest that after rUCLR, MLB pitchers RTP at lower rates and typically at decreased performance compared to pre-revision levels and after primary UCL surgery. To our knowledge, this is the largest and most up-to-date RTP and performance analysis evaluating several outcomes after rUCLR surgery for the first time.
Footnotes
Appendix
Linear Mixed-Effects Model for All Outcomes (Cases Only) a

| Metric | Effect | β | SE | P Value |
|---|---|---|---|---|
| Pitch count | Index vs T1 | −912.02 | 195.64 | <.001 |
| Pitch count | M1 vs T1 | −559.94 | 202.77 | .006 |
| Pitch count | M2 vs T1 | −284.62 | 225.02 | .206 |
| Pitch count | Starter vs reliever | 926.97 | 177.22 | <.001 |
| Pitch count | Age (per year) | 0.93 | 19.64 | .962 |
| fWAR | Index vs T1 | −1.46 | 0.30 | <.001 |
| fWAR | M1 vs T1 | −1.38 | 0.31 | <.001 |
| fWAR | M2 vs T1 | −1.20 | 0.35 | .001 |
| fWAR | Starter vs reliever | 1.00 | 0.24 | <.001 |
| fWAR | Age (per year) | 0.03 | 0.02 | .227 |
| xFIP | Index vs T1 | 0.35 | 0.23 | .124 |
| xFIP | M1 vs T1 | 0.85 | 0.25 | .001 |
| xFIP | M2 vs T1 | 0.91 | 0.29 | .002 |
| xFIP | Starter vs reliever | −0.50 | 0.27 | .067 |
| xFIP | Age (per year) | −0.05 | 0.04 | .184 |
| SIERA | Index vs T1 | 0.34 | 0.20 | .095 |
| SIERA | M1 vs T1 | 0.72 | 0.22 | .001 |
| SIERA | M2 vs T1 | 0.85 | 0.26 | .001 |
| SIERA | Starter vs reliever | −0.14 | 0.25 | .570 |
| SIERA | Age (per year) | −0.05 | 0.04 | .156 |
| Stuff+ | Index vs T1 | −2.82 | 2.26 | .212 |
| Stuff+ | M1 vs T1 | −9.02 | 2.61 | .001 |
| Stuff+ | M2 vs T1 | −9.24 | 3.30 | .005 |
| Stuff+ | Starter vs reliever | −3.56 | 2.86 | .213 |
| Stuff+ | Age (per year) | 0.27 | 0.57 | .639 |
| Pitching+ | Index vs T1 | 0.95 | 2.90 | .743 |
| Pitching+ | M1 vs T1 | −6.84 | 3.19 | .032 |
| Pitching+ | M2 vs T1 | −7.67 | 3.97 | .054 |
| Pitching+ | Starter vs reliever | −2.26 | 3.67 | .539 |
| Pitching+ | Age (per year) | 0.23 | 0.63 | .716 |
| Location+ | Index vs T1 | 2.70 | 2.19 | .216 |
| Location+ | M1 vs T1 | −0.10 | 2.31 | .964 |
| Location+ | M2 vs T1 | −0.16 | 2.82 | .955 |
| Location+ | Starter vs reliever | 0.57 | 2.53 | .823 |
| Location+ | Age (per year) | −0.07 | 0.39 | .852 |
| Mean velocity | Index vs T1 | 0.53 | 0.41 | .196 |
| Mean velocity | M1 vs T1 | −0.22 | 0.55 | .680 |
| Mean velocity | M2 vs T1 | 0.01 | 0.69 | .993 |
| Mean velocity | Starter vs reliever | −0.86 | 0.59 | .147 |
| Mean velocity | Age (per year) | −0.08 | 0.13 | .567 |
| FB velocity | Index vs T1 | −0.12 | 0.24 | .610 |
| FB velocity | M1 vs T1 | −0.58 | 0.39 | .133 |
| FB velocity | M2 vs T1 | −0.23 | 0.50 | .643 |
| FB velocity | Starter vs reliever | −0.47 | 0.37 | .203 |
| FB velocity | Age (per year) | −0.06 | 0.11 | .580 |
| Spin rate | Index vs T1 | 17.91 | 29.56 | .544 |
| Spin rate | M1 vs T1 | 44.33 | 39.60 | .263 |
| Spin rate | M2 vs T1 | 68.50 | 49.53 | .167 |
| Spin rate | Starter vs reliever | −66.89 | 40.58 | .099 |
| Spin rate | Age (per year) | −2.39 | 9.89 | .809 |
| Horizontal release point | Index vs T1 | 0.00 | 0.07 | .996 |
| Horizontal release point | M1 vs T1 | −0.12 | 0.11 | .262 |
| Horizontal release point | M2 vs T1 | −0.10 | 0.14 | .476 |
| Horizontal release point | Starter vs reliever | −0.04 | 0.11 | .732 |
| Horizontal release point | Age (per year) | 0.05 | 0.03 | .102 |
| Vertical release point | Index vs T1 | 0.03 | 0.03 | .384 |
| Vertical release point | M1 vs T1 | −0.04 | 0.05 | .397 |
| Vertical release point | M2 vs T1 | −0.06 | 0.07 | .394 |
| Vertical release point | Starter vs reliever | −0.08 | 0.05 | .091 |
| Vertical release point | Age (per year) | 0.00 | 0.01 | .724 |
| HAA | Index vs T1 | 0.58 | 0.55 | .290 |
| HAA | M1 vs T1 | 1.52 | 0.58 | .009 |
| HAA | M2 vs T1 | 2.11 | 0.68 | .002 |
| HAA | Starter vs reliever | 0.24 | 0.62 | .704 |
| HAA | Age (per year) | 0.05 | 0.10 | .589 |
| VAA | Index vs T1 | 0.04 | 0.13 | .727 |
| VAA | M1 vs T1 | −0.04 | 0.15 | .809 |
| VAA | M2 vs T1 | −0.01 | 0.17 | .943 |
| VAA | Starter vs reliever | 0.03 | 0.16 | .831 |
| VAA | Age (per year) | 0.02 | 0.03 | .549 |
| HAA above average | Index vs T1 | 0.59 | 0.24 | .015 |
| HAA above average | M1 vs T1 | 0.49 | 0.29 | .085 |
| HAA above average | M2 vs T1 | 0.46 | 0.36 | .203 |
| HAA above average | Starter vs reliever | −0.47 | 0.30 | .125 |
| HAA above average | Age (per year) | 0.06 | 0.05 | .225 |
| VAA above average | Index vs T1 | 1.44 | 0.66 | .028 |
| VAA above average | M1 vs T1 | 0.98 | 0.81 | .224 |
| VAA above average | M2 vs T1 | 0.83 | 1.04 | .427 |
| VAA above average | Starter vs reliever | −1.28 | 0.86 | .135 |
| VAA above average | Age (per year) | 0.10 | 0.16 | .544 |
| Horizontal movement | Index vs T1 | −0.38 | 0.46 | .403 |
| Horizontal movement | M1 vs T1 | −0.14 | 0.52 | .789 |
| Horizontal movement | M2 vs T1 | 1.00 | 0.64 | .115 |
| Horizontal movement | Starter vs reliever | 0.64 | 0.61 | .290 |
| Horizontal movement | Age (per year) | −0.07 | 0.09 | .475 |
| Vertical movement | Index vs T1 | 0.56 | 0.38 | .141 |
| Vertical movement | M1 vs T1 | 0.49 | 0.41 | .230 |
| Vertical movement | M2 vs T1 | −0.36 | 0.47 | .442 |
| Vertical movement | Starter vs reliever | −0.53 | 0.42 | .210 |
| Vertical movement | Age (per year) | −0.01 | 0.05 | .815 |
| Release extension | Index vs T1 | 0.07 | 0.06 | .220 |
| Release extension | M1 vs T1 | 0.10 | 0.09 | .227 |
| Release extension | M2 vs T1 | 0.21 | 0.11 | .056 |
| Release extension | Starter vs reliever | 0.07 | 0.08 | .403 |
| Release extension | Age (per year) | 0.01 | 0.02 | .640 |
Beta coefficients represent estimated differences relative to T1, adjusted for age at surgery and pitching role. This table includes the 4 primary outcomes: pitch count, fWAR, xFIP, and Stuff+, which are also presented in Tables 7 to 10. FB, fastball; fWAR, FanGraphs wins above replacement; HAA, horizontal approach angle; Index, revision surgery season; M, postoperative season with ≥100 pitches thrown; SE, standard error; SIERA, skill-interactive earned run average; T1, year before revision ulnar collateral ligament reconstruction; VAA, vertical approach angle; xFIP, expected fielding-independent pitching.
Final revision submitted April 12, 2026; accepted April 22, 2026.
One or more of the authors has declared the following potential conflict of interest or source of funding: C.S.A. is a paid consultant and receives royalties from Arthrex; he also serves as the head team physician of the New York Yankees.
Ethical approval for this study was waived by Columbia University Medical Center.