
Abstract
Background:
Pitch velocity plays a critical role in fastpitch softball success because it reduces the time a batter must react and contact the ball. Despite its importance, there is limited literature on the biomechanical contributions to pitch velocity, particularly from the lower extremities.
Purpose:
To examine the lower extremity and pelvic kinematic, kinetic, and center of mass (COM) velocities associated with fastball pitch velocity.
Study Design:
Descriptive laboratory study.
Methods:
A total of 90 female high school and collegiate softball pitchers were included in the analysis. Motion capture data were collected for each participant, and the fastest 3 fastballs were averaged for analysis. Kinematics and kinetics were extracted for subsequent analysis. A Pearson correlation and a backward stepwise multiple regression were performed to identify kinematic and kinetic variables associated with, and predictive of, fastball velocity.
Results:
Peak vertical COM velocity (r = 0.51; P < .001) showed the strongest positive association with pitch velocity, followed by anterior COM velocity (r = 0.44; P < .001), mediolateral ground-reaction force (GRF) (r = 0.38; P < .001), and vertical GRF (r = 0.31; P = .001), while negative (clockwise) pelvic rotational velocity was inversely related (r = −0.26; P = .006). Backward stepwise regression identified COM velocities, GRFs, pelvic rotational velocity, and body mass as significant predictors, explaining 57% of the variance in pitch velocity (R2 = 0.57; F(7, 82) = 15.51; P < .001).
Conclusion:
These results suggest that the lower body plays a critical role in generating pitch velocity. Continued research is needed to determine how to optimize lower extremity function to enhance pitching performance while minimizing injury risk.
Clinical Relevance:
Improving fastball velocity in softball pitching depends on effective lower body and COM kinematics and kinetics. These findings support training the lower extremity to generate high force to improve pitch velocity while potentially reducing the mechanical demand placed on the upper extremity.
Fastpitch softball pitching is characterized by a distinct underhand windmill motion, which can be divided into 4 phases: windup, stride, acceleration (ACC), and follow-through.1,15 Each phase contributes to the transfer of kinetic energy throughout the body, ultimately enabling the pitcher to achieve high segmental velocities before ball release. 27 To maximize distal segmental velocities and, in turn, maximize pitch velocity, efficient energy transfer is critical. 27
Pitch velocity is an essential factor in pitching performance, effectively reducing the time a batter has to react and make effective contact with the ball. At a fast-pitch softball regulation distance of 13.11 m (43 feet), pitches can reach home plate in <0.4 s. While pitch velocity is highly valued, there has been limited research assessing the relationships between specific lower extremity kinematic variables and pitch velocity in softball pitchers. Existing evidence suggests positive associations between pitch velocity and angular kinematics, including trunk flexion and rotation angles, peak elbow and wrist flexion angular velocities, and drive leg vertical ground-reaction force (GRF), in prepubescent and high school–aged pitchers.9,12,33 Additionally, research by Oliver et al 27 reported that elite pitchers tend to demonstrate more effective proximodistal sequencing patterns, with forearm and hand segments contributing significantly to pitch velocity.
In contrast, baseball research has extensively examined predictors of pitch velocity, identifying key kinematic factors such as trunk rotational velocity, hip-shoulder separation, lead knee extension velocity, increased forward trunk tilt, stride length, and numerous other variables.7,18,24,36,39 However, these variables cannot be generalized to softball pitching, given the nature of the overhead throwing motion used in baseball; therefore, pitch velocity should be investigated in a softball-specific context.11,44 Understanding the lower extremity kinematic factors associated with softball pitching velocity is vital for providing evidence-based guidance to coaches and trainers from both performance and injury prevention perspectives. Currently, limited research exists on this topic, underscoring the need for further investigation. The primary aim of this study was to identify pelvic and lower extremity kinematic and kinetic predictors of pitch velocity in high school and college softball pitchers. In softball pitching, it was hypothesized that lower extremity kinematics, kinetics, and center of mass (COM) velocities would be significantly associated with increased pitch velocity, underscoring the importance of the lower body for pitch performance.
Methods
A total of 90 female high school and college softball pitchers were included (mean ± SD age, 18 ± 3 years; height, 1.71 ± 0.07 m; mass, 77.25 ± 13.37 kg; 14 left-handed, 76 right-handed). All pitchers were required to be injury-, pain-, and surgery-free for the past 6 months before data collection. Participants reported to the Sports Medicine and Movement Laboratory, where they were informed of the study protocols before providing written informed consent. For participants <19 years of age, minor assent and consent from a legal guardian or parent were obtained. Auburn University's institutional review board approved all testing protocols before data collection.
An electromagnetic tracking system (Track Star; Ascension Technologies Inc) was used to track kinematic data at 100 Hz while GRF data were collected at 1200 Hz using a Bertec force plate (Bertec 4060 NC; Bertec Corp). Data were synchronized with The MotionMonitor (Innovative Sports Training). Three-dimensional kinematic data were collected using 14 electromagnetic sensors positioned on the thorax, pelvis, pitching hand, stride foot, and bilateral humeri, forearms, scapulae, thighs, and shanks.31,32 Sensor data were used to establish the position and orientation of each segment in the global reference frame. The global coordinate system was defined with the positive y-axis pointing upward, the positive x-axis oriented anteriorly (toward home plate), and the positive z-axis pointing to the right and orthogonal to both the x and the y axes, with the positive direction pointing to the right of the pitcher. For left-handed pitchers, coordinate data were mirrored such that all variables were expressed relative to a right-handed coordinate system. All kinematic data were filtered using a fourth-order Butterworth filter with a cutoff frequency of 13.4Hz. 16 Segment mass proportions as well as segment COM locations were based on Dempster anthropometric data, as reported by Winter. 41 A digitization procedure using anatomical landmarks created a rigid linked segment model for each participant. Joint centers for the ankle and knee were defined as the midpoint between corresponding medial and lateral landmarks. Thorax landmarks were used according to International Society of Biomechanics (ISB) recommendations, with the suprasternal notch, xiphoid process, C7, and T8 to construct the thorax coordinate system. 42 Hip joint centers were calculated using the Bell method. 2 Segment orientations followed the recommended ISB standards.42,43
Following completion of the digitization procedure, participants were given unlimited time to perform an individualized pitching warm-up. Once prepared to pitch, each pitcher threw maximal intent fastballs at regulation distance to a catcher. Pitch velocity was measured using a previously calibrated radar gun (Stalker Pro II; Stalker Radar). The 3 fastest fastballs for each participant were selected for analysis, as it was considered to best represent the athlete's maximal performance capability.14,40
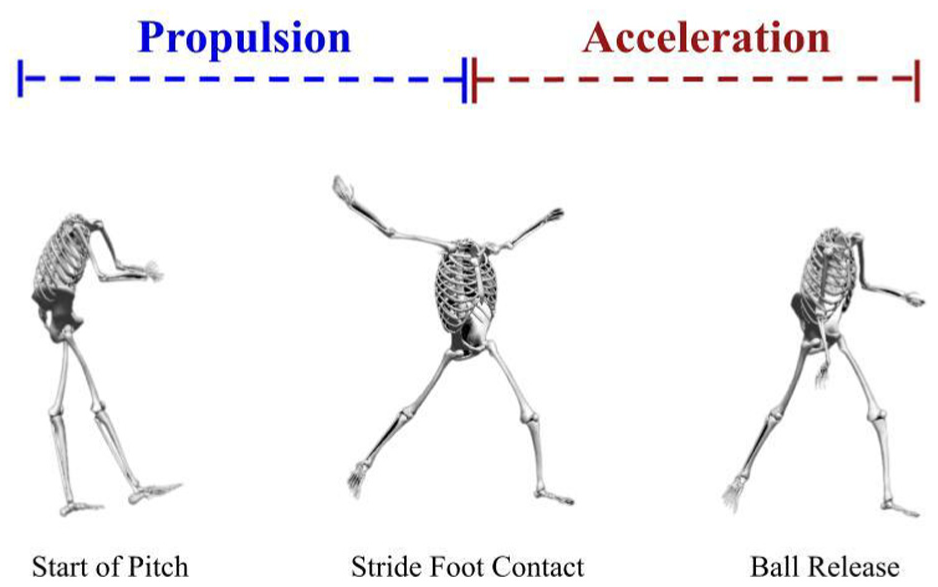
The pitching motion was divided into 3 key events: start of pitch (SOP), stride foot contact (SFC), and ball release (BR),13,35 as shown in Figure 1. The SOP was defined as the instant the body's forward velocity exceeded 0.5 m/s–1 in the direction of the pitch. SFC was identified as the first frame where the stride leg vertical GRF (GRFy) surpassed 20 N. BR was defined as the frame following peak wrist angular ACC. These events created 2 temporal phases, the propulsion (PR) phase and the ACC phase. The PR phase began at the SOP and ended at the frame directly before SFC. The ACC phase started at SFC and ended at BR.
The pitching motion is divided into 2 phases: propulsion, spanning from the start of the pitch to stride foot contact, and acceleration, beginning directly after stride foot contact and continuing until ball release. The global coordinate system was defined with the positive x-axis oriented anteriorly (toward home plate), the positive y-axis oriented vertically, and the positive z-axis oriented mediolaterally toward the throwing arm.
Independent variables were categorized by when they occurred within the pitching motion: kinematics were identified in the PR phase, the ACC phase, or the entire pitching motion. Kinematic variables were selected a priori based on their theoretical and biomechanical relevance to pitch velocity production. As this is a novel study for softball pitching, kinematic influences in baseball pitching were also used to develop the included variables in the study.7,8,18,24,36,39 During the PR phase, kinematic variables of interest included peak negative pelvic rotation velocity about the y-axis (clockwise pelvic rotational velocity toward the pitcher's throwing arm) and peak drive knee extension velocity. The ACC phase variables consisted of peak positive pelvic rotation velocity about the y-axis (counterclockwise pelvic rotational velocity toward the glove arm); peak stride knee extension velocity; peak vertical, anteroposterior, and mediolateral GRF (GRFy, GRFx, and GRFz, respectively) of the stride leg (positive GRFy values represented greater vertical GRF; positive GRFx values represented greater posteriorly directed [braking] GRF; positive GRFz values represented greater GRF directed toward the glove side); and stride knee excursion (knee flexion angle at SFC – knee flexion angle at BR). Finally, kinematic variables that were not phase dependent included stride length normalized to body height, peak vertical COM velocity, and peak anterior COM velocity. The dependent variable was pitch velocity. Pelvic rotation during the PR and ACC phases is depicted in Figure 2. Descriptive statistics are presented in Table 1.
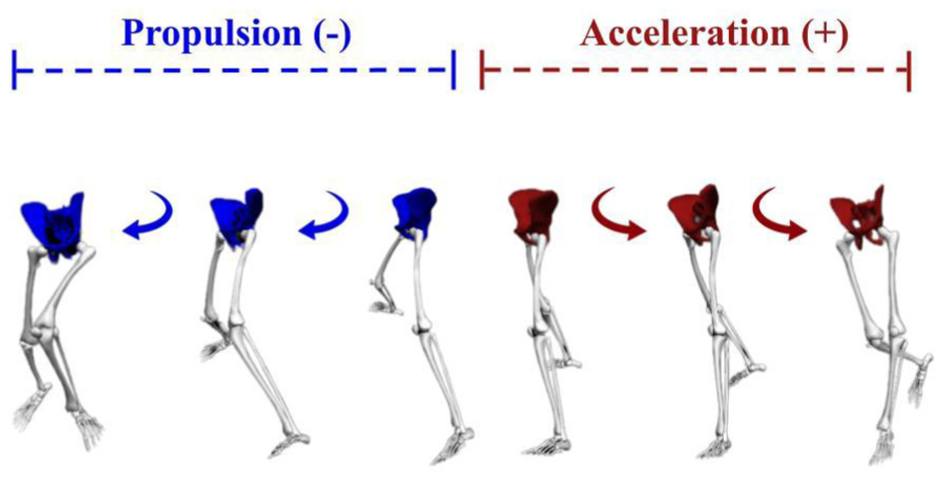
Pelvic rotation during propulsion and acceleration phases. Pelvic rotation velocity during propulsion (toward the throwing arm side) is defined as a negative velocity. Pelvic rotation velocity during acceleration (pelvic rotation toward home plate) is defined as a positive velocity.
Variable Descriptive Statistics a
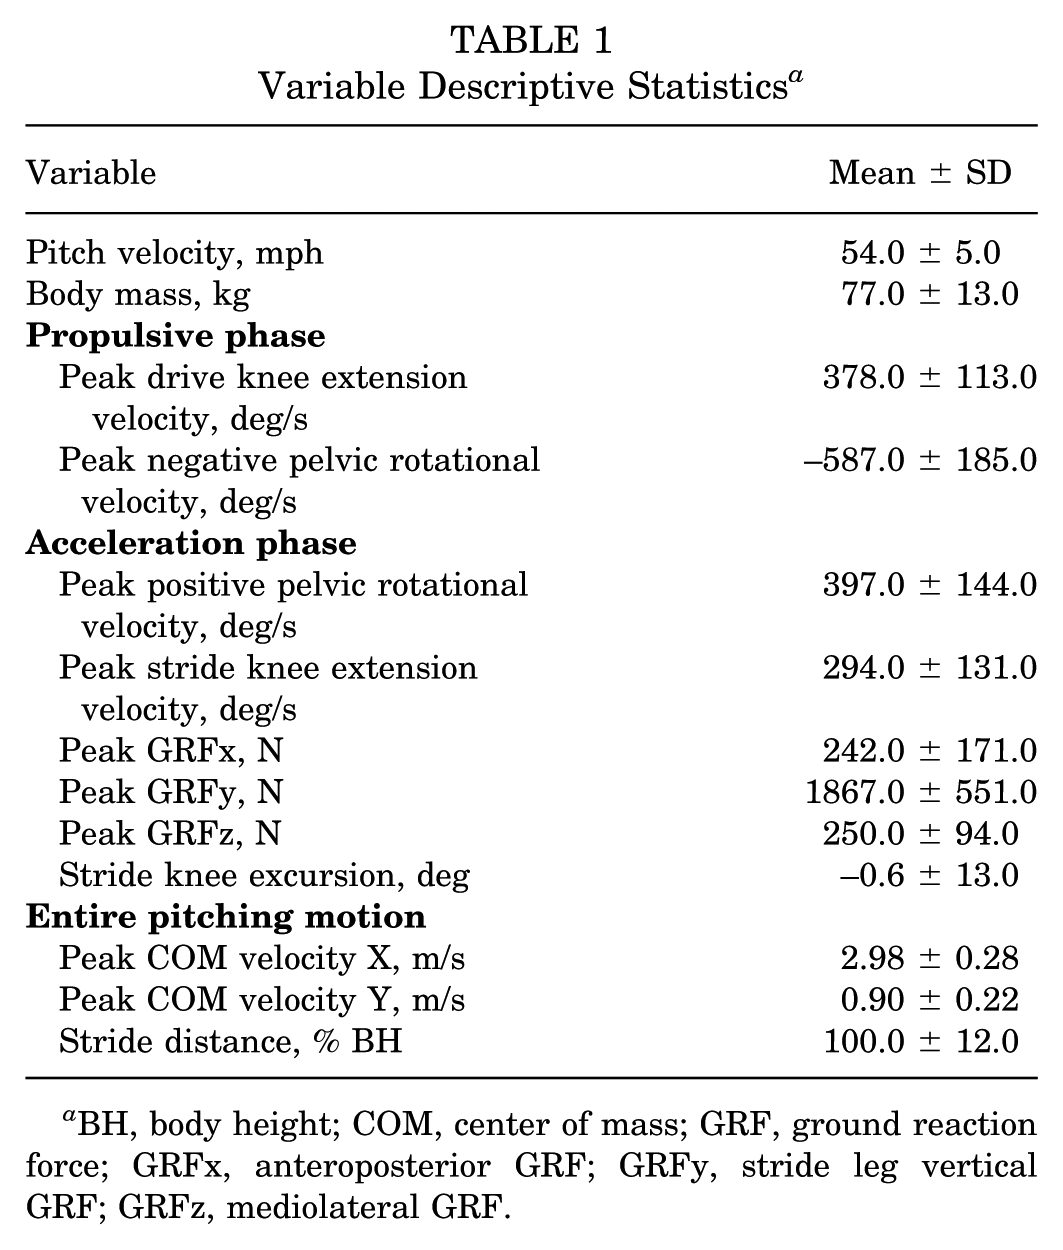
BH, body height; COM, center of mass; GRF, ground reaction force; GRFx, anteroposterior GRF; GRFy, stride leg vertical GRF; GRFz, mediolateral GRF.
Statistical Analysis
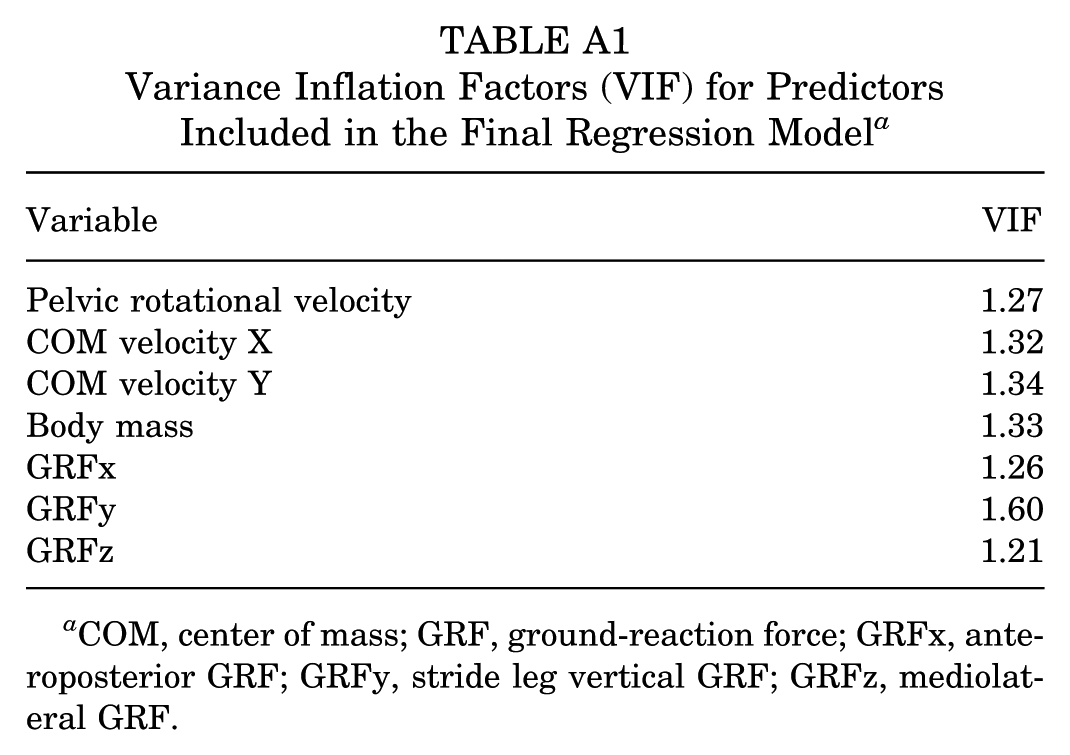
Prior to analysis, assumptions of multiple regression were assessed. Univariate data were assessed for normality using a histogram and a Q-Q plot (Appendix Figures A1 and A2). All Q-Q plots and histograms were normally distributed. Homoscedasticity was assessed by examining standardized residuals versus standardized predicted values (Appendix Figure A3). Multivariate outliers were evaluated using Q-Q plots of Mahalanobis and Cook distances; 1 case exceeded the critical Mahalanobis value (~25) and was removed from the data set. Multicollinearity was examined using tolerance and variance inflation factor (VIF) values (Appendix Table A1). All predictors included in the regression models demonstrated acceptable VIF values (<10), indicating no multicollinearity issues.
All statistical analyses were performed in SPSS (Version 30.0). A Pearson correlation analysis was performed to examine bivariate relationships among variables. Next, a backward stepwise multiple linear regression was conducted to identify which kinematic variables best predicted pitch velocity. Body mass was included as a covariate in the model to account for its influence on kinetic variables, rather than normalizing GRFs. Nonsignificant variables were removed sequentially to produce the final model. The overall model fit was evaluated using the coefficient of determination (R2) and the standard error of estimate (SEE). R2 values were interpreted as follows: weak (0.00-0.19), moderate (0.20-0.39), strong (0.40-0.59), and very strong (≥0.60). Statistical significance was set to P < .05.
Results
Descriptive statistics for all variables are presented in Table 1. From Pearson correlation analysis, peak vertical COM velocity (r = 0.51; P < .001) demonstrated the strongest positive relationship with pitch velocity, followed by peak anterior COM velocity (r = 0.44; P < .001), GRFz (r = 0.38; P < .001), and GRFy (r = 0.31; P = .001). Peak negative pelvic rotational velocity was moderately and inversely correlated with pitch velocity (r = −0.26; P = .006). No other variables showed significant relationships with pitch velocity.
The backward stepwise multiple linear regression identified 6 significant variables as part of the final model following 6 model iterations. The final model was significant, F(7, 82) = 15.51; P < .001, explaining approximately 57% of the variance in pitch velocity (R2 = 0.57; SEE, 3.32 mph). The significant predictors in the model included peak vertical COM velocity, peak anterior COM velocity, GRFy, GRFx, peak negative pelvic rotational velocity, and body mass.
Peak vertical COM velocity (β = 0.34; t = 4.03; P < .001) and peak anterior COM velocity (β = 0.32; t = 3.79; P < .001) emerged as the strongest positive predictors, indicating that greater COM velocities were associated with higher pitch velocity. GRFy (β = 0.31; t = 3.33; P = .001) also positively contributed to pitch velocity. In contrast, GRFx (β = −0.28; t = −3.47; P < .001) was negatively associated with pitch velocity, indicating that greater braking forces were related to lower pitch velocity. Body mass (β = 0.22; t = 2.58; P = .01) was also a significant positive predictor. Finally, peak negative pelvic rotational velocity (β = −0.27; t = −3.04; P = .03) was significantly associated with pitch velocity, indicating that greater magnitude of pelvic rotation toward the throwing arm side was associated with higher pitch velocity (Table 2).
Multiple Regression Final Model a
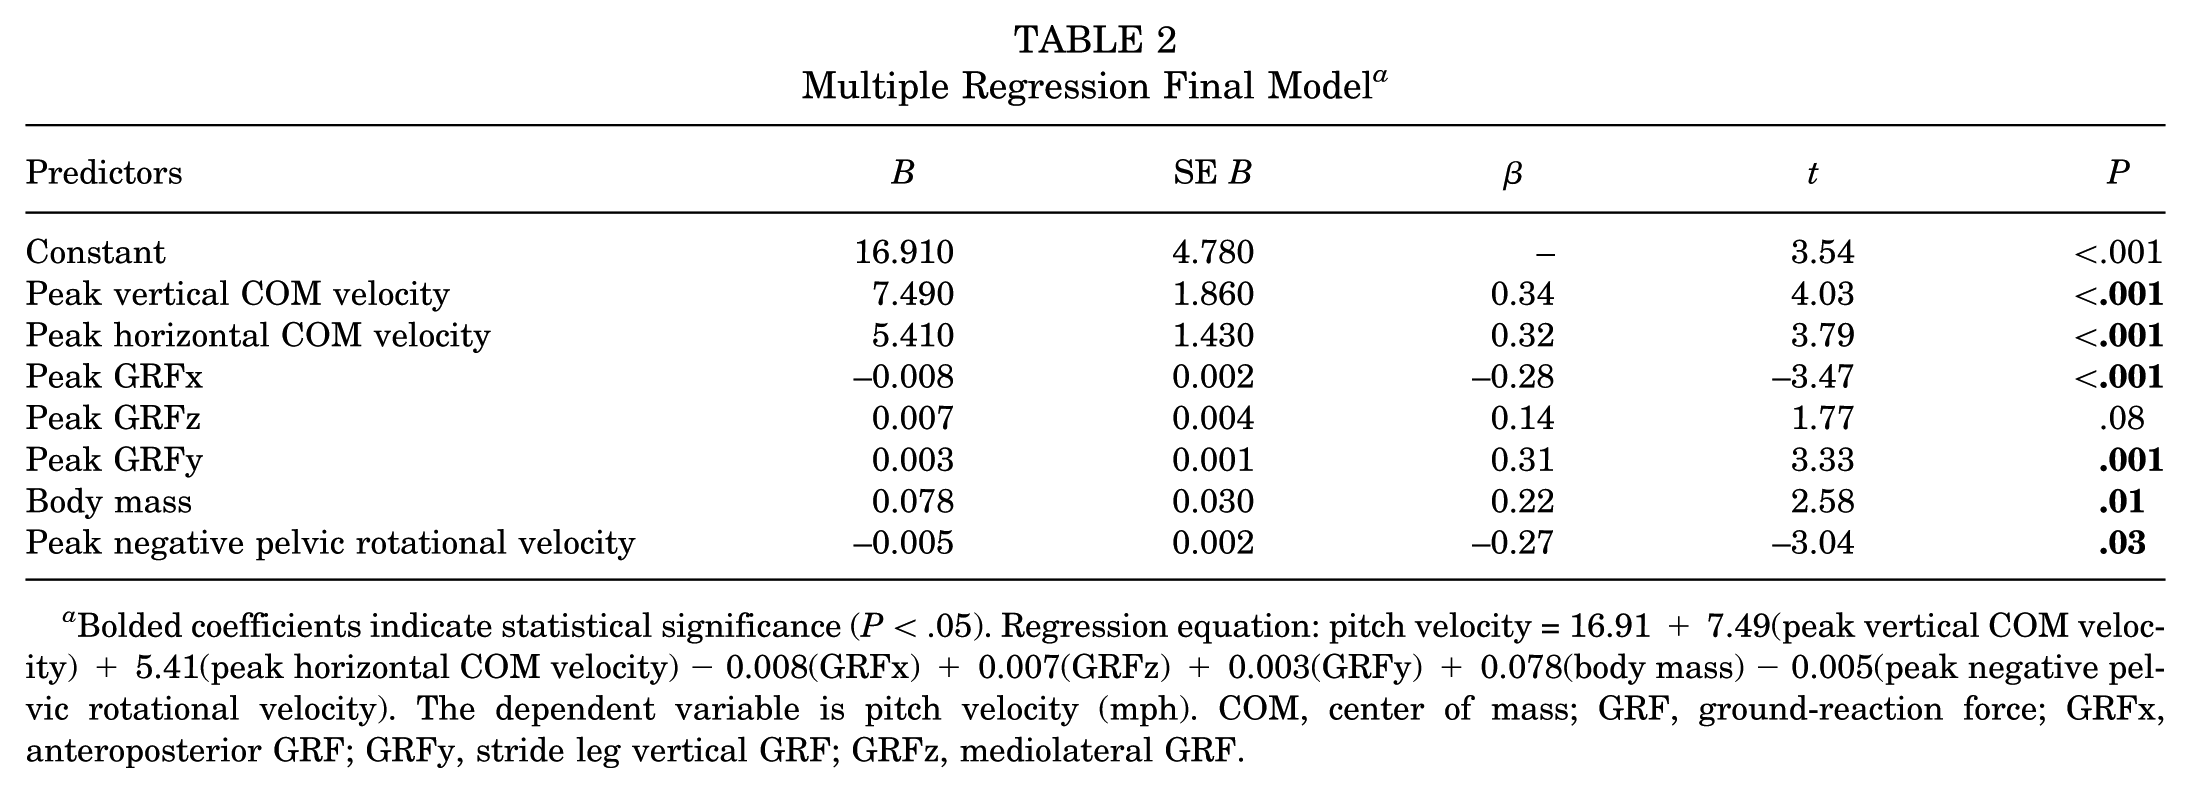
Bolded coefficients indicate statistical significance (P < .05). Regression equation: pitch velocity = 16.91 + 7.49(peak vertical COM velocity) + 5.41(peak horizontal COM velocity) − 0.008(GRFx) + 0.007(GRFz) + 0.003(GRFy) + 0.078(body mass) − 0.005(peak negative pelvic rotational velocity). The dependent variable is pitch velocity (mph). COM, center of mass; GRF, ground-reaction force; GRFx, anteroposterior GRF; GRFy, stride leg vertical GRF; GRFz, mediolateral GRF.
The regression equation indicates that, with all other variables held constant, for every 1 m/s increase in peak vertical COM velocity, pitch velocity increased by approximately 7.5 mph (P < .001), corresponding to an increase of 0.075 mph for every 1 cm/s increase. Similarly, for every 1 m/s increase in peak anterior COM velocity, pitch velocity increased by approximately 5.4 mph (P < .001), corresponding to an increase of 0.054 mph for every 1 cm/s increase. For every 1000 N increase in GRFy, pitch velocity increased by approximately 3.0 mph (P = .001). Conversely, for every 100 N increase in GRFx acting posteriorly, pitch velocity decreased by approximately 0.8 mph (P < .001). Body mass was also a significant covariate in the model (β = 0.22; P = .01), with greater body mass associated with higher pitch velocity. Last, for every 100 deg/s increase in the magnitude of peak negative pelvic rotational velocity, pitch velocity increased by approximately 0.5 mph (P = .03). The final regression model is presented in Table 2. Time-normalized curves for key kinematic and kinetic variables across the pitching motion are presented in Figures 3 to 5.
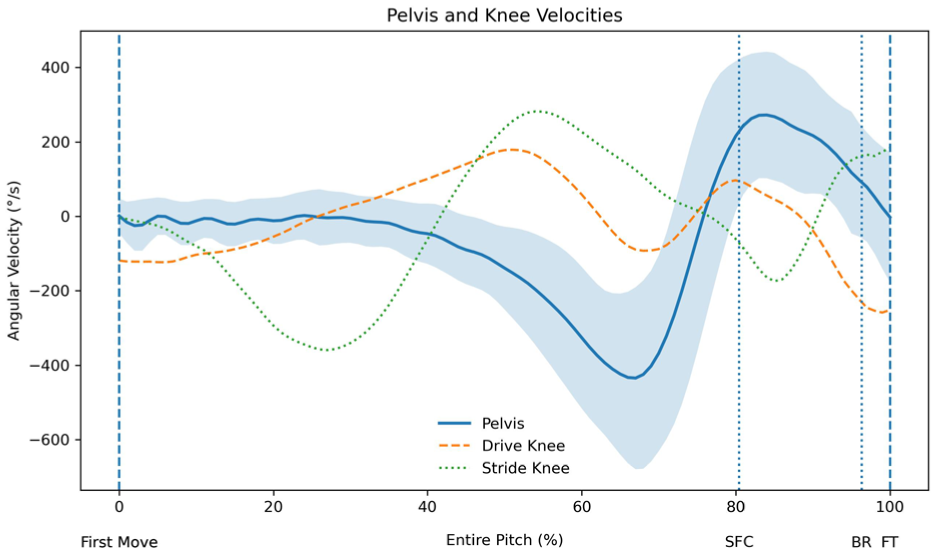
Time-normalized mean curves (0%-100% of the pitching motion) for pelvic rotational velocity, drive knee velocity, and stride knee velocity. Solid line represents the mean, with shaded region indicating ±1 SD for pelvis. Vertical lines denote key events: first move, stride foot contact (SFC), ball release (BR), and follow-through (FT).
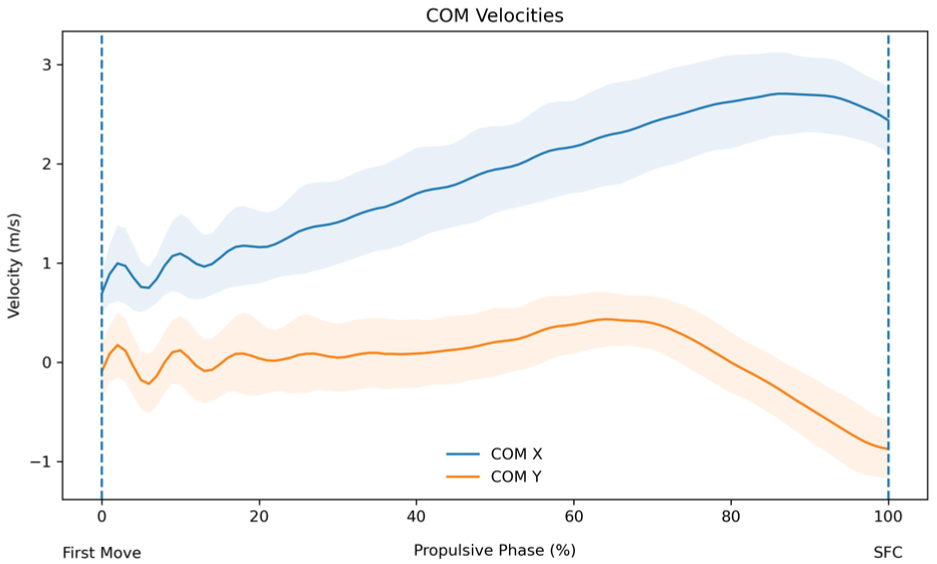
Time-normalized mean curves (0%-100% of the propulsive phase) for horizontal (COMx) and vertical center of mass (COMy) velocities. Solid lines represent means, with shaded regions indicating ±1 SD. Vertical lines denote first move and stride foot contact (SFC).
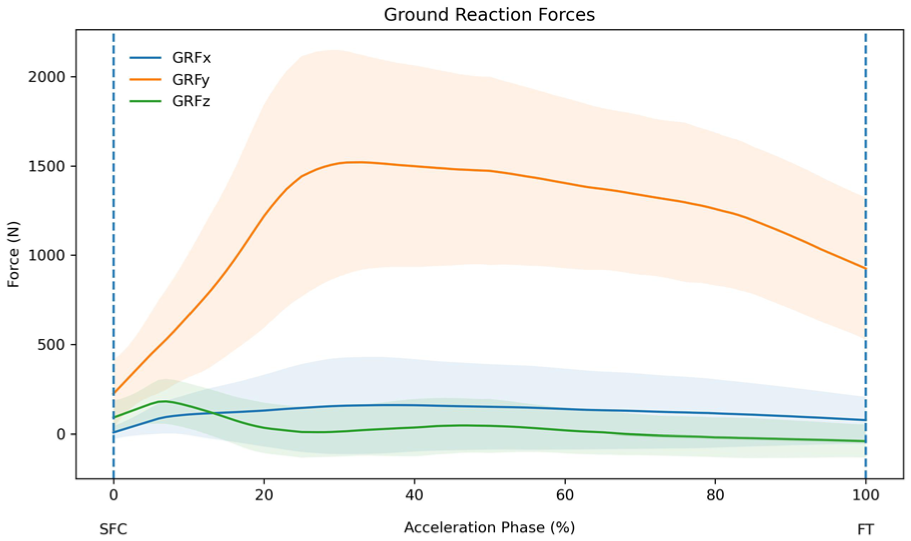
Time-normalized mean curves (0%-100% of the acceleration phase) for anteroposterior, vertical, and mediolateral ground reaction forces (GRFx, GRFy, and GRFz, respectively). Solid lines represent means, with shaded regions indicating ±1 SD. Vertical lines denote stride foot contact (SFC) and follow-through (FT).
Discussion
The objective of this study was to examine the relationships among lower extremity kinematic, kinetic, and COM velocities associated with pitch velocity. The results support our hypothesis that specific lower extremity variables, particularly COM velocity, stride leg GRFs, and pelvic rotational velocity, are significant contributors to pitching performance, consistent with previous literature on athletic tasks.20,26,39 The regression analysis identified factors that uniquely explained variance in pitch velocity, after accounting for shared relationships among predictors. The final model identified peak vertical COM velocity, peak horizontal COM velocity, peak GRFy, and body mass as significant positive predictors, while peak GRFx and peak negative pelvic rotation velocity were significant negative predictors.
Softball pitchers are often encouraged to “stride out” to improve performance; however, body height–normalized stride length was not associated with pitch velocity, suggesting that, generally, a farther stride does not influence pitch velocity. Previous research in collegiate softball pitchers has shown that pitchers with upper extremity pain exhibit longer strides, suggesting that excessive stride length may be associated with increased upper extremity pain. 28 Additionally, the COM position at SFC, which shifted backward toward the drive leg, was associated with upper extremity pain. 28 This phenomenon is typically referred to as “anchoring,” 15 wherein the back foot drags behind the pitcher, limiting the ability to effectively drive out. Pitchers who attempt to maximize their stride distance may disrupt their ability to transfer energy efficiently from the lower to the upper body, increasing their risk of injury. These findings align with the present work, which suggests that the effectiveness of a pitcher's stride is better determined by the magnitude of COM velocities, specifically, the combination of vertical and horizontal COM velocity, rather than how far they stride out. While previous research in baseball has demonstrated that increased stride length may enhance ball velocity without clear implications for upper extremity injury risk, 22 these findings may not directly translate to softball pitching because of fundamental biomechanical differences between the overhand baseball pitch and the underhand windmill softball pitch.
Vertical and horizontal COM velocities were identified as the most significant predictors of pitch velocity, potentially reflecting the pitcher's ability to utilize upward and forward momentum of their COM during the PR phase of the windmill pitch. While limited research has directly examined COM velocity in softball pitching, these findings provide insight into a previously underexplored aspect of performance. During PR, extension of the drive leg and coordinated trunk and upper extremity motion contribute to upward movement of the COM, allowing for efficient energy transfer from the lower extremities to the upper body. These findings are consistent with general principles of explosive movement, in which coordinated lower extremity extension, in conjunction with upper extremity motion, contributes to whole-body momentum generation.3,17,19,20,37 During softball pitching, the faster this coordinated movement occurs, the faster the pitcher's COM rises, and the forward momentum propels the pitcher toward home plate. It is important to interpret this within reason, as increasing movement speed may affect the timing of body positions and coordination. Coordinated upward and forward COM velocity can facilitate effective energy transfer from the lower extremities to the upper body. Therefore, a powerful, well-timed push-off may help increase pitch velocity.
Additionally, peak GRFs, particularly GRFy and GRFx between SFC and BR, were significant predictors of pitch velocity. This underscores that producing greater normalized vertical force through the lead leg upon landing may more effectively transfer energy through the kinetic chain, thereby increasing pitch velocity. However, GRFx on the stride leg was negatively associated with pitch velocity. Unlike baseball pitchers, who typically land with a more flexed stride knee and rely on higher braking forces of the stride leg,6,39 softball pitchers land with a more extended stride leg, emphasizing the need to increase vertical force at foot contact and minimize posteriorly acting GRF to produce pitch velocity. Previous work in softball pitching has demonstrated that peak drive leg vertical GRF was positively associated with pitch velocity, underscoring the importance of vertical force generation during PR. 26 While we did not assess vertical GRF of the drive leg in our current study, these findings reinforce the significance of vertical force application throughout the entire pitching motion. Effective production and redirection of vertical force assists in facilitating energy transfer through the kinetic chain, contributing to higher pitch velocities and potentially reducing upper extremity kinetics. Additionally, prior studies have shown that increased vertical force correlates with reduced shoulder kinetics, supporting the role of vertical force management in both performance enhancement and injury prevention. The role of the stride leg in softball pitching performance remains underexplored; however, these findings suggest it plays a critical role and warrant further research.
Previous research in both softball and baseball has highlighted the importance of the pelvis and its influence on pitchers’ health and performance,5,21,34,38 suggesting that it plays a vital role in energy transfer to the upper body during pitching.4,29,30 In the current study, pelvic rotational velocity was a significant predictor in the regression model. Specifically, pelvic rotational velocity toward the throwing arm side during PR was associated with pitch velocity. Softball pitchers tend to rotate their pelvis toward the throwing arm side right before SFC, which aids drive leg hip extension while clearing space for the throwing arm's downswing. This counter-rotation potentially creates a stretch-shortening effect between the trunk and pelvis, allowing stored elastic energy to contribute to upper extremity force production. 25 We propose that an initial delay in pelvic rotation toward the pitching arm during PR may require a more rapid rotation to promote arm clearance past the hips, potentially increasing pitch velocity. Both the magnitude and timing of this pelvic rotation are likely crucial for optimizing pitch velocity; however, the current study only assessed the magnitude of rotational velocity. Additionally, as upper extremity kinetics were not evaluated, the potential implications of increased pelvic rotational velocity on throwing arm loading remain unclear and warrant further investigation.
Based on these findings, pitchers aiming to maximize velocity should focus on producing a forceful push-off during PR, emphasizing vertical and anterior COM velocity rather than increasing stride length alone. Additionally, quick and well-timed pelvic rotation toward the throwing arm side during PR may be beneficial for performance; however, because the current study did not examine the timing of pelvic rotation, a better understanding of how the timing of pelvic rotation influences pitch velocity is warranted. Finally, pitchers who produce greater normalized GRFy through the stride leg upon landing may create a more stable base of support, allowing energy generated by the lower limbs and trunk to be transferred efficiently to the throwing hand. Training strategies aiming to improve lower body force production and effective landing may benefit pitchers trying to improve their performance.
It is important to acknowledge that strategies aiming to increase pitch velocity could potentially come at the expense of pitching accuracy. However, this trade-off may not occur in all pitchers, as some may be able to increase velocity without compromising command. Therefore, practitioners should consider an individualized approach, balancing efforts to enhance pitch velocity while maintaining accuracy and command.
Limitations
This study is not without limitations. First, only the GRFs of the stride leg were investigated because of the laboratory setup. Future studies should examine the relationship between drive leg GRFs and pitch velocity. Second, the analysis was limited to lower extremity kinematics and kinetics, which constrains the understanding of how the entire kinetic chain influences energy transfer; including upper extremity variables would provide a more comprehensive perspective. Third, because this study was cross-sectional, we cannot infer causality between the kinematic and kinetic variables and pitch velocity. Longitudinal or intervention studies are warranted to understand how changes in lower extremity kinematics and kinetics can influence changes in pitch velocity. Fourth, the inclusion of a mixed cohort design consisting of high school and collegiate pitchers presents a limitation of the study, as differences in age, competition level, and maturation may influence pitching mechanics.10,23,27 Fifth, this study was limited to fastballs. Future studies should explore the role of the lower body for pitch velocity using different pitch types. Finally, these findings should be interpreted with consideration for individual variability, recognizing that optimal mechanics may differ among pitchers.
Conclusion
This study demonstrated that lower extremity kinematics and kinetics, specifically vertical and anterior COM velocity, pelvic rotation during PR, and stride leg GRFy, are associated with pitch velocity in high school and college softball pitchers. These findings underscore the significant role of the lower body in generating power during the windmill softball pitch.
Footnotes
Appendix
Appendix
Variance Inflation Factors (VIF) for Predictors Included in the Final Regression Model a
| Variable | VIF |
|---|---|
| Pelvic rotational velocity | 1.27 |
| COM velocity X | 1.32 |
| COM velocity Y | 1.34 |
| Body mass | 1.33 |
| GRFx | 1.26 |
| GRFy | 1.60 |
| GRFz | 1.21 |
COM, center of mass; GRF, ground-reaction force; GRFx, anteroposterior GRF; GRFy, stride leg vertical GRF; GRFz, mediolateral GRF.
Final revision submitted April 20, 2026; accepted April 23, 2026.
The authors declared that there are no conflicts of interest or sources of funding in the authorship and publication of this contribution.
Ethical approval for this study was obtained from Auburn University's institutional review board.