






Abstract
Background:
Assessment of glenoid bone loss is essential in managing anterior shoulder instability. Although glenoid height–based methods are straightforward and practical for estimating native glenoid width in injured shoulders, inconsistent formulas across studies have created uncertainty in clinical practice, possibly due to population differences.
Purpose:
To systematically review the literature to (1) compare glenoid height and width according to sex and population and (2) synthesize unique sex- and population-specific regression equations for height-based assessment of glenoid bone loss.
Study Design:
Systematic review and meta-analysis; Level of evidence, 3.
Methods:
A systematic review was conducted according to the Preferred Reporting Items for Systematic Reviews and Meta-Analyses guidelines. PubMed, Embase, Cochrane Library, and Google Scholar were searched through July 2025 for studies reporting glenoid height and width using computed tomography. Data on demographics, glenoid height, width, and regression equations were extracted. Risk of bias was assessed using the Methodological Index for Non-Randomized Studies (MINORS) criteria. Pooled mean differences were calculated using random-effects meta-analysis, and sex- and population-specific regression equations were synthesized with inverse-variance weighting.
Results:
Five studies comprising 819 shoulders met the inclusion criteria. The MINORS scores ranged from 9 to 10 (out of 16). Males had significantly larger glenoid dimensions than females, with mean differences of 5.30 mm in height and 4.52 mm in width (both P < .0001). Western and Asian populations did not differ in glenoid height (P = .7562), but Western populations had significantly greater glenoid width (mean difference, 3.42 mm; P = .0043). Synthesized regression equations confirmed linear relationships between glenoid height and width, with regression models differing according to sex and population. Of note, Western females were predicted to have greater glenoid width than Asian males and females at equivalent glenoid heights.
Conclusion:
Estimating glenoid width from glenoid height has been proposed in multiple studies. Because this relationship differs by sex and population, subgroup-specific regression equations should be applied when making such estimations. While these formulas do not represent an individual's native glenoid anatomy, they can serve as reference values and support surgical decision-making, reinforcing the importance of population-specific strategies in instability surgery.
Keywords
Once the shoulder dislocates, it is no longer the same joint. Both soft tissue and bony structures undergo lasting alterations, including capsulolabral injury, plastic deformation of the capsule, glenoid bone loss, and Hill-Sachs lesions. Consequently, surgical strategy should incorporate this multifactorial pathology, addressing both soft tissue insufficiency and bony defects. 1 Notably, glenoid bone loss exceeding 5% of the glenoid diameter is common even after a first-time dislocation, and the degree of bone loss tends to progress with recurrent instability. 6 When glenoid bone loss is substantial, Bankart repair alone may be insufficient to restore stability, and bony augmentation procedures are often required. 5 Thus, the accurate assessment of glenoid bone loss is central to successful surgical decision-making.
Since the preinjury glenoid cannot be directly reconstructed, several approximation techniques have been proposed. The best-fit circle method estimates the inferior glenoid contour using a circle, yet it is limited by morphological distortion after injury and inconsistency in drawing the circle. 7 The contralateral glenoid method provides an individualized reference, yet requires additional imaging, which incurs extra costs and potential additional radiation exposure, and carries complexity in clinical application. 11 Glenoid height–based methods are attractive for their simplicity and reliability, as they require only a single measurement of glenoid height. However, subsequent studies applying height-based equations have reported conflicting results reflecting differences across populations.3,8,16-18,20 Because glenoid morphology may differ across sex and populations (Western or Asian), a one-size-fits-all equation may misrepresent bone loss. Refining height-based methods for these factors could enhance clinical decision-making.
We hypothesized that glenoid height and width differ according to sex and population. The purpose of this study was to perform a systematic review and meta-analysis to (1) demonstrate differences in glenoid height and width according to sex and population and (2) synthesize sex- and population-specific equations for height-based assessment of glenoid bone loss. By providing refined prediction models, we aimed to improve the clinical applicability of height-based measurement methods in the evaluation of glenoid bone loss.
Methods
Search Strategy
This review was preregistered in the PROSPERO database of systematic reviews and conducted according to a predefined protocol in line with the Preferred Reporting Items for Systematic Reviews and Meta-Analyses guidelines.
14
A comprehensive search strategy was developed to identify relevant studies. PubMed, Embase, the Cochrane Library, and Google Scholar were systematically searched for articles published up to July 29, 2025. The search terms included the following: [(shoulder[Title/Abstract]) AND (glenoid[Title/Abstract]) AND (height[Title/Abstract]) AND (width[Title/Abstract]) AND (predict[Title/Abstract] OR estimat*[Title/Abstract] OR regression[Title/Abstract] OR formula[Title/Abstract] OR relationship[Title/Abstract] OR calculate*[Title/Abstract])].
Identification of Eligibility
Studies were eligible for inclusion if they met the following criteria: (1) involved living human participants; (2) included individuals aged ≥16 years; (3) reported glenoid height and width measurements; (4) developed, validated, or compared linear formulas or regression models using glenoid height; and (5) utilized computed tomography (CT), including 3-dimensional (3D) CT reconstruction, for glenoid measurement.
Studies were excluded if they (1) were conducted on cadaveric specimens; (2) relied solely on non-CT imaging modalities such as magnetic resonance imaging (MRI); (3) relied only on simple width-to-height ratios without developing a regression equation; (4) included patients with confounding conditions such as multidirectional instability, severe arthritis, or bone tumors; or (5) were nonoriginal research, including conference abstracts, posters, editorials, reviews, book chapters, or letters.
Eligibility screening was performed independently by 2 reviewers (W.S.D. and T.H.Y.). Any discrepancies were resolved by discussion, and unresolved disagreements were adjudicated by a senior reviewer (Y.M.C.).
Data Extraction
Data were independently extracted by 2 reviewers (W.S.D. and T.H.Y.). The following variables were collected: first author, year of publication, level of evidence, country of study, patient demographics (sex and age), clinical status (healthy individuals or patients with contralateral shoulder instability), glenoid height and width, and regression equations estimating glenoid width from glenoid height. We confirmed that all included studies used consistent measurement definitions on standardized 3D CT en face views: glenoid height was defined as the maximal distance between the 12- and 6-o’clock positions and width as the maximum distance perpendicular to this height axis, rather than at a fixed anatomic landmark. Additionally, populations were categorized as “Western” (eg, Canada) or “Asian” (eg, China, Japan) based on the geographic and demographic descriptions in the original studies. Any discrepancies in data extraction were resolved by discussion and consensus. When data were missing or unclear, attempts were made to contact the study authors for clarification or additional information.
In accordance with the Sex and Gender Equity in Research (SAGER) guidelines, data were collected based on sex, defined biologically. 9 Two reviewers (W.S.D. and T.H.Y.) independently assessed risk of bias using the Methodological Index for Nonrandomized Studies (MINORS) criteria. 19 Each item was scored as 0 (not reported), 1 (reported but inadequate), or 2 (reported and adequate), yielding a total score ranging from 0 to 16 for noncomparative studies (8 items).
Statistical Analysis
Descriptive statistics, including means and standard deviations, were recorded for numerical variables. Glenoid height and width were evaluated with respect to sex and country of publication.
The results of the meta-analysis are presented as forest plots, with point estimates and 95% confidence intervals for each study and the overall pooled effect. Heterogeneity was assessed using the I2 statistic, which quantifies the proportion of total variability across studies attributable to between-study heterogeneity rather than chance, expressed as a percentage. Because differences by sex and population were expected, a random-effects model was applied. Statistical significance was defined as a P value <.05.
For sex-based comparisons, studies reporting both male and female subgroups were analyzed using random-effects meta-analysis of mean differences, treating each study as a paired comparison. In contrast, because no individual study simultaneously reported both Western and Asian cohorts, pooled random-effects means were first estimated separately for each subgroup, and the mean difference between subgroups was then calculated with 95% confidence intervals.
After confirming group-level differences, regression equations from individual studies were synthesized according to sex and population. 2 The regression model was expressed as

For each subgroup, the regression slope (a) was first synthesized across studies using a random-effects meta-analysis with inverse-variance weighting based on the reported standard errors. To allow comparability across studies with different mean glenoid heights, we defined a common “anchor height” (H0), calculated as the inverse-variance weighted mean of the reported mean heights. At this reference point, the predicted glenoid width for each study was estimated and its variance derived. These study-specific predictions were then combined using inverse-variance weighting to yield a pooled estimate of glenoid width at the anchor height (
Results
The initial database search identified 369 records. After removing 127 duplicates, 242 records were screened by title and abstract. Of these, 234 were excluded as irrelevant, and 8 full-text articles were assessed for eligibility. Three studies were excluded (2 using multivariate models and 1 MRI-based study), leaving 5 studies comprising 819 shoulders for inclusion in the final analysis (Figure 1). The characteristics of the included studies are summarized in Table 1.
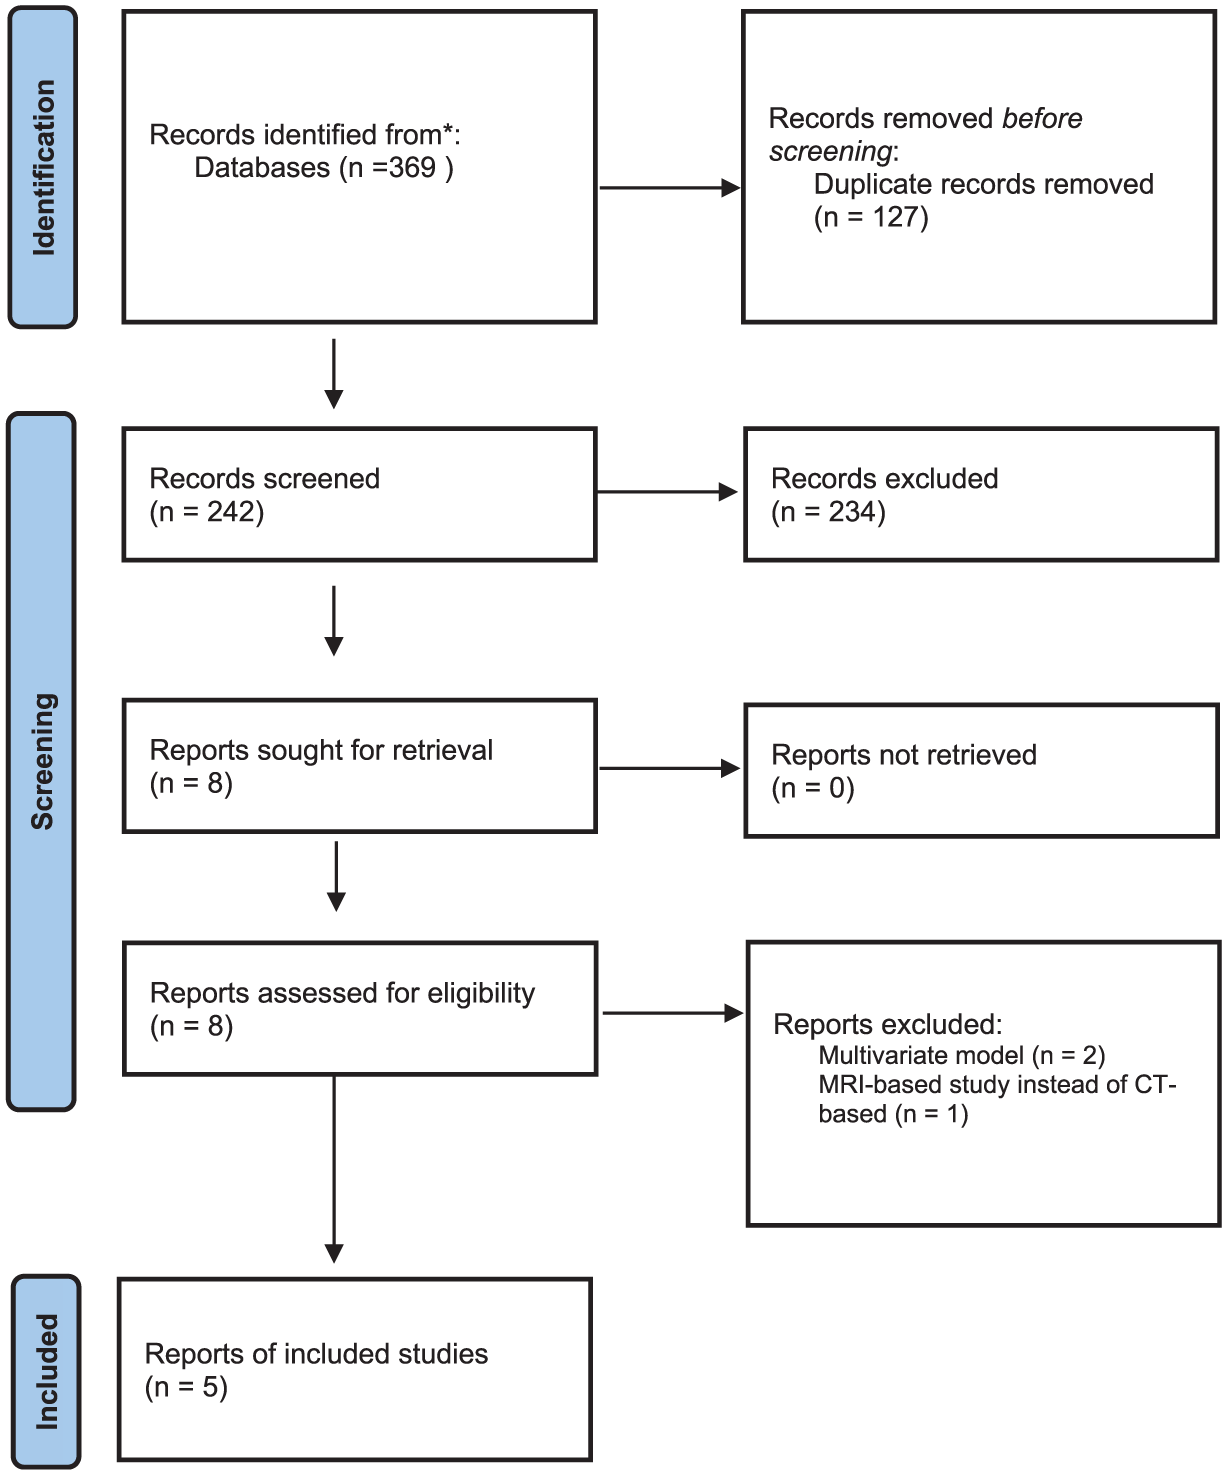
Preferred Reporting Items for Systematic Reviews and Meta-Analyses flow diagram for the systematic review.
Characteristics of the Included Studies a
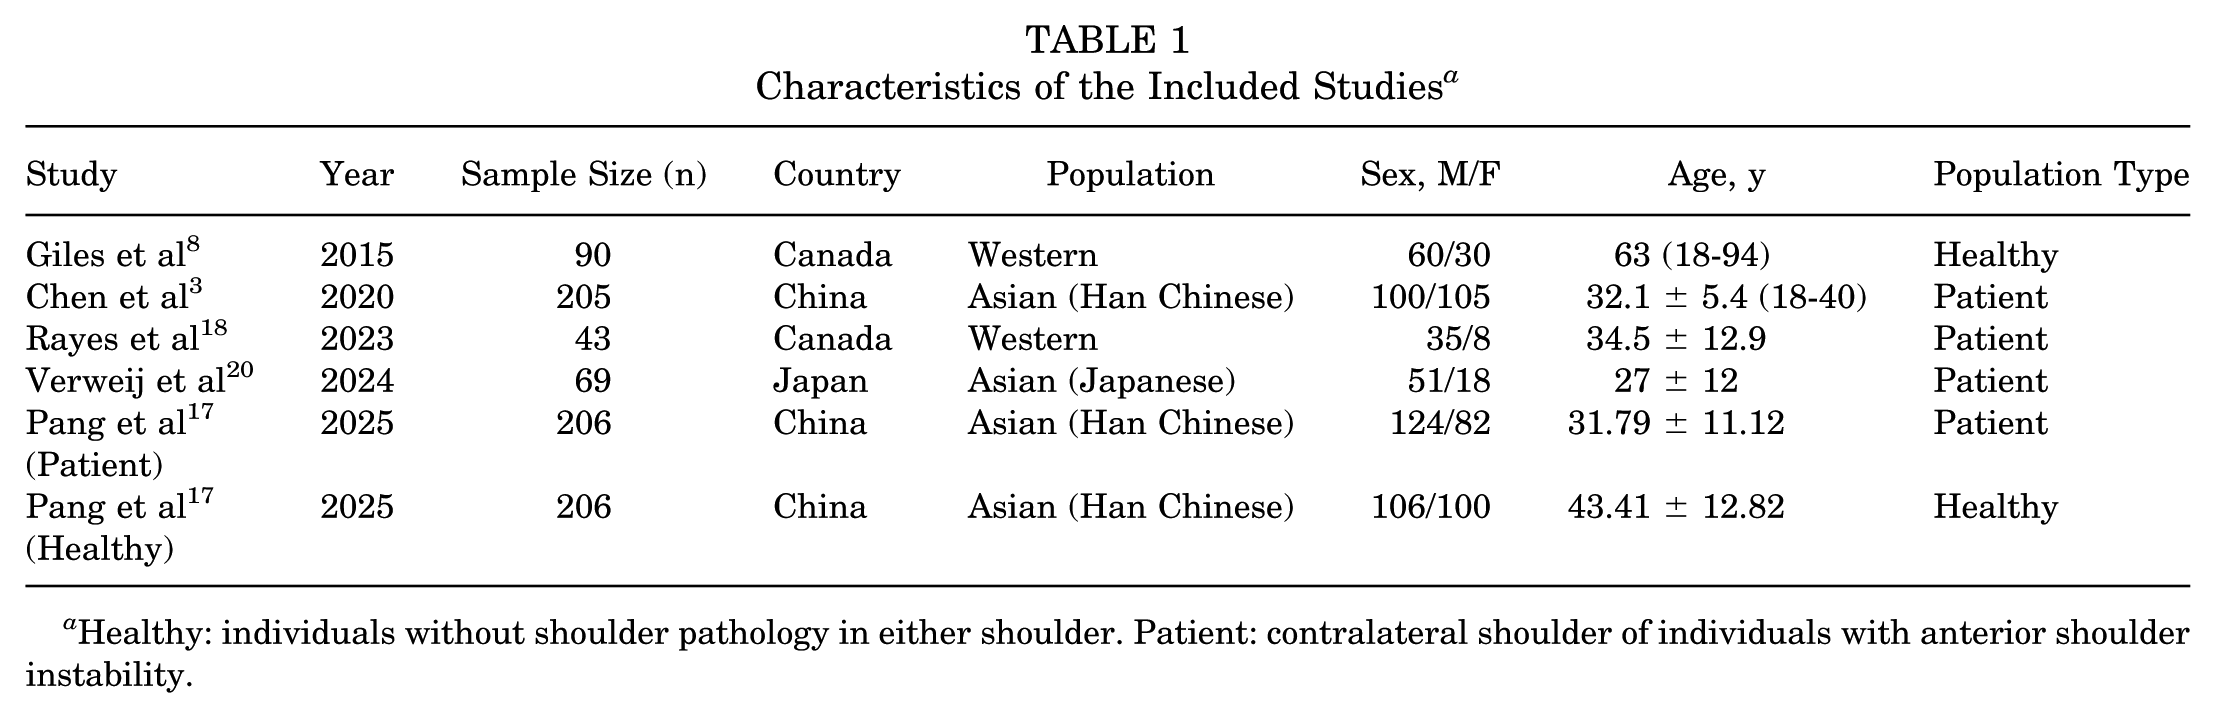
Healthy: individuals without shoulder pathology in either shoulder. Patient: contralateral shoulder of individuals with anterior shoulder instability.
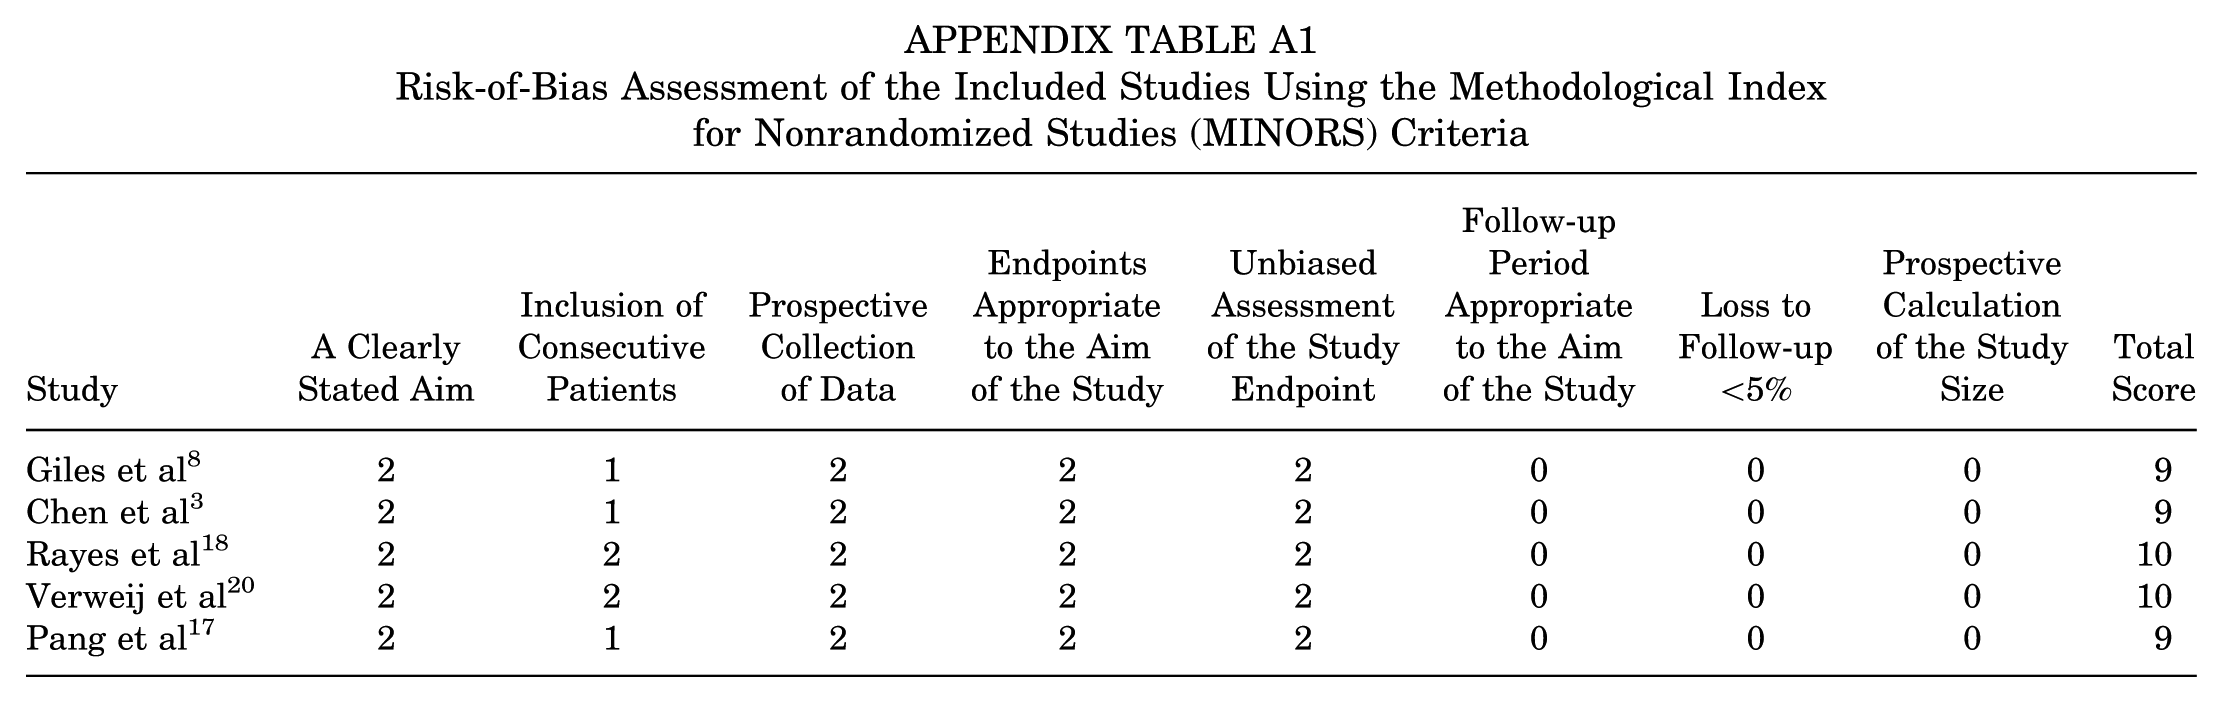
The MINORS scores ranged from 9 to 10 across studies, with consistently lower scores for the 3 follow-up–related items, which were not applicable given the cross-sectional design. Detailed scores are provided in Appendix Table A1.
All studies measured glenoid height as the maximum distance from the superior pole (12-o’clock position) to the inferior pole (6-o’clock position) and glenoid width as the maximum measurement perpendicular to this height.
Pang et al 17 reported 2 nonoverlapping cohorts with separately reported regression equations: 206 patients with anterior shoulder instability in whom the contralateral shoulder was measured and 206 individuals from a healthy population with no history of shoulder pathology. These were treated as separate studies in the meta-analysis and synthesized accordingly.
Four studies reported glenoid height and width stratified by sex. All 4 studies also provided regression equations for the overall cohort, whereas Chen et al 3 reported only sex-specific regression formulas. For this study, pooled estimates were used to derive an overall regression equation. In addition, 3 studies presented sex-specific regression equations, which were synthesized separately.
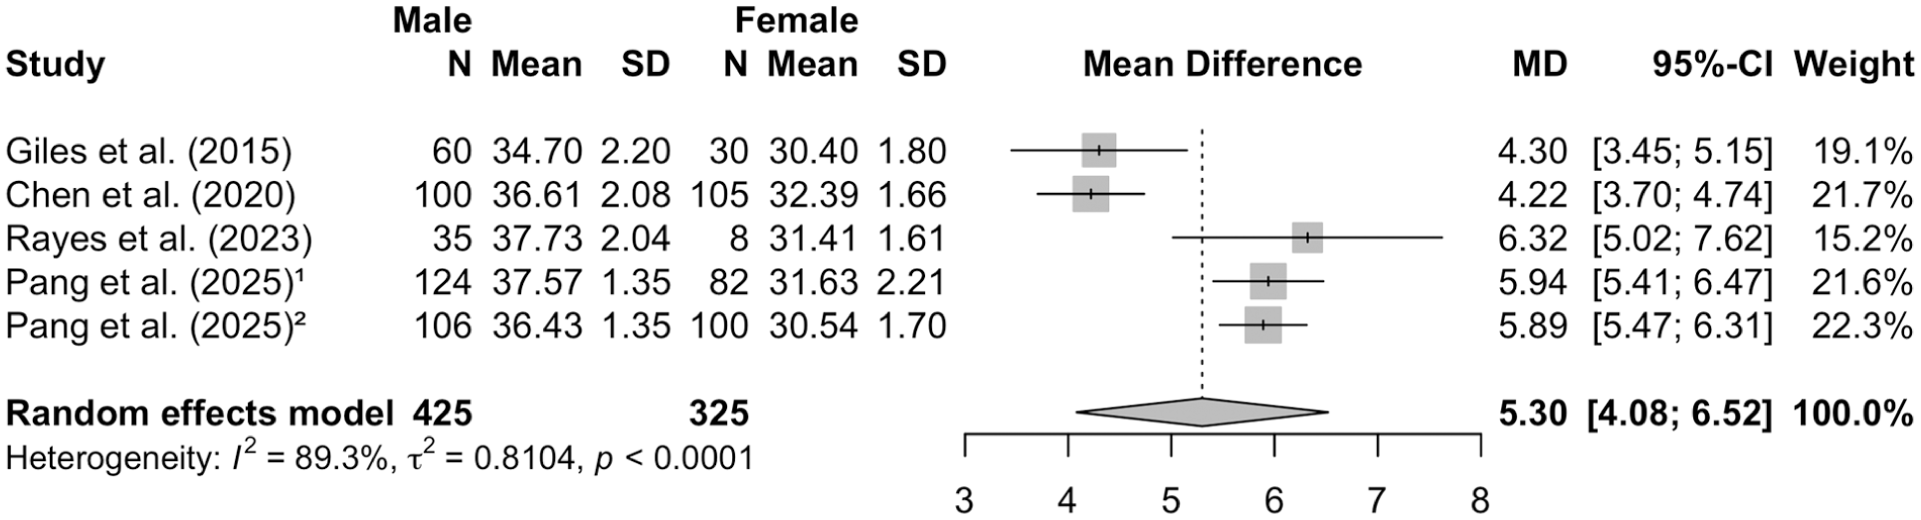
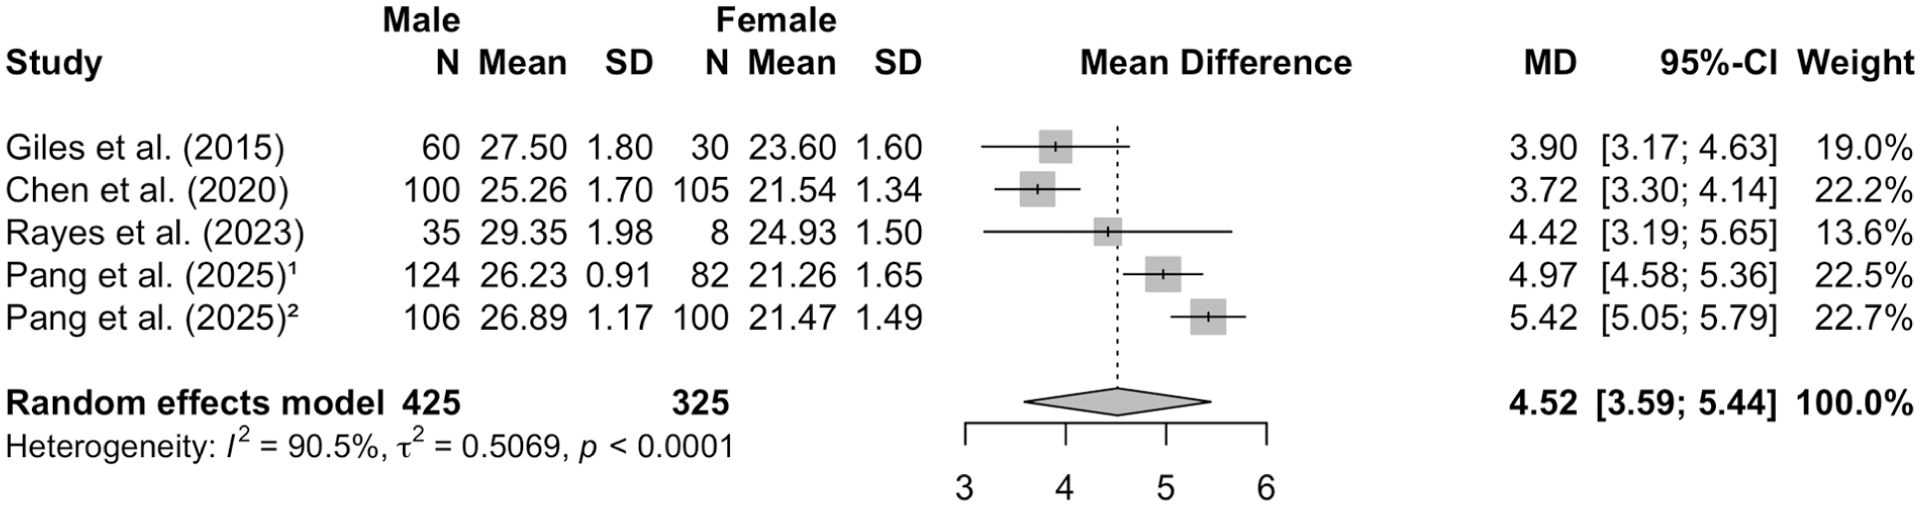
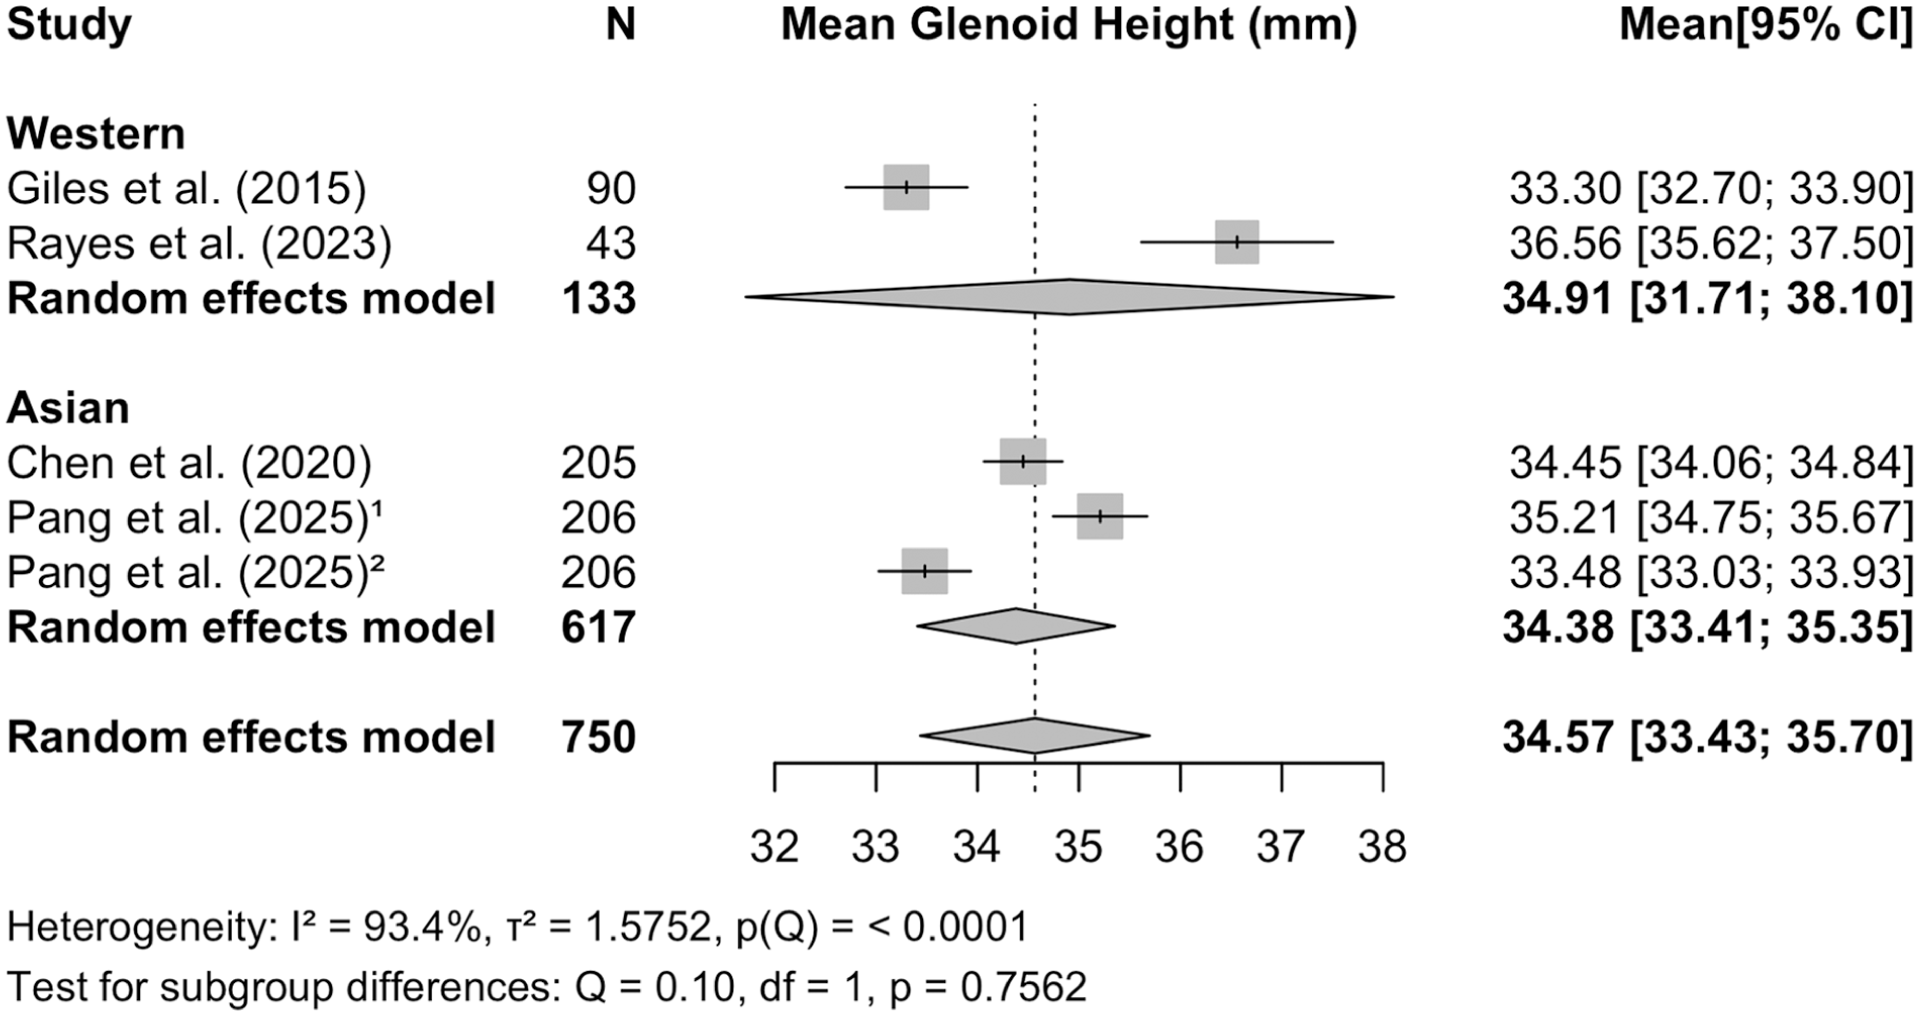
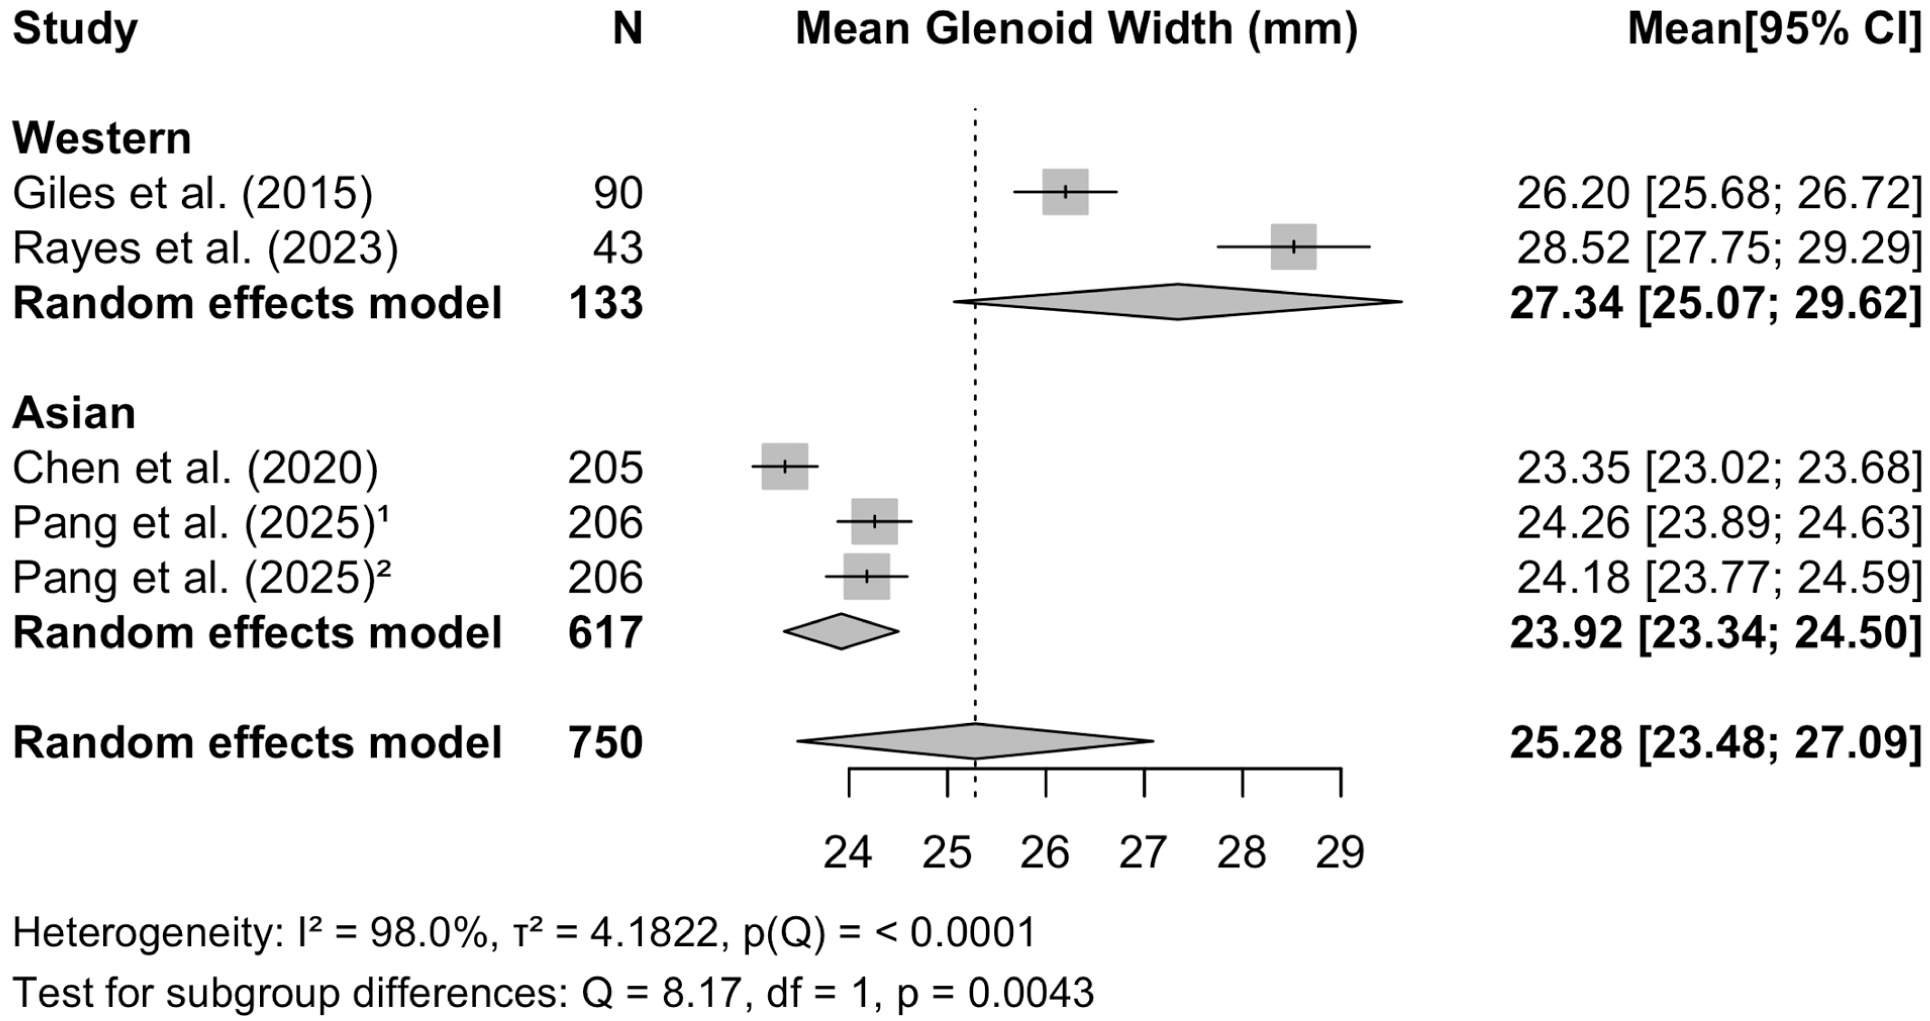
Males had larger glenoid height (mean difference, 5.3 mm) and glenoid width (mean difference, 4.52 mm) compared with females (both P < .0001; Figures 2 and 3). Western populations did not differ significantly from Asian populations in glenoid height (P = .7562; Figure 4) but had a significantly larger glenoid width (mean difference, 3.42 mm; 95% CI, 1.07-5.77; P = .0043; Figure 5).
Each study's glenoid formula is summarized in Table 2. The synthesized equation derived from the whole full cohorts was Width = 0.724 × Height + 0.282, which was most similar to the formula reported by Verweij et al 20 (Figure 6). As shown in Figure 6, the Western population tended to predict a greater glenoid width for a given height, and the full-cohort equations from the 2 Western studies showed a similar pattern. Because Rayes et al 18 did not provide sex-specific equations, a meta-analytic equation could not be synthesized. For Asian males, the equation was Width = 0.542 × Height + 6.18, and for Asian females, it was Width = 0.536 × Height + 4.54 (Figure 7).
Glenoid Width Prediction Formulas Reported in the Included Studies
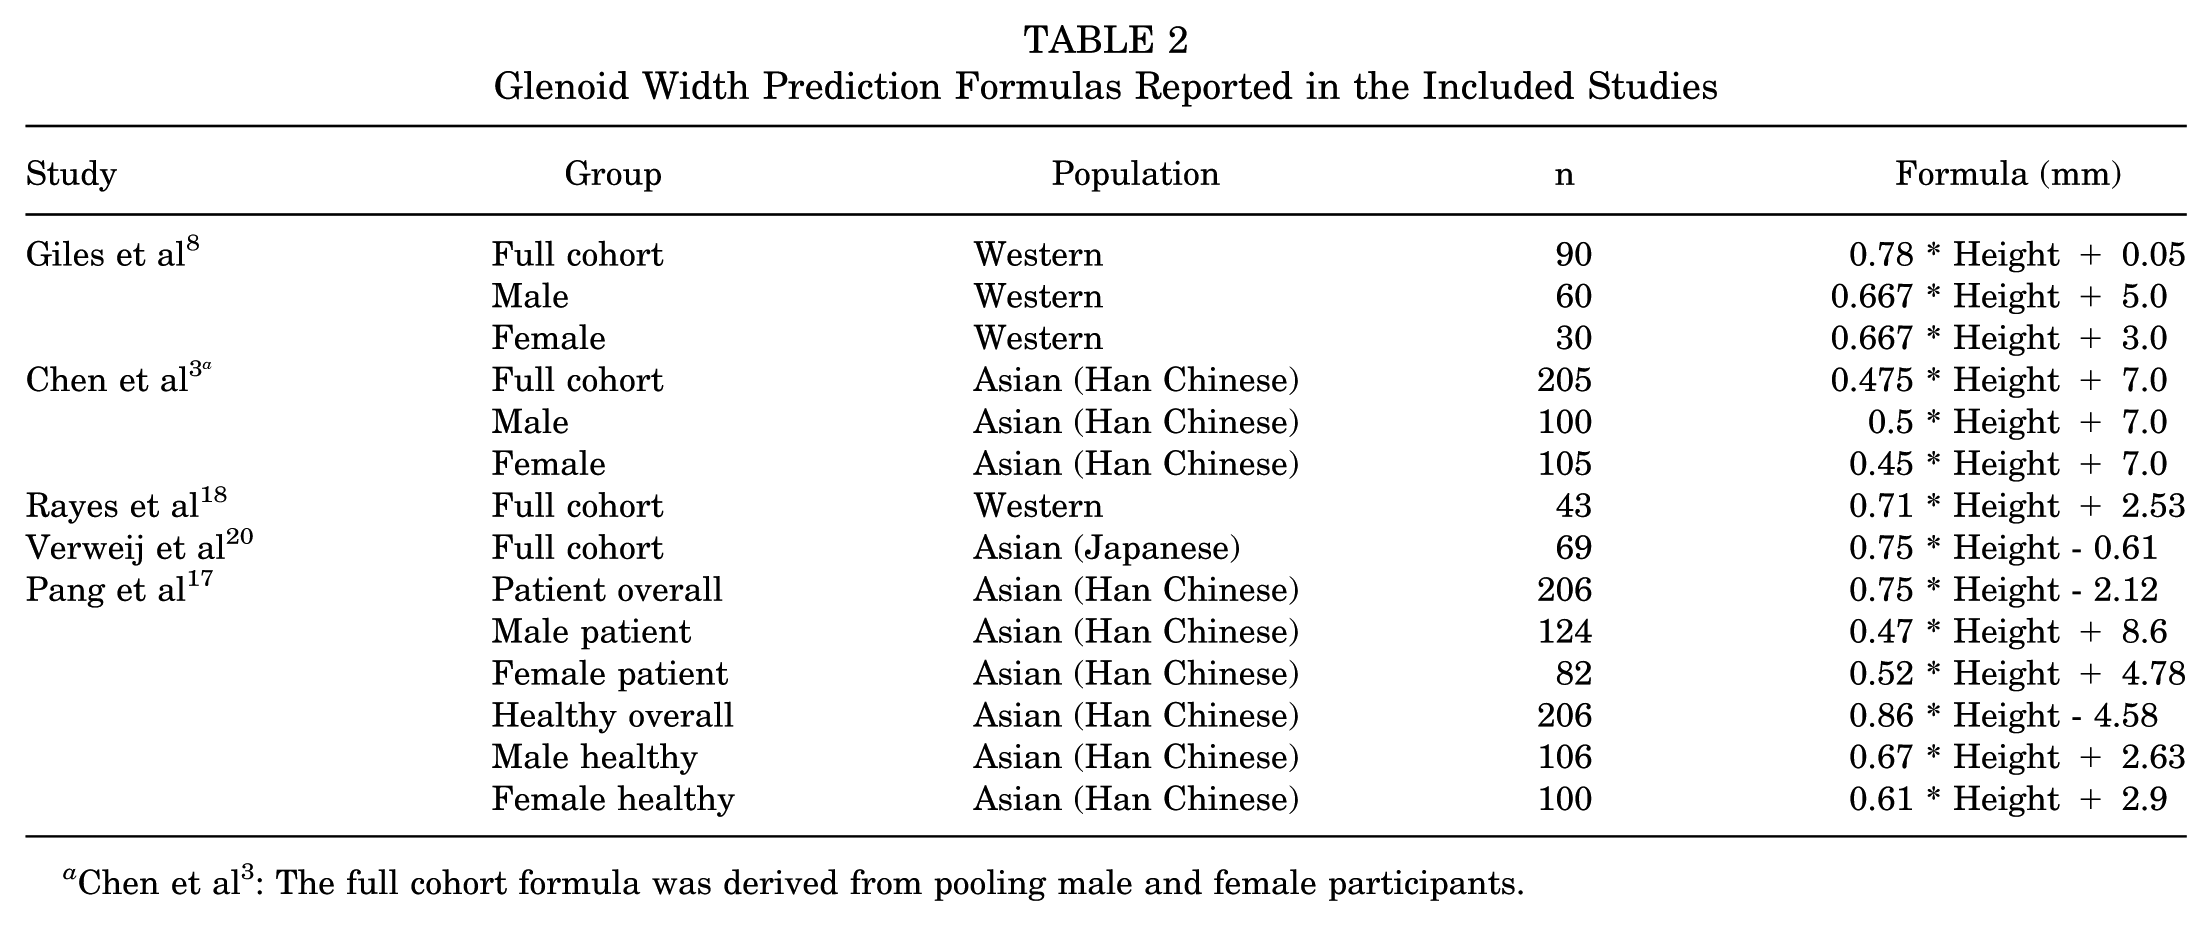
Chen et al 3 : The full cohort formula was derived from pooling male and female participants.
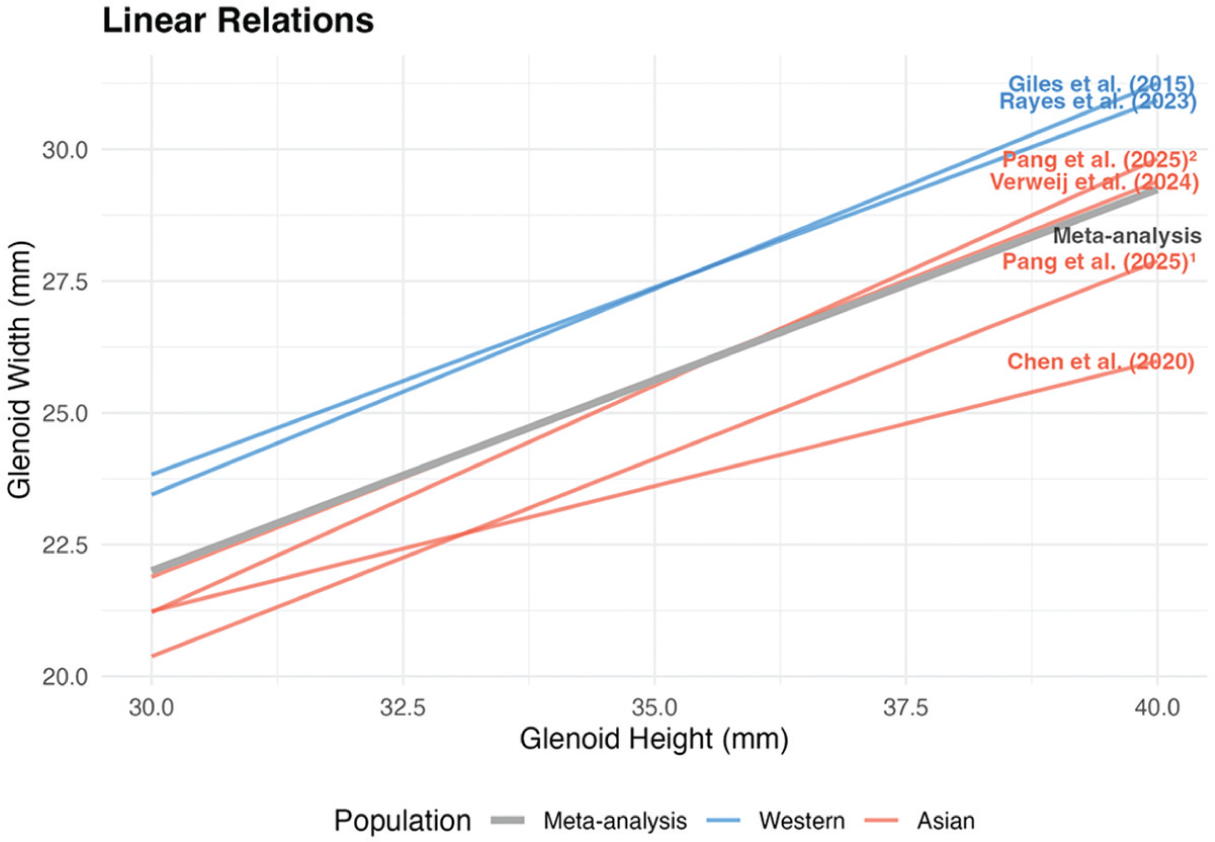
Regression from each study's whole cohort and pooled regression from the meta-analysis.
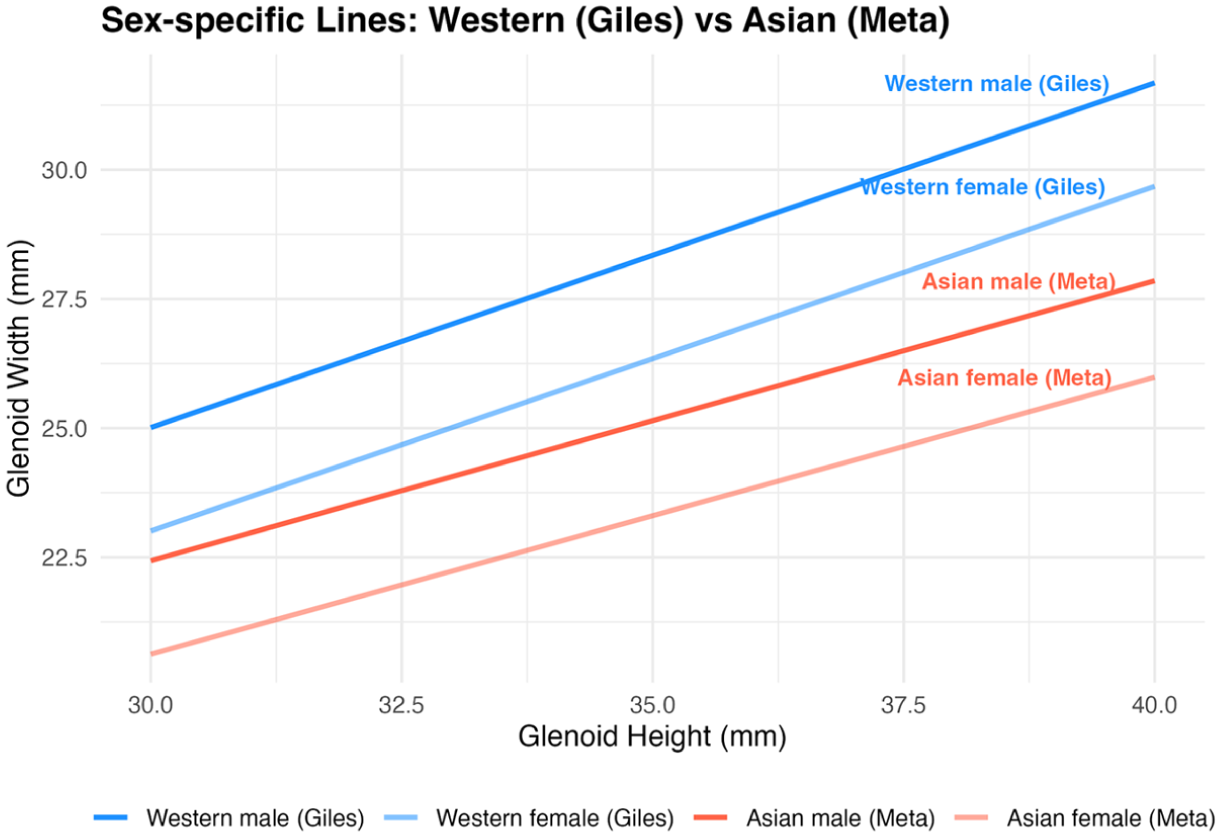
Sex-specific regression lines from each population. Within both Western and Asian populations, males demonstrated greater predicted glenoid width than females. Notably, Western females showed greater predicted width than Asian males and females for a given glenoid height.
Discussion
The primary finding of this study is that glenoid dimensions differ not only by sex but also by population, based on the available data or current published literature. Specifically, Asian shoulders demonstrated narrower glenoid width compared with Western counterparts, even after accounting for height. These differences suggest that regression formulas for estimating glenoid width should be tailored according to both sex and population, rather than applied universally. In this context, we provide the first meta-analytic synthesis of sex- and population-specific regression equations for glenoid morphology. Importantly, because the track theory—widely used in instability surgery—was originally derived from Asian cohorts, 21 our results introduce new considerations for its interpretation and application across diverse populations.
The height-based method uses glenoid height as its reference, defined simply as the distance between the superior pole (12-o’clock position) and the inferior pole (6-o’clock position). This method is straightforward and highly reproducible, and several studies have shown higher inter- and intraobserver reliability compared with best-fit circle techniques.11,17,20 Nevertheless, various regression formulas have been proposed across studies, leading to confusion about which should be adopted in clinical practice. Our investigation was motivated by these differences across studies. In addition, recent work has also highlighted a tendency for height-based methods to overestimate glenoid width. Arenas-Miquelez et al 1 demonstrated in 6 cadaveric specimens that height-based measurements yield consistent results even for less experienced observers, but the predicted values systematically exceeded the true glenoid width. However, given the very small sample size and cadaveric design, the generalizability of these findings is limited. In addition, their analysis used the formula proposed by Giles et al, 8 which in this study produced the largest width estimates and was based on a healthy cohort. This suggests that the observed overestimation may reflect formula selection rather than a fundamental flaw of the height-based approach. Had a population-specific equation been applied, the results might have differed. These findings underscore the need for future height-based studies to consider the influence of race and ethnicity on glenoid morphology when assessing bone loss.
A notable observation in our meta-analyses is the substantial heterogeneity observed across the included studies. Although the results varied across studies, certain patterns remained consistent. For example, in sex-based analyses, males consistently demonstrated larger glenoid dimensions than females, although the magnitude of this difference varied across studies, contributing to the observed heterogeneity. In contrast, population-based analyses showed considerable variability across studies without a uniform direction of difference, particularly for glenoid height. This further suggests that the relationship between glenoid dimensions and demographic factors is not uniform across study populations. Therefore, the observed heterogeneity highlights the limitation of applying a single universal equation across diverse patient groups.
The finding that glenoid width differs by population has important implications for the glenoid track theory, which remains the most widely applied framework in the surgical management of instability. 1 For instance, a male patient may be classified as having an off-track lesion when bone loss is assessed using conventional calculation methods. However, if that patient belongs to a Western population with a wider native glenoid, the same lesion may in fact fall within the true glenoid track, suggesting potential misclassification when uniform reference values are applied. In detail, the glenoid track is calculated as 0.83 or 0.84 × glenoid width – bone loss size, where the coefficient 0.83 was derived from the average ratio observed in 9 Japanese cadaveric shoulders, and 0.84 was obtained from a study of 30 healthy Japanese individuals.15,21 This parameter was not established through regression modeling but reflects an anatomic constant from a specific cohort. Considering our results, in which Asian glenoids were consistently narrower than Western glenoids, it is plausible that Western populations may inherently possess a wider native track. In other words, the assumption of a uniform 0.84 coefficient across all populations may not hold. Moreover, because glenoid width itself varies by both sex and population, the effect of these differences on the track calculation may be amplified. These findings suggest that population- and sex-related differences in glenoid width may influence calculated glenoid track values, particularly in borderline cases, and should be considered when interpreting track-based assessments.
At the start of this study, we perceived that estimating glenoid width using equations lacked the ability to reflect individual anatomy, compared with best-fit circle or contralateral methods. Equation-based approaches apply a uniform relationship between height and width, potentially overlooking individual morphological variation. By contrast, best-fit circle and contralateral reconstructions initially appeared more tailored to each patient's anatomy. However, closer examination reveals that best-fit circle methods are not free from individual variability either, as the degree to which a native glenoid conforms to a circular contour varies across individuals. In simple terms, while equations function by matching height to width, the best-fit circle method matches the inferior glenoid curvature to a circular arc. Both are, in essence, approximations, and neither fully captures the full spectrum of individual variation. In contrast, the contralateral method directly reflects the patient's own anatomy, assuming the opposite shoulder is truly representative. This allows individualized estimation and reduces the risk of overestimation in patients with naturally narrow glenoids but comes with a host of adverse considerations in implementation. 10
Nevertheless, a clinical dilemma arises: if a patient's native glenoid width is inherently smaller than average, contralateral comparison may suggest minimal bone loss, whereas an equation derived from population averages might indicate clinically meaningful loss, warranting intervention, such as remplissage or bony augmentation procedures. Cohn et al 4 reported that a smaller native glenoid width predisposes patients to shoulder instability. Therefore, even when the contralateral method indicates minimal bone loss, clinicians must not overlook the heightened risk of recurrent instability if the patient's native glenoid is constitutionally narrower than the population average. Equations approximate the population average. Thus, it remains uncertain whether it is clinically appropriate to measure bone loss only against the individual's native anatomy or whether a patient with a narrower-than-average glenoid should be managed more aggressively. Even for clinicians who prefer contralateral methods, it is important to recognize how much narrower a given patient's glenoid is relative to population norms. Therefore, we recommend applying the height-based method, at least as a complementary, standardized reference, even when using other methods. Future research should evaluate whether these predictive values can serve as valid surgical goals, alongside other established measurement techniques.
Recently, simplified approximations such as height × 0.7 or height × 2/3 have been proposed in several studies.12,13 These values essentially represent regression equations with the intercept omitted, providing a crude estimate of glenoid width. The validity of these formulas was supported by 2 studies,12,13 which argued that the mean estimates across cohorts did not differ substantially from those obtained using more complicated methods. However, the absence of mean differences does not necessarily imply equivalent accuracy at the individual measurement level. When slope alone is used without an intercept, mean values may align closely, although predictive accuracy at the individual level may still vary. Indeed, according to the present analysis, the values derived from 0.7 × height or 2/3 × height fall between the averages observed for Western females and Asian males. When applying such simplified formulas, the cohort of origin should be specified, and although simplicity may reduce precision, differences by sex and population should still be considered in interpretation.
This study has several limitations. First, the overall number of included studies was small, and the total sample size within certain subgroups was limited, especially in the Western population. Second, the Western cohorts were not entirely specific to a single ethnicity. Both Giles et al 8 and Rayes et al 18 were Canadian studies conducted in Ontario and Nova Scotia, where White patients are the dominant population but minority groups are also present. If a substantial proportion of Asian individuals were included in these cohorts, the observed difference in glenoid width between Western and Asian populations may have been underestimated. Third, sex- and population-specific synthesis was more limited in the Western cohorts. Only Giles et al 8 provided sex-stratified regression formulas, making pooled sex-specific synthesis challenging and resulting in fewer Western data than Asian cohorts. However, as shown in Figure 6, the regression lines from Rayes et al 18 and Giles et al 8 were among the most similar pairs across studies, suggesting that inclusion of sex-specific data from Rayes et al 18 might not have substantially altered the pooled estimates. Fourth, this meta-analysis was based on previously published regression equations, which necessarily restricted the range of populations that could be included. Only Western and Asian cohorts were represented, and these findings may not be generalizable to other ethnic or geographic populations. Fifth, all included studies were based on 3D CT imaging. Therefore, caution should be exercised when extrapolating these equations to MRI-based measurements, as differences in imaging modality may affect applicability. Lastly, most prior studies did not explicitly report prediction error metrics. Similarly, in the present study, we did not directly quantify prediction error. In addition, external validation of the proposed formulas was not performed, which represents another important limitation.
Conclusion
Estimating glenoid width from glenoid height has been proposed in multiple studies. Because this relationship differs by sex and population, subgroup-specific regression equations should be applied when making such estimations. While these formulas do not represent an individual's native glenoid anatomy, they can serve as reference values and support surgical decision-making, reinforcing the importance of population-specific strategies in instability surgery.
Footnotes
Appendix
Risk-of-Bias Assessment of the Included Studies Using the Methodological Index for Nonrandomized Studies (MINORS) Criteria
| Study | A Clearly Stated Aim | Inclusion of Consecutive Patients | Prospective Collection of Data | Endpoints Appropriate to the Aim of the Study | Unbiased Assessment of the Study Endpoint | Follow-up Period Appropriate to the Aim of the Study | Loss to Follow-up <5% | Prospective Calculation of the Study Size | Total Score |
|---|---|---|---|---|---|---|---|---|---|
| Giles et al 8 | 2 | 1 | 2 | 2 | 2 | 0 | 0 | 0 | 9 |
| Chen et al 3 | 2 | 1 | 2 | 2 | 2 | 0 | 0 | 0 | 9 |
| Rayes et al 18 | 2 | 2 | 2 | 2 | 2 | 0 | 0 | 0 | 10 |
| Verweij et al 20 | 2 | 2 | 2 | 2 | 2 | 0 | 0 | 0 | 10 |
| Pang et al 17 | 2 | 1 | 2 | 2 | 2 | 0 | 0 | 0 | 9 |
Final revision submitted March 18, 2026; accepted March 24, 2026.
The authors declared no potential conflicts of interest with respect to the research, authorship, and/or publication of this article.
Ethical approval was not sought for the present study.
