
Abstract
Current public health surveillance practices exhibit delays in outbreak onset detection due to time lags associated with symptom manifestation, diagnosis, and case reporting and aggregation. To accelerate disease outbreak detection, a 2-tier Human Sentinel Network (HSN) concept was proposed, consisting of wearable physiological sensors capable of detecting presymptomatic illnesses (Tier 1) that prompt individuals to enter a diagnostic testing stage (Tier 2). In the envisioned HSN concept, both wearable alerts and test results are reported automatically and immediately to a secure online platform via a dedicated application. Given the capabilities of smart wearable devices and over-the-counter test kits in the consumer market, along with advances in data analytics and computing power, the HSN represents an information stream that could complement existing surveillance tools. To assess the adoptability of the HSN, a national survey was conducted among urban and suburban centers (6,616 total adult respondents) to quantify several factors tied to recruiting and motivating HSN participation. This paper provides statistical HSN characteristics regarding demographics (age, race, education, income); smart device ownership (57% of respondents); current smart device usage patterns (47.5% of respondents with smart devices report wearing their devices at least 12 hours every day); expected participation and willingness to share data (41.2% or higher depending upon the organization managing the HSN program); compliance (88.5% of HSN participants likely to undergo testing); and methods by which survey respondents might be incentivized to participate. This survey supports a joint probability of HSN design factors that exceeds the minimum modeled coverage requirements of 0.05 (5% population coverage) to achieve a multiday detection advantage relative to traditional public health surveillance.
Keywords
Introduction
E
Each year seasonal influenza symptomatic cases affect, on average, 8% of the US population, leading to tens of thousands of US deaths. 3 The public health and healthcare systems prepare for the next iteration of influenza through an approach that seeks to: identify if someone has the influenza, treat the effects of influenza following infection, and manage the spread of influenza by taking appropriate measures to curb its impact to the community. Detection of an outbreak is slowed by delays in sick persons presenting to the clinical community and subsequent diagnostic testing. These delays slow public health response and increase unnecessary morbidity and mortality. Wearable physiological sensors (eg, smart watches) represent an untapped resource for early warning outbreak detection to enable higher fidelity characterization of the threat, timely intervention, and subsequent risk mitigation to improve health outcomes.
As a proof of concept, HSN researchers4,5 developed a model of an urban population, outfitted with smart wearable devices, and ran simulations to determine whether seasonal influenza could theoretically be identified sooner relative to traditional public health surveillance. The results indicate that this could be achieved if the joint probability of an individual wearing a smart device, of an individual consistently using their device, and of participant willingness to both share their data and submit to a presumptive diagnostic test when prompted to do so, exceeded 0.05 (referenced as the approximate breakeven point, 1 standard deviation below the modeled detection advantage mean).
Subsequent to these findings, this team conducted a survey of a representative sample of the US adult population to learn whether the specific parameters related to wearable devices and potential participants in the HSN could realistically meet the thresholds described by the modeling and simulation results. This article presents the relevant background, approach, findings, results, and conclusions of the HSN participant survey with a focus on addressing participant adoption, usage, compliance, and willingness to share their data.
Literature Review
Understanding how, where, when, and how many disease cases occur in any given locality in the United States, and in countries around the world, is critical to public health. Biosurveillance is a set of critical tools employed by epidemiologists, public health officials, and agencies to not only monitor and understand the presence of disease incidents among humans and animals but also to inform and support implementation and adaptation of response mechanisms and measures to match disease incidents that occur.6-8 Biosurveillance methods include diagnostic tests (eg, serological or respiratory samples), veterinary testing and services for farm and livestock animals, and database compilation of submitted public health incident records or data of human disease incident cases.6-12 Research and implementation of these methods has led to better response to and control of disease outbreaks, and to appropriate and timely public health messaging to affected populations and the public to support control of disease incidents or outbreaks.
Technologies that have rapidly increased our capacity and capability to collect and share data have also provided advancements in disease monitoring for public health purposes. Wearables, or advanced medical grade physiological sensors, are a recent advancement that may continue to play an important part in the advancement of individual health as well as public health biosurveillance and response. Wearables include fitness trackers, smart watches, smart rings, and other sensor devices designed to monitor and record individual health data such as heart rate, temperature, respiration rate, and blood oxygen levels of the individual wearing them. Wearables can also be set to alert the individual to abnormal health metric data, such as a high temperature or low heart rate. Given their potential to collect clinically meaningful data, wearables are increasingly being employed in studies to understand availability and use of these devices for specific health conditions, such as cardiovascular disease. 13 Furthermore, popularity and use of wearables have increased; their reported market value in 2018 was US$24.57 million with an expected annual growth rate of 24.7% through 2026.14-17
Despite the popularity, there are research gaps in understanding the accessibility and distribution of wearable devices. Specifically, there is a gap in understanding the actual usage of wearable devices for health monitoring purposes rather than a simple accounting of prevalence of devices among the population, although understanding the prevalence of devices is also important. One study estimates 30% of the US adult population actively utilizes wearable devices, but only about 15% use these devices every day. 15
Age is a consistent factor across available studies of surveyed wearable users, with those between 18 and 44 years of age typically utilizing wearables at higher rates, and those 65 years of age and older tending to show lower usage, even in studies researching wearable usage for specific health conditions.13-15,18,19 Some studies have additionally shown more engagement and usage by those who deem themselves healthier, while also showing low engagement and usage by those who self-identify with groups that could receive significant benefit from usage of wearables, such as those members of the aged over 65 years community and those with a preexisting or chronic health condition. 12
A commonly accepted explanation, despite mixed results for the usage and adoption of wearable devices, is perceived usefulness and perceived value, defined as the perceived effectiveness of wearable devices versus price of the devices. Studies have shown perceived usefulness “as the strongest predictor of behavioral intention.”18,20,21 Some studies also highlight the fact that users are likely to already be willing to devote resources to purchasing devices for health benefits, and that there is a open-accessdom of choice to purchase a device that remains within the users’ budget.18,22-24
Common concerns were also highlighted and repeated consistently across several studies and surveys, including privacy and security of personal health data and information, and data access when using, engaging with and sharing health data via wearables.15,18,19,25,26 Despite these privacy and security concerns, populations surveyed display high willingness to share wearables health data, both individually in consultation with their physicians or health team, and in larger research settings, as long as privacy and security are upheld. 13
The mixed understanding of wearable usage and data-sharing behaviors provided an opportunity to investigate wearable implementation in the general population, wearables as a public health surveillance tool, and wearable adoption and effectiveness.
Methods
To understand whether the specific parameters surrounding wearable devices and potential participants in the HSN could realistically meet the thresholds described by the modeling and simulation results, this research team conducted a survey of a representative sample of the US adult population living in urban and suburban areas with a focus on addressing participant adoption, usage, compliance, and willingness to share their data. The custom-designed survey for this research was distributed with the assistance of Qualtrics XM, * drawing responses from a representative sample of US residents over the age of 18 years who self-identified as residing in urban (metropolitan) or suburban (micropolitan) areas of the United States. † Sampling was limited to urban and suburban populations because the HSN has only been studied in silico in high population-dense areas, and the likely utility in rural areas is unknown. Recent studies have found that while rural residents are equally likely as urban residents to own and use digital health technology devices, they are less likely to communicate with health providers using them, 27 potentially lowering the efficacy of an HSN among this subpopulation. However, an HSN including rural participants, especially in agricultural regions, may provide an opportunity to improve zoonotic disease surveillance. Furthermore, lower population density may aid in the analysis of disease spread using HSN data, providing high-resolution information on spread dynamics. While these rural opportunities exist for future consideration, this population segment did not align directly with the scope of the funded effort.
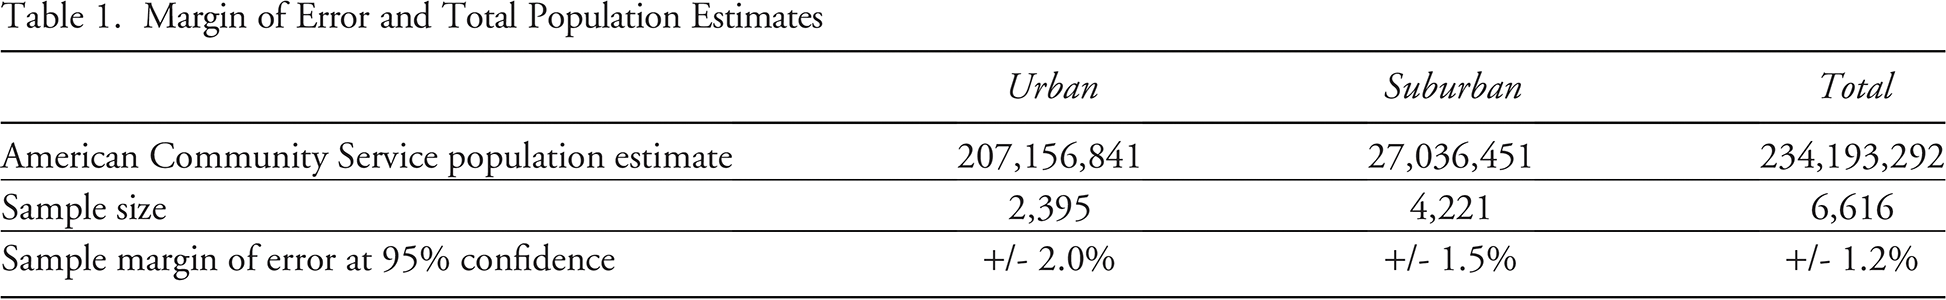
The survey ran from January 4 to 31, 2023, and yielded responses from 6,616 unique respondents. The US Census Bureau’s 2021 American Community Survey (ACS) 28 estimates a total population of 234,193,292 US adults in metropolitan and micropolitan statistical areas, providing an overall margin of error at 95% confidence level of +/- 1.2% for the total sample. Margins of error for urban and suburban subpopulations are shown in the Table. 28
Margin of Error and Total Population Estimates
Demographic variables captured include location, age, education, race/ethnicity, gender, and household income. Demographic breakdowns were largely representative of the US adult population, with findings following US Census norms for ethnicity categories, and deviating marginally for categories of race, gender, education, age, and household income. Findings did not deviate more than 2 or 3 percentage points away from US Census norms for all variables except higher education, where respondents with a 4-year degree or higher were oversampled by approximately 6%. Equivalence tests were conducted for all demographic variables in order to confirm sample equivalence, and we found our sample to be equivalent to the US Census norms across all demographic variables. Behavioral variables captured include current ownership and usage of wearable devices, and willingness to participate in HSN programs at the local, state, and federal government levels, among other factors. Behavioral outcomes were captured using a 5-point Likert scale (“highly unlikely” to “highly likely”) measuring likelihood of purchasing a smart device or participating in a public health monitoring program under various conditions, or a rank-order question capturing comparative effectiveness of various participation incentives.
One of the major contributions of this survey is that its sample size is larger than other recent national surveys in this space. Additionally, the survey results extend findings beyond the measurement of the distribution and frequency of use of wearable devices 15 by capturing barriers and incentives to participation in health tracking studies and measuring likelihood of participation in an HSN under a variety of conditions for both users and nonusers of wearable health devices. Biases of this sample include a fully online sampling plan that did not leverage responses from wearable device users and nonusers with limited internet access. However, the likelihood of a significant offline population that is open to using wearable devices in urban or suburban settings is small, and early adoption of wearable devices and data sharing in this setting is not likely to occur among an offline urban or suburban population.
Results
Of the 6,616 survey respondents, 2,395 (36.2%) identified themselves as residing in urban areas while 4,221 (63.8%) identified themselves as residing in suburban areas. Additionally, 3,769 (57.0%) indicated ownership of at least 1 wearable device. Of the urban resident subgroup, 1,380 (57.6%) responded that they owned at least 1 wearable device. Similarly, of the suburban resident subgroup, 2,389 (56.6%) responded they owned at least 1 wearable device. Figure 1 provides an illustration of wearable ownership distribution by survey respondents.
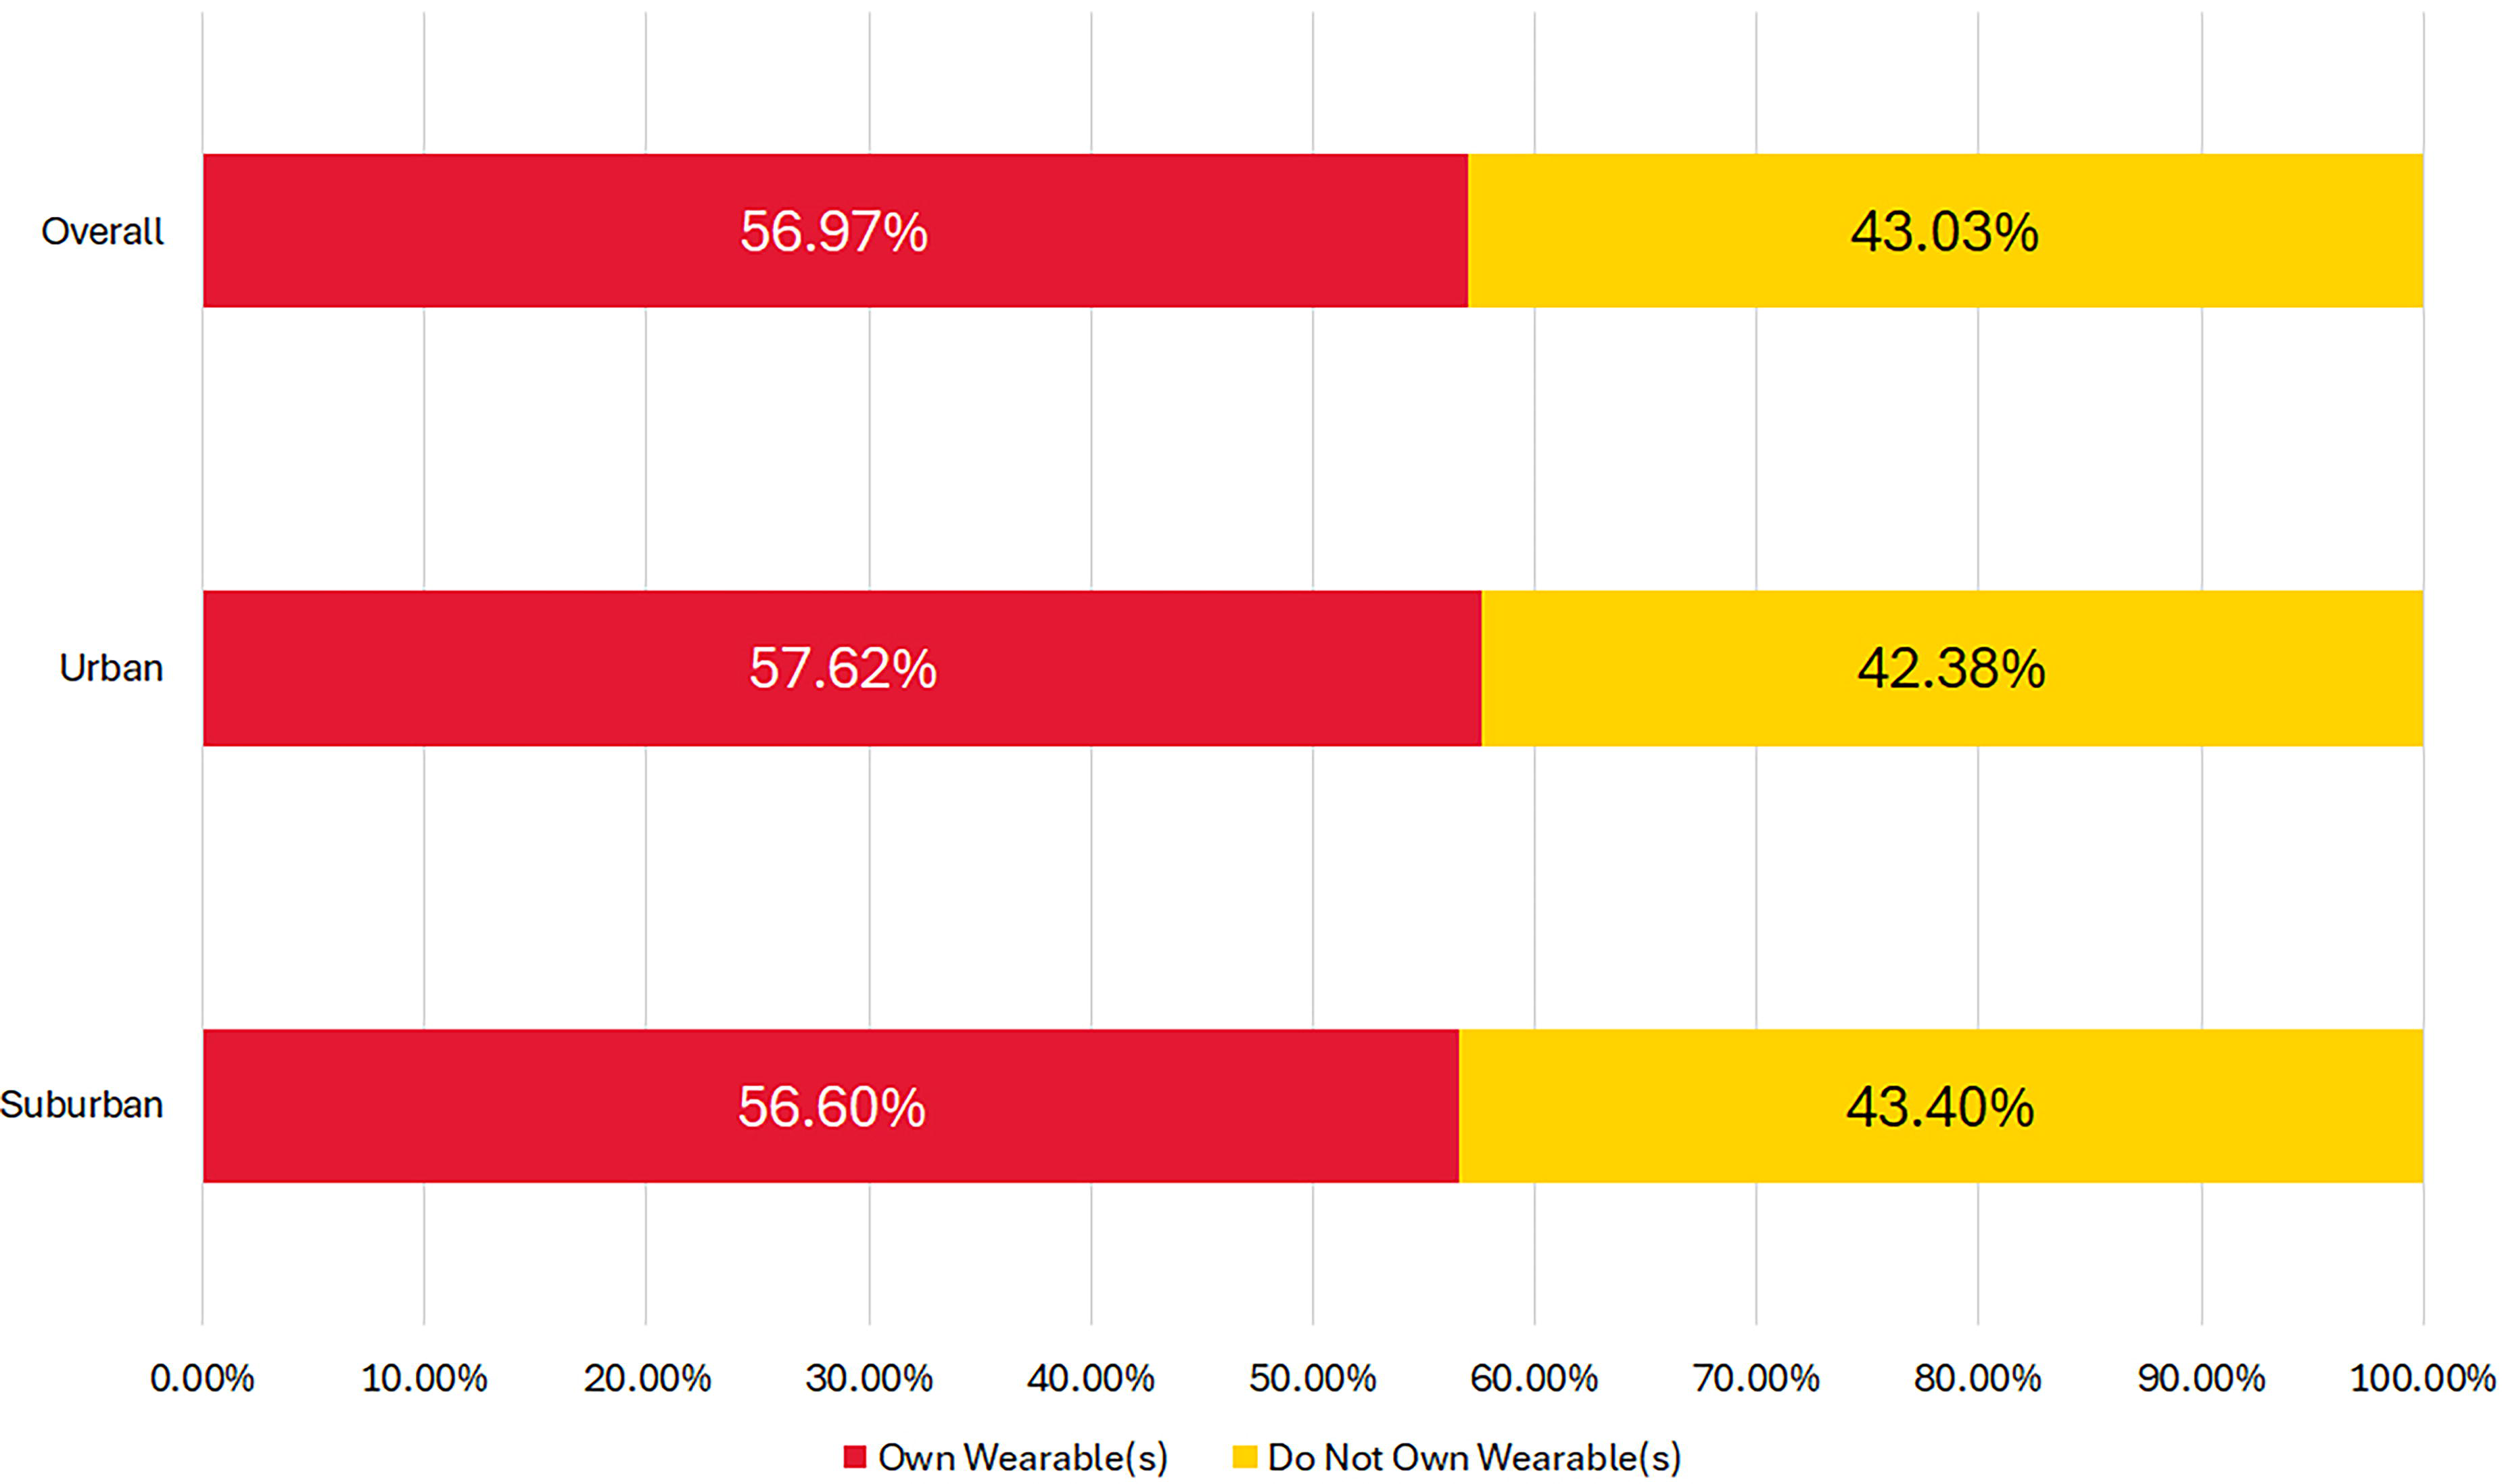
Wearable owner and nonowner distribution, by respondent group/subgroup.
An examination of the survey participants by age group revealed the sample fell within 2.7 and 3.3 percentage points of the US Census norms for US adults residing in metropolitan and micropolitan statistical areas. Additionally, the results showed that proportion of the survey respondents who own wearables was highest for the 18 to 24 years age group, with 69.6% owning at least 1 wearable device. In contrast, the 65 years and older age group had the lowest wearable ownership at only 38.3%. As expected, age groups 25 to 34 years and 35 to 44 years both showed a high wearable ownership rate at 69.0%and 66.4%, respectively. The wearable ownership fell to 56.4% for the 45 to 54 years age group and to 43.7% for the those aged 55 to 64 years.
While the 65 years and older age group was the largest for the population, it was the least likely to own and utilize wearables; however, their use and ownership rates still met the required levels to support the HSN. Figure 2 provides an illustration of HSN survey sample compared to the 2021 ACS estimates by age group.
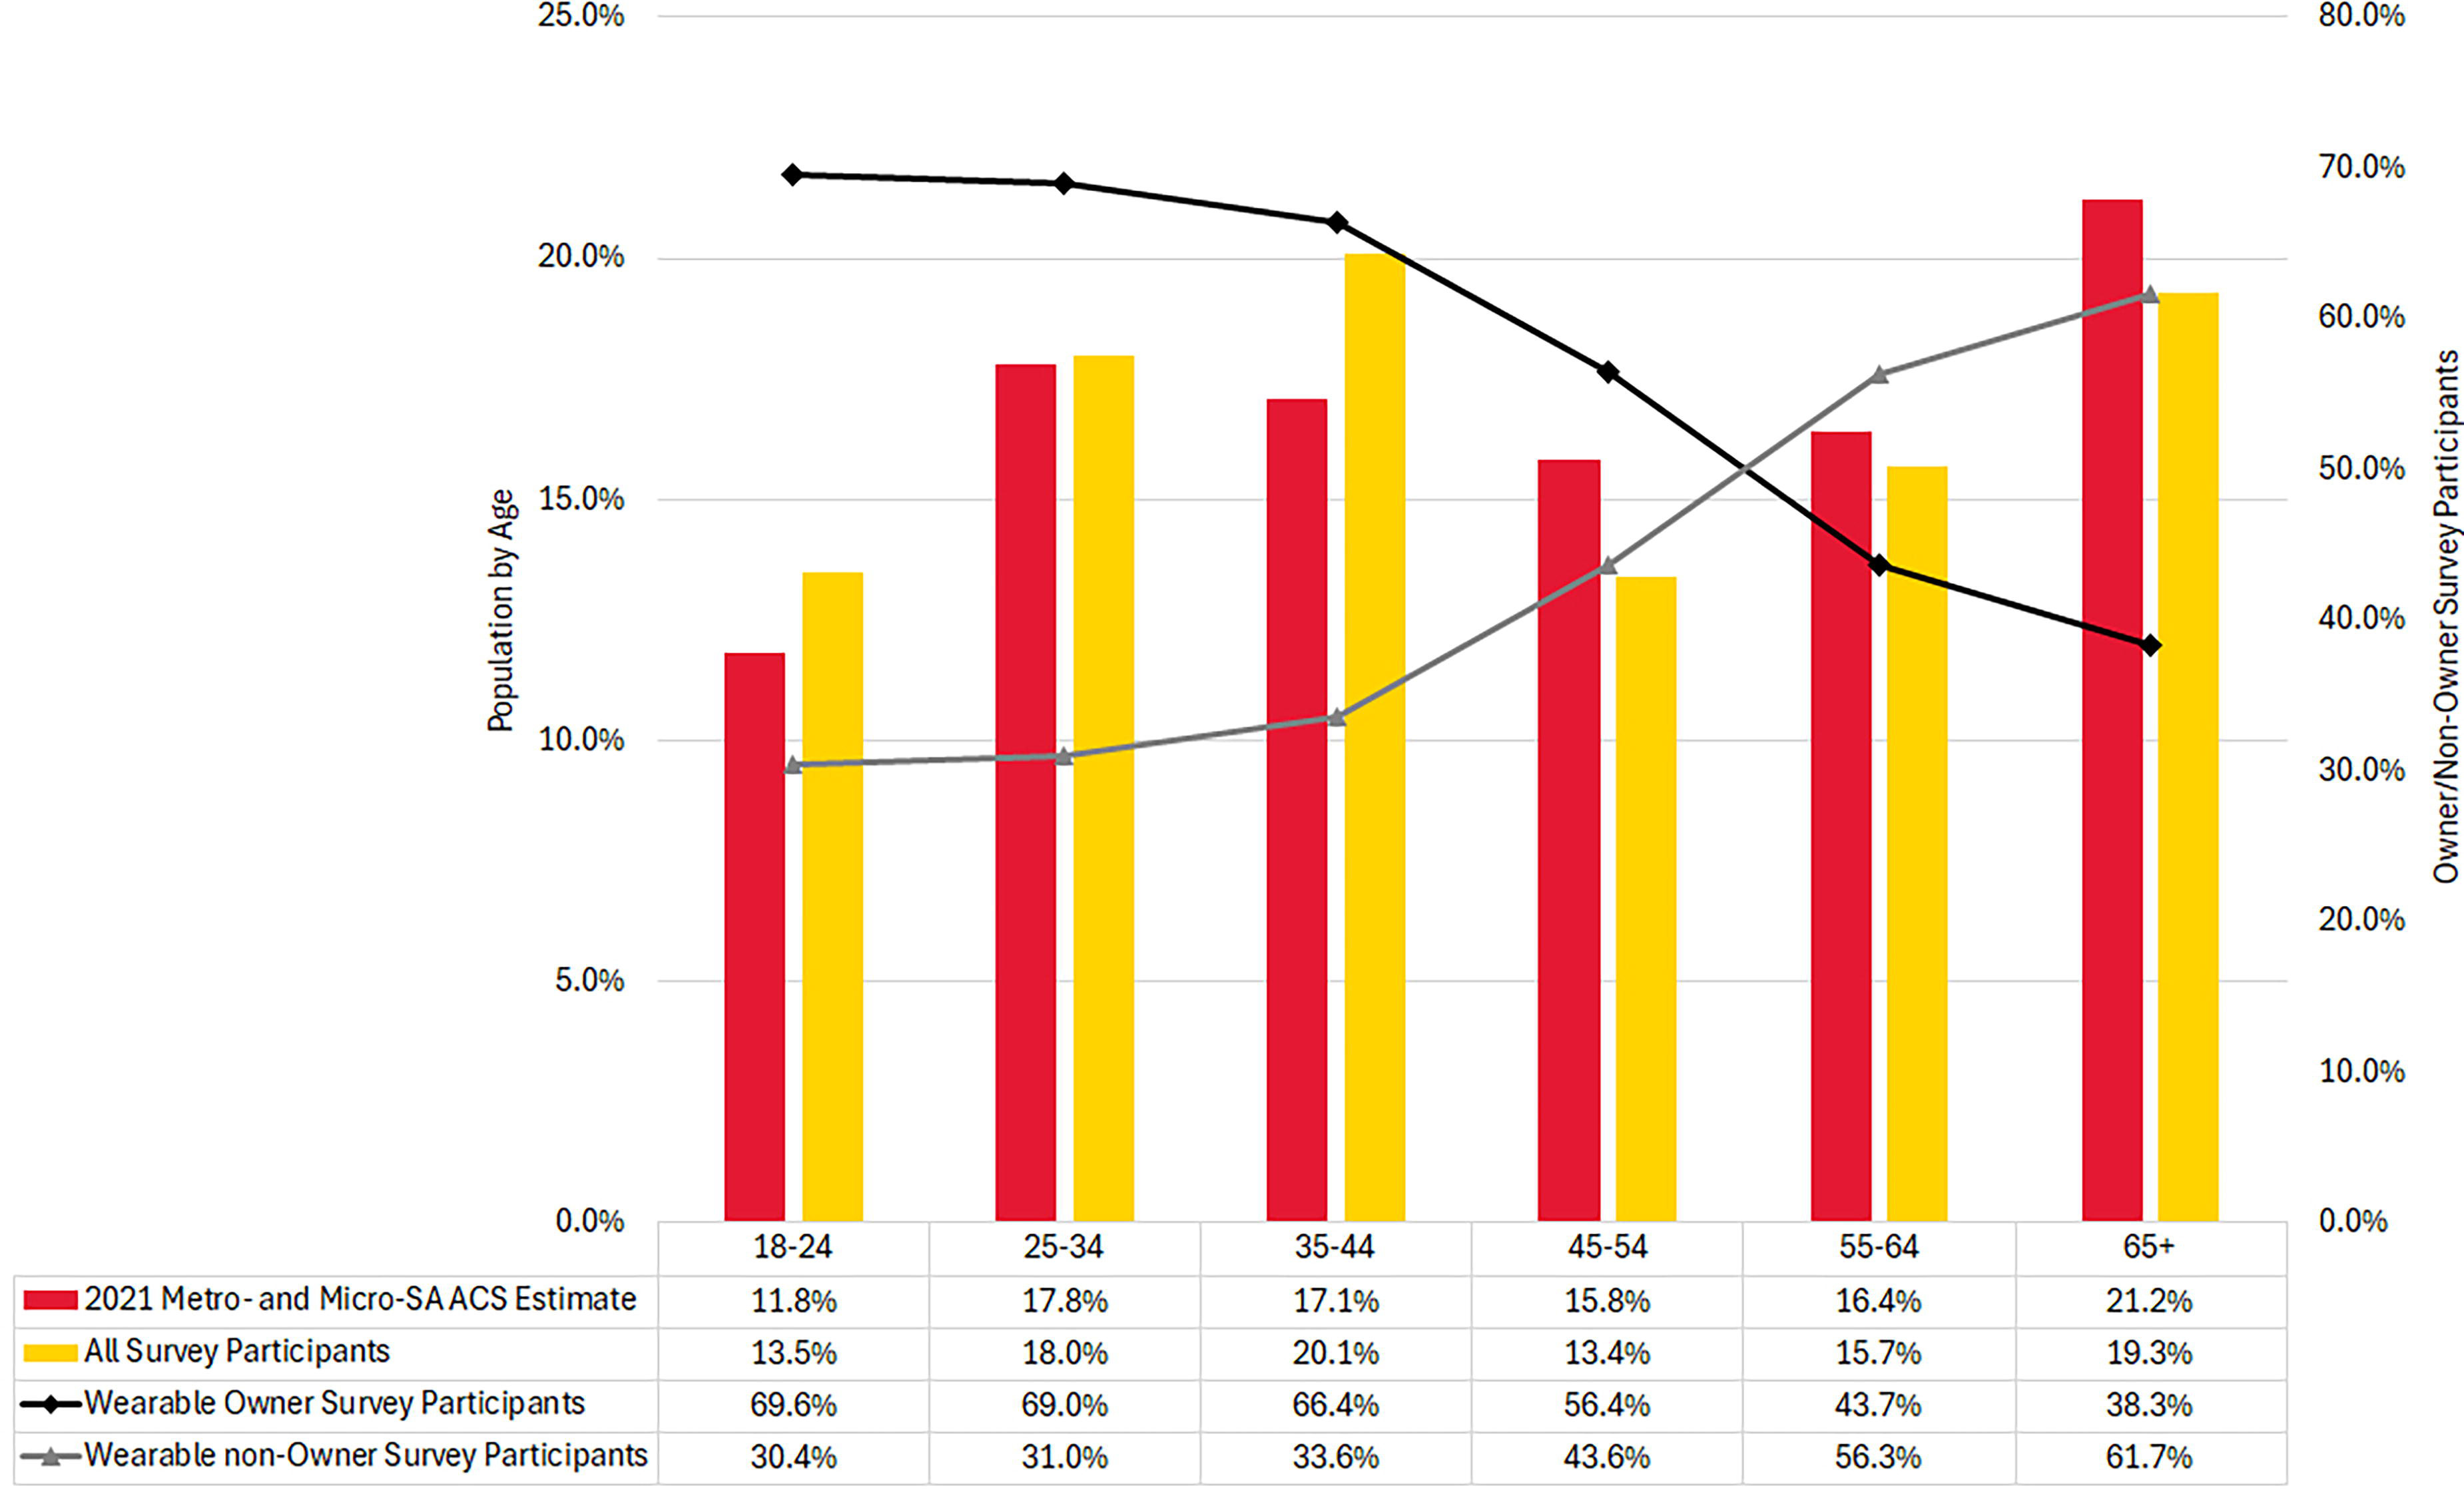
US census estimates and survey participants comparison, by age group.
An examination of the survey participants by race and ethnic background revealed the sample fell within 0 and 3 percentage points of the US Census norms for US adults residing in metropolitan and micropolitan statistical areas. The results also revealed that the majority of the survey respondents own at least 1 wearable device regardless of their racial or ethnic background. As a group, respondents whose self-reported race was American Indian, Alaskan Native, or Other had the lowest rate of wearable ownership at 49.6%, while respondents who identified as having Hispanic ethnicity had the highest rate of wearable ownership at 65.4%. ‡
When the sample was analyzed overall, by areas of residence, by age group, and by racial/ethnic backgrounds, this research team found—based on the fraction of the sample population that owns at least 1 wearable device—that a sufficient number of wearable owners exist in the United States, which suggests that there is already an adequate number of wearables in the communities to develop an HSN with sufficient coverage.
The wearable device collects data as part of Tier 1 data acquisition and requires a wearer’s commitment to wearing the device (compliance) and willingness to share the data (participation) as part of the HSN. To determine the Tier 1 compliance for the HSN, the survey ascertained the frequency and duration the participants usually wear their wearables per week and per day. The survey revealed 84.0% of the respondents wear their wearables at least 5 days per week, with 59.4% of the respondents wearing their wearables for 7 days per week. Additionally, 64.1% of the respondents reported they use their wearables at least 12 hours per day, while 95.4% of the respondents reported wearing their devices for at least 6 hours per day. Figure 3 shows the number of days and number of hours that respondents report wearing their devices.
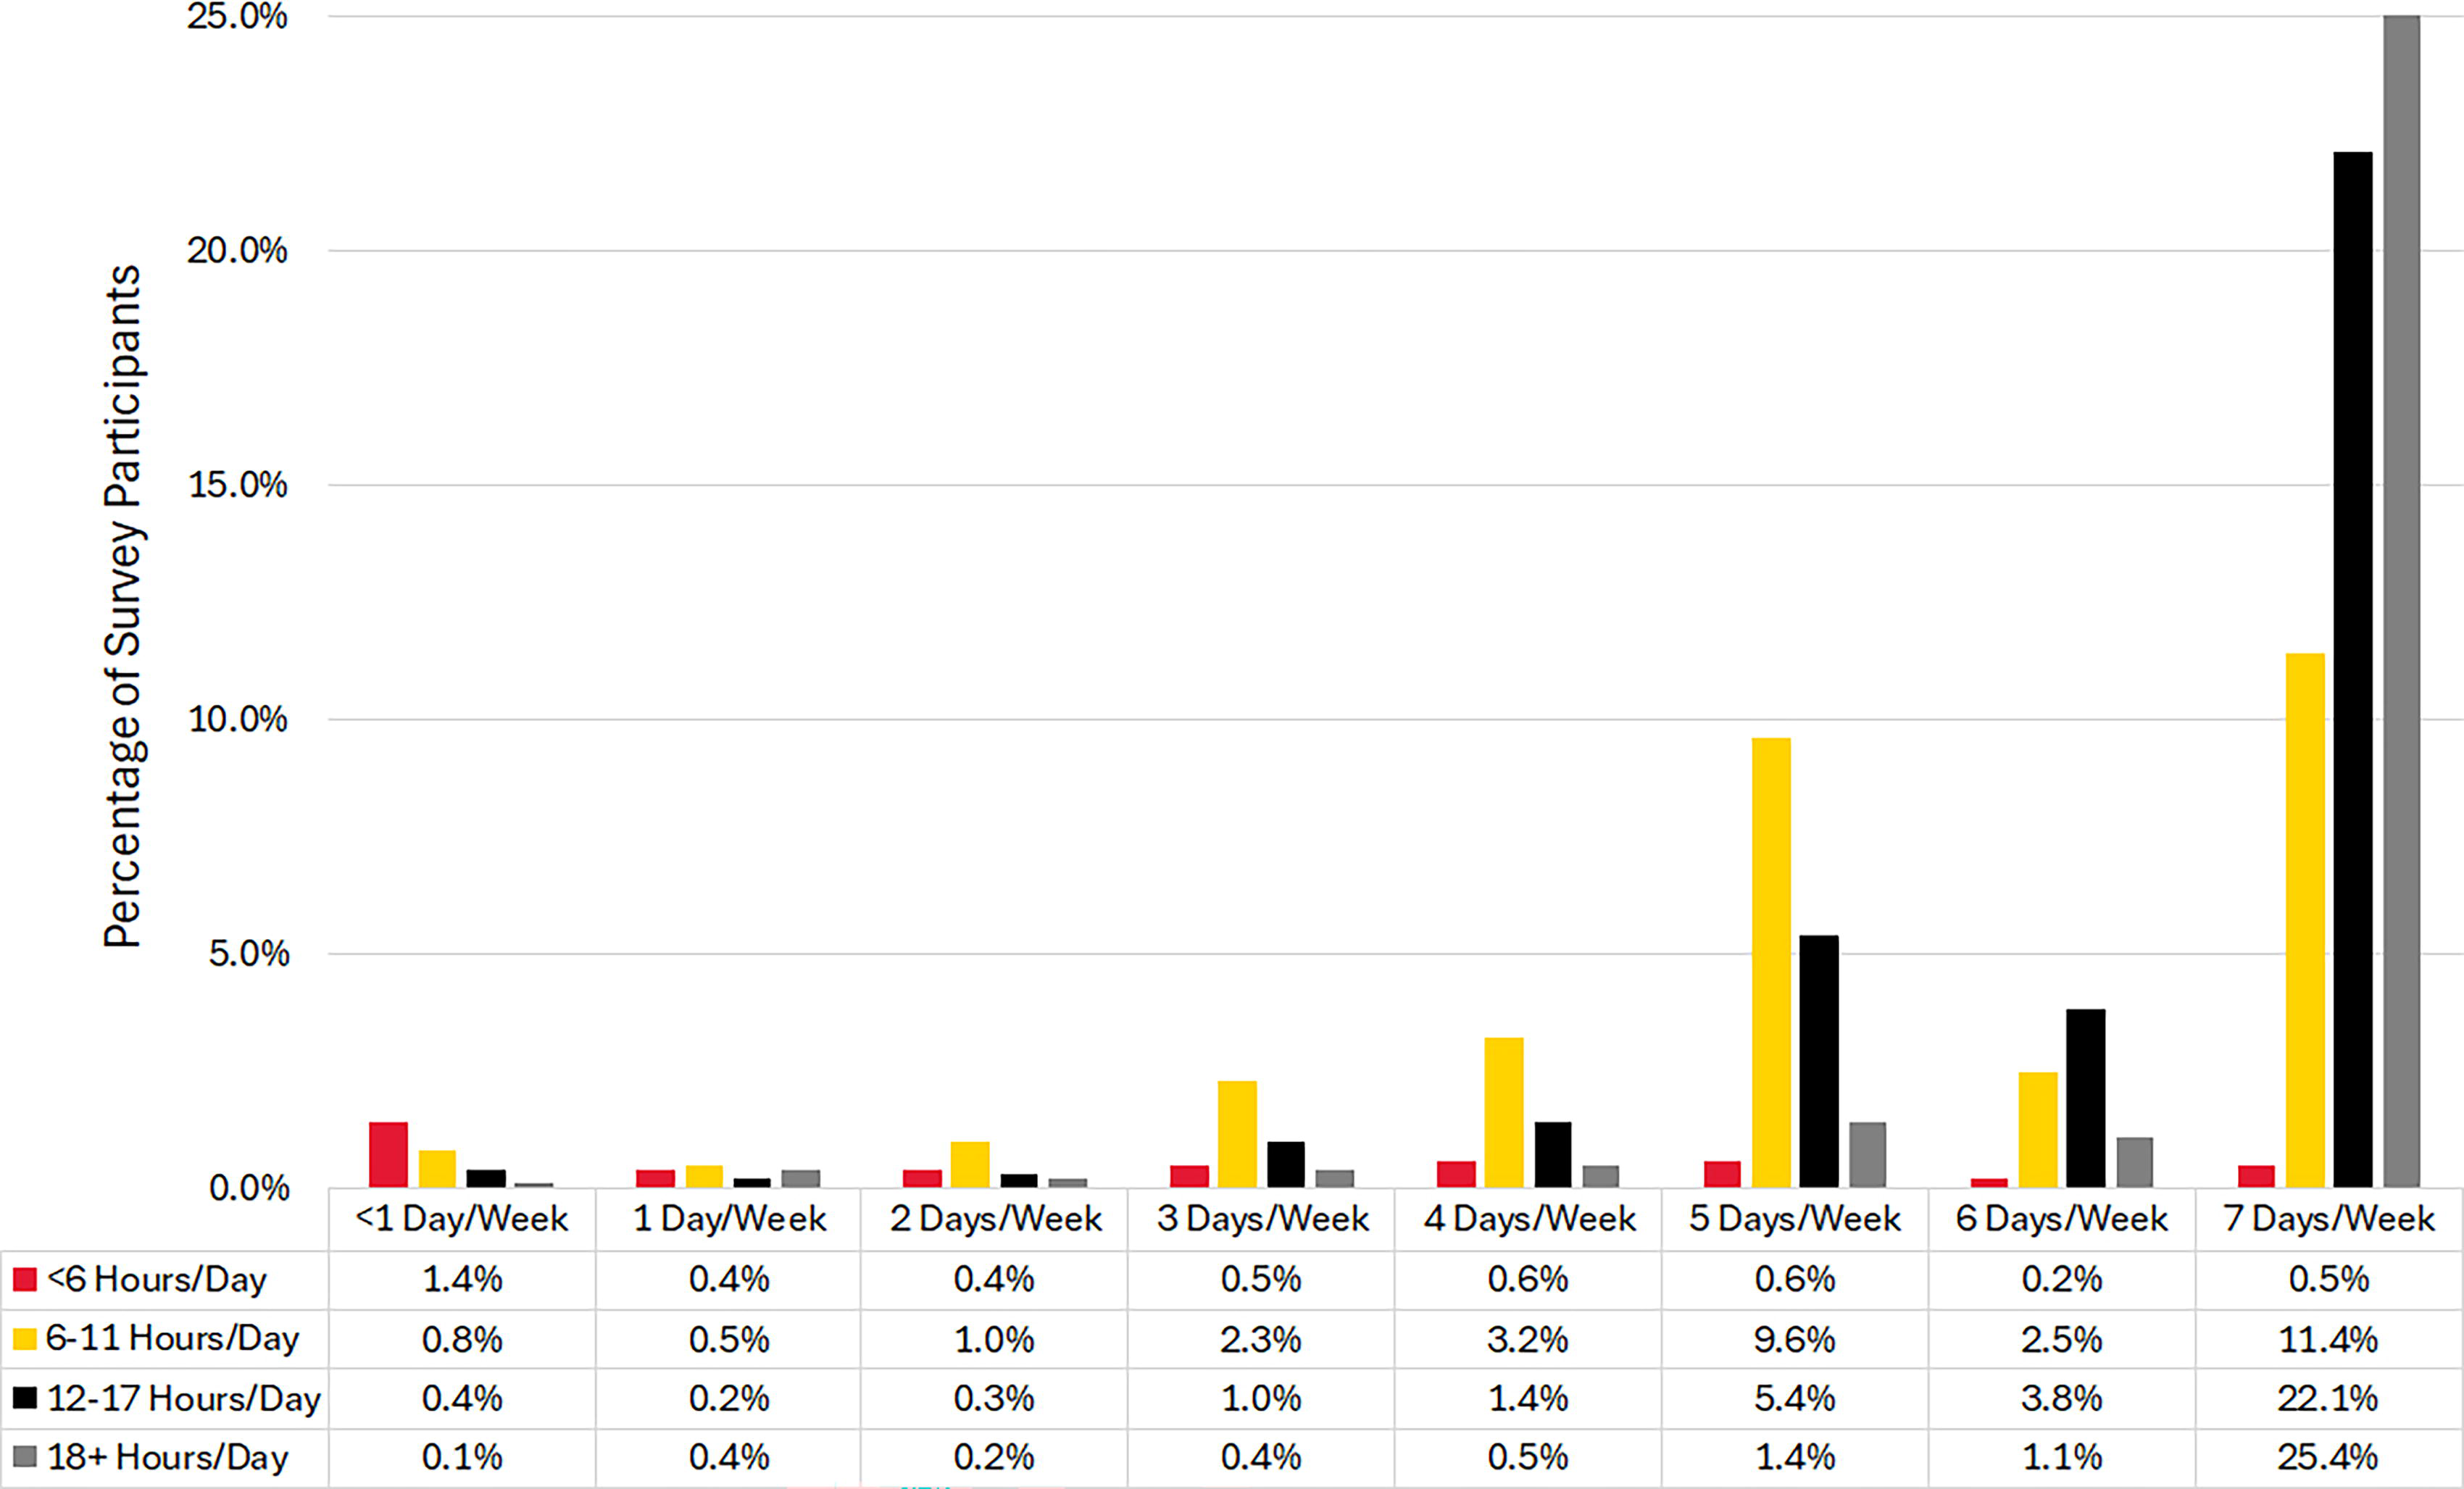
Number of days per week using wearable devices.
Since a successful HSN requires a sufficient number of wearable device owners to share their (anonymized) health data with the HSN program, the survey inquired about the wearable device-owning participants’ willingness to participate in the HSN program directly. Understanding that the participants may have differing levels of comfort with sharing their data, thus differing likelihood for participation, based on the entity that is responsible for administering the HSN, the survey inquired about the participants’ willingness to participate given different administering entity types. The results revealed that highest percentage of survey respondents were willing to participate (59.4%) in the HSN program if the program is administered by an academic, nongovernmental, or nonprofit organization (eg, a university or an independent research center). The results also showed that approximately 52% of the survey respondents were willing to participate in the HSN program if the program is administered by the local government. Approximately 50.2% of the survey respondents responded that they were likely or highly likely to participate in a commercial entity-run HSN program. Figure 4 provides an illustration of wearable owners’ willingness to participate in HSN based on the administration entity type. §
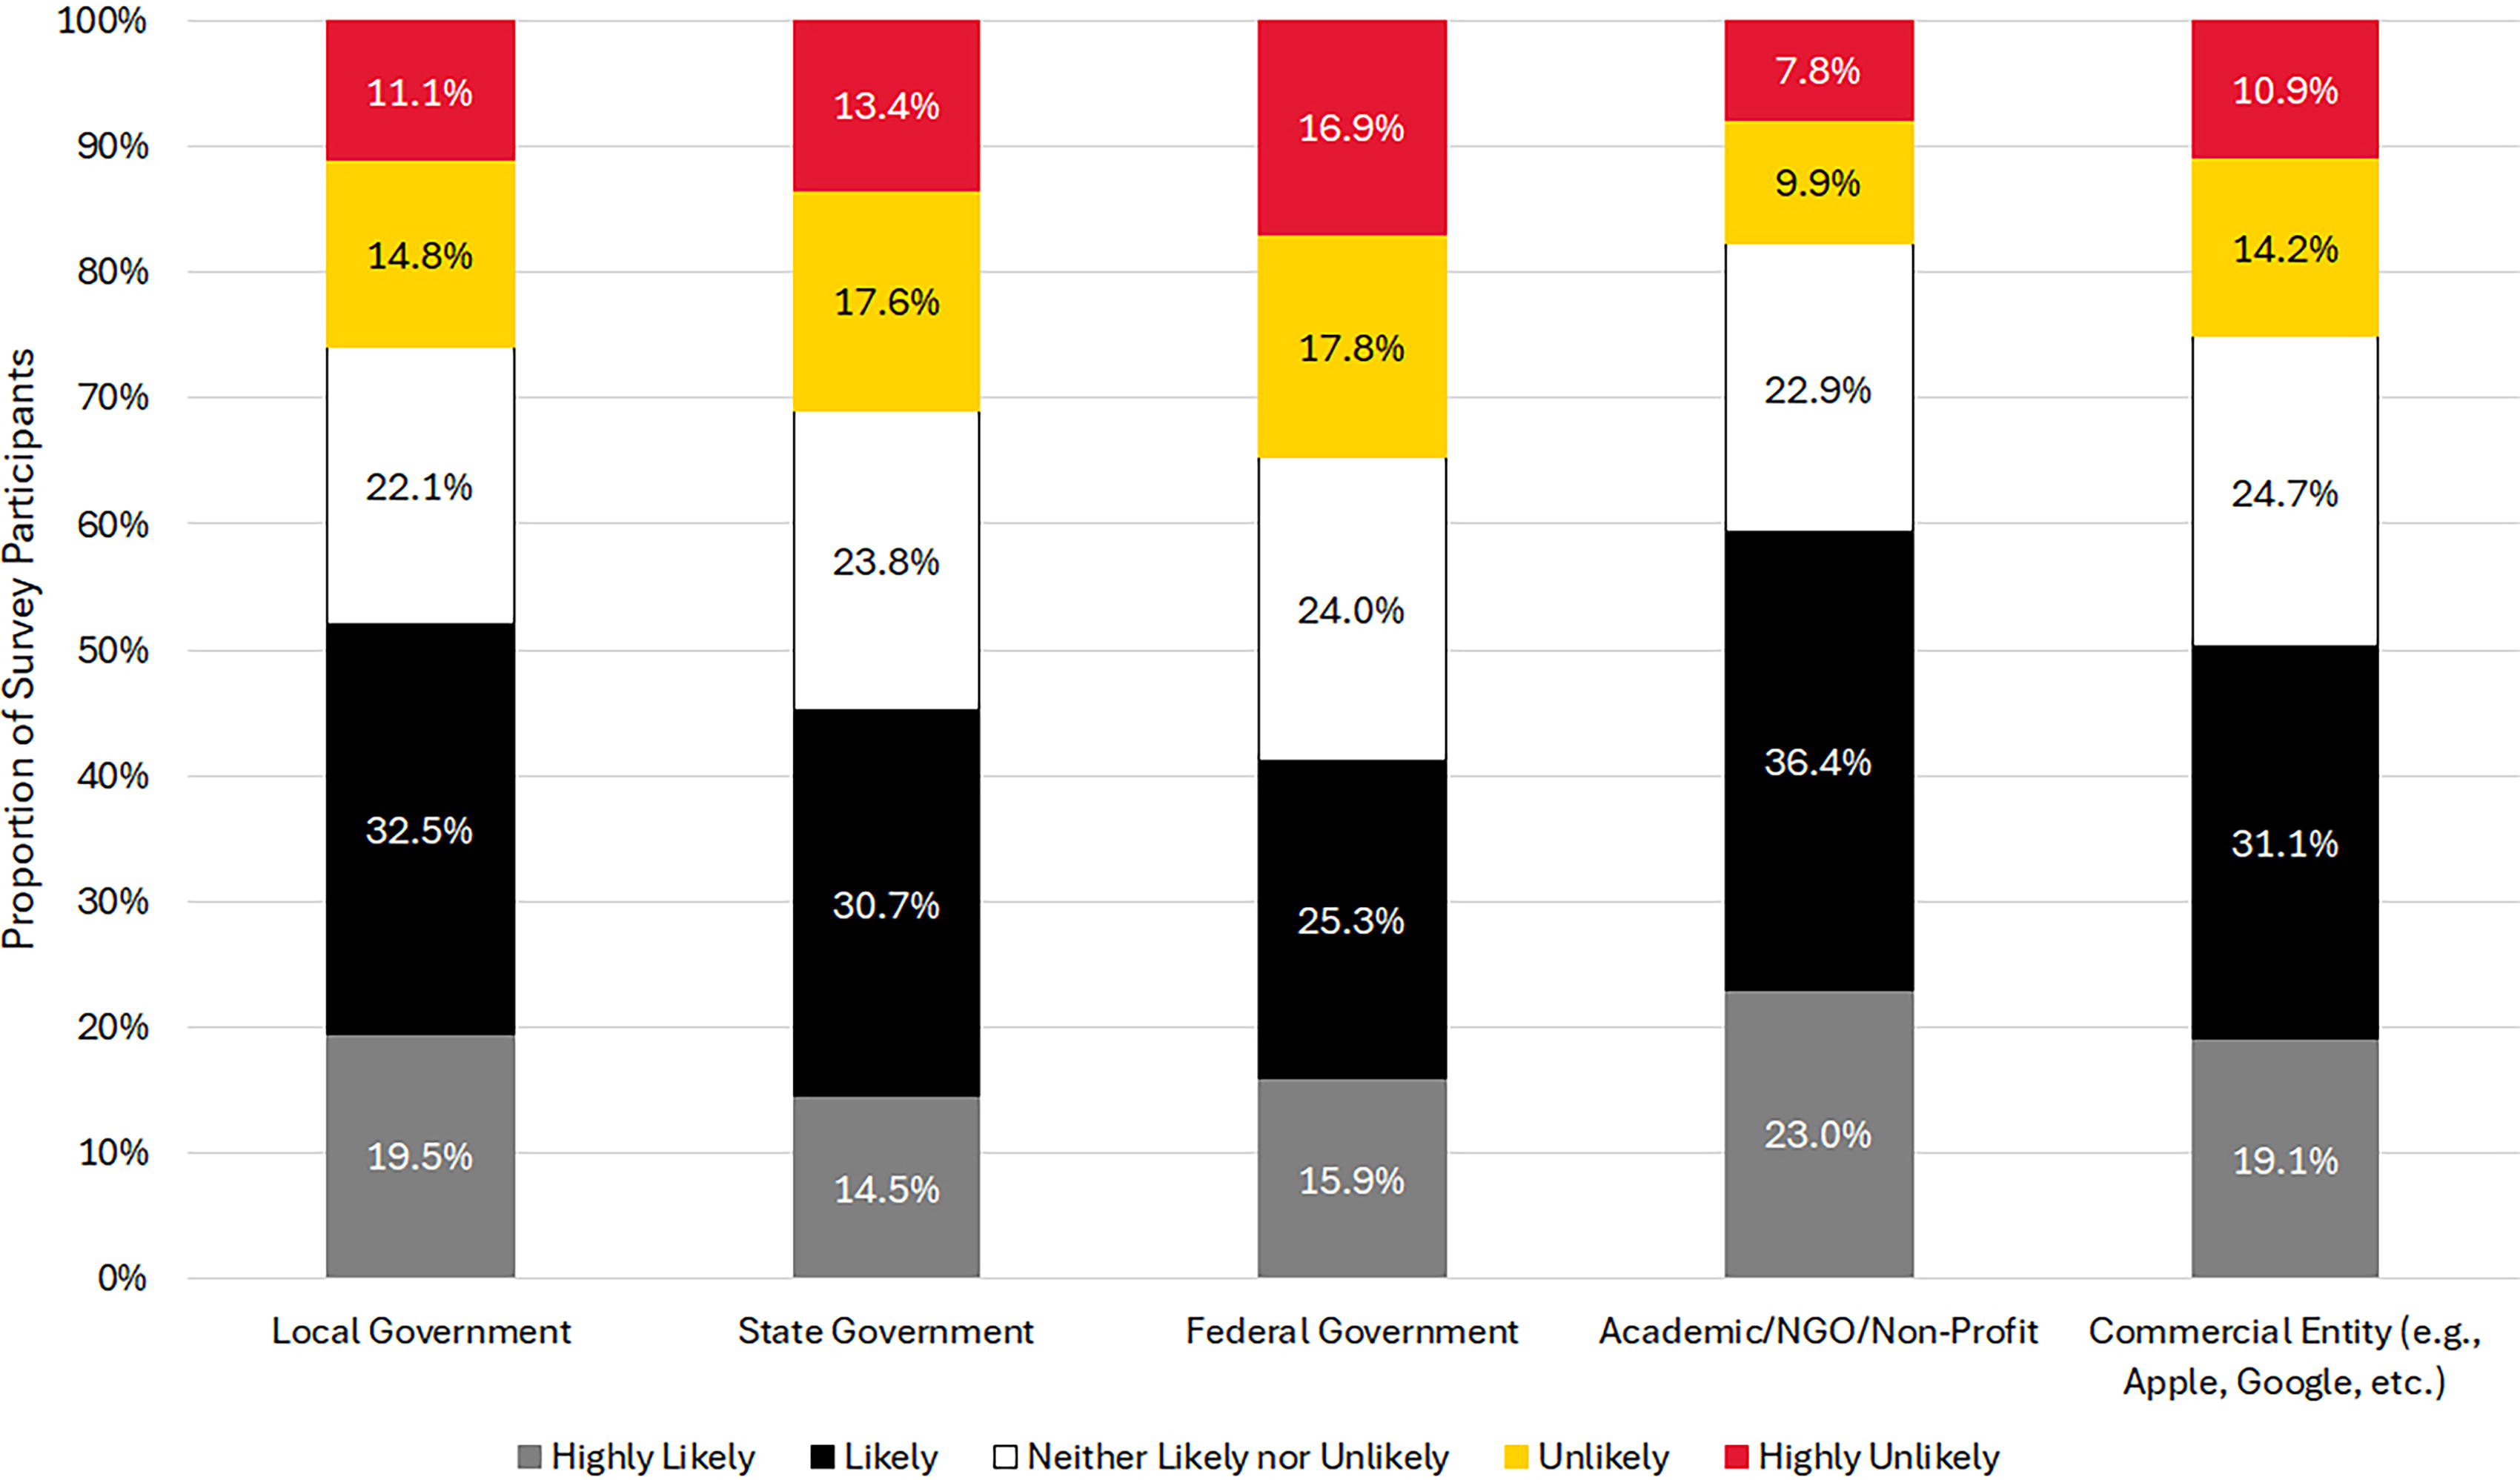
Wearable owners’ HSN participation likelihood.
Another critical component of the HSN program is the willingness of program participants to visit their primary care physician, a clinic, or get tested at a designated test site (or at home). This component of the HSN program is referred to as Tier 2 participation. The survey inquired directly whether the survey participants were willing to visit their primary care physicians if the HSN system recommends that they do so, based on changes in their physiological condition. Approximately 44% of the survey participants indicated they were “highly likely” to visit their physician on the recommendation of the HSN system; this number rose to 88% when both “likely” and “highly likely” responses were included. Figure 5 shows wearable owners’ willingness to participate in Tier 2. **
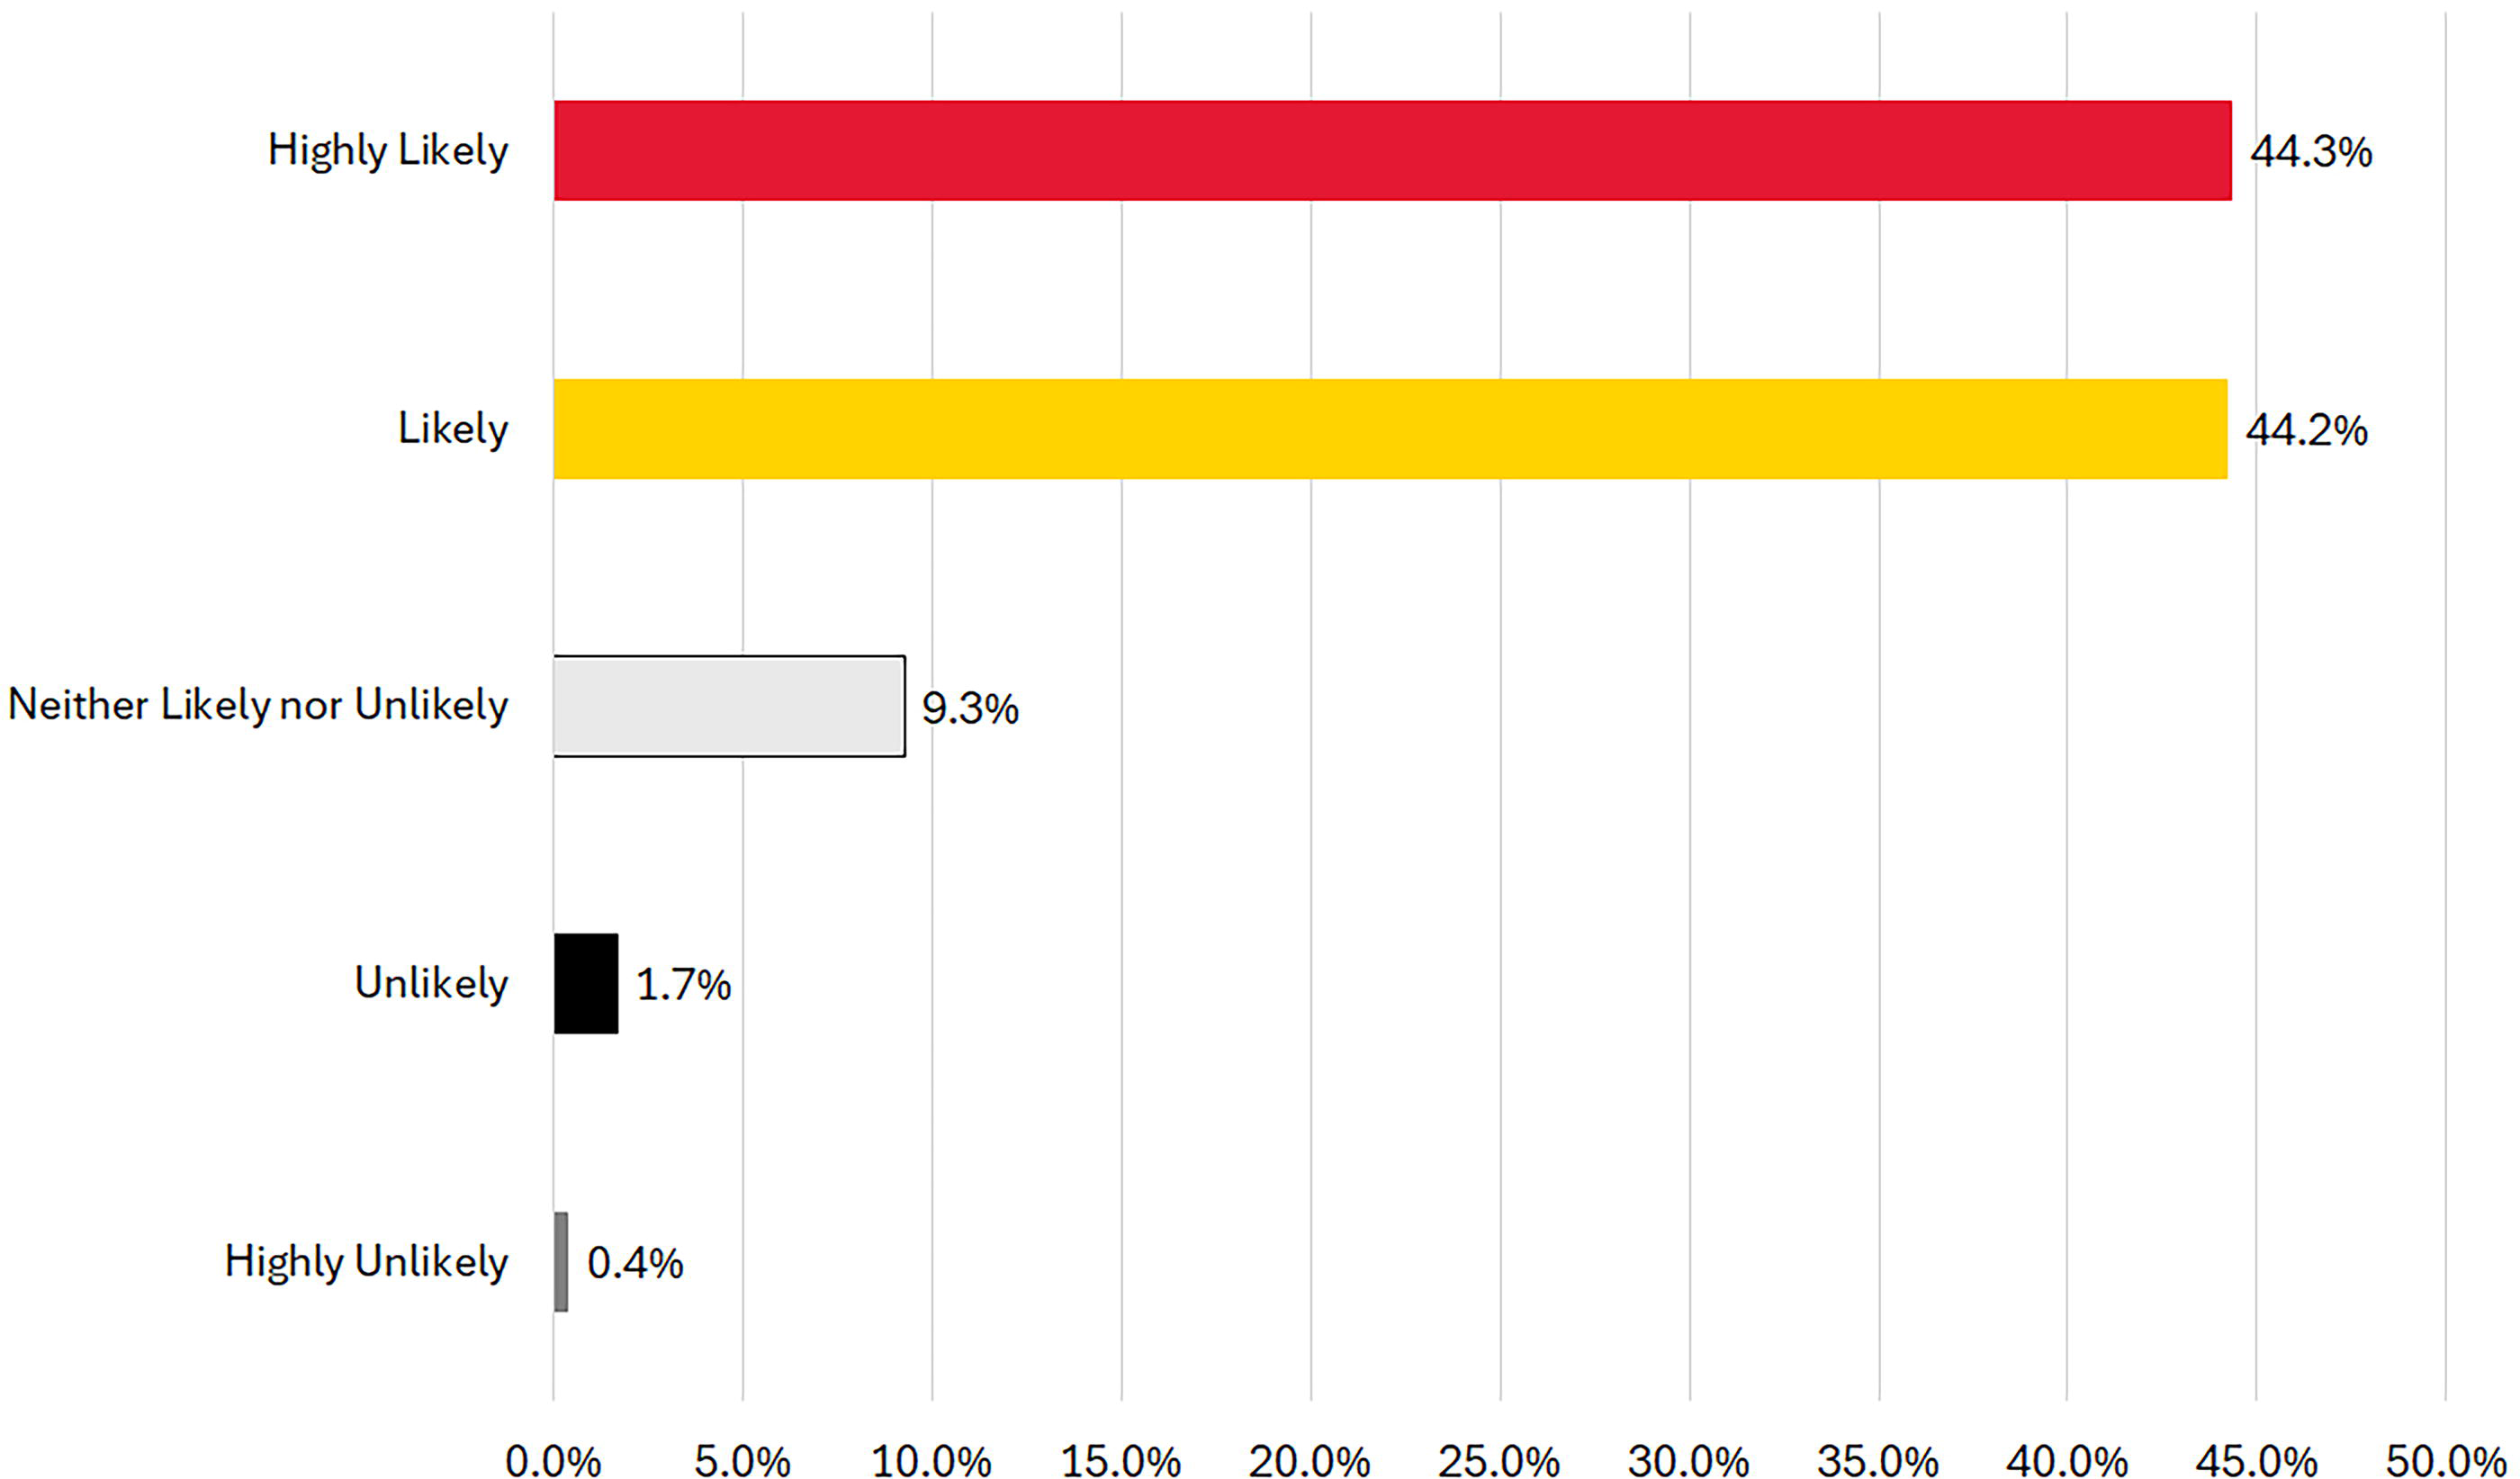
Wearable owners’ willingness to visit primary care physician (participate in Tier 2).
The research team also inquired about what would incentivize wearable device owners to participate in the HSN program. †† The survey participants were allowed to rank order the incentives in the order they desired from most desired to the least. The results revealed that the number 1 element that would enhance survey participants’ willingness to participate in the HSN program was assurance of data anonymization, followed by a monetary incentive. Survey respondents also indicated that they would be incentivized to participate if prizes and credits to data and phone bills were offered.
Finally, responses of those survey respondents who do not own wearable devices were quite similar to the responses of the wearable owner subgroup. For example, the nonowner subgroup’s top 2 choices for the likelihood of participating in the HSN program based on administering entity were academia/nongovernmental/nonprofit organization followed by local government—same as the wearable owner subgroup’s choices. ‡‡ Additionally, a similar percentage of the nonowner subgroup responded that they are likely or highly likely to visit a physician if alerted by the HSN system about a potential exposure. §§ These findings suggest there potentially is a large number of individuals who belong to the nonowner subgroup and would be willing to participate in the HSN program if they had a wearable device. Between those in the wearable owner subgroup who expressed willingness to participate in the HSN program, and those in the nonowner subgroup who expressed willingness to participate in the HSN program, there seem to be a sufficient number of willing participants available to make HSN feasible.
Discussion
The survey was conducted to assess the feasibility of collecting and retrieving the requisite data that could power the proposed HSN analytics and lead to earlier disease detection as determined by the HSN modeling and simulation study.4,5 The relevant survey factors pertain to ownership fraction, Tier 1 compliance, wearable owner participation rate, and Tier 2 compliance as shown in Figure 6. Along with the probabilities of detection for the Tier 1 algorithm to identify anomalous deviations from participant baselines and Tier 2 diagnostic accuracy, the joint probability of these 6 factors provides a measure of detected infection fraction for a surveilled population.
Infection detection parameters.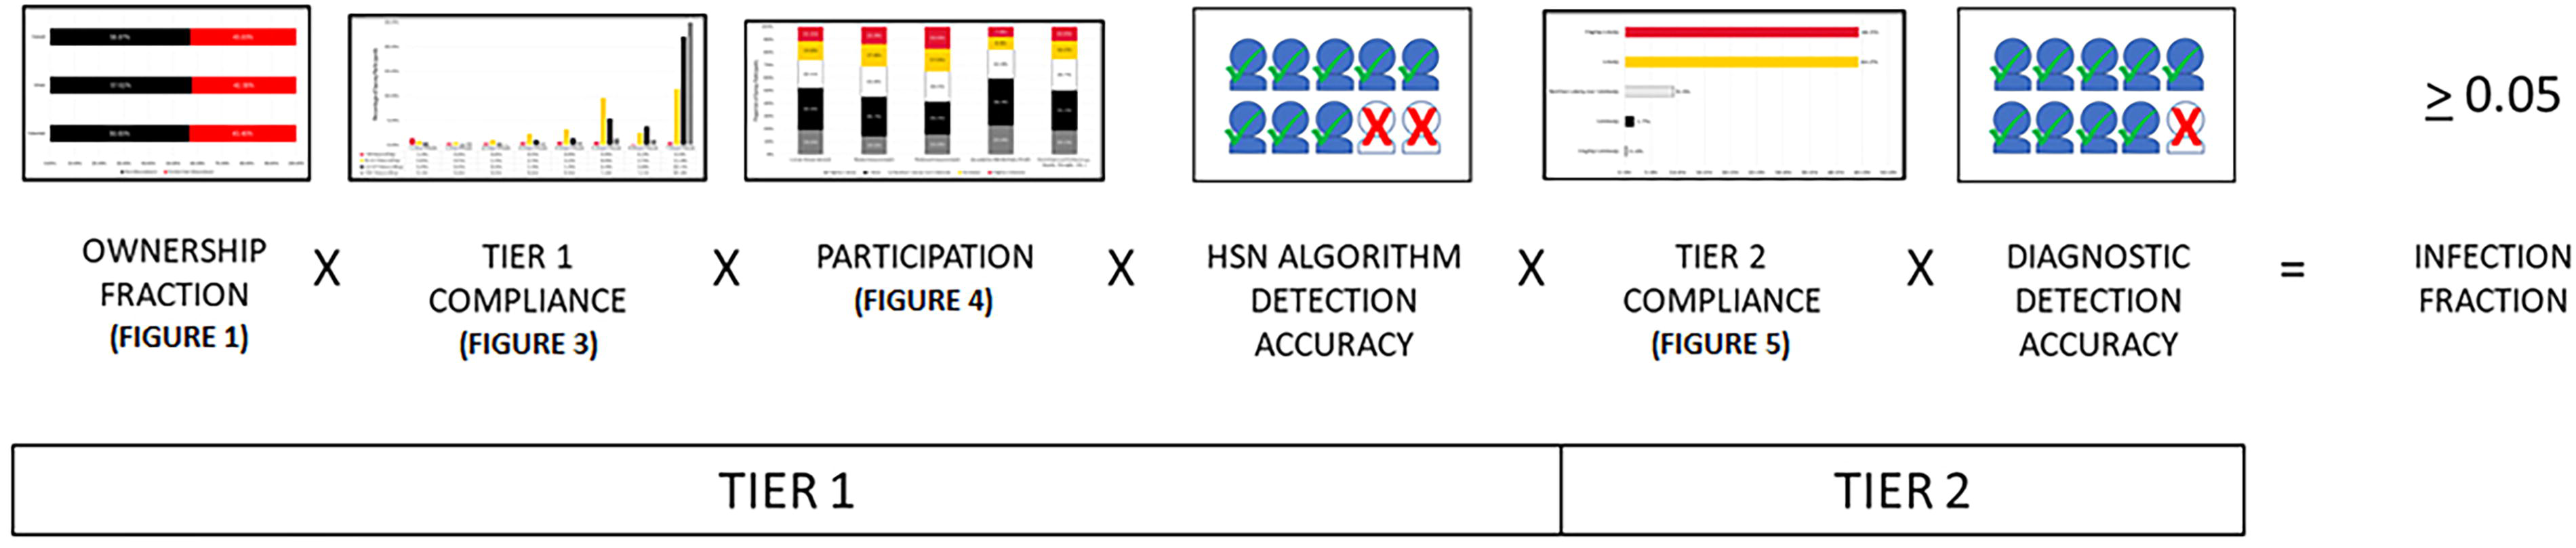
The joint probability of ownership rate in the metropolitan and micropolitan population and the fraction of ownership participants who met the Tier 1 compliance requirement by wearing their smart device 7 days per week and at least 12 hours per day was 27.1%. If the HSN Tier 1 algorithm detection accuracy were to achieve 0.829,30 and the worst case sharing scenario of 41.2% were used, then the Tier 1 detected fraction would be 8.9%. Considering an 88.5% likelihood of participants to submit to Tier 2 testing and assuming a diagnostic accuracy of 90%, 31 the true positive detected infection fraction of the population was 7.1%, greater than the 5% needed.
The detected infection fraction computed above is a conservative minimum. For example, if the HSN detection algorithm can tolerate a lower Tier 1 compliance requirement defined by individuals wearing their devices at least 6 hours per day on at least 6 days per week, then the detected infection fraction could be as high as 9.9%, nearly twice the expected performance needed to achieve earlier disease outbreak detection.
Thus, the survey results we discuss suggest that an HSN can be feasibly developed as a complementary tool to improve public health surveillance. To realize the HSN concept, however, the following implementation and sustainability factors impacting HSN operations will need to be considered and addressed. Note that these factors fell outside the scope of the project to understand whether the behaviors and attitudes among wearable owners could lead to viable HSN participation rates, but they are worth mentioning here.
The wearable ownership rates for the 55 to 64 years age group (43.7%) and 65 years and older age group (38.3%) met the minimum requirement necessary to support the HSN, but were notably lower than the rates for younger groups (56.4% to 69.6%). Special outreach to older age groups may be required to ensure adequate coverage, particularly in regions where these age groups account for especially larger fractions of the population. Standardization of smart device outputs that feed HSN data fields and data formatting requirements will need to be established to promote data uniformity and enable reliable downstream data analysis. Lists of acceptable HSN devices will need to be created and managed to identify, update, and remove devices that meet the requirements of the HSN. The HSN operating organization may need to coordinate with vendors to ensure HSN data requirements are satisfied.*** Data quality
19
will need to be ensured so that improper (eg, wearing device too loosely) or inconsistent participant usage does not lead to diminished HSN detection accuracy. Timely communications to collect and analyze data, alert HSN participants to pursue Tier 2 testing, and inform public health officials of results will be needed to realize the potential gains of the HSN surveillance capability. Sustainment initiatives must be undertaken to resource, operate, and maintain the HSN technical stack; adapt to technology advances; monitor, project, and ensure viable HSN operating values that continue to meet evolving survey respondent requirements; and maintain enrollment above minimum participant thresholds.
Conclusion
The HSN participant survey results suggest that the requisite joint probability of 0.05 for the parameters that include the (1) coverage of the population that wears a smart device, (2) fraction of ownership participants who wear their smart devices every day for at least 12 hours per day, (3) willingness to share data, and (4) commitment to comply with subsequent diagnostic testing, are achievable. Given previous modeling and simulation results, an HSN could shorten the time to detect a disease outbreak, accelerate response activities, and improve public health outcomes.
Footnotes
Acknowledgments
The authors gratefully acknowledge the following individuals for sharing information, expertise, time, and support: Salma Bouziani (START), David E. Dausch (RTI International), Meghan Hegarty-Craver (RTI International), Peter Larson (DARPA), Ray H. Mariner (JHU/APL), Megan Rutter (START), Dorota S. Temple (RTI International), Rhyner Washburn (START), and Mark Wrobel (DARPA). This research was supported by the Defense Advanced Research Projects Agency through Award Numbers HR001123F0011 and W911NF2010031. The views and conclusions contained in this document are those of the authors and should not be interpreted as necessarily representing the official policies, either expressed or implied, of the Defense Advanced Research Project Agency, Department of Defense, or the United States Government.
References
Supplementary Material
Please find the following supplemental material available below.
For Open Access articles published under a Creative Commons License, all supplemental material carries the same license as the article it is associated with.
For non-Open Access articles published, all supplemental material carries a non-exclusive license, and permission requests for re-use of supplemental material or any part of supplemental material shall be sent directly to the copyright owner as specified in the copyright notice associated with the article.