
Abstract
Working adults engage in a variety of communication activities for their entire careers. Yet relatively, little has been established regarding whether or how average communication anxiety levels change over time, especially after college. The purpose of this study was to test communication anxiety levels across the career span. Age, levels of work experience, frequency in making presentations, and levels of communication apprehension as measured by the Personal Report of Communication Apprehension (PRCA) were compared for college-educated adults, aged 20-72. They were also compared with mean PRCA scores developed by James McCroskey based on testing undergraduates. Levels of overall Communication Apprehension and Public Speaking Apprehension scores fell with age, years of full-time work, and frequency of making presentations. Only those reporting never presenting in the prior year had scores which aligned with McCroskey’s college student mean scores; all others were lower at the 0.000 level of significance.
Keywords
While students tend to be the focus of studies on communication apprehension (CA), working adults engage in a variety of communication activities for their entire careers. Yet relatively little has been established regarding whether or how people’s communication anxiety levels change over time, especially once they leave college. As business communication educators and scholars, we may be operating under assumptions based on what has been measured about people during an extremely narrow time frame—perhaps as little as 4 years, or about 5% of their lives. Although assertions have been made that CA levels reported during the undergraduate years will remain stable for one’s lifetime (McCroskey, Andersen, Richmond, & Wheeless, 1981), no evidence has ever been offered to support such a claim.
Self-perceived communication anxiety and its effects on career choice and persistence were a concern in early CA research (Daly & McCroskey, 1975; Falcione, McCroskey, & Daly, 1977; Scott, McCroskey, & Sheahan, 1978). But while there have been studies reporting CA scores measured by the Personal Report of Communication Apprehension (PRCA) on more than 50,000 undergraduates, PRCA scores have been reported for only 11,000 nonstudent adults. The purpose of this study is to assess whether age, years of work experience, and frequency in making presentations affect levels of CA and whether mean levels of CA vary across the career span.
Literature Review
Concern over what decades ago was referred to as “stage fright” and has been developed into the more inclusive concept “communication apprehension” led many business communication scholars to study this phenomenon in both students and working adults. However, there have been no longitudinal studies of CA as measured by the PRCA, the instrument developed by James McCroskey and colleagues. As a result, what has been characterized as “trait” anxiety with much precision by a dedicated school of communication researchers has never been retested at subsequent intervals longer than 6 months, nor postcollege graduation, to determine how persistent such traits may be. This means that we have almost no test-retest measurements outside undergraduate years, and thus, no measurements of whether and how much this important aspect may change over a person’s lifetime or career. Likewise, we have nothing like the cross-sectional or representative community-based studies conducted by psychologists to assess the prevalence of CA as measured by the PRCA in the total population. In sum, we may be engaging in generalizations about our students’ future prospects using overextrapolated data.
Biological Traits and the Effects of Experience
There are many biological elements or substrates to human personality, as McCroskey and colleagues argued (Beatty, McCroskey, & Heisel, 1998). But genetic endowment for all manner of physical, disease, and emotional effects generally interacts with one’s environment, experience, and reflection on that experience, in an enormously variable range of possible combinations.
As a way of addressing the role of experience with public speaking (PS) in CA levels, Beatty and Andriate (1985) asserted that, in their study, over the course of a semester, levels of CA stabilized after the third presentation was delivered among the undergraduates studied. McCroskey and colleagues had asserted that levels of CA measured during college years would be stable for life (McCroskey et al., 1981). Beatty et al. (1998), however, argued that while highly apprehensive speakers may decrease their CA levels between pre- and posttest, the drop is due to “participants . . . respond[ing] more accurately to the trait measure with experience” (p. 212, italics added). I share the confusion expressed by Condit (2000) in response to this convoluted attempt to explain away how even those deemed high in trait CA will nevertheless be able to report lower levels of anxiety as their experience in presenting increases. It does suggest that there is a struggle, even in the core article of the “communibiological paradigm,” to adequately account for what at the simplest, common-sense level seems possible, even if not in every case. They also note that “When students have little or no experience with public speaking, which is likely the case for most who volunteer for treatment, their responses to relevant items [in the PRCA instrument] may reflect expectations”(p. 212). In other words, students may be giving responses on the PRCA based on what they think they should say, and not on what they have actually experienced. I would suggest that if that were true, then making broad claims about the validity of such self-reported data on which McCroskey’s CA paradigm is based would have to be deeply discounted.
Perhaps the most cogent exposition of the interactions among biological, environmental, and personal factors as they affect communication and human development is provided by Celeste Condit (2000). Condit both refutes the interpretation of the biological and the genetic trait evidence offered by McCroskey and colleagues (Beatty et al., 1998; Valencic, Beatty, Rudd, Dobos & Heisel, 1998) and provides an account of genes and “heredity” informed by her own work on the Human Genome Project. She examines how a “multifactor” approach to understanding these interactions is both more accurate, and would enhance our pedagogical approaches, while also complicating and nuancing them.
While Condit and McCroskey, who published in the 1998-2000 time frame, focused on early studies and evidence, the questions have been continuously researched since that time, and additional evidence has emerged that warrants our consideration.
Within the field of psychology, including psychobiology, there has been significant debate over the extent to which parents who are themselves behaviorally inhibited transmit those tendencies to their children genetically or behaviorally (Chartier, Walker, & Stein, 2001; Knappe, Beesdo, & Wittchen, 2010; Lieb et al., 2000; Otowa, Gardner, Kendler, & Hettema, 2013). Concerning social anxiety disorder (SAD), pace Condit (2001) and contra McCroskey, Kashdan, and Herbert (2001) in a review of studies on child and adolescent twins wrote that although these data are suggestive of a genetic vulnerability to SAD, it remains the case that the majority of first-degree relatives—and even the majority of monozygotic twins of affected probands do not have the disorder. Other factors must therefore be involved in the etiology of SAD. (p. 40)
As Condit (2000) points out, it is rarely the case that a single gene is responsible for any effect. Likewise, it is always less than certain that any given gene will express in an organism, and even less certain that it will do so without significant interaction with other genetic and nongenetic elements within that organism and its environment. So epidemiology—that is, the extent of the manifestation of genetic possibilities—is a critical part of the evidentiary picture of genetic inheritance that must be established.
More specifically, relating to CA and public speaking anxiety (PSA), Boegels et al. (2010), reporting the results of several prior research studies including representative national samples, and prior reviews of studies, concluded that “performance anxiety is not familial” (p. 173). They further note that generalized social anxiety disorder (GSAD) has an earlier onset than SAD; that “GSAD patients appear to be exposed to more negative environmental factors than performance SAD”; and that “personality characteristics, such as shyness and [behavioral inhibition], do not seem to be related to performance anxiety, but ‘traumatic experiences’ and/or panic seem more important in the development of performance anxiety than in GSAD” (p. 173). As an example, Kilpatrick et al. (2007) found that, while persons genetically at high risk for depression experienced greater likelihood of developing posttraumatic stress disorder after the 2005 Florida hurricanes regardless of levels of social support, for persons genetically at low risk, both hurricane exposure and social support levels affected their incidence of posttraumatic stress disorder. Here, genetic predisposition has been found to be more determinative of some outcomes than others.
These studies offer epidemiological evidence based in population research, including participants whose ages extend across the life span and which represent findings from both inside and outside the United States. It should be noted that several of the researchers cited here also perform research involving brain scans and other neurological/biological approaches to measuring anxiety (e.g., Knappe, Beesdo, Fehm, Lieb, & Wittchen, 2009; Stein, Goldin, Sareen, Zorrilla, & Brown, 2002; Tillfors, Furmark, Marteinsdottir, & Fredrickson, 2002). So we need not reject their conclusions on the assumption that they are hostile to biological evidence for various behaviors. Indeed, they perform such studies and report such evidence regularly.
Psychological Studies: Clinical and Community
Although the fear of PS has been reportedly ranked as being greater than the fear of death (Kangas & Davidson, 2012), psychological evidence for a widespread, lifelong, and debilitating trait of PSA in the general population is simply lacking. Persistent patterns of SAD, with and without PS phobia, have been found to concentrate among younger, lower income, less educated, and female populations (Acarturk et al., 2009; Cairney et al., 2007; Costello, Egger, & Angold, 2005; Davidson, Hughes, Georges, & Blazer, 1993; Fehm, Beesdo, Jacobi, & Fiedler, 2007; Furmark, 2002; Furmark et al., 1999; Grant et al., 2005; Gum, King-Kallimanis, & Kohn, 2009; Heimberg, Hope, Dodge, & Becker, 1990; Kessler et al., 1994; Kessler et al., 2005; Medina-Mora et al., 2005; Offord et al., 1996; Schneier, Johnson, Hornig, Liebowitz, & Weissman, 1992; Stein, Walker, & Forde, 1996). These community studies, conducted in more than a dozen countries and involving more than 100,000 respondents, definitively establish that social phobia and PSA tend to decrease over the life span. But notably for our purposes, the highest levels tend to be measured between the ages of 15 and 30 years.
However, PSA in the general population, even at clinical levels, tends to be the least debilitating of all anxieties studied. It is also the most remitting, meaning, it will resolve and cease to be a problem, especially when no other phobias or anxieties are present (Bloete, Kint, Miers, & Westenberg, 2009; Boegels et al., 2010; Heimberg et al., 1990; Knappe et al., 2011; Levin et al., 1993; Pallanti et al., 2008; Stein, Torgrud, & Walker, 2000; Vriends, Bolt, & Kunz, 2014). When other anxieties are comorbid with PSA, the levels of impairment tend to be higher. However, in most studies, incidence rates for both profiles have been below 1% for the adult populations studied. In a small number of studies, with the most inclusive criteria, morbidity rates for PSA and social anxiety have been measured above 15%, as reviewed in detail by Furmark (2002). Smaller numbers of survey participants have been associated with higher rates of measured clinical anxiety (Vriends et al., 2014).
There does appear to be a life span factor in levels measured. Multinational studies involving thousands of respondents have demonstrated that PSA and SAD rates appear to peak in late adolescence through the mid30s and then tend to remit (except in the most serious clinical cases, many of which are marked by comorbidities) as the life span progresses (Bloete et al., 2009; Boegels et al., 2010; Offord et al., 1996; Schneier et al., 1992; Vriends et al., 2014). Furmark et al. (1999) reported a straight-line decrease in incidence of social phobia and PSA starting in the 30s and 40s, further suggesting an age correlation. A recent review of 39 studies reported that social anxiety and PSA have significant patterns of remission, between on average 50% (full) and 79% (partial) (Vriends et al., 2014; see also Chartier, Hazen, & Stein, 1998).
A review of McCroskey’s articles on the subject of communication anxiety as a biological trait shows that, of psychological sources cited, only 6 of more than 140 address nongenetic or nonbiological factors. None of the articles cited above were included in that number. Strikingly, all those 6 references occur in Wrench, Brogan, McCroskey, and Jowi (2008), the last article on the subject that McCroskey published. This suggests that McCroskey’s uptake of the psychological literature on the subject was partial and bears reconsideration.
These psychological studies surely demonstrate the interplay between biological and experiential/environmental factors in communication anxiety across the life span. They consistently found strong correlations among female gender, younger age, lower education levels, and lower incomes with higher levels of PSA. While female sex may be construed as a set of traits in a biological sense, one’s understanding of one’s gender is a construct, which is amenable to change. Age, while it carries biological characteristics for specific stages of life, obviously changes over the life span. Thus, those characteristics of college students that are rooted in the stage of their biological development may be expected to change as they mature. Income and education levels are certainly not biologically determined. From a business communication and educational perspective, then, all four of these correlations to PSA appear to be malleable. The psychological studies show that these factors are worthy of consideration alongside biological characteristics as affecting levels of communication anxiety throughout the life span.
PRCA Studies on Adult Populations
There are certainly studies using the PRCA that have been conducted on adults. However, the scoring and score distribution norms for the PRCA were established based on tests of undergraduate students. In 1985, McCroskey, Beatty, Kearney, and Plax reported, “Based on data drawn from over 25,000 college student subjects in 52 colleges and universities, the mean for the total score on the PRCA-24 is 65.60 with a standard deviation of 15.30” (p. 169). Thus, what have been utilized in subsequent research studies as averages should in fact be considered specifically as college-aged averages.
In contrast to McCroskey et al.’s (1981) contention that the PRCA normal scores and score distribution established from undergraduate data were essentially constant throughout the life span, PRCA studies on adult populations show a good deal of deviation from those norms. Table 1 shows all studies that report PRCA scores for adult respondents. These 26 studies report PRCA scores for 11,029 respondents, including 6 studies coauthored by McCroskey himself. Among the latter studies, representing 6,025 adult respondents, at face value, scores for 56.1% were at levels below the college average, 39% were about equal to it, and only 4.9% were above it.
Personal Report of Communication Apprehension Studies on Nonstudent and Student Adults.
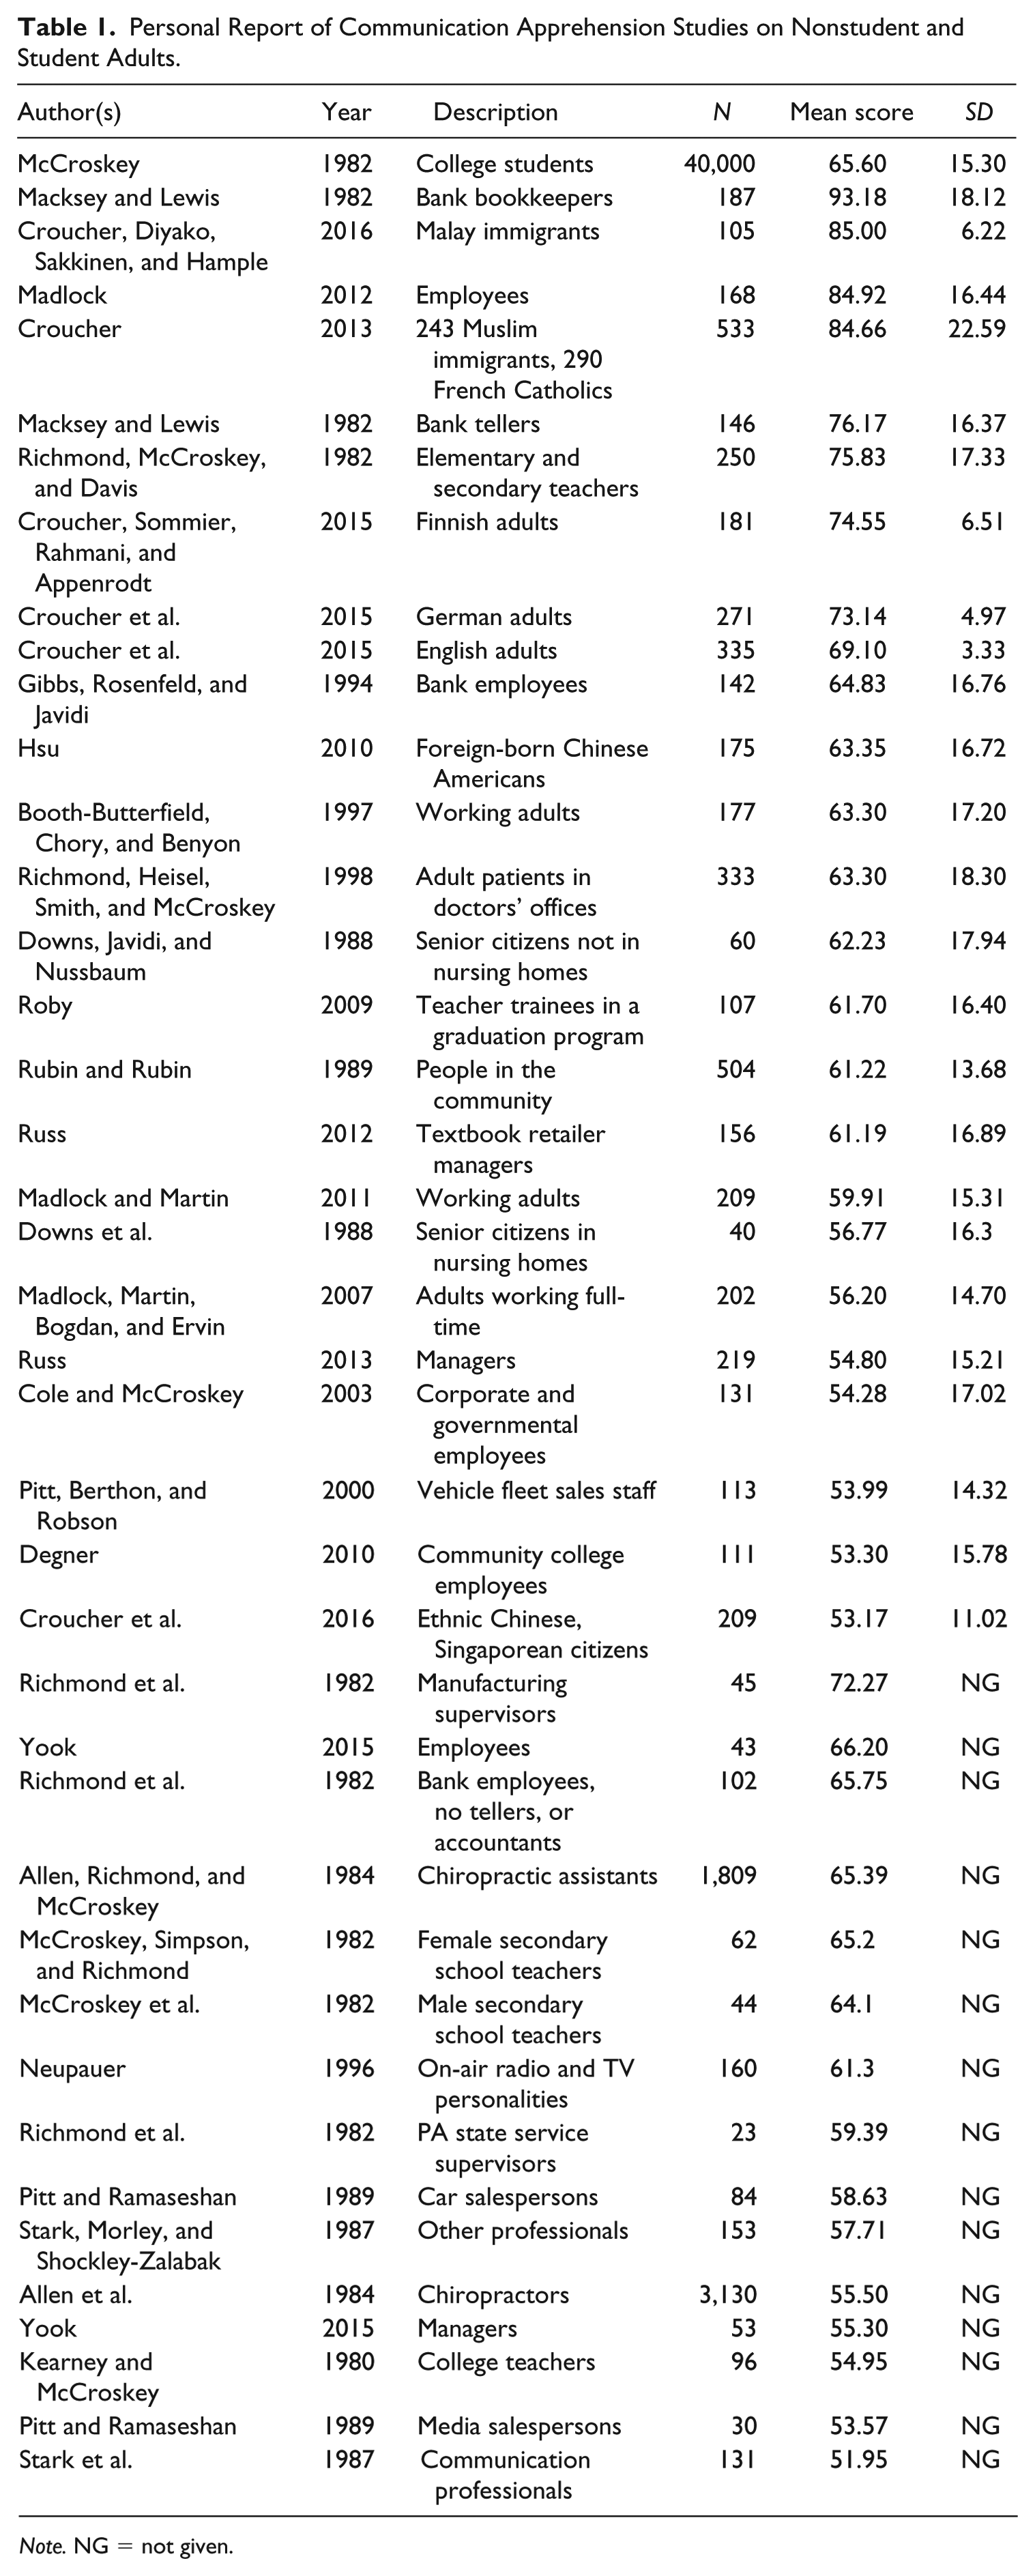
Note. NG = not given.
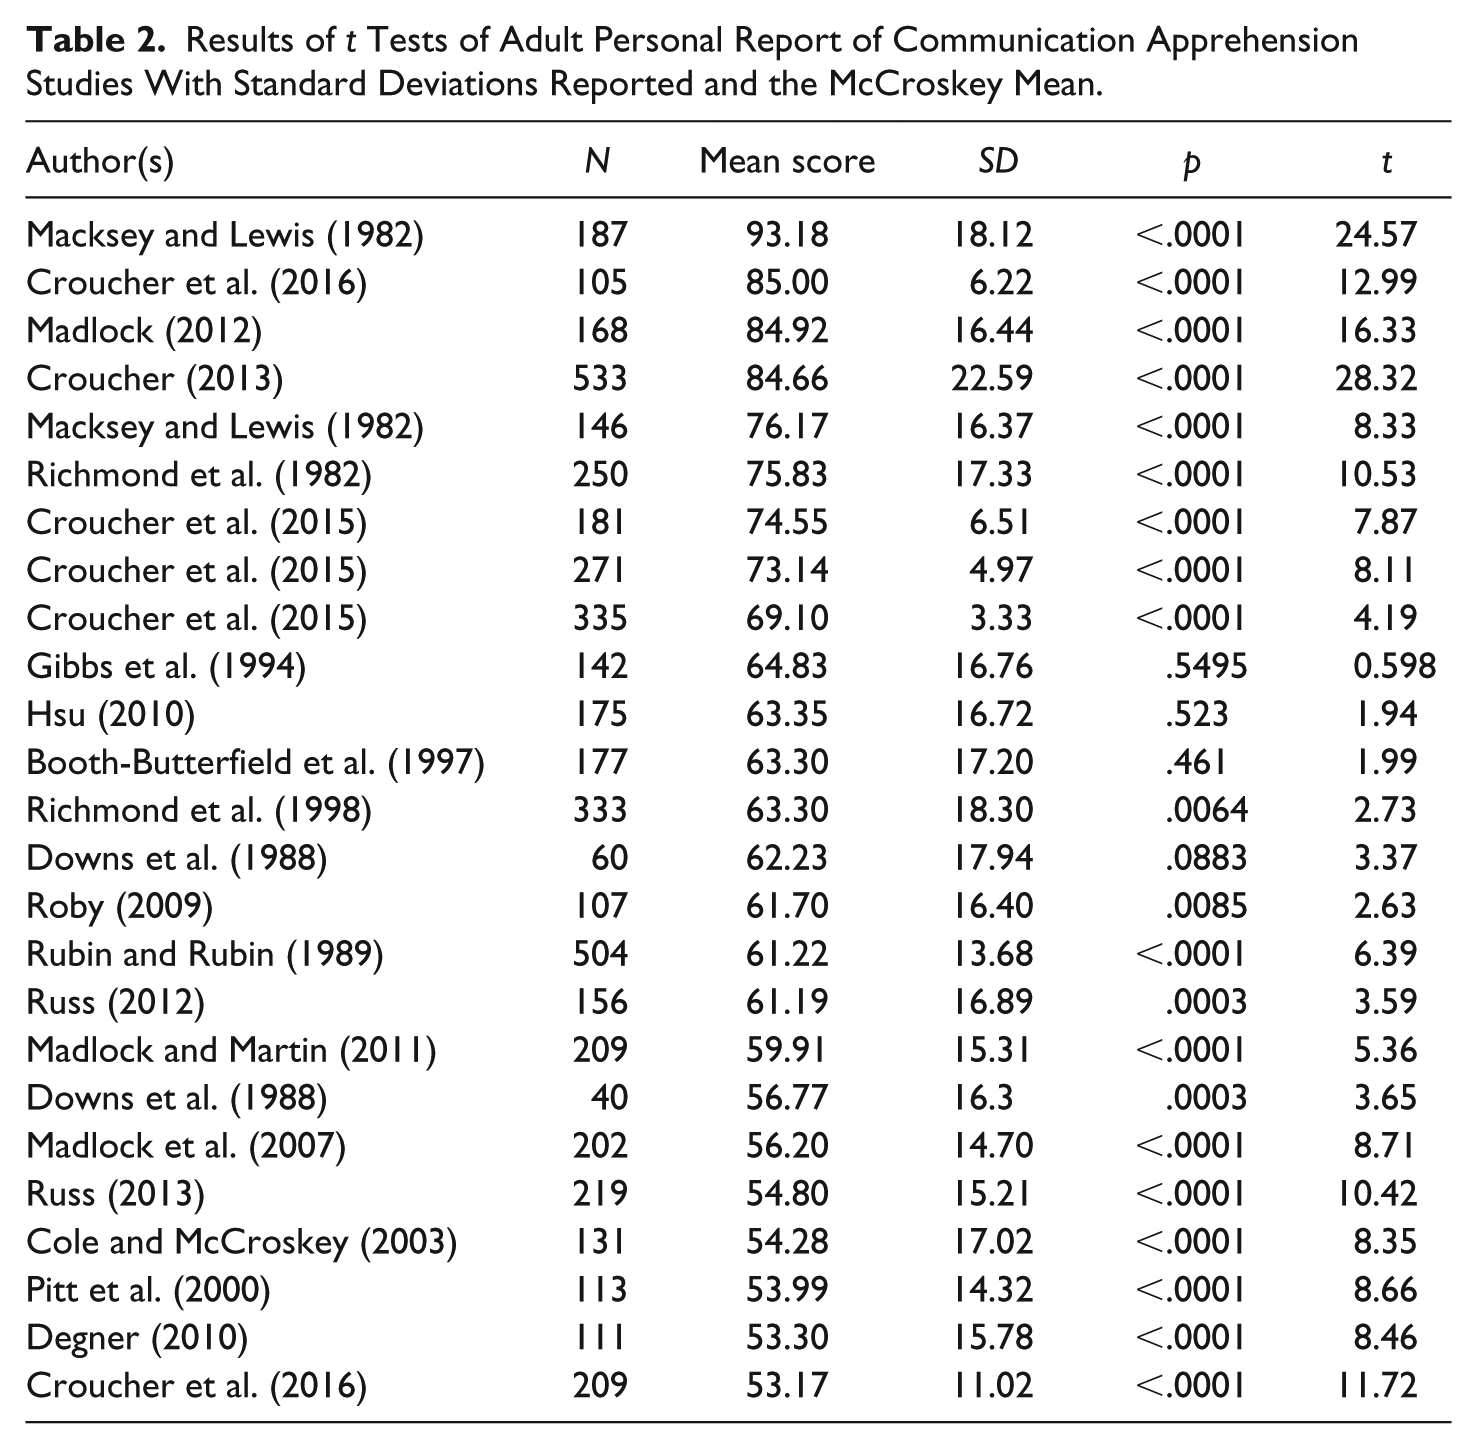
A deeper look at these studies yields more surprising results in terms of mean scores compared with McCroskey’s norms. Table 2 shows the results of unpaired t tests between adult scores and McCroskey’s mean when standard deviations were reported. In terms of numbers of respondents, 42.97% are statistically significantly above the college mean, 9.75% are indistinguishable from it, and 47.27% are significantly below it. Thus, again, we do not see the normal distribution of scores expected by McCroskey and, indeed, the complete opposite of a bell curve.
Results of t Tests of Adult Personal Report of Communication Apprehension Studies With Standard Deviations Reported and the McCroskey Mean.
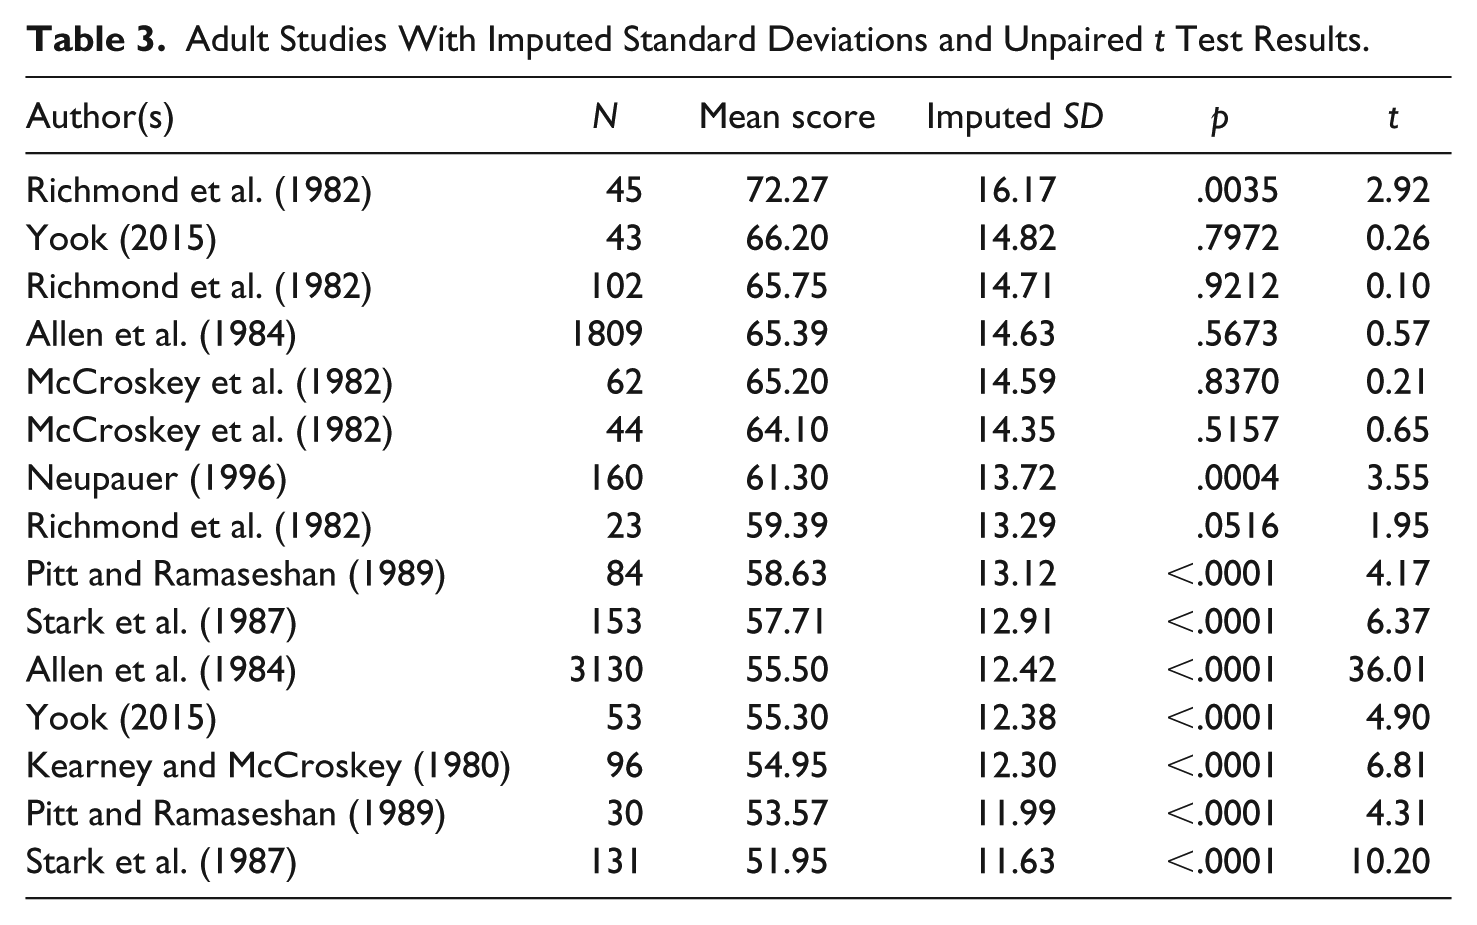
To model the significance of difference among the remaining scores, which represent 5,965 respondents, and McCroskey’s college norm, SDs were imputed as follows. For each adult mean score with an SD, a calculation was performed to determine the percentage of the mean score that the SD represented. Each percentage was multiplied by the number of respondents associated with that score, and a weighted average percent SD was calculated, which amounted to 22.38%. Then, each mean score reported without an SD was multiplied by 22.38% to arrive at an imputed SD. Unpaired t tests with McCroskey’s norm were then performed. The results are shown in Table 3. Here, 0.75% of respondents have mean scores significantly above McCroskey’s normal mean, 34.92% have scores statistically indistinguishable from that mean, and 64.32% have mean scores that are significantly below McCroskey’s college normal mean score.
Adult Studies With Imputed Standard Deviations and Unpaired t Test Results.
When we combine these two groups—reported SDs and imputed SDs—we find that while 20.14% of adult respondents have mean scores significantly above McCroskey’s norm, only 23.37% are within the medium score range, but 56.50% are significantly below it. While these studies represent a total of 11,029 adult respondents, compared with 25,000 undergraduates referenced by McCroskey in the construction of his mean scores, there is no normal distribution of scores called for by McCroskey. At a minimum, this suggests the need for further investigation.
Willingness to Communicate
One way to assess the extent to which communication anxiety as a trait may affect communication behavior is to measure how much people are willing to communicate. The Willingness to Communicate Scale developed by McCroskey attempts to capture this likelihood (Chan & McCroskey, 1987; McCroskey & Richmond, 1987, 1990). The assumption would be that high CA would result in low willingness to communicate (WTC) and that these levels would persist, since CA is a trait. There is evidence that WTC can change, however, even in the course of a semester, in a positive direction (Hodis, Bardhan, & Hodis, 2010; MacIntyre, 2012). Research in second-language learning has demonstrated the effect of the situation on WTC (Clément, Baker, & MacIntyre, 2003; Eddy-U, 2015; Munezane, 2015; Tannenbaum & Tahar, 2008). So it appears that WTC may not be a stable indicator of communication behavior and may in fact be fairly malleable, depending on the situation and other factors.
A second concern with WTC arises from validity in the means of measurement. The primary instrument measuring WTC does not contain any items relating to work environments (McCroskey, 1992; McCroskey & Richmond, 1987), presumably because it is most generally administered to undergraduate students who may lack work experience. To suggest that the same motivations affect working adults as affect often unemployed and/or not fully self-supporting undergraduates bears examination.
Park, Keil, and Kim (2009) utilized the WTC instrument in a laboratory experiment to test which factors affected an employee’s WTC problems in an information technology project. They reported that when undergraduates were asked to put themselves into a work situation, their WTC scores were not predictive of simulated workplace communication. A good test of WTC would be situations where the communication in question might bring negative results for the communicator. Schultz and Hooks (1998) found that, experimentally, stronger relationships increased the likelihood of reporting wrongful behavior, suggesting a confounding or at least potentially mediating factor to WTC. A third study (Bowles, Mackintosh, & Torn, 2001) found substantial differences between baseline and 6-month levels of WTC with difficult patients by nurses who had received specialized training. These studies further support the malleability of individuals’ WTC. Additional studies would be needed to establish the WTC instrument’s validity for all ages and work situations.
Maturational Development and Frequency of Presenting
Based on my review of the extant PRCA literature, there have been no measures of how often working adults present in total and how that frequency may relate to their levels of CA. Among undergraduates, Byers and Weber (1995) and Pörhölä (2002) have demonstrated a positive correlation between previous PS experience and lower overall PRCA scores. Marcel (2016) in a study of 474 undergraduate business majors showed a strong and direct correlation between frequency of presenting in the prior calendar year and reduced PRCA scores.
As discussed earlier, psychological studies have consistently found the highest levels of PSA in persons aged 15 to 30 years. A possible explanation for this phenomenon could be psychological development and maturation as factors affecting CA. Students aged 18 to 24 years may in fact not be developmentally capable of achieving high levels of competence in some important skills by the time they graduate with their bachelor’s degrees. Some recent research on emotional intelligence supports this possibility. Emotional intelligence has been correlated with greater effectiveness in PS (Rode et al., 2007). One study on the emotional intelligence of accounting majors versus liberal arts majors (Cook, Bay, Visser, Myburgh, & Njoroge, 2011) found that mean levels of emotional intelligence in the Canadian, South African, and U.S. students were rated as incompetent on the scale used. Another study (Bay & McKeage, 2006) found that both accounting and marketing majors had incompetent levels of emotional intelligence.
Several studies to date have measured levels of CA among students, sometimes before and after students have completed oral communication courses or modules, and found improvements based on taking the class or other pedagogical interventions (DiBartolo & Molina, 2010; Dwyer, 2000; Miller & Stone, 2009; Priem & Solomon, 2009; Rose, Rancer, & Crannell, 1993; Ruchala & Hill, 1994; Whitworth & Cochran, 1996; Yale, 2014). In addition, several studies specifically have found decreases in CA levels based on PS skills training, systematic desensitization, or both (Ayres, Hopf, & Will, 2000; Pribyl, Keaten, & Sakamoto, 2001; Rubin, Rubin, & Jordan, 1997; Schroeder, 2002). Allen, Hunter, and Donohue (1989) in a meta-analysis showed significant positive results for students’ decreased CA after the same interventions. And although McCroskey and colleagues argued that such changes were merely artifacts of problematic means of measurement, the fact remains that no longitudinal research was ever conducted to assess the validity of those claims (Beatty et al., 1998).
It is important to note that psychological studies conducted in the community have demonstrated life span trends in CA reduction, while communication classroom studies have shown results for desensitization and skills training. There is a developing psychological literature demonstrating durable results for early-childhood and adolescent interventions such as Social Effectiveness Training for Children for young people diagnosed with SAD (Beidel et al., 2007; Beidel, Turner, & Young, 2006; Durlak, Weissberg, & Pachan, 2010; Ginsburg & Kingery, 2007; Kashdan & Herbert, 2001; Masia-Warner et al., 2005). Additionally, Beidel et al. (2006) found that 5 years posttreatment, SAD sufferers functioned at levels of anxiety in a variety of settings in line with their unaffected age peers. Such research and experimental interventions are in early stages but do offer some preliminary evidence for efficacy. Thus, it could be argued that intervention itself, as long as it is age appropriate, may have long-lasting beneficial effects.
In sum, when we consider that greater age, and with it perhaps greater years of work; communication experience—that is, how many presentations a person has given, along with how much group, meeting, and interpersonal communication a person has engaged in—and maturational development have been strongly associated with lower communication anxiety using a variety of measures, we have the basis for exploring whether age, work experience, and practice of skills have any effect on PRCA scores and CA levels in working adults.
Current Study
This study sought to test whether chronological age, frequency of presenting, and years of work experience correlate to any significant effects on CA among adults.
Studies on frequency of presenting relative to levels of PSA and CA to date have been limited. A previous study of 2- to 12-year business major alumni (Marcel, 2015) found that the single greatest predictor of self-reported communication confidence among factors studied was frequency of presenting. A second, on college seniors majoring in business, found the same relationship between frequency of making presentations and CA levels measured by the PRCA (Marcel, 2016). However, as noted previously, studies on adults to date have not measured both CA and frequency of making presentations. The relevant question concerns whether age or frequency of presenting confers any benefit toward reducing CA and PSA over the career span and whether work experience has any effect, as a check against age alone.
Method
Alumni from a private northeastern university who graduated between 1976 and 2016 with either a bachelor’s or master’s degree (or both) were surveyed electronically in 2016 via Qualtrics using the e-mail addresses they supplied to the university alumni association. All graduate alumni took degrees in a business discipline, but their undergraduate degrees included both business and nonbusiness disciplines. Undergraduate alumni obtained their degrees in business fields in more than 95% of cases, as that is the focus of the university’s curriculum. A total of 31,671 alumni were sent e-mails, of which 2217 were undeliverable. A lottery determined 20 winners of $25 gift cards from among the respondents who completed the survey. A total of 3,156 usable responses were collected for a response rate of 10.77%.
Required minimum completed responses were calculated using Cochran’s rules for both continuous and categorical data collection (Bartlett, Kotrlik, & Higgins, 2001). Sufficient responses were received to reach alpha at 0.01 and t = 2.58 for continuous data with a 0.03 margin of error; for categorical data, responses achieved a 0.01 margin of error and t = 2.58.
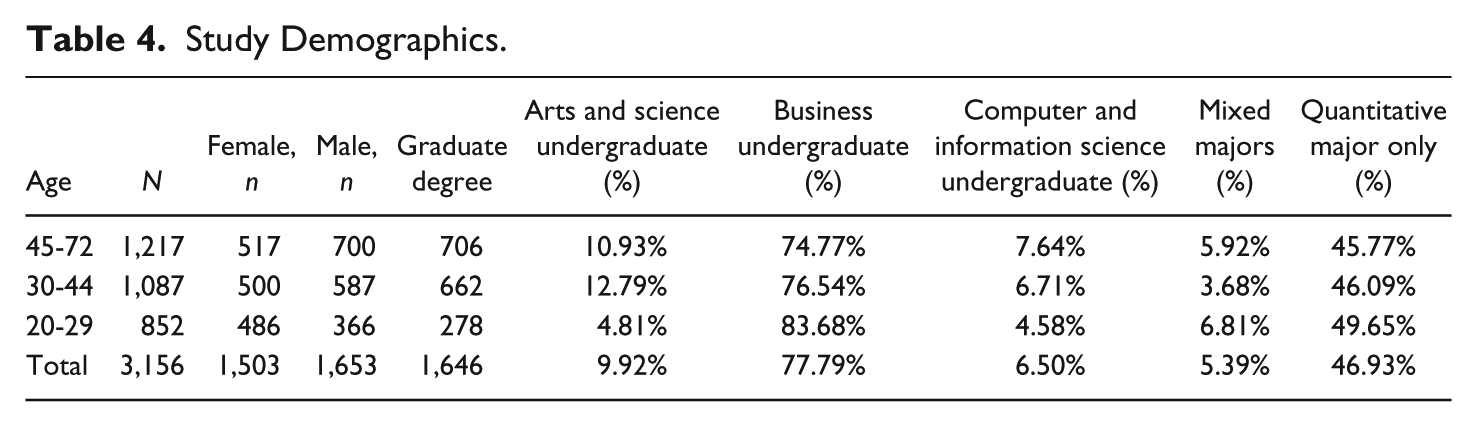
The demographics of respondents are shown in Table 4. Overall, 48% of respondents were female, and 52% had completed a graduate degree. About 47% completed a single undergraduate major in accounting, finance, engineering, science, or math; 9.9% completed an undergraduate degree in an arts and sciences discipline; and 6.6% completed an undergraduate degree that had no quantitative aspect. About 78% completed an undergraduate degree in a business discipline. A total of 87.8% reported that English was their first language.
Study Demographics.
Results
The first question concerns whether there are age correlations with CA. Table 5 shows that, in age groupings utilized in psychological studies, several significant effects emerge. The factor of frequent communication was measured by how many times respondents had made a presentation in the past calendar year. The wording of the question was as follows: In the last calendar year, how often on average have you made presentations? A presentation means “an activity in which someone shows, describes, or explains something to a group of people.” It also includes “making a speech.” Include any presentations and speeches you have made in class, outside of class, and at a job or internship.
Mean Personal Report of Communication Apprehension (PRCA) Scores by Frequency of Making Presentations Compared With McCroskey’s Mean Score.
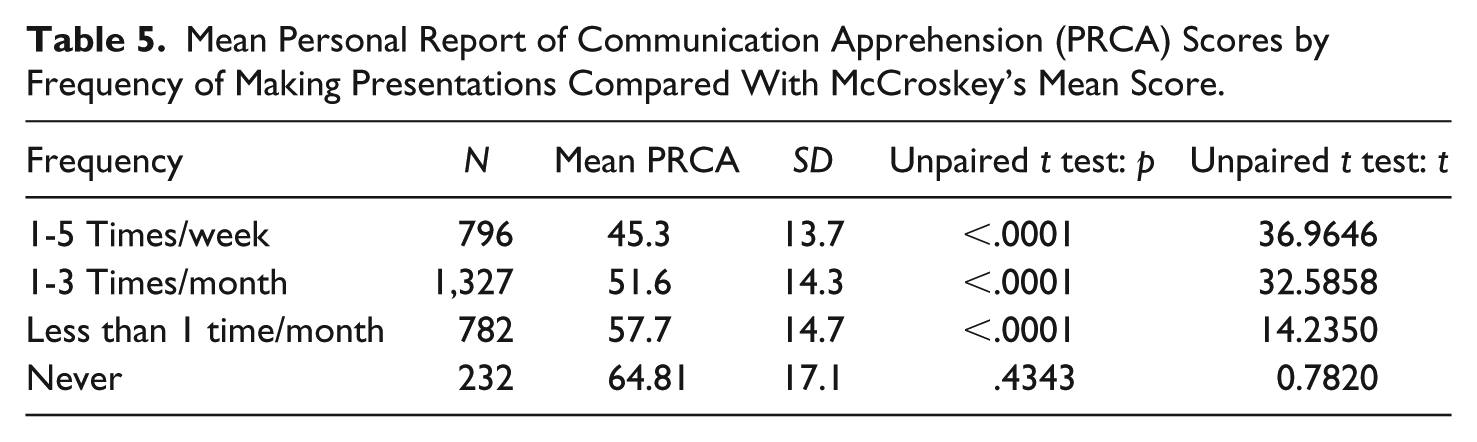
Choices were never, less than once per month, once per month, 2 to 3 times per month, once per week, and more than once per week. Results were combined as never, less than once per month, 1 to 3 times per month, and 1 to 5 times per week. Numbers are slightly lower than overall due to a lack of report on frequency by some respondents.
Overall, mean scores for respondents are significantly below McCroskey’s mean of 65.6 (SD = 15.3) for college students. Unpaired t tests showed that in all but one case scores are highly significantly below the expected mean. The McCroskey mean does, however, strongly correlate with respondents who report never having given a speech in the last year. To the extent that McCroskey never reported data on how frequently his PRCA respondents reported making presentations, it raises an interesting question as to their possible lack of experience in giving presentations as a factor in their PRCA scores.
When we consider the factor of age, which the psychological studies cited suggest is a relevant factor in levels of PSA, we also see significant effects. Table 6 shows that in every case, rather than the expected normal distribution predicted by McCroskey’s scoring system, only 4.19% to 7.25% of these adult respondents score as highly apprehensive. Gains land primarily in the low end of the scoring range; there are no age categories that achieve the normal distribution—between 38.83% and 51.31% score in the low range—a wildly unexpected result versus a normal distribution.
Distribution of Mean Personal Report of Communication Apprehension (PRCA) Scores by Decade.
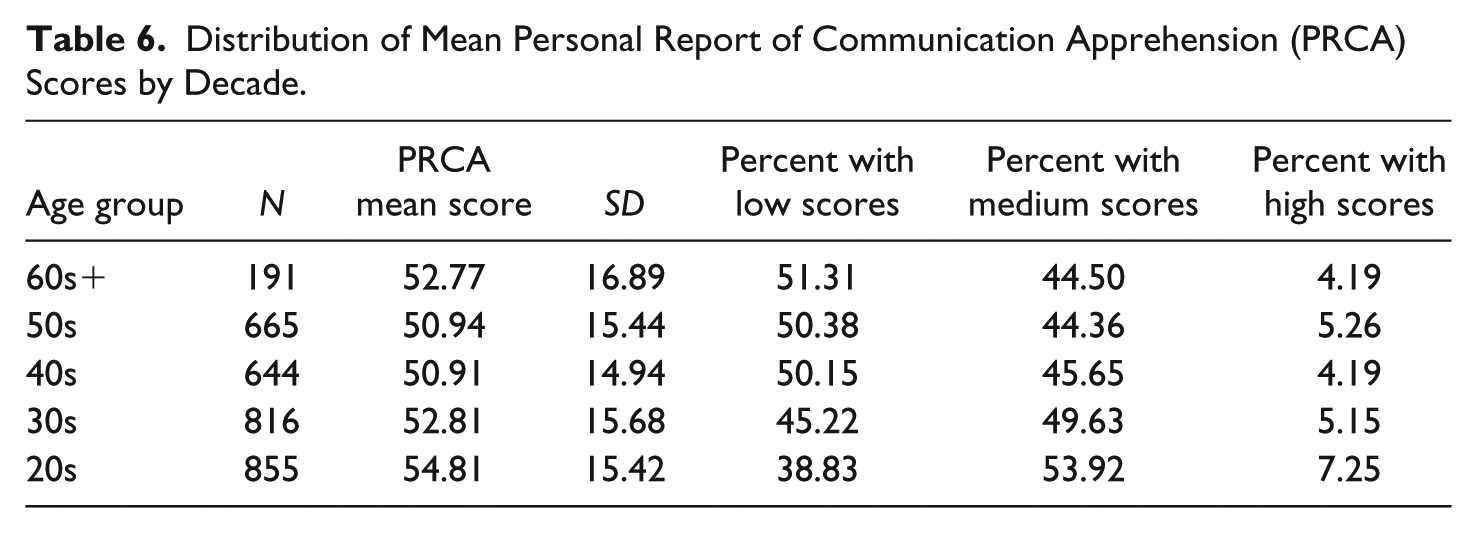
Every other frequency group falls significantly below the mean, such that only 6.42% of all respondents align with McCroskey’s norm. In every case, the difference in scores by frequency of making presentations within age cohorts was also highly significant (p = .000).
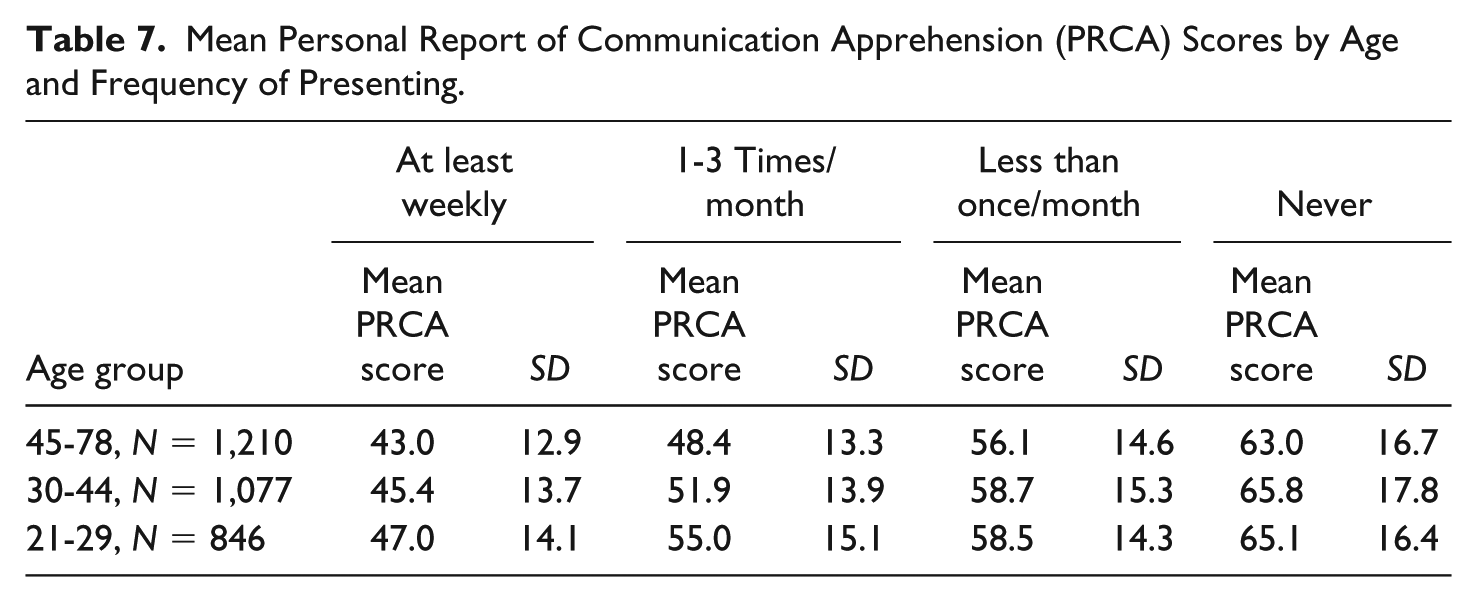
When we consider these two factors together, the pattern holds. Table 7 shows that the more frequently alumni of all ages make presentations, the lower their PRCA scores, regardless of age.
Mean Personal Report of Communication Apprehension (PRCA) Scores by Age and Frequency of Presenting.
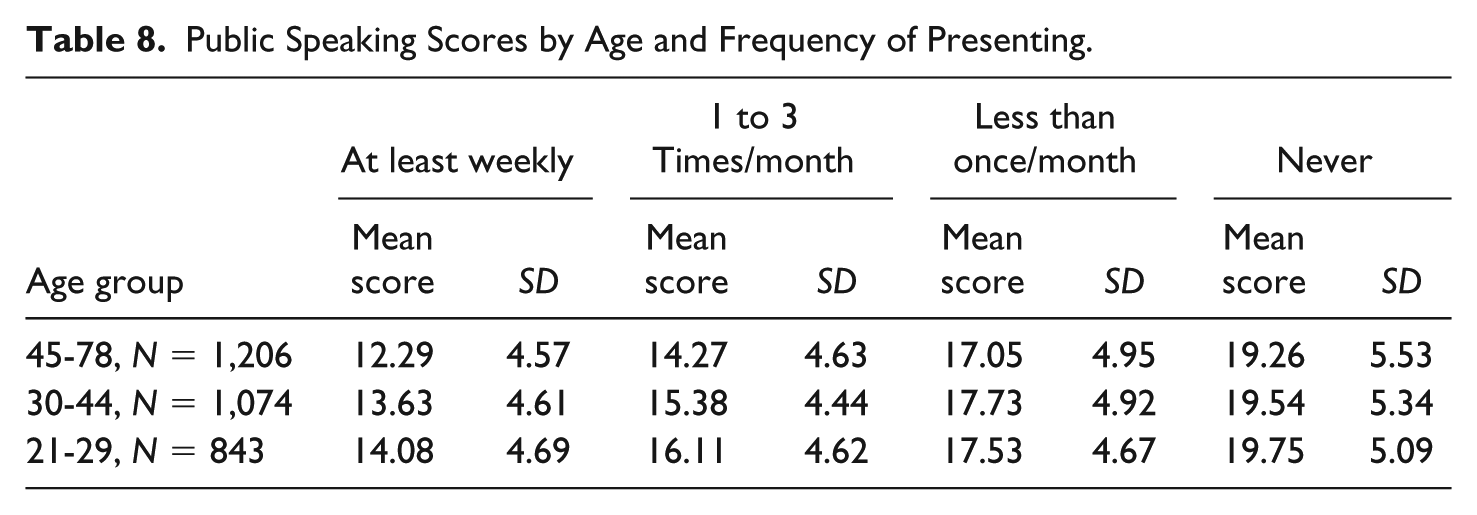
To determine more specifically whether frequency of making presentations and speeches has any effect on levels of the PS component of the PRCA score, an analysis was conducted controlling for age using the same age groupings and frequency categories. The results in Table 8 indicate a similar pattern: Older and more frequent presenters reported the lowest scores in the PS section of the PRCA. The least frequent presenters across all ages had the highest; only those never presenting were statistically equivalent to McCroskey’s mean PS score of 19.3 (SD = 5.1). The pattern holds without exception within age cohorts as well.
Public Speaking Scores by Age and Frequency of Presenting.
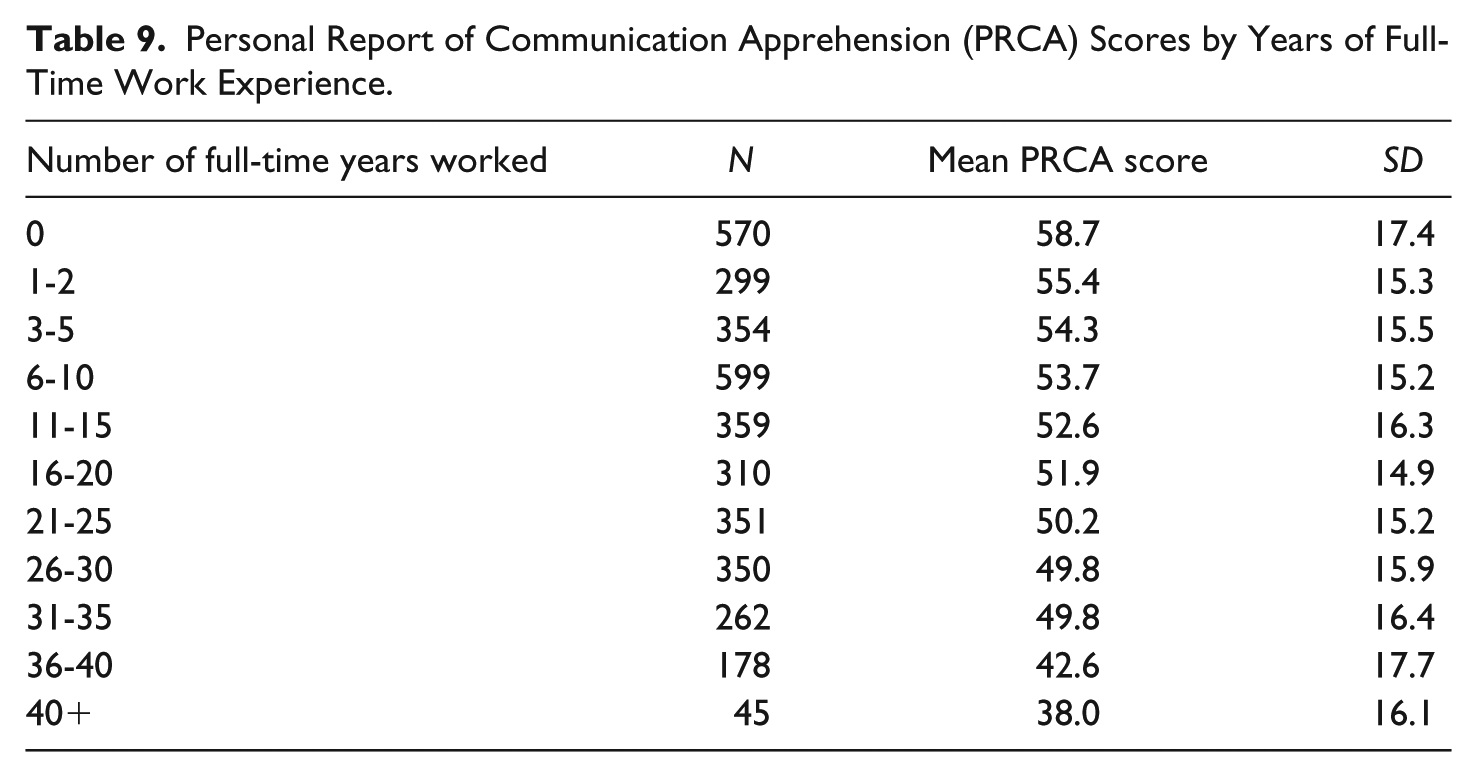
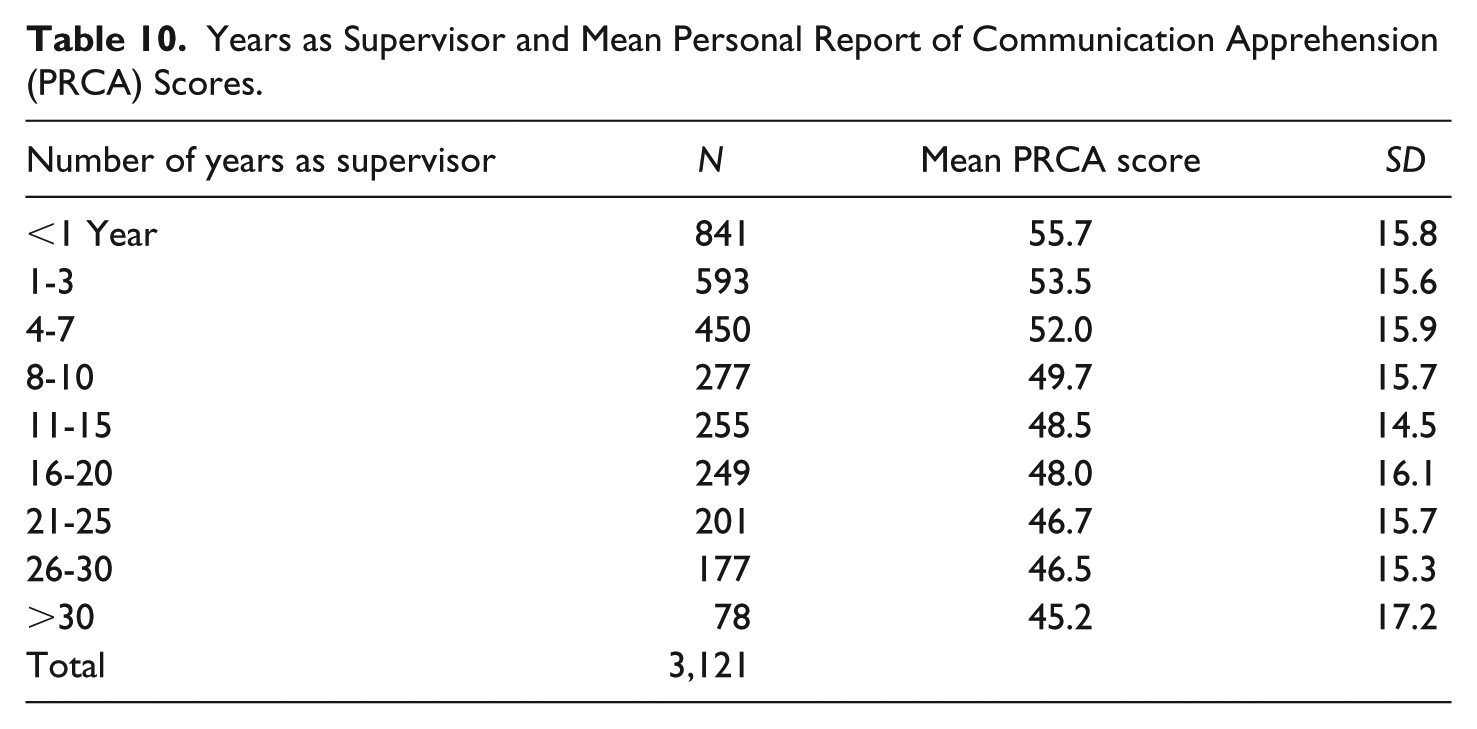
The final two factors, years of full-time work experience and years of supervisory experience, also demonstrate a clear pattern. As Table 9 shows, there is a steady decrease in total PRCA scores with increased years of work experience. Table 10 shows the same pattern with respect to years of supervisory experience.
Personal Report of Communication Apprehension (PRCA) Scores by Years of Full-Time Work Experience.
Years as Supervisor and Mean Personal Report of Communication Apprehension (PRCA) Scores.
Discussion
This study of working adults and their levels of CA found support for all hypotheses. First, there appears to be a significant correlation between chronological age and reported levels of CA. The youngest respondents reported the highest levels of overall CA, with a smooth progression downward in scores as age increased. This finding corroborates the psychological research cited above, which found the highest levels of PSA and social phobia concentrated among younger, less educated, and lower income populations and among persons from 15 to 30 years of age.
This finding contributes significantly to our understanding of communication anxiety and PSA across the life span. The creator of the PRCA instrument and many subsequent researchers came to believe that communication anxiety was a trait that would remain stable throughout the life span. But because no longitudinal or follow-up studies on high-scoring students long after graduation have ever been conducted using the PRCA, we still cannot say definitively that a person will maintain the same PRCA score over decades of life. But psychological studies conducted on community samples in at least 21 countries, and this study, have demonstrated that there may have been two significant skews in the original study populations used to develop the PRCA that led to a faulty conclusion.
First, the traditional college-aged population, who comprised the vast majority of subjects used to establish the PRCA scoring norms are not, in fact, representative of the population as a whole in terms of the distribution of high, average, and low levels of communication anxiety McCroskey predicted. In fact, persons between the ages of 15 and 30 years exhibit the highest average levels of PSA relative to the rest of the human age span. Thus, measuring test subjects in the 18 to 24 age range to establish averages for levels of communication anxiety is akin to measuring subjects running fevers when attempting to determine average human body temperature. The average scores for that age range are higher than all other age groups. This study, along with others conducted on adult subjects using the PRCA, have demonstrated that the scoring system must either be interpreted as relevant for college students only, or it should be understood that the majority of adult respondents will score in the low to average ranges in much higher proportions than McCroskey’s expected normal distribution for the instrument.
The second skew has to do with levels of PS experience. This study demonstrates that the total mean score for the PRCA established by McCroskey correlates with never having given a presentation in the previous year. In both undergraduates (Marcel, 2016) and the current study, those persons who present more frequently have lower overall PRCA scores as well as lower scores on the PS apprehension component score of the PRCA. This holds true consistently for subjects in these two studies for ages 20 to more than 70 years. The problem with interpreting PRCA scores as indicative of a fixed trait is that it does not account for variations in experience or the ways in which experience might interact with, and either reinforce or weaken the effects of, any biological substrate or personality construct, an idea Condit (2000) explores at length. As she puts it, “People who have not given public speeches, like people who have not handled snakes, are likely to expect the stimulus to be far more negative than it is” (p. 21). Once the experience becomes familiar, the extreme negative valence may be reinterpreted; I would add that for adults who have seen more speeches than younger people, and who have given more speeches in the course of their lives, that process of reinterpretation will have been ongoing and with much more data and reflection to work from than the average undergraduate. A secondary measure, years of full-time work experience, reinforces this finding: There does seem to be a persistent and dampening effect of age, frequency of presenting, and work experience on levels of communication anxiety among working adults.
It seems that, in lieu of collecting data on how frequently participants made presentations, McCroskey and his colleagues turned to the development of a likelihood measure, namely, the Willingness to Communicate Scale. However, this measure as discussed above is not geared to working adults and appears to be highly situationally dependent. Collecting a direct measure of PS experiences based on recall of the previous year has the limitations of recall bias and potential self-report inaccuracies. However, it has yielded a robust correlation to levels of CA in two studies so far: one on undergraduates (n = 474; Marcel, 2016) and the present on adults aged 20 to more than 70 years old (n = 3,156).
In light of the larger psychological literature that engages both biological and environmental factors in SAD and PSA, this study provides a strong basis for considering that, regardless of genetic predispositions and other biological substrates, experience in making presentations, in addition to previously researched educational and psychological interventions where needed, make the genetics of those predispositions much less than determinative of actual behaviors and capacities than may have been previously thought. These predispositions interact with experience and environment in significant ways, making them, for most people, reasonably malleable. This is good news for employers and for individuals who experience any level of apprehension, anxiety, or distress at the prospect of making presentations and communicating with others in general. Both age and experience with presenting may help significantly. Indeed, Marcel (2016) found that the effect of more frequent presenting had more significant benefits for female students than male students, which may offer further hope given the correlation among younger, lower income, and less educated women to higher levels of PSA. It is also good news for teachers, who now have a concrete basis for reassuring students that there is a measurable benefit that derives from making more presentations, namely, reduced anxiety. It supports pedagogies that enable both practice (Ayres, Schliesman, & Ayres Sonandré, 1998; Pearson, Child, & Kahl, 2006) and multiple presentations in classes.
Limitations and Future Research
This study, while robust in size and range of ages, engaged the alumni of one rather small, business-focused, private university in the northeastern United States. It did not assess PRCA levels for individuals who have had difficulty gaining employment. While CA appears to remit over time for the employed population in this study, it would be important to evaluate levels among unemployed cohorts, as well as those who have taken a break from their careers. There may simply be a reinforcing effect enjoyed by those who remain employed, versus disconfirming effects for those who do not manage to gain or sustain employment.
Likewise, the majority of these alumni have spent at least 4 years as supervisors in their careers; 30% have 11 to 35 years’ supervisory experience. This is associated with higher incomes and lower levels of PSA in community studies. Therefore, it would be highly relevant to administer the PRCA to large numbers of nonmanagerial employees, of diverse ages and regional backgrounds, and at different educational levels to determine whether the factor of presenting frequently still holds. Madlock’s (2012) study of Mexican nonmanagerial employees found a mean score in the high range; likewise Macksey and Lewis’s 1982 study found an even higher mean score for bank bookkeepers. Finally, truly longitudinal studies would surely contribute to clarifying the extent to which levels of CA alter over the life span.
Additional analyses of the data collected in this study concerning first language, undergraduate major, gender, completion of a graduate degree, communication coursework, and use of visuals in presenting will be conducted to determine their effects on levels of communication anxiety reported. Assessing the impact of training on lowering CA among employees would also be relevant, since studies to date have focused on classroom interventions with students.
Conclusion
It appears that frequency in making presentations, age, work, and supervisory experience have significant and positive effects on levels of communication anxiety as measured by the PRCA. These findings should inform the approaches we take to teaching business communication and presentation skills. Setting more accurate horizons of expectation for students can be helpful and reassuring, especially because communication across many settings remains a core business competence. Additionally, these findings underscore the value of multiple opportunities to make presentations in the classes we teach, as a means for furthering their chances to reinterpret their own experiences. As Condit (2000) puts it, “The job of the teacher is to seek effective re-interpretation strategies for students to assist them in rewriting themselves, so that they will have additional options available to them” (p. 22).
Although undergraduates form a convenience sample for much empirical research in the communication field, this study demonstrates that research on working adults is necessary and critical to forming an accurate picture of the capacities and limitations of business communicators in their careers. With the ubiquity of digital communication and ready access via both public and protected sources (such as university alumni lists) to contact potential respondents in cost-effective ways, it behooves us to utilize those means to strengthen our research on business communicators to validate conclusions drawn from student samples. Likewise, we also have far more convenient access, through library electronic databases (including the National Library of Medicine), to research conducted in related fields whose methods and reach are different from our own.
Additional research is needed to assess the robustness of these effects and to address what interventions—whether in the classroom, work trainings, psychological treatments, online programs, or others—may be most effective for those suffering with CA. Although every person has a biological and genetic endowment, these results confirm a preponderance of studies that show that environment and experience interact with those endowments in varying ways. These findings are worthy of attention by educators and employers as well as affected individuals. Our challenge may be to ensure that supportive interventions, including classes and trainings, are accessible to those who can most benefit.
Footnotes
Declaration of Conflicting Interests
The author declared no potential conflicts of interest with respect to the research, authorship, and/or publication of this article.
Funding
The author received no financial support for the research, authorship, and/or publication of this article.