
Abstract
Lattice structures have garnered extensive attention for their lightweight properties and high-energy absorption capacity. The inlaid lattice structure, comprising interconnected unit cells, enhances mechanical behavior through inlaying. AlSi10Mg powder served as the material, and FB/BF inlaid lattice structures incorporating body-centered cubic (BCC) and face-centered cubic (FCC) unit cells were fabricated via selective laser melting. Mechanical properties and fracture modes were subsequently analyzed. Results indicate that reducing strut diameter degrades the mechanical properties of FB and BF structures. The BF structure decreases to <68% of its original properties, while FB retains >86% when the BCC-strut diameter is reduced. FB exhibits superior mechanical properties, with maximum yield strengths of 112 MPa (FB) and 105 MPa (BF), exceeding those of uniform BCC structures at identical relative densities. Under compression, the structure fails initially through layer-by-layer fracture, then fractures at ∼45°, showing a mixed fracture mode characterized predominantly by ductile fracture with a minor contribution of brittle fracture.
Introduction
A lattice structure is a porous, lightweight structure formed through periodic or aperiodic arrangement of unit cells in three-dimensional space. 1 By adjusting key parameters such as the geometric configuration, connection mode, and relative density of unit cells, targeted optimization of the macroscopic mechanical properties of the material (including load efficiency, energy absorption characteristics, and deformation failure modes) can be achieved. 2 This performance control mechanism, based on microstructure design, not only enables lattice structures to surpass the strength–weight ratio limitations of traditional dense materials but also endows them with innovative functional characteristics such as programmable thermal properties and wave control capabilities, providing pathways for lightweight design and multifunctional integration of advanced equipment. 3 This type of structure has been widely used in the aerospace and automotive industries.4,5 As an advanced three-dimensional topological configuration, lattice structures feature periodically arranged microstructural units connected via optimized nodes. Its unique topological configuration significantly enhances key material properties, including the negative Poisson’s ratio effect,6,7 stiffness, 8 and flexural strength. 9 They also exhibit exceptional performance in vibration damping, 10 ballistic protection,11,12 high-impact load dissipation, 13 and acoustic regulation. 14
Strut-based lattice structures constitute repetitive grid structures formed through interconnected struts (or beams) in three-dimensional space, as well as 3D topological configurations generated by the regular arrangement of connecting nodes. 15 Its core characteristics lie in realizing customized design of material properties through the geometric parameters of struts (such as diameter, length, orientation) and spatial arrangement, as well as achieving lightweight and high-strength mechanical properties through the combination of nodes and struts. This makes it particularly suitable for scenarios requiring optimized material distribution and energy absorption. Typical classifications of strut-based lattice structures (based on strut arrangements) include body-centered cubic (BCC), face-centered cubic (FCC), simple cubic (SC), octet truss, and diamond structure. These typical lattice structures exhibit different mechanical properties, such as high-energy absorption rate and significant anisotropy (BCC), excellent shear resistance and isotropic stiffness (FCC), low density and low strength (SC), ultrahigh stiffness-to-weight ratios (octet), and outstanding impact resistance (diamond).16–18 Based on unit cell deformation mechanisms, lattice structures are categorized into two types: tension-dominated and bending-dominated types. 19 Under normal load, bending-dominated structures dissipate energy via member bending resistance of rod elements and nodal shear yielding, and their mechanical response is mainly restricted by the material’s plastic deformation capacity. In contrast, tension-dominated structures transfer loads through von Mises stress fields generated by the axial compression of rods. Their loading behavior aligns better with the elastic buckling theory, thus demonstrating significant advantages in core indicators such as specific strength and energy absorption efficiency.20–22 This difference in mechanical properties confers application advantages on tension-dominated lattices where strength and stiffness are critical, such as aerospace load-bearing components and armored protection systems.23,24 It is worth noting that the performance boundaries of the two types of structures can be broken through multi-scale topological optimization: through strategies like gradient pore design and heterogeneous material composite, hybrid deformation systems combining high stiffness and high toughness can be constructed. Inlaid lattice structures represent advanced design strategies optimizing properties via multicelled topological nesting. This method breaks through the limitations of traditional uniform arrangement of unit cells. Introducing multi-structural unit cell geometries, it constructs cross-scale stress-adaptive systems. Their core advantages include the stress field reconstruction, failure path regulation, and multifunctional coupling of lattice structures. The multifunctional coupling of lattice structures embedding tension-/bending-dominated unit cells according to functional gradients, enabling simultaneous high stiffness and energy absorption. FCC and BCC lattices are typical tension-/bending-dominated structures. This research aims to construct hybrid deformation-mechanism structures with both high stiffness and high toughness by inlaying FCC and BCC lattices (i.e., FCC and BCC lattice structures), which are applicable to high-energy absorption (anti-collision structures) in quasi-static scenarios and rapid energy dissipation (explosive structures) in dynamic scenarios. For the manufacturing of complex lattice structures, traditional manufacturing includes investment casting, 25 wire weaving, 26 controlled foaming, 27 and powder metallurgy. 28 However, such process systems based on the concepts of subtractive or equal-material manufacturing generally suffer from problems such as cumbersome processes and limited accuracy, hindering accurate realization of complex unit cell topologies. This has severely restricted the application expansion of lattice materials in advanced engineering fields. Metal additive manufacturing technologies represented by selective laser melting (SLM), based on discrete-deposition principles, enable digital precision forming of complex unit cell structures via microscale melting and metallurgical bonding of metal powder layers by high-energy laser beams. 29 The layer-by-layer manufacturing approach of this technology not only breaks through the geometric constraints of traditional processes but near-net-shape capability significantly reduces the post-processing cost of complex lattice structures, providing breakthrough technology for the design–manufacturing integration of multifunctional lattice structures.
Employing a hybrid design concept, we explore the mechanical properties of combined tension-/bending-dominated lattices. This research will design two inlaid lattice types based on FCC (tension-dominated) and BCC (bending-dominated) structures. This research will investigate forming parameters and printing accuracy of the inlaid lattice structures. Additionally, mechanical behavior, stiffness, and energy absorption of the inlaid structure specimens are analyzed under quasi-static compression and tensile loads. Combined with simulation analysis, this research examines the effects of relative density and geometry on the mechanical properties and fracture modes of the lattice structures and reveals variation laws in properties and deformation mechanisms.
Experimental and Methods
Materials and SLM process parameters
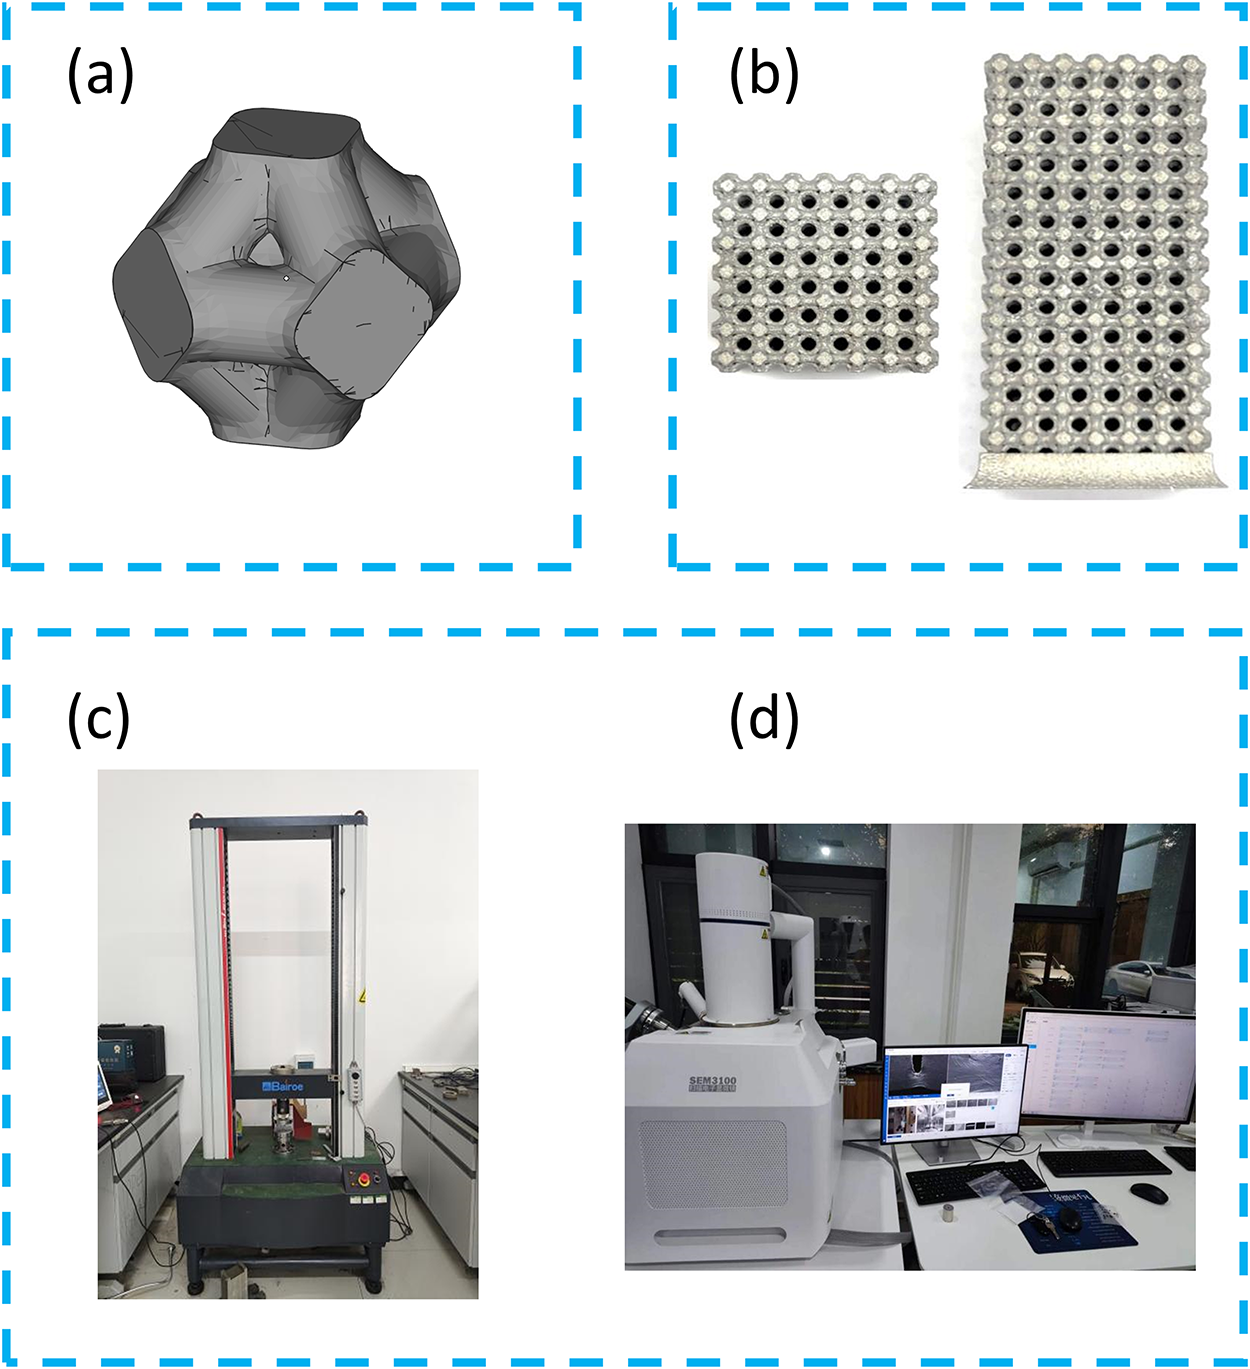
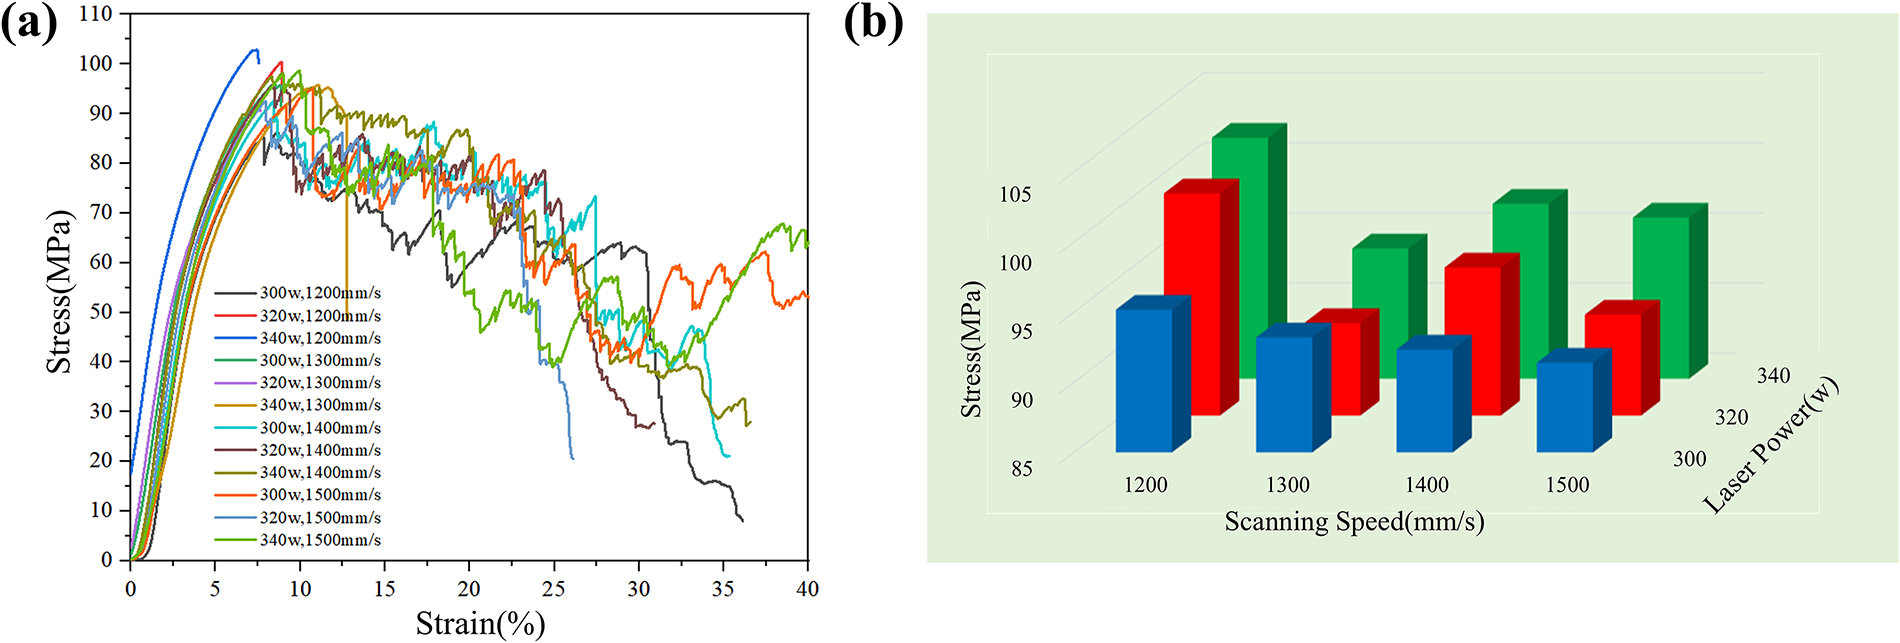
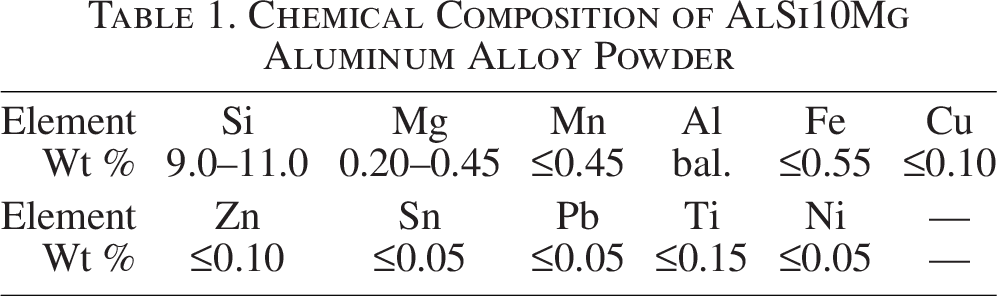
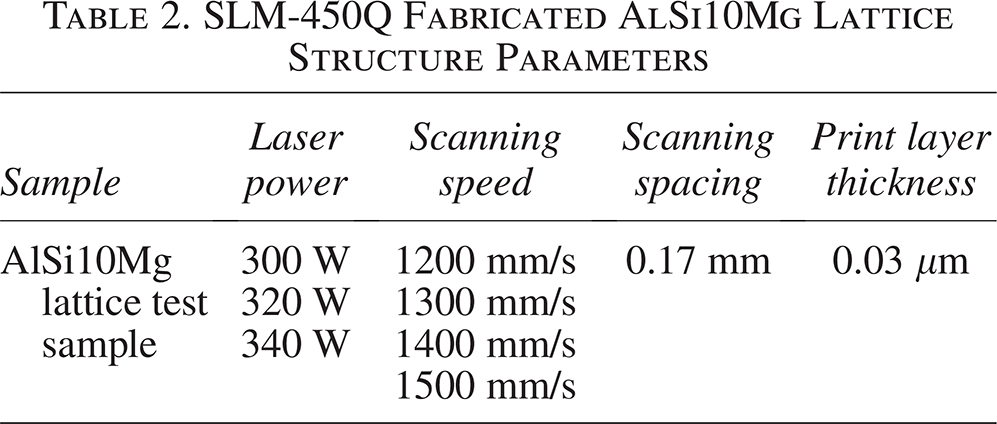
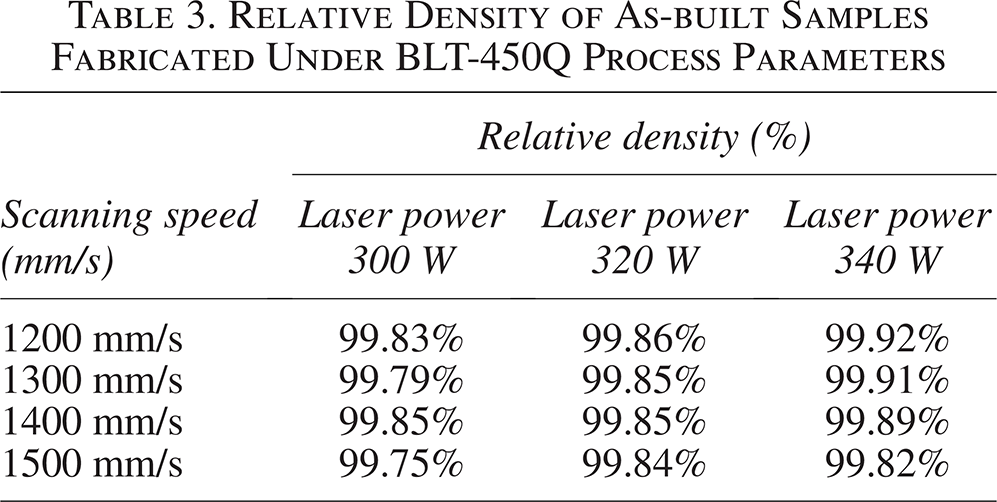
AlSi10Mg alloy powder produced by BLT via atomization and rotating electrode methods under inert gas was used as the raw material. The powder particles are nearly spherical with smooth surfaces and excellent fluidity, with a particle size distribution of 15–53 μm. The specific chemical composition of the powder is shown in Table 1. To prevent moisture-induced impairment of AlSi10Mg powder fluidity and subsequent printing quality degradation, the powder is typically vacuum-dried prior to SLM printing to maintain optimal fluidity. The printing was carried out using the BLT-450Q SLM metal additive manufacturing equipment from BLT. Prior to printing the inlaid lattice specimens, the process parameters for AlSi10Mg lattice formation were investigated to determine the optimal printing parameters. Based on existing research on lattice printing parameters, some main parameters were selected for orthogonal tests to determine the optimal parameters for this printing. The specific parameters selected for this test are shown in Table 2. The lattice test specimens were fabricated as topologically optimized octahedral lattices, with dimensions of 12 × 12 × 21 mm, as shown in Figure 1a, b. The compression performance of the lattice structure was tested using a Bairoe microcomputer-controlled electronic universal testing machine (Fig. 1c). The microscopic defects of the test samples were observed using a scanning electron microscope (CIQTEK-SEM3100) (Fig. 1d). The MIPAR software was then used to measure the defect sizes in the SEM images and calculate the relative density of the corresponding parameter lattices. The forming quality (relative density) and mechanical properties of the lattice structures printed with different parameters are shown in Table 3 and Figure 2. A systematic analysis of how process parameters (such as laser power, scanning speed, and preheating) affect defect density is beyond the scope of this article, but some related studies can provide useful suggestions.30–32 Results show that at a laser power of 340 W, the scanning speed of 1200 mm/s, the scanning spacing is 0.17 mm, and the powder layer thickness is 0.03 mm, the formed lattice structure exhibits the highest relative density and optimal compressive stress performance under these process parameters. Therefore, these process parameters were selected for preparing the inlaid lattice structure.
Compression performance data of lattice test samples:
Chemical Composition of AlSi10Mg Aluminum Alloy Powder
SLM-450Q Fabricated AlSi10Mg Lattice Structure Parameters
Relative Density of As-built Samples Fabricated Under BLT-450Q Process Parameters
Inlaid lattice structure design
Lattice structures are composed of basic unit cells arranged periodically in three-dimensional space. 33 Traditional CAD systems have problems such as large data volume, easy errors in Boolean operations, and low efficiency in parameter adjustment when designing lattices. 34 To address this, this research uses nTopology software for strut-type lattice design. Its implicit function algorithm obviates the need to store geometric details,35,36 mitigating data inflation and enabling rapid generation of large-scale lattice structures. The software realizes gradient regulation of properties such as porosity and rod diameter through mathematical function linkage parameters, which improves design efficiency. 37
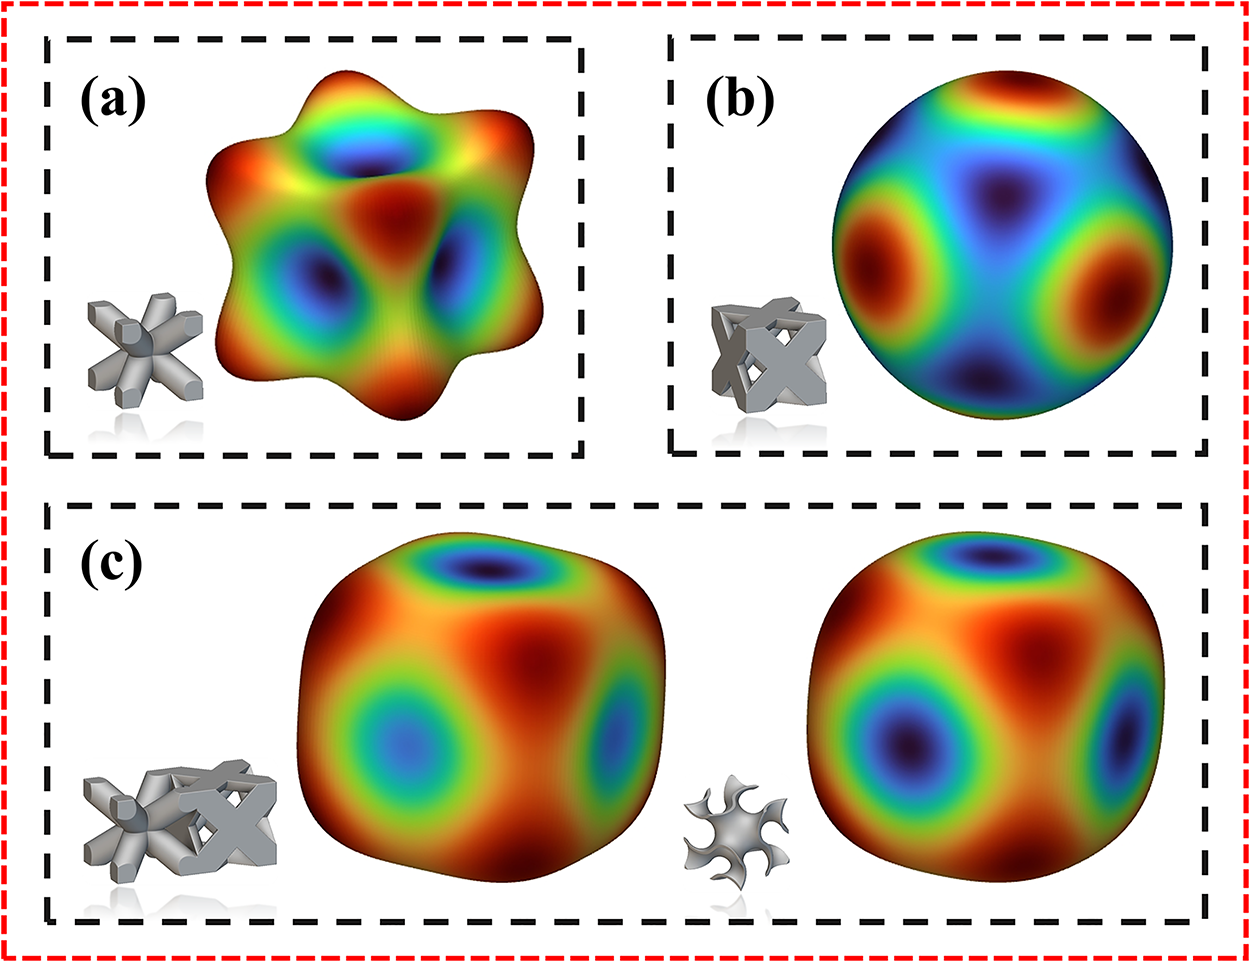
Figure 3 indicates that the Young’s modulus profile of the BF unit cell (combining BCC and FCC into a single unit cell) closely resembles that of the gyroid (TPMS) lattice, suggesting that the combined unit cell BF exhibits mechanical properties like those of the gyroid (TPMS) lattice during the elastic deformation stage. Based on this characteristic, this research combines BCC and FCC unit cells to design two types of inlaid lattice structures to investigate the influence of the structure composed of these two unit cells on the mechanical properties of the overall inlaid lattice. The design process is shown in Figure 4. The naming method for the inlaid lattices is the initial letter of the unit cell name forming the peripheral structure plus the initial letter of the internal unit cell name.
Young’s modulus diagram of lattice unit cells:
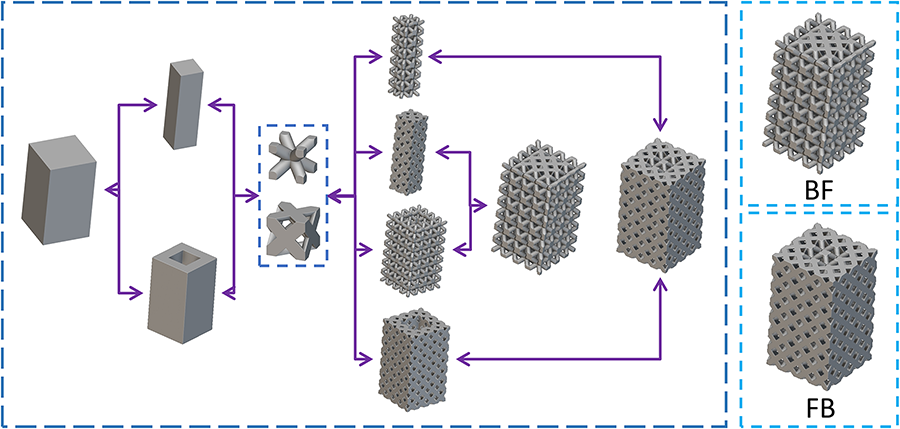
Tessellated lattice design flow diagram.
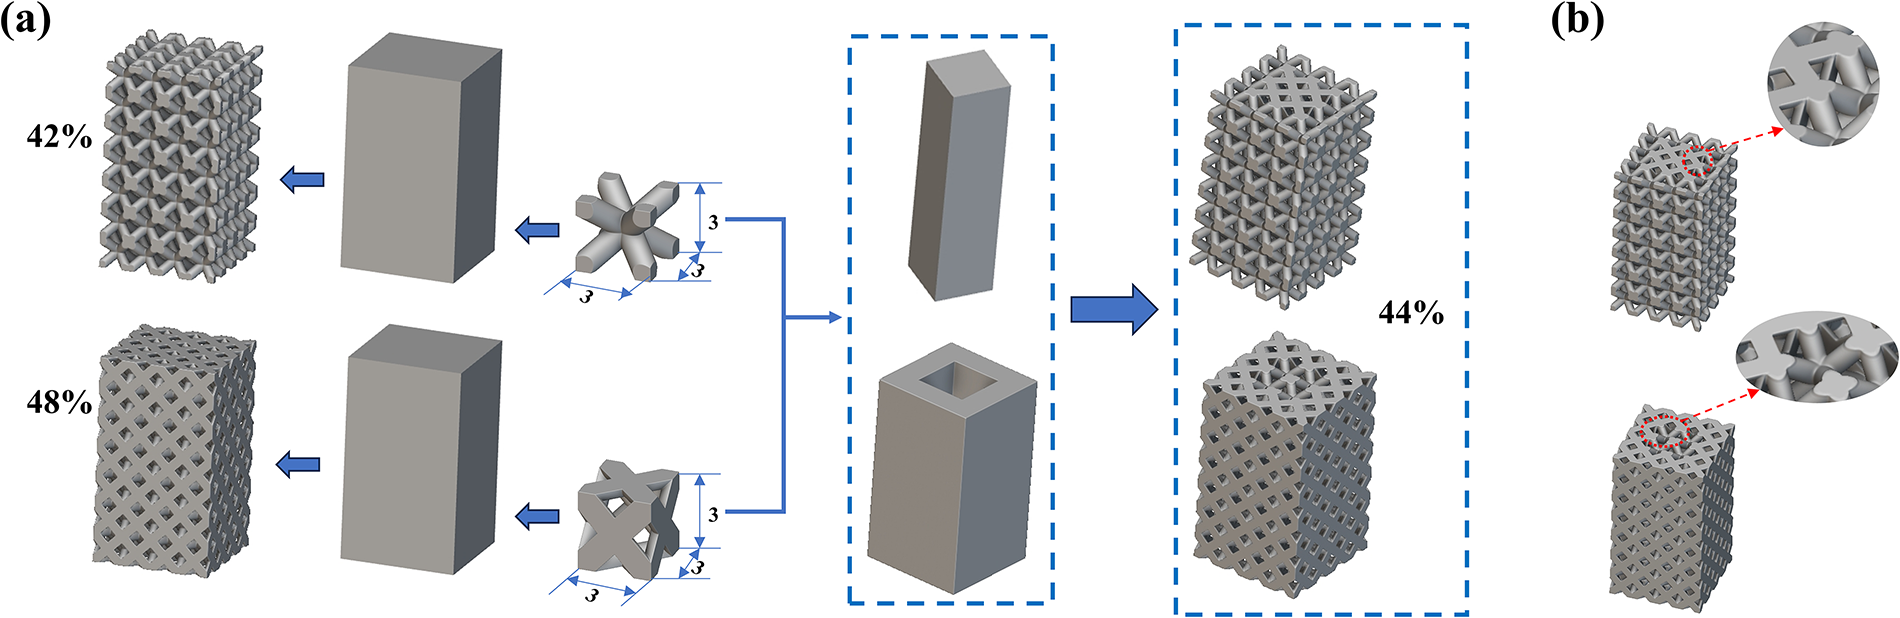
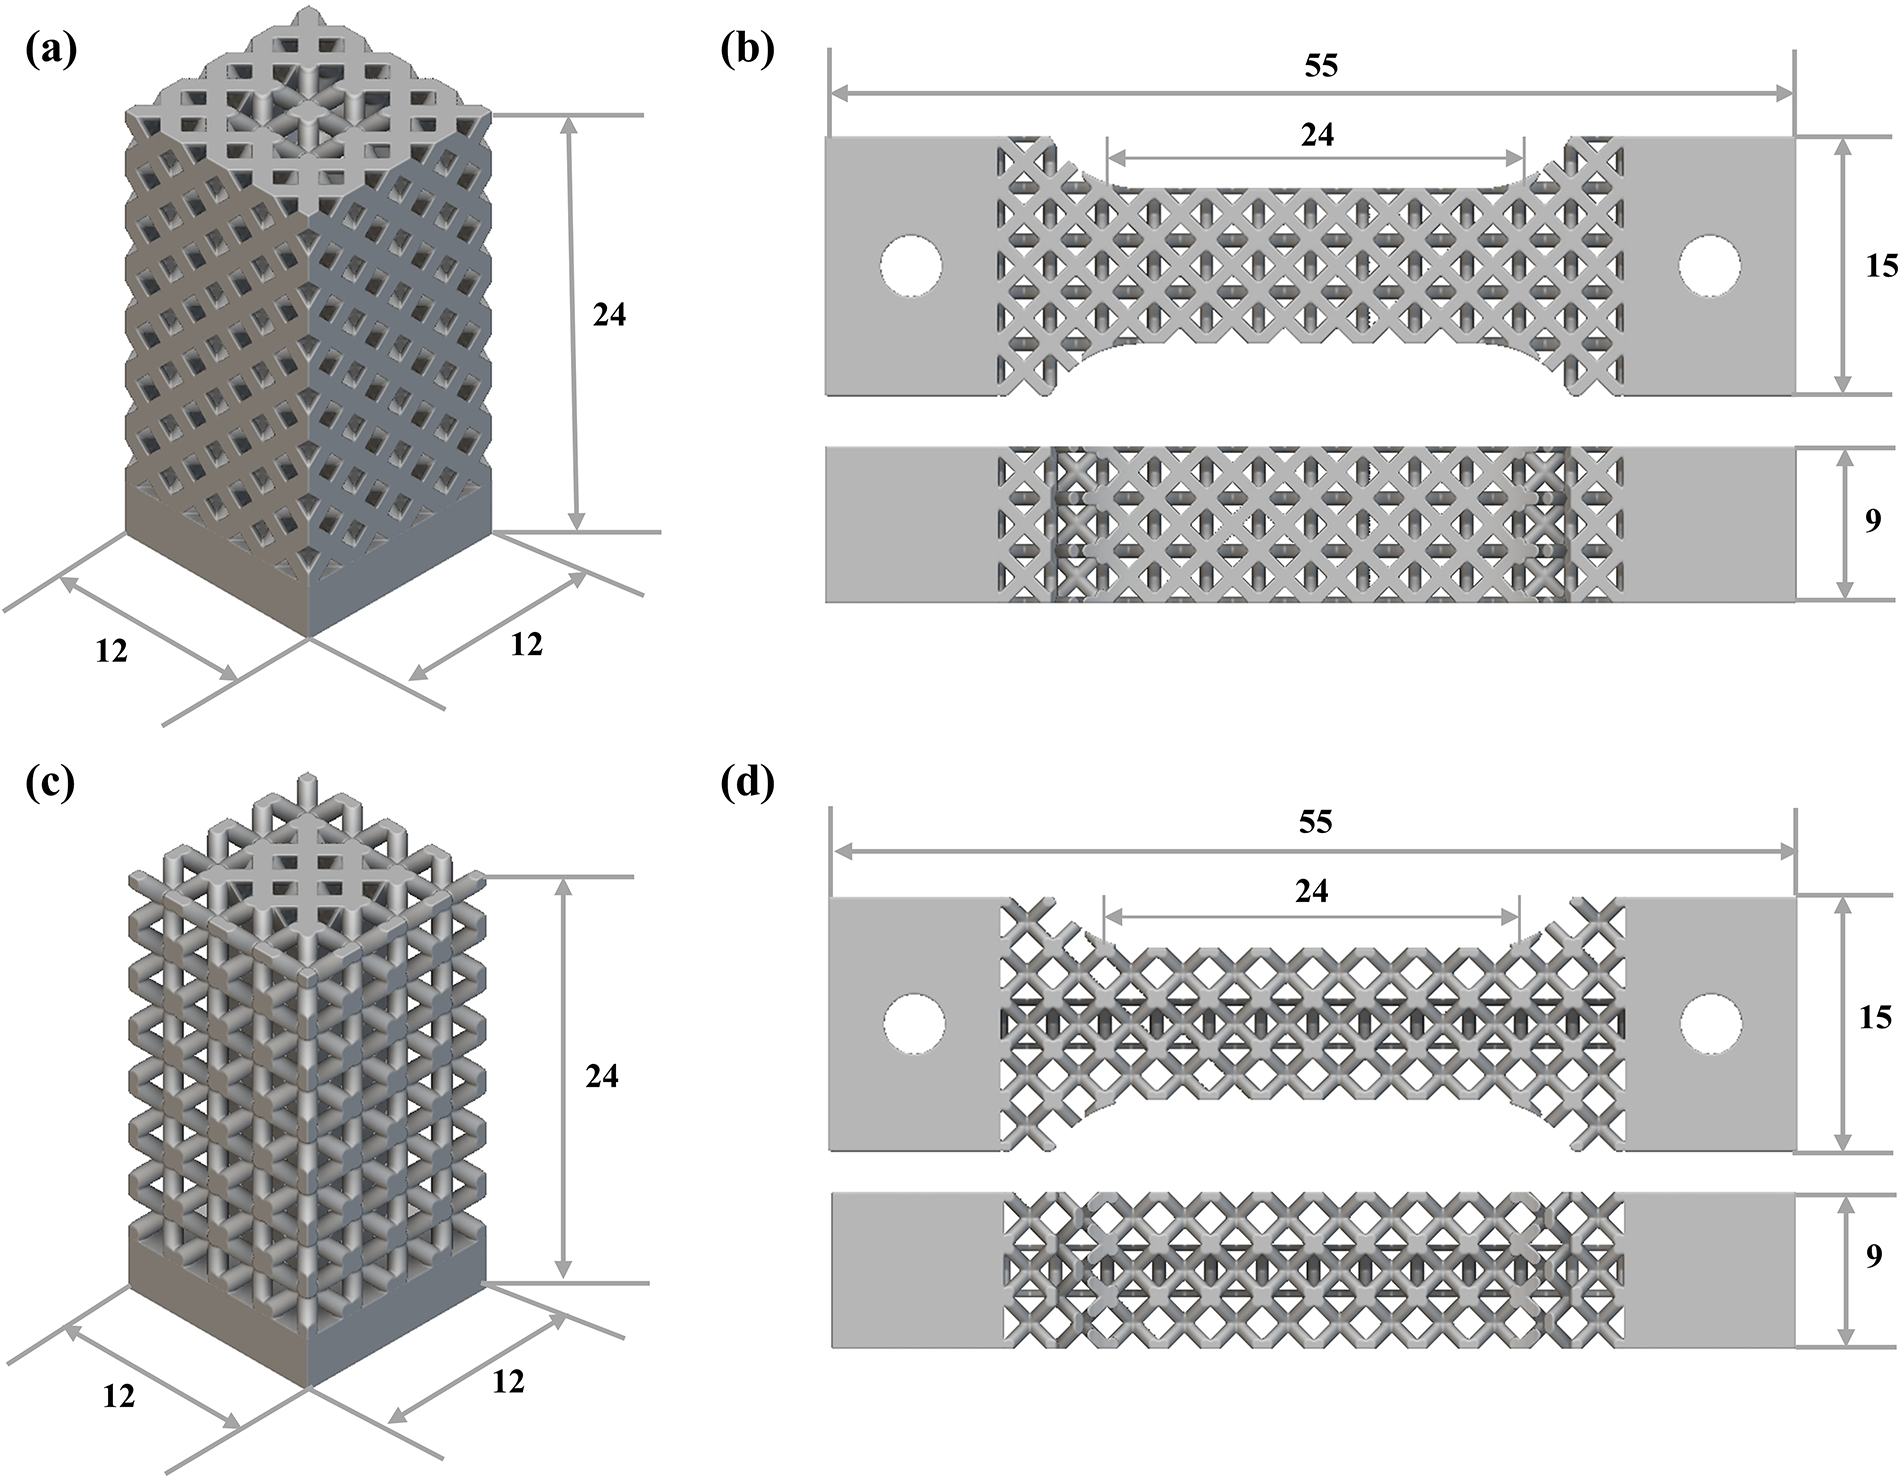
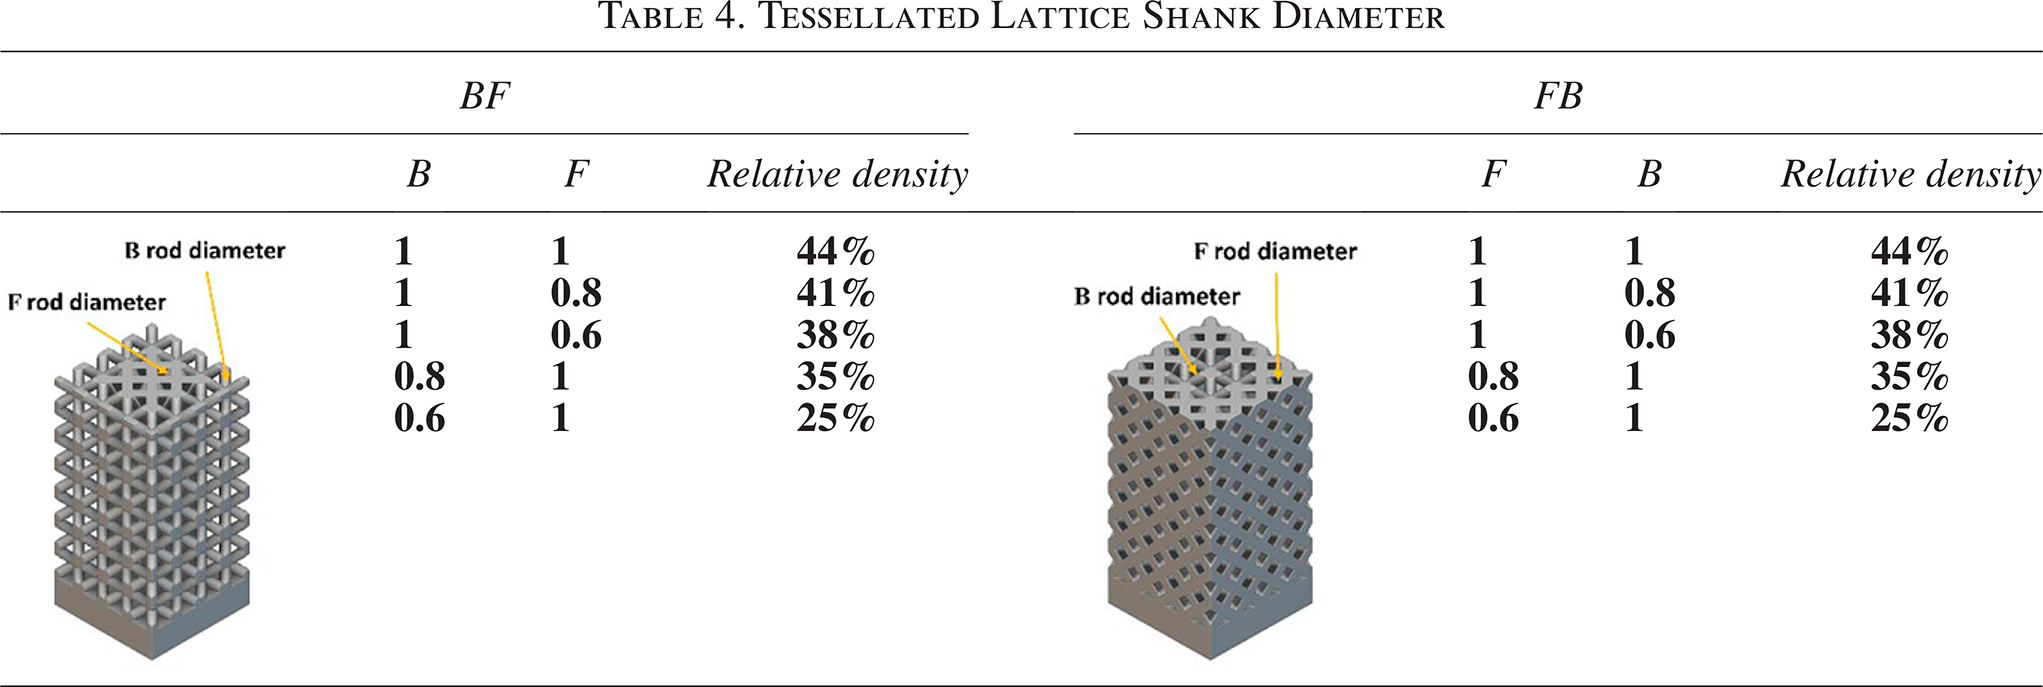
This research aims to explore the influence of different geometric configurations and relative densities of the two designed inlaid lattices on the mechanical properties of the overall lattice. To make the size of the experimental model appropriate, the size of the unit cell must be determined first. If the unit cell size is too small, it will impose high requirements on the precision of the printing equipment, and the forming quality may be poor. As reported in previous studies,35,36 the 3 mm × 3 mm × 3 mm lattice structure exhibits the highest relative density and superior performance.38,39 Therefore, the unit cell size of the inlaid lattice structure samples for compression and tension designed in this experiment is 3 mm × 3 mm × 3 mm. Figure 5 shows the influence of different geometric configurations on performance, which necessitates maintaining a consistent volume fraction. Since the volume fractions of uniformly filled BCC and FCC lattices in the same volume block are 42% and 48%, respectively, the design ensures that the volume fraction of the BCC–FCC inlaid structure is 44%. The endpoint positions of the BCC and FCC lattices coincide, so the endpoints can contact each other when combined. This design also ensures complete contact between BCC and FCC lattice nodes to avoid excessive stress concentration. After printing, the parts were cut from the substrate. To ensure the integrity of the inlaid lattice structure, a 3-mm-thick base was added under the model itself, preventing wire cutting from damaging the structure. The designed inlaid lattice structure model has dimensions of 12 mm × 12 mm × 21 mm, while the tensile inlaid lattice structure model measures 55 mm × 15 mm × 9 mm. The specific dimensions of the experimental models are shown in Figure 6. To investigate the influence of different relative densities of the inlaid lattice on mechanical properties, the strut diameters of the lattice were adjusted to achieve varying relative densities. Given the unique inlaid lattice structure designed herein, differential strut designs were employed for the constituent lattice types to comprehensively investigate the mechanical response under different relative densities by varying the strut diameter of a single component. The specific strut diameters and relative densities of the experimental specimens are shown in Table 4. The strut diameters of the tensile specimens correspond to those of the compression specimens. The compression displacement rate was controlled at 1 mm/min, and the test was conducted at room temperature. The dimensions of the samples conformed to the requirements of ASTM E9. Each specimen was subjected to compression and tension tests three times to confirm the accuracy and repeatability of the data.
Relative density and node contact:
Tessellated lattice experimental model:
Tessellated Lattice Shank Diameter
Results and Analysis
Forming accuracy evaluation of inlaid lattice structures prepared by SLM
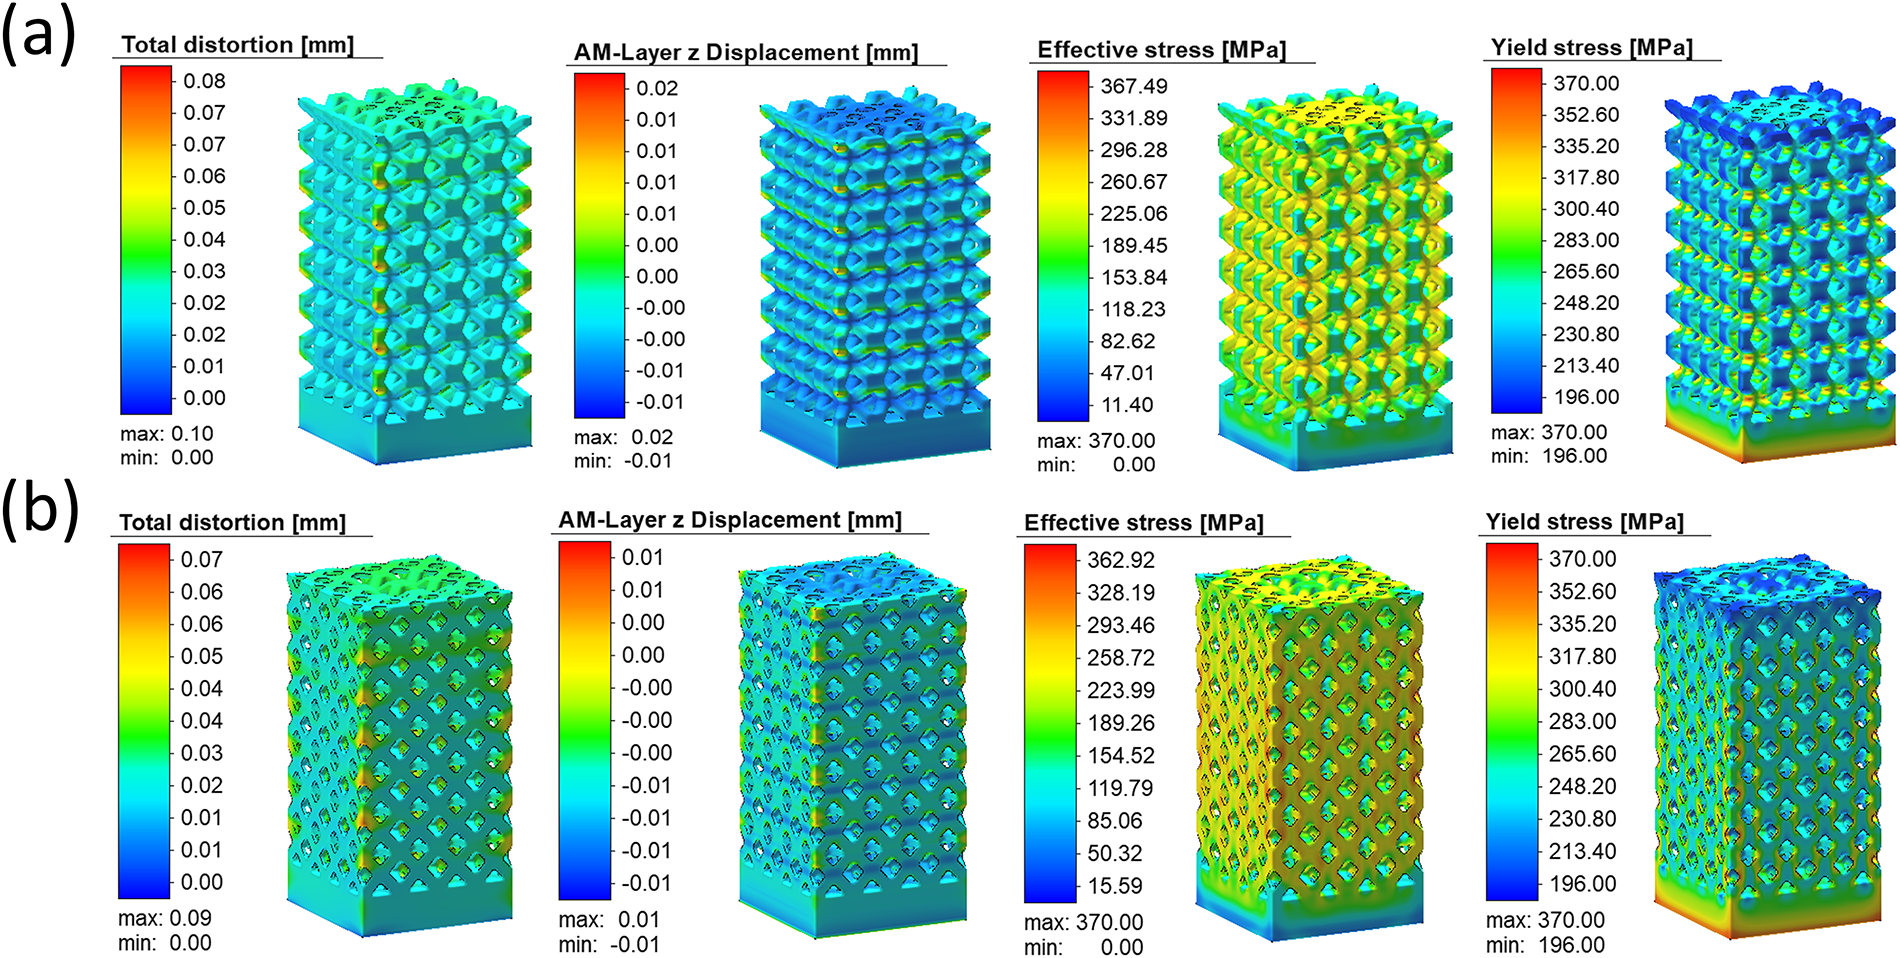
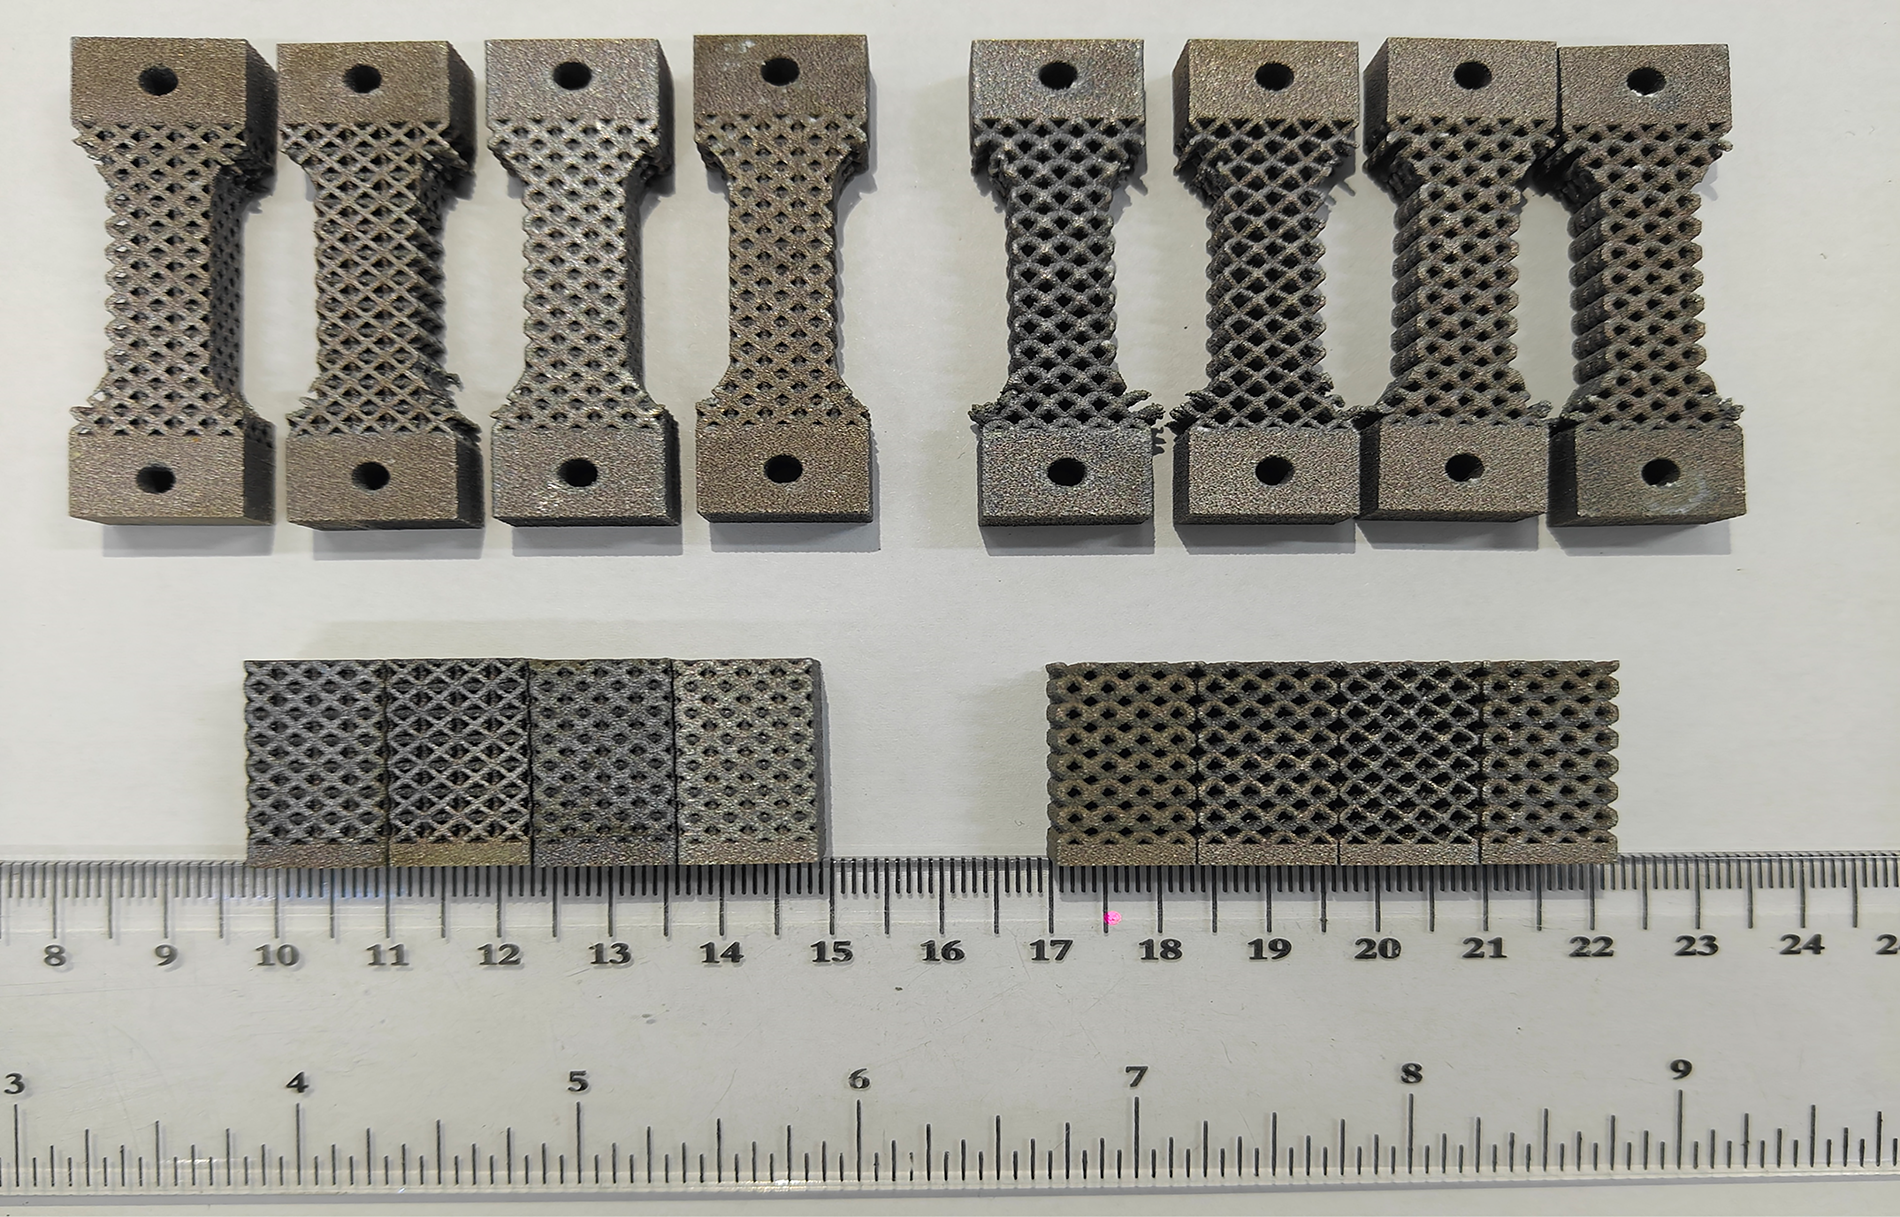
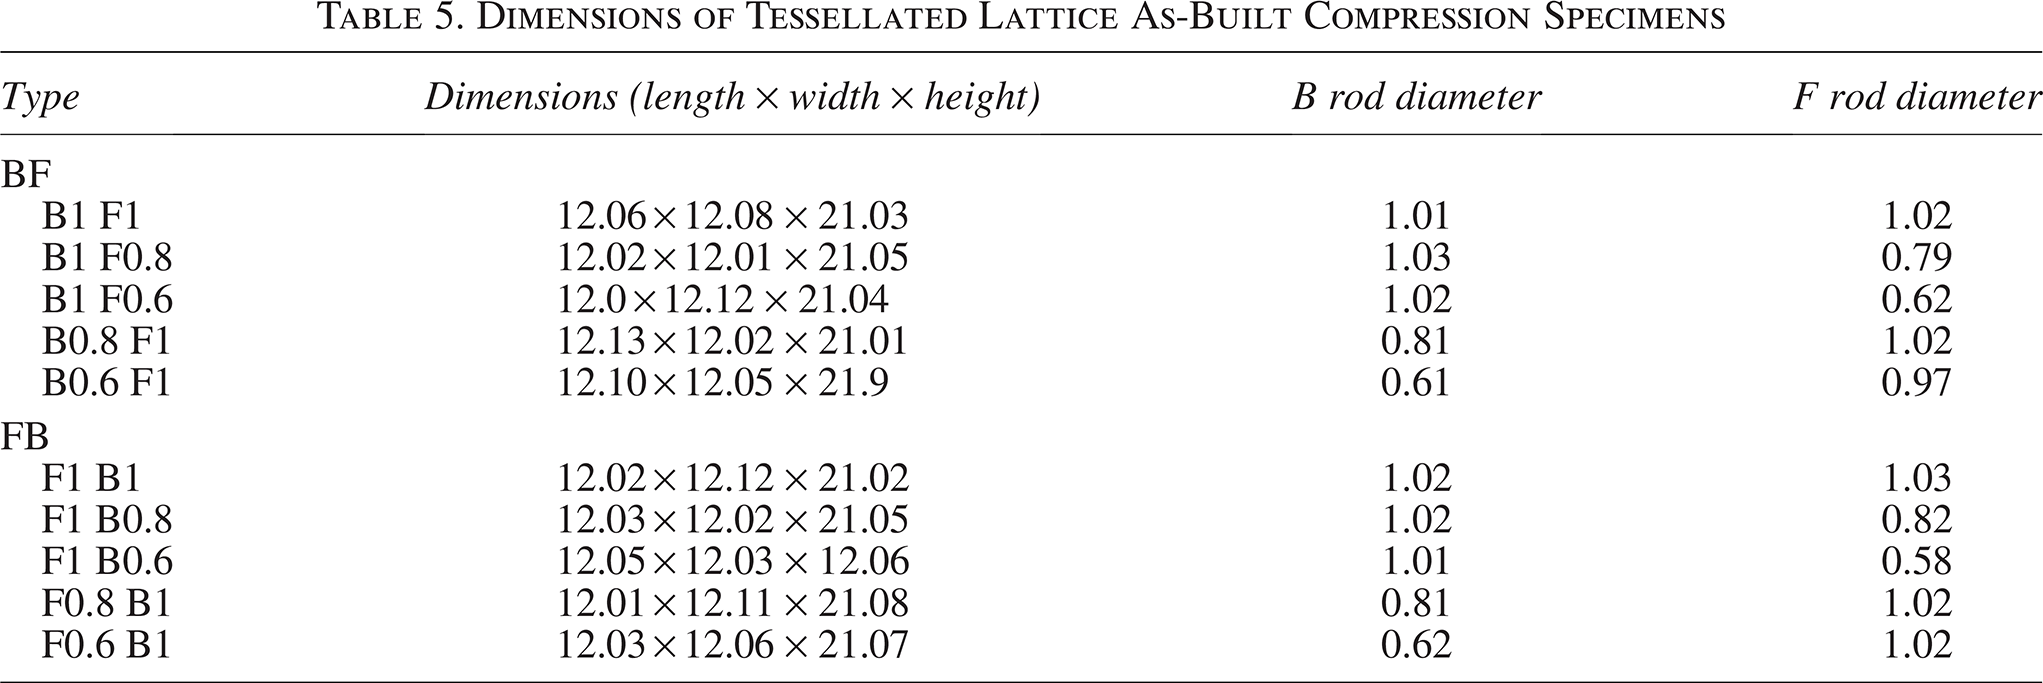
During the SLM process, the laser rapidly heats and melts the metal powder, causing a significant temperature difference near the molten pool. 40 Upon rapid cooling and solidification, uneven shrinkage and constraint from the surrounding material induce substantial residual stress within the part. These stresses can cause part deformation (warpage), delamination between layers (peeling), and even microcracks, ultimately leading to multi-scale damage from macro to micro levels in the part. Therefore, before printing the samples, the formability of the two types of inlaid lattice structures was verified by simulation using Simufact Additive software, as shown in Figure 7. The analysis results show that the equivalent stress of the two types of inlaid lattice structures presents a uniform distribution during the forming process, and both are 360 MPa. Relatively high deformations were observed at the unsupported strut positions of the four corners in both BF and FB structures. This is because the angle between the overhanging surface at these positions and the horizontal direction is <45°, leading to warpage deformation during printing. The results show that the maximum deformations of BF and FB structures are 0.08 mm and 0.07 mm, respectively, both within the controllable precision range of 0–0.3 mm. The images show that the overall deformation of both structures remains at approximately 0.04 mm, and the deformation in the Z-direction is small, maintaining a high degree of consistency with the Z-direction accuracy of the CAD model. The results also provide the critical stress (yield stress) at which deformation occurs during the printing process for both structures. Through simulation analysis of the equivalent stress, deformation, and Z-direction deformation of the two structures during forming, it can be concluded that the overall deformation of both structures is <0.3 mm. The deformation is within the error range, indicating good forming accuracy. Figure 8 shows the formed inlaid lattice specimens. Measurements indicate that the actual dimensions of the samples are larger than the theoretical model dimensions, but the forming error remains <2.5%. Measurement data are shown in Table 5, and the errors are consistent with the forming simulation results, demonstrating that the forming simulation has a certain reference value. The comparison results show that the inlaid lattice structures prepared by SLM have good forming accuracy and high quality.
Additive manufacturing simulation:
Tessellated lattice test specimen.
Dimensions of Tessellated Lattice As-Built Compression Specimens
Structural properties of inlaid lattices
The compression and tension tests on the specimens were carried out in accordance with the Metallic Materials—Compression Test at Room Temperature (GB/T 7314-2005) and Metallic Materials—Tensile Test at Room Temperature (GB/T 228.1-2010) standards. A force–displacement loading mode was adopted, with the displacement loading rate set at 1 mm/min. The finite element analysis module of nTopology software was used to perform compression numerical simulation on the inlaid lattice. In the stress analysis, displacement loading boundary conditions were set to analyze the stress–strain distribution under compression.
Stress–strain distribution under compressive load and the exhibited mechanical behavior
Figure 9 shows the von Mises stress and strain distributions of BF and FB structures with strut diameters of 0.6, 0.8, and 1 mm when the total deformation is 5%. It can be found that stress–strain distributions under different structural sizes are similar. For structures of varying sizes, the equivalent stress and strain levels are minimal at the edge struts of the BCC lattice, whereas the primary equivalent stress and strain concentrate on the struts of the FCC lattice. This is because the FCC lattice structure is more sensitive to compression in the Z-direction, which indirectly indicates that the ductility of the FCC lattice structure in the Z-direction is poorer than that of the BCC lattice structure during the compression process. For the BF and FB structures, the stress and strain at the edges of BCC struts are the lowest, and the stress from these edges is transmitted to the strut intersections. In the failed unit cells, some support struts exhibit strong stress concentration and large strain, such as the FCC struts in the BF and FB lattice structures. For the inlaid lattice, non-supporting struts do not contribute to structural stiffness, while supporting struts may lead to early fracture of the structure. However, for different structural sizes, the stress levels of the inlaid lattice structures are different. The stress level of the inlaid lattice structure with a size of 1 mm is relatively the highest, while that of the lattice structure with a size of 0.6 mm is relatively the lowest. As the size decreases from 1 mm to 0.6 mm, the stress level gradually decreases. Due to the reduction in structural stiffness, the maximum equivalent stress decreases with the decrease in structural size fraction.
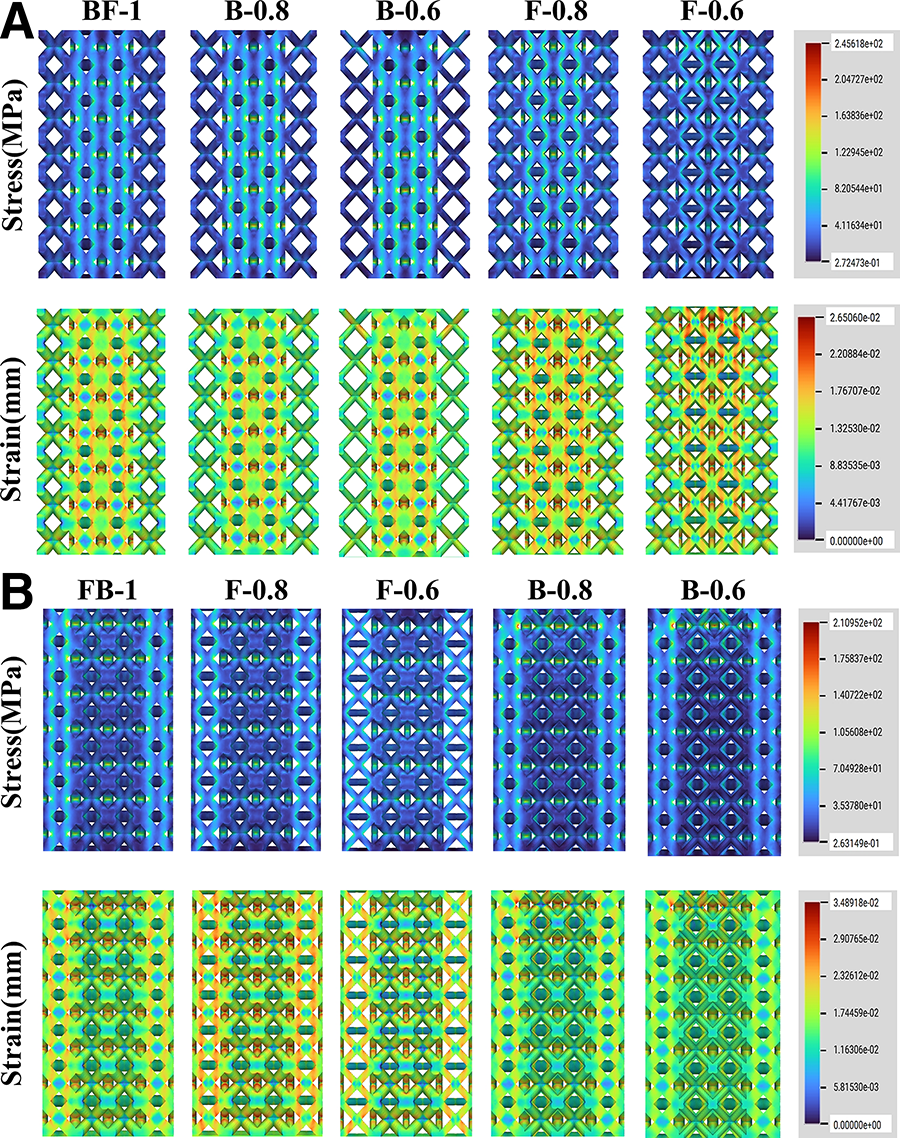
Equivalent stress and strain distributions of BF and FB structures with strut diameters of 0.6, 0.8, and 1 mm at 5% strain.
Figure 10a shows a simplified force diagram of the BCC unit structure under uniaxial loading in the Z–X plane shear lattice. The image indicates that the BCC lattice exhibits approximate rhombic shearing in the Z–X plane, with two node constraints. The struts undergo in-plane bending under the load PZ and the node constraint load PXY. Figure 10b illustrates the Y–X plane shear of the FCC unit structure under loading, featuring three node constraints. The FCC has one more node constraint than the BCC, thus endowing the FCC struts with higher shear load resistance. Figure 10c presents the plane shear diagram of the combined BF unit structure under load. It exhibits in-plane sharing similar to that of the BCC unit structure in the Z–X plane, but the BF unit exhibits three node constraints in the Z–X plane. Therefore, the struts of the BF unit demonstrate stronger load shear resistance than those of the BCC in the Z–X plane. Meanwhile, in the Y–X plane shear corresponding to the BF unit and the FCC unit, the BF unit has one additional node constraint compared with the FCC unit. To sum up, the number of node constraints of the BF unit increases in both the Z–X plane and the Y–X plane. Therefore, the load resistance of the BF unit struts is stronger than that of the BCC and FCC units.
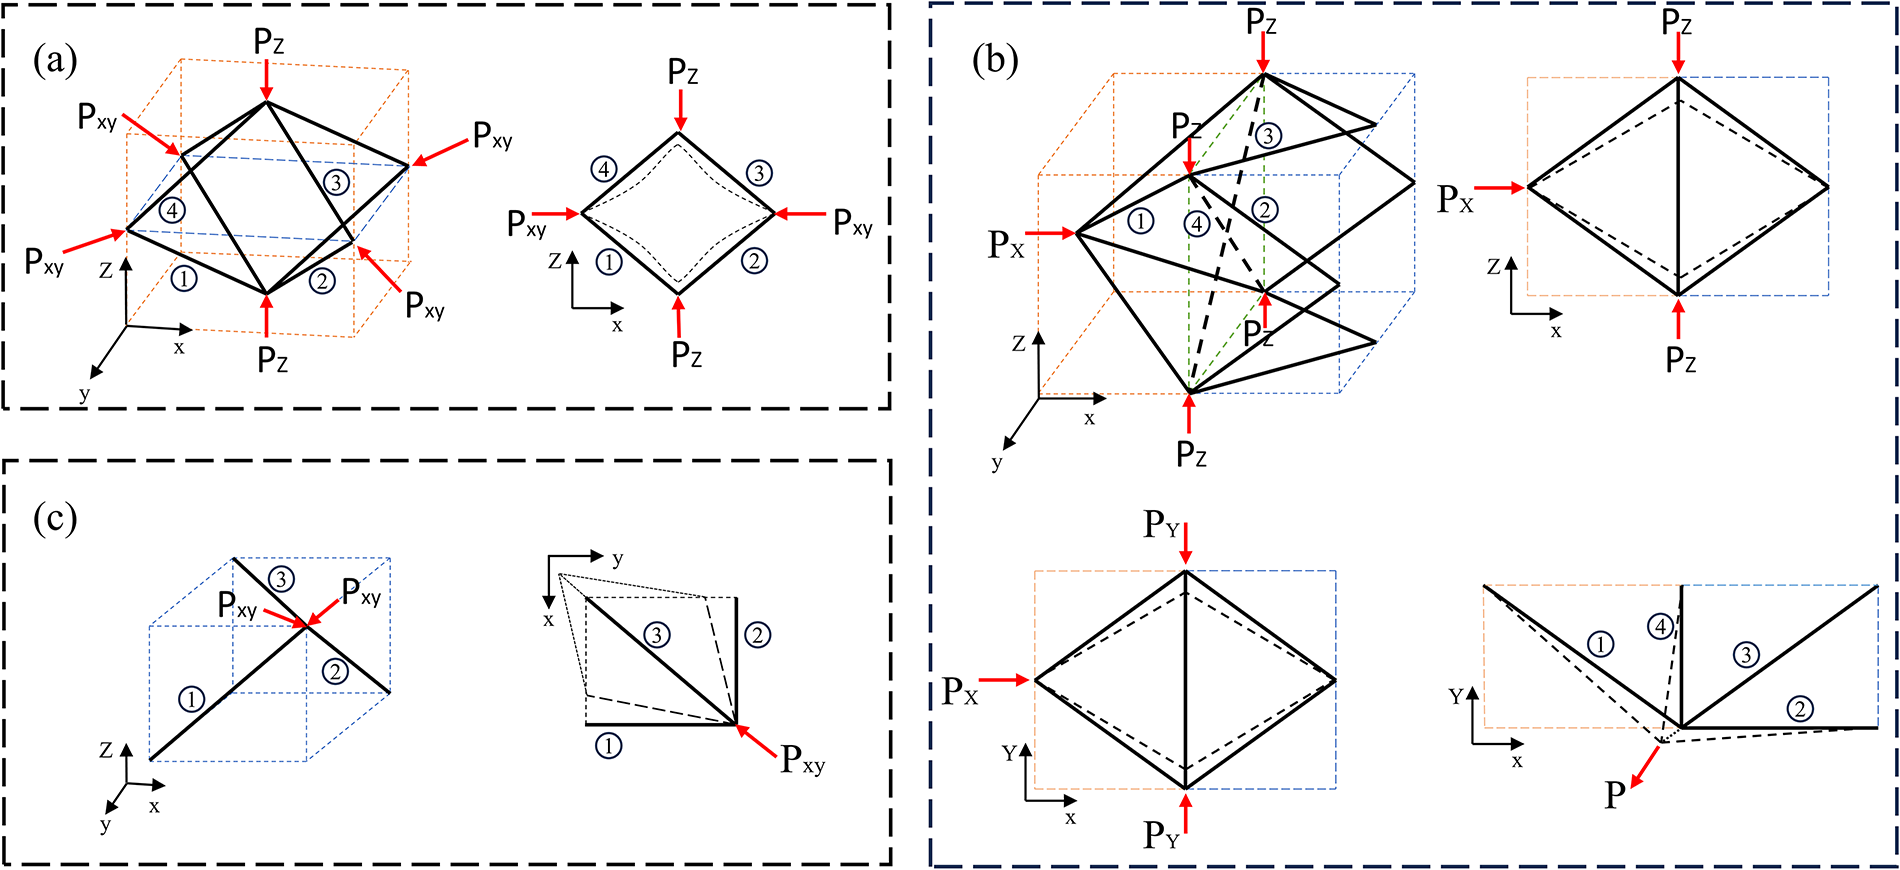
Schematic diagrams of uniaxial compressive load and planar shear lattice forces:
Compressive fracture modes and stress–strain curves
According to the von Mises yield criterion, when the equivalent stress reaches the critical value, materials undergo plastic strain. For the inlaid lattice structure, the equivalent stress and strain levels at the center of the diagonal struts are the highest, showing mixed bending-tensile deformation, indicating that crack initiation preferentially occurs at the center of the diagonal struts. In the response curves of all samples, exhibited nonlinear failure characteristics, manifesting as multiple stress peaks related to the number of layers. These curves reveal the differences in strength and stiffness among different structures and their corresponding failure mechanisms.
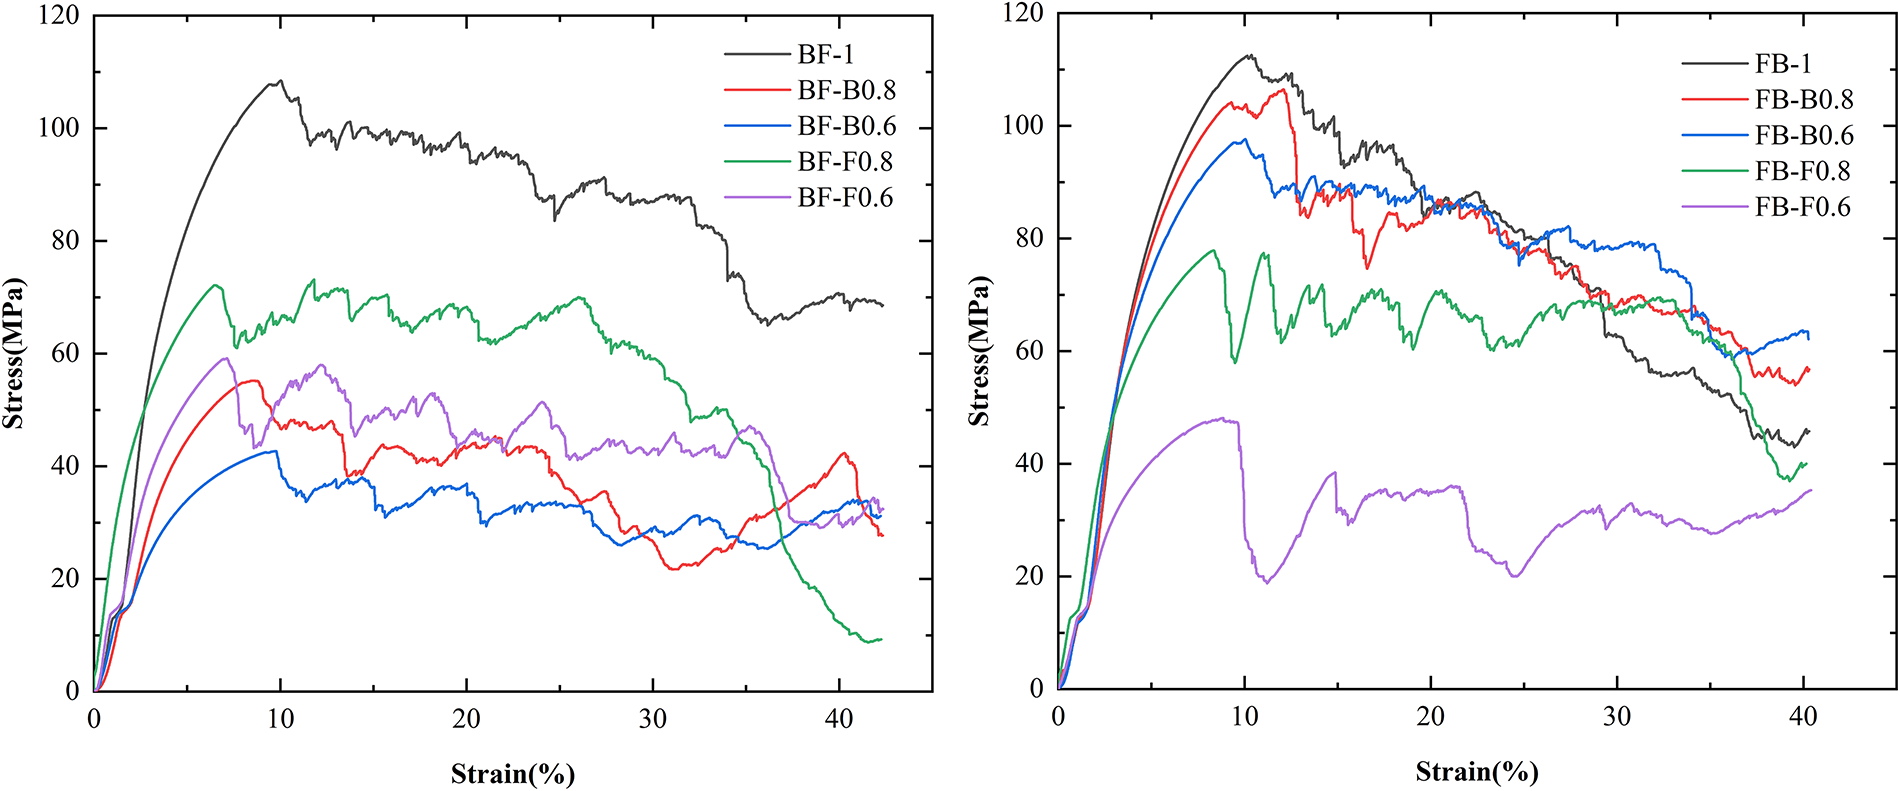
To visually compare the fracture modes of inlaid lattice structures under different relative densities during compression, the BF and FB lattice structures with the highest and lowest relative densities were selected. Uniaxial compression tests were video recorded for inlaid lattice specimens to demonstrate the deformation behaviors of different inlaid structures and to capture fracture patterns, as shown in Figure 11. The stress–strain curves are shown in Figure 12. Experimental results indicate that all inlaid lattices exhibit nonlinear stage, linear elastic stage, yield stage, and failure stage. Combined with the stress–strain curves and Figure 11, small compressive displacements induce overall uniform elastoplastic deformation that occurs before fracture, and the deformation mode is dominated by bending. The first fracture of the FB-1 structure occurs in the topmost unit cell structure, at the top unit cell’s diagonal cross-strut, and the crack emerges along a certain diagonal angle. When compressed to 15%, a second crack appeared in the FB-1 structure, and the fracture mode approached a 45° diagonal angle. The first fracture of the F-0.6 structure was more obvious along a 45° diagonal angle. As the compression process proceeded, the bottommost unit cells of the structure began to fracture and with cracks propagating upward. The fracture behavior of the BF-1 structure is like that of the FB-1 structure, except that the BF-1 structure exhibits a collapse phenomenon after the first fracture. During the compression of the B-0.6 structure, due to the smaller strut diameter and lower yield strength of the external B structure, smaller-diameter outer B-struts fractured first due to severe bending deformation when compressed by 15%. After continuing compression densified the upper unit cell structure, cracks approaching a 45° angle emerged in the lower layer. In summary, the fracture modes of BF and FB lattice structures transitioned from layer-by-layer to solid-block failure, both exhibiting 45° diagonal fracture behavior.
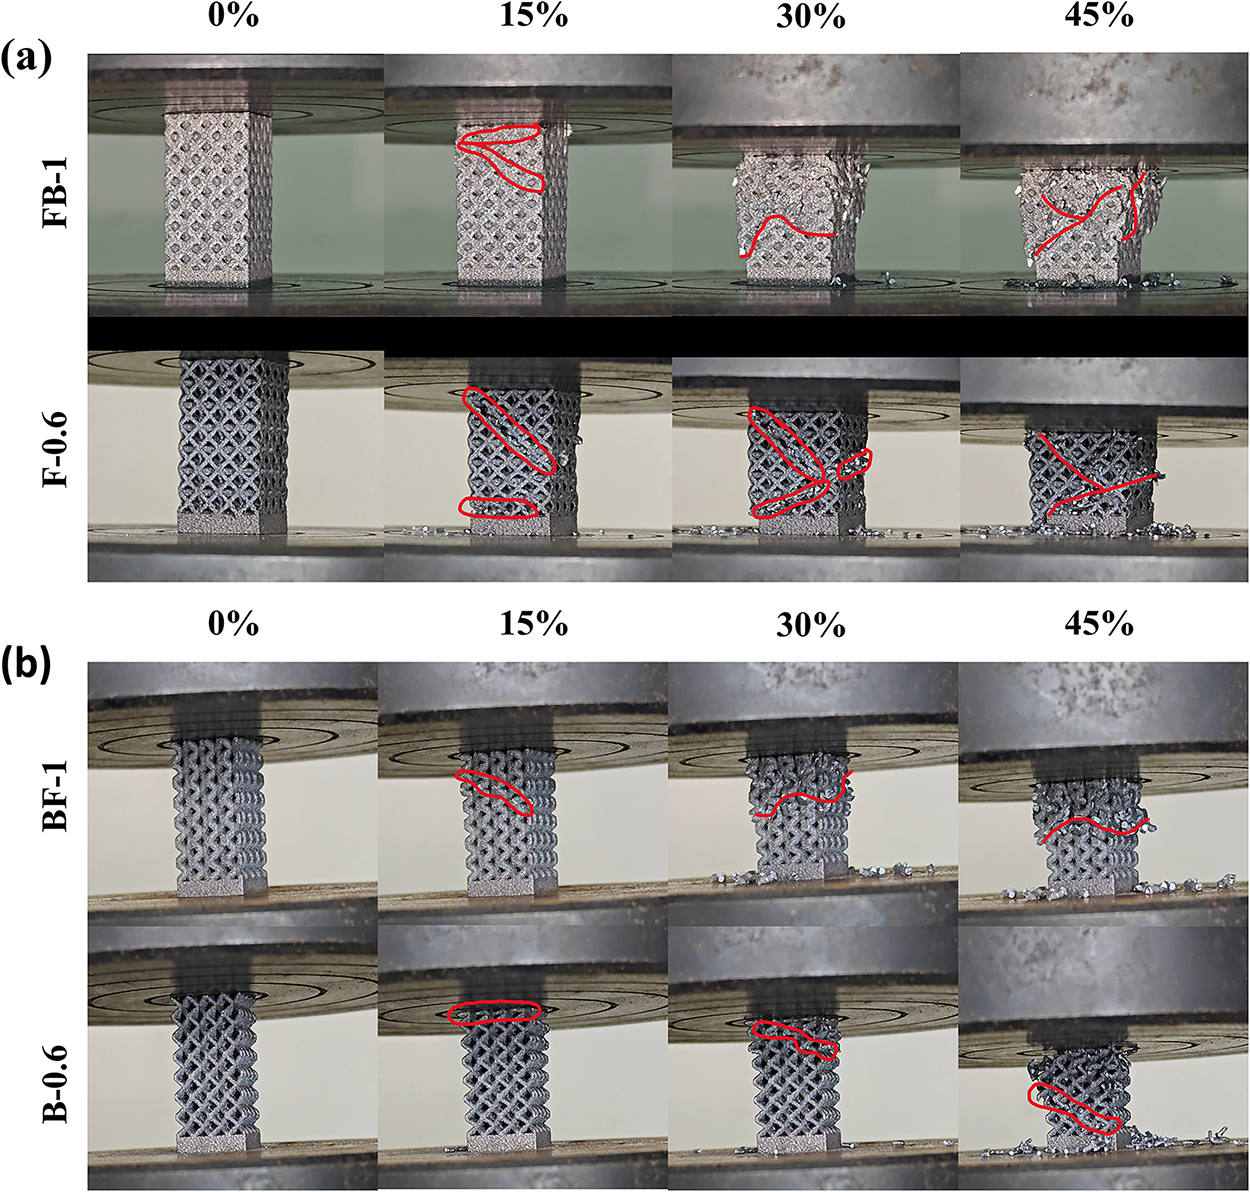
Fracture and collapse of tessellated lattice structures.
Tessellated lattice structures of compressive stress–strain curve.
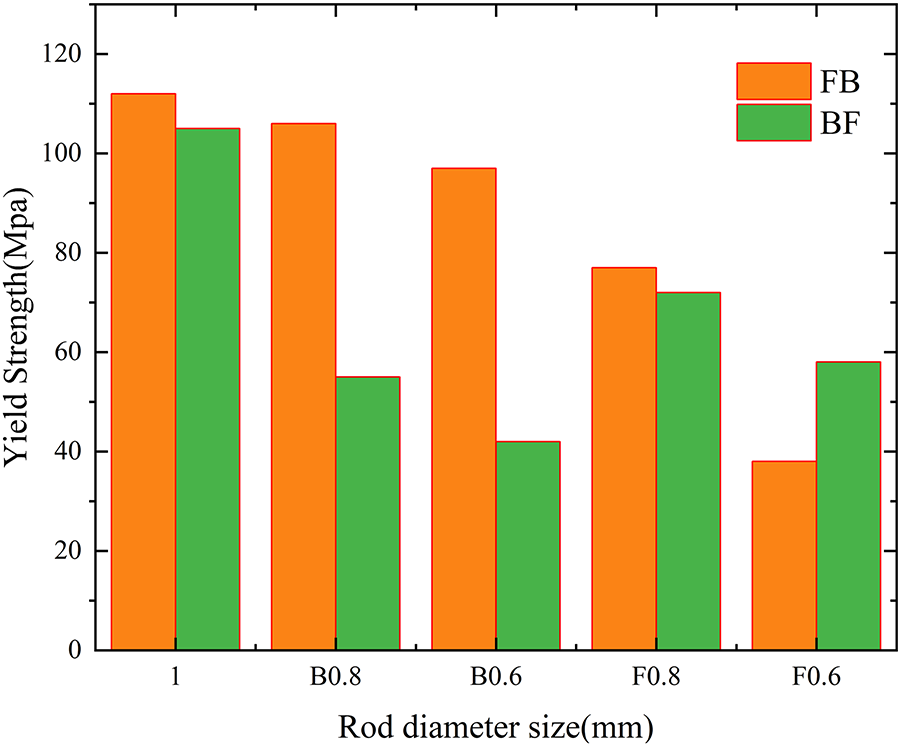
The stress–strain curves show that the yield strength of the BF lattice structure is 105 MPa and that of the FB lattice structure is 112 MPa when the strut diameter is 1 mm. By converting the data in reference, 41 the yield strength of the prepared uniform BCC structure is 84.8 MPa and that of the uniform FCC structure is 174 MPa, confirming FCC’s superior strength than that of the BCC structure when the overall structure size and strut diameter are the same. When compared with the yield strengths of the inlaid lattice BF and FB structures prepared in this research, the yield strength of the inlaid lattice structure is improved compared with that of the uniform BCC lattice structure, and FB exhibits greater enhancement than that of the BF structure. According to the stress–strain curves of FB and BF structures, B-strut diameters of 0.8 mm and 0.6 mm, the yield strengths are 106 MPa and 97 MPa, respectively; when the size of the F structure is changed to 0.8 mm and 0.6 mm, the yield strengths are 77 MPa and 38 MPa, respectively. When the size of the F structure in the BF structure is changed to 0.8 mm and 0.6 mm, the yield strengths are 72 MPa and 58 MPa, respectively; when the size of the B structure is changed to 0.8 mm and 0.6 mm, the yield strengths are 55 MPa and 42 MPa, respectively. The yield strengths of the BF and FB structures are shown in Figure 13. The results show that the FB structure can maintain a high stress level while reducing the strut diameter of the B structure, while F-strut reduction decreased stress levels sharply when the strut diameter is too small. The results show that for the BF structure, it decreased significantly with increasing stress level. However, reducing the strut diameter of the F structure results in a relatively higher stress level compared with reducing that of the B structure. In summary, the FCC lattice structure determines the stress level in the BF and FB inlaid lattice structures.
Tessellated lattice structures of yield strength.
Tensile mechanical properties
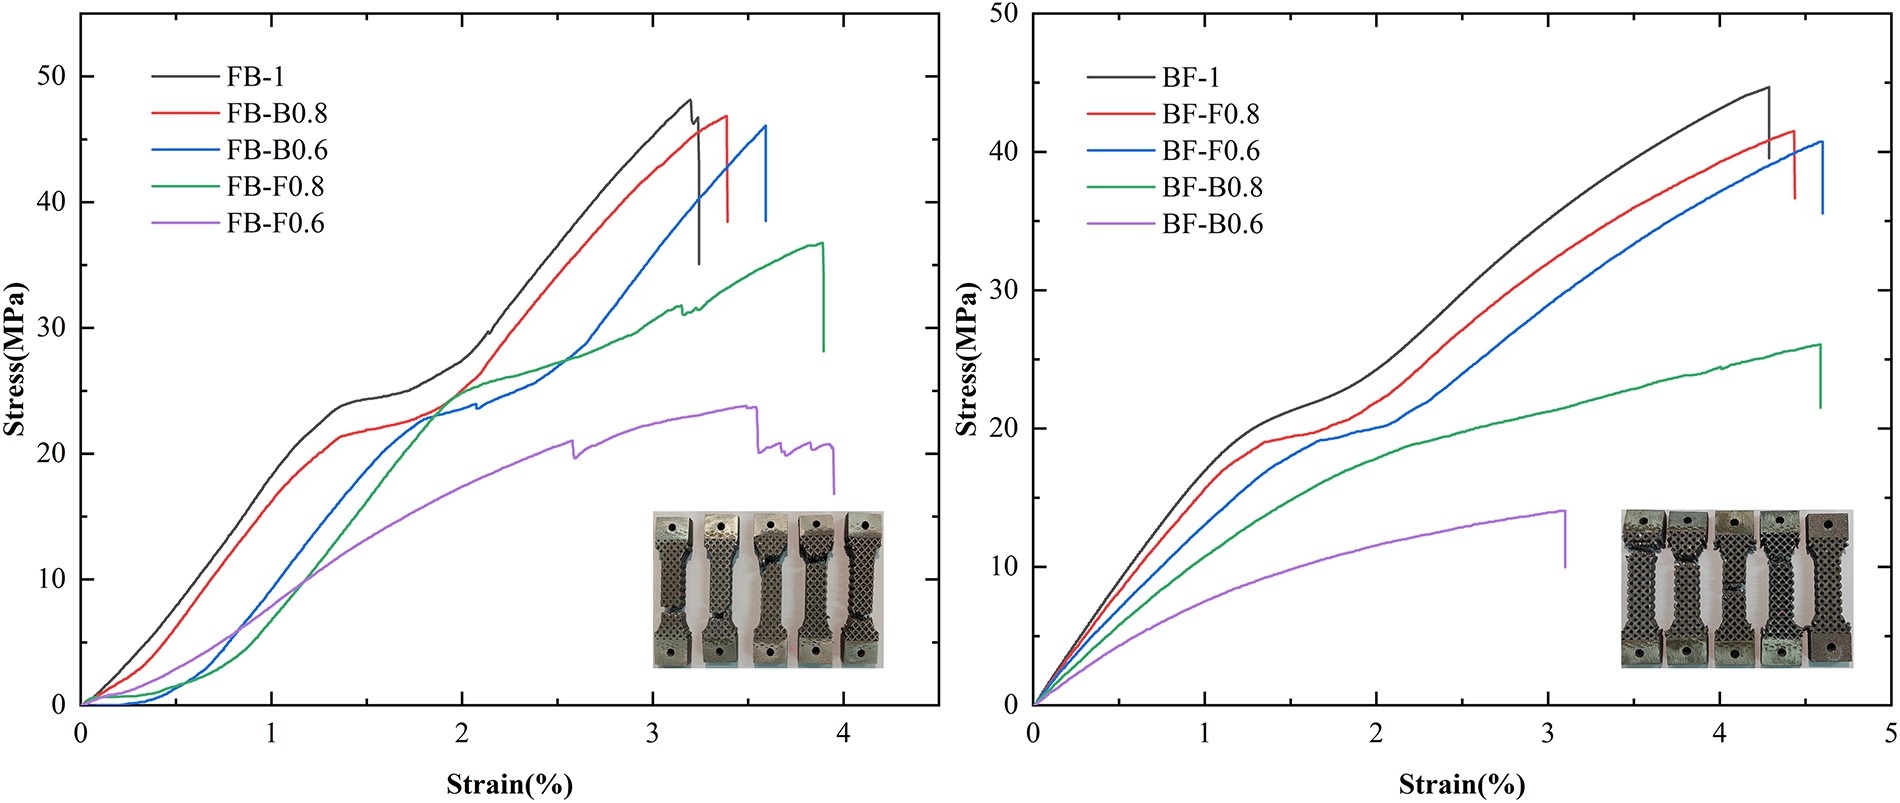
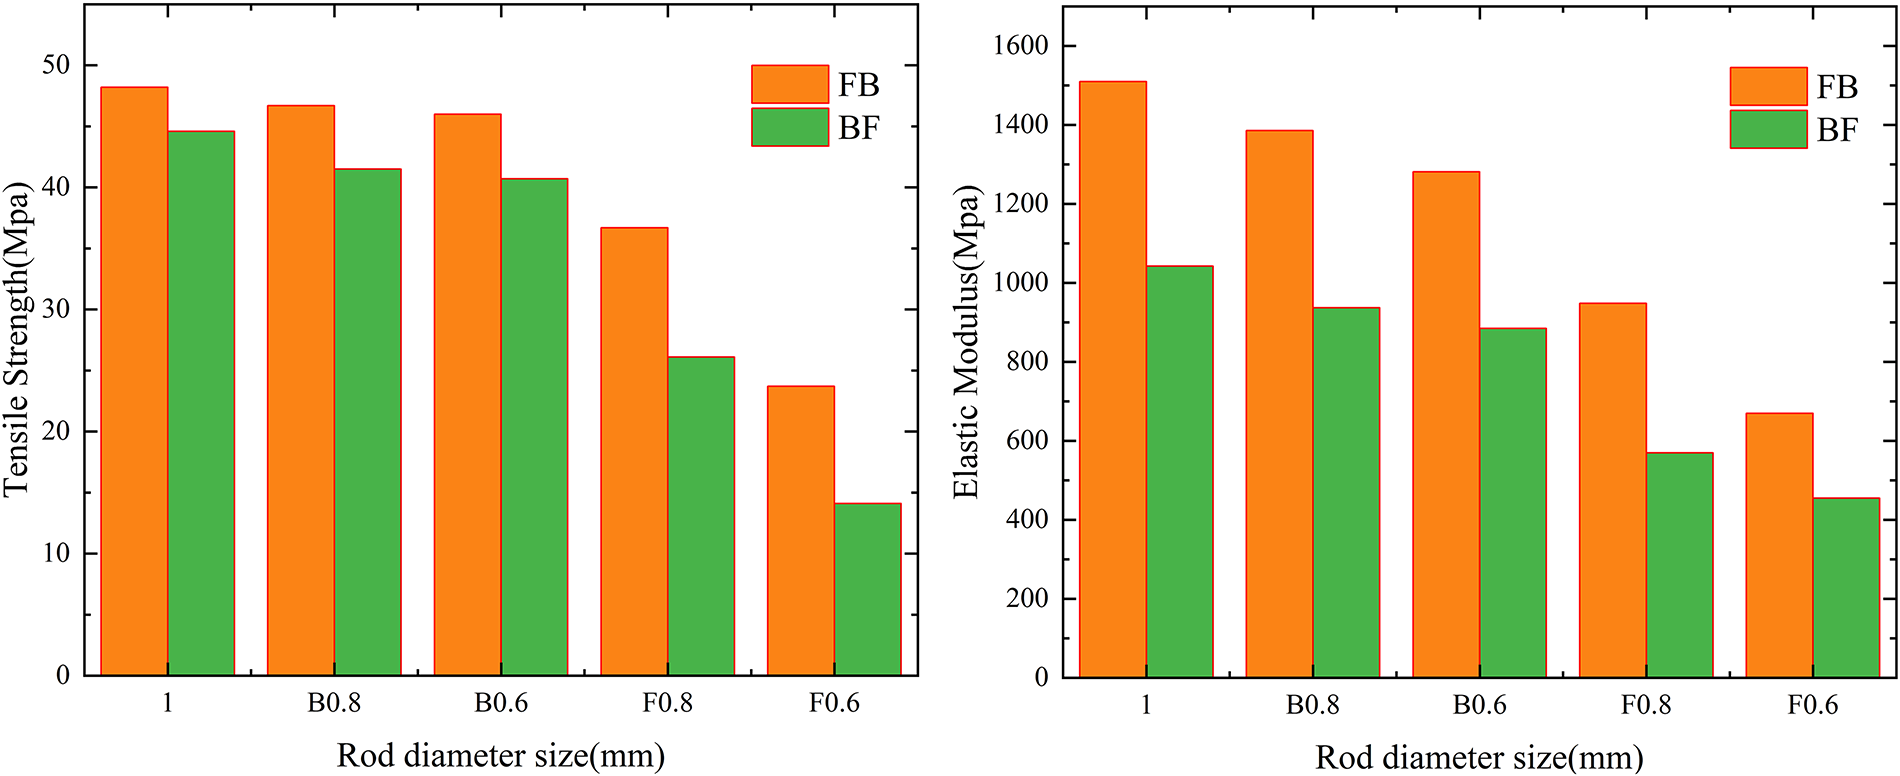
Quasi-static tensile tests were conducted on the inlaid lattice structures BF and FB, and the obtained stress–strain curves are shown in Figure 14. The curves show that when the size of the B structure in the FB structure is changed from 0.8 to 0.6, the stress–strain growth trends are similar, characterized by a stable stress increase at small strains and a rapid stress rise at high strains. This indicates that early deformability with later-stage strain hardening in the later stage. Although the overall tensile strength of the structure gradually decreases, the elongation of the structure is increased. When the size of the F structure is changed from 0.8 to 0.6, at 0.8, the stress growth at small strains is stable and follows a trend like the above, but the stress rise amplitude decreases at 3 − 4% strain, showing stable low-strain behavior. At 0.6, the overall stress growth is slow, and stress fluctuations occur, indicating that instability from individual strut fractures, which is caused by the fracture of individual unit cell struts within the structure during deformation. For the size changes of the BF structure, image analysis shows that the stress–strain trends of the BF and FB structures after each size change are consistent. The tensile strengths and elastic moduli of FB and BF structures are shown in Figure 15. The data indicate that the overall tensile strength of FB structures with various sizes is higher than that of BF structures with corresponding sizes, but with lower plasticity than that of BF structures.
Tensile stress–strain curve of the FB and BF tessellated lattice structures.
Tensile strength of FB and BF structures; elastic modulus.
Fracture morphology of compression and tension
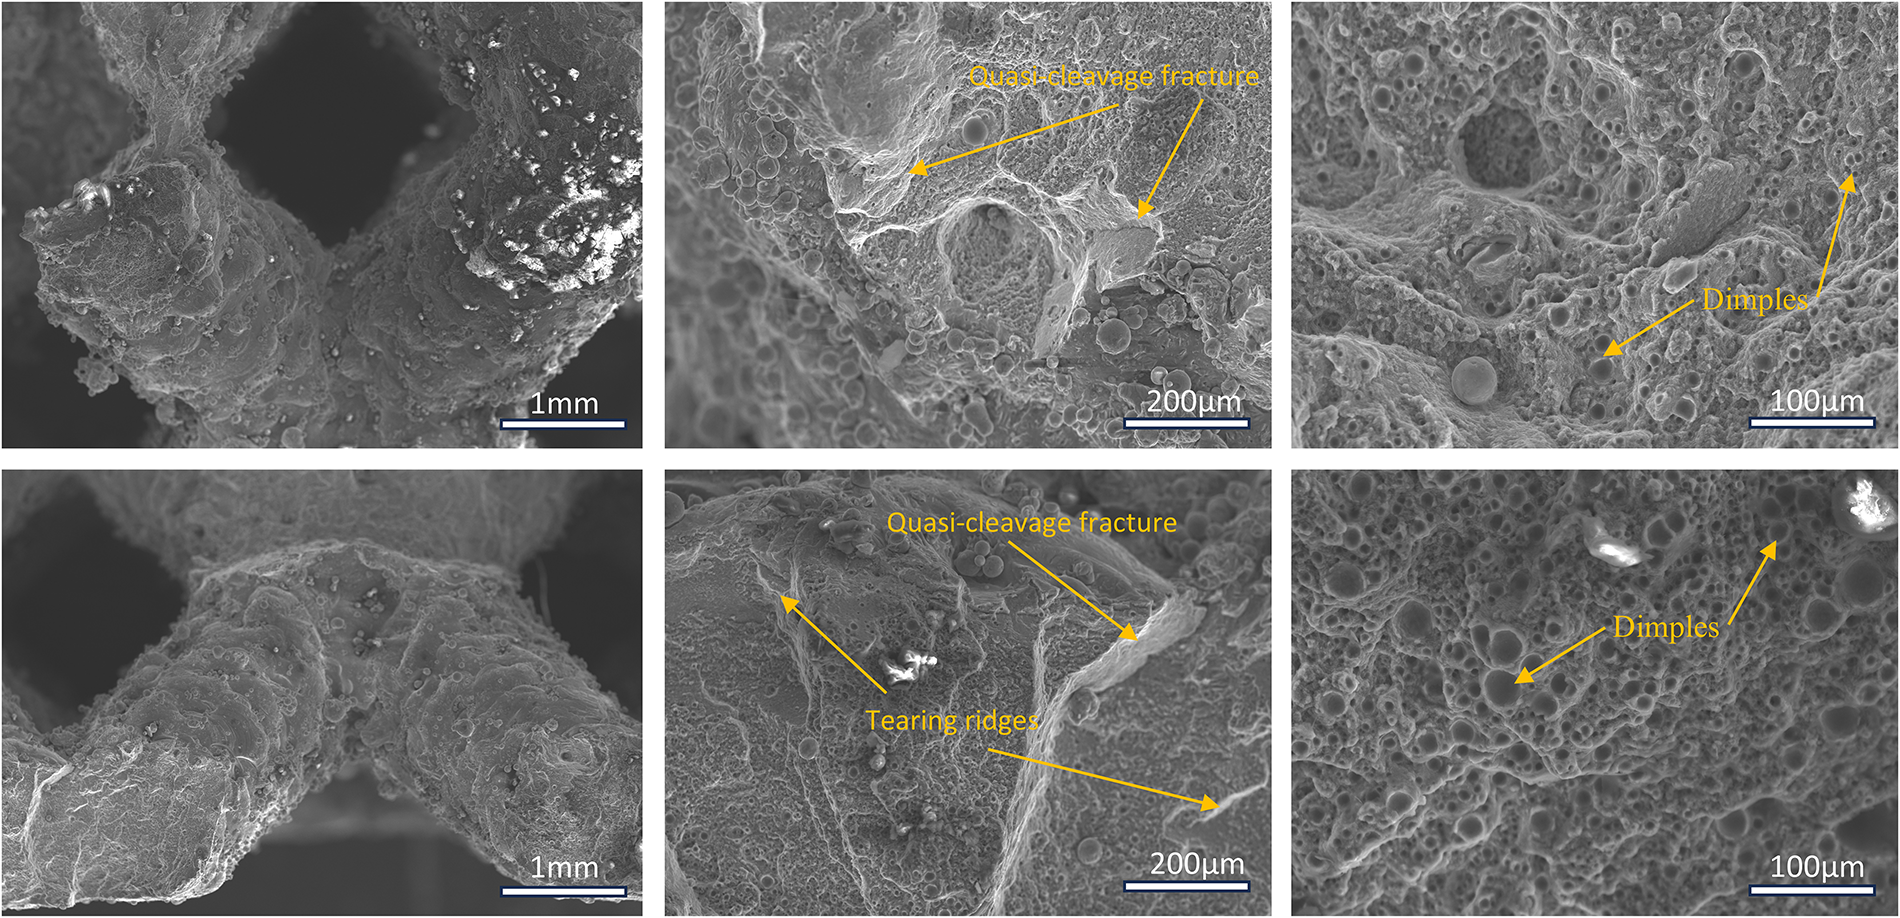
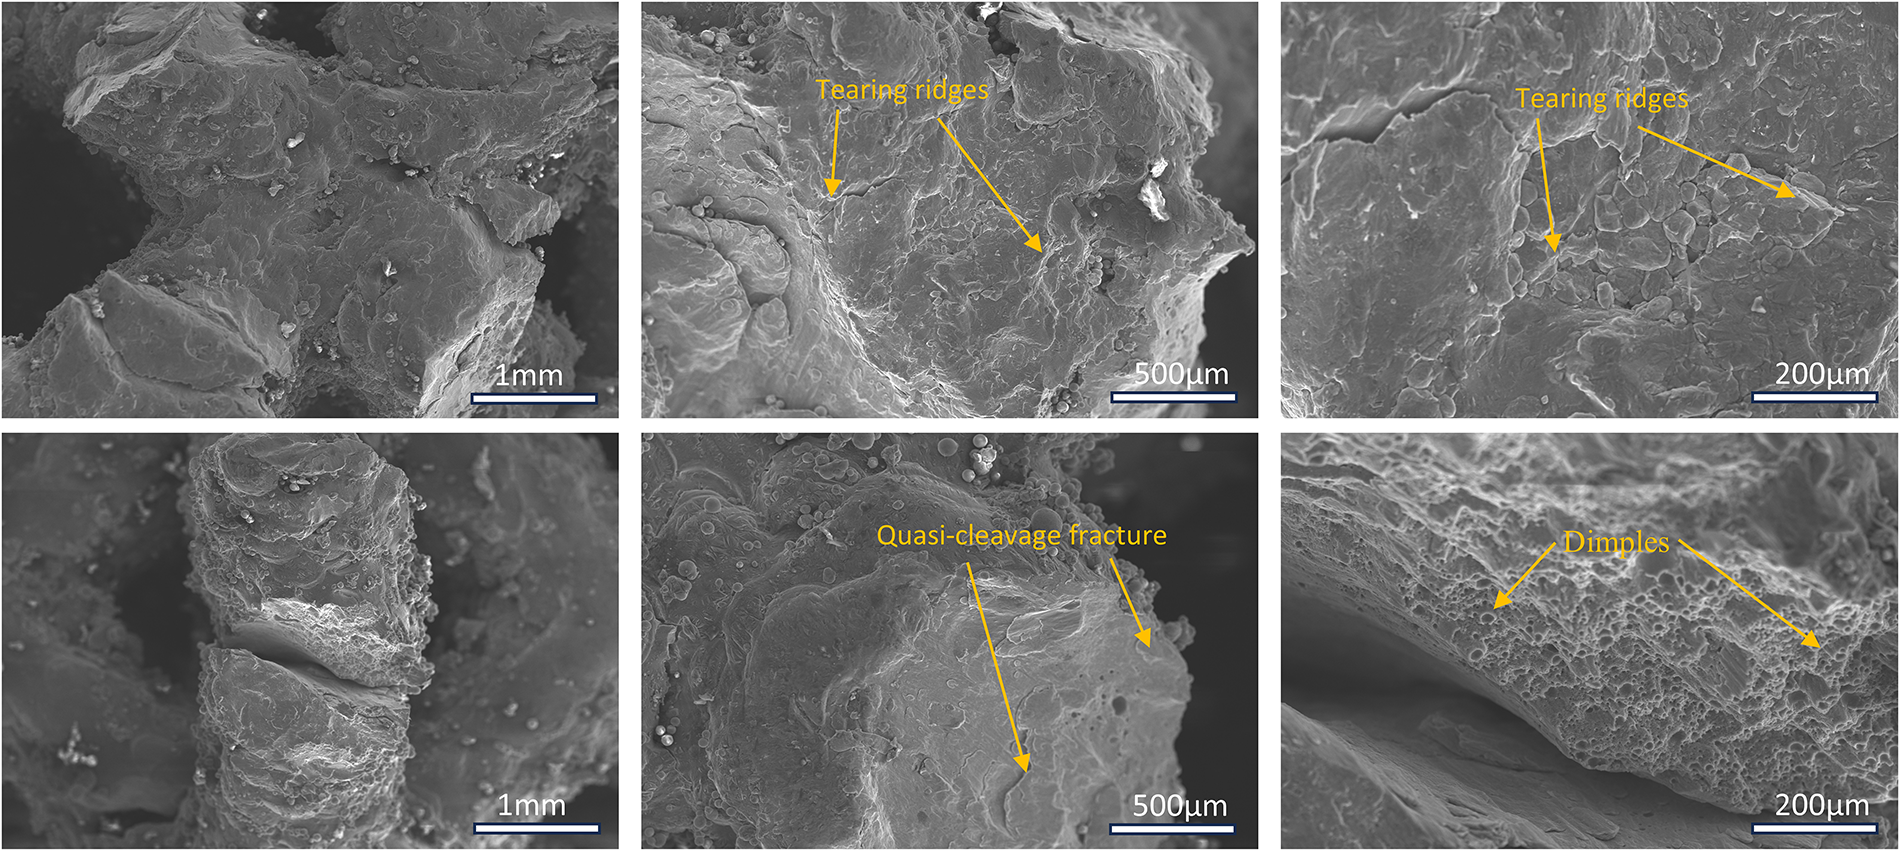
Figures 16 and 17 are the fracture morphology diagrams of the compressed and tensile inlaid lattice structures, respectively. The images show that the fracture surfaces of the compressed and tensile inlaid lattice structures at the 1 mm macroscale exhibit obvious three-dimensional void structures, with some irregular, large-sized voids. These are common defects formed by unmelted powder, pores, or solidification shrinkage in the SLM process. Additionally, the fracture surface is rough, showing layered traces characteristic of layer-by-layer melting, where materials are melted and stacked layer by layer. At the micromorphology scales of 200 µm and 100 µm, dimples indicated plastic deformation can be observed, indicating that plastic deformation occurred in the inlaid lattice structure during the compression and tensile fracture processes. Additionally, some unmelted powder particles are embedded in parts of the fracture surface, and small-scale cleavage planes and tearing ridges can be seen in local areas of the fracture, confirming brittle fracture components. In summary, the fracture surfaces formed after compression and tension of the inlaid lattice structure exhibit a mixed fracture mode mixed ductile–brittle modes with ductile dominance. The defects such as pores and unmelted particles formed by the SLM process cause stress concentration under compressive load, promoting crack initiation. When the matrix material undergoes plastic deformation to form dimples, the brittle phases or defect areas trigger local cleavage fracture of the fracture surface.
The morphology of the compression fracture surface of the tessellated lattice.
The morphology of the tensile fracture surface of the tessellated lattice.
Energy absorption performance of inlaid lattices
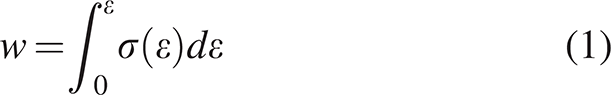
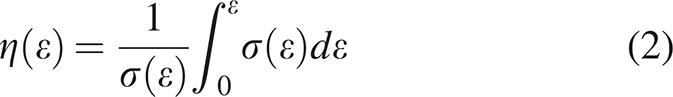
As one of the important mechanical indicators of lattice structures, the energy absorption characteristics depend on the yield plateau continuity/stability of the ductile yield platform stage in the typical three-stage deformation characteristics exhibited by lattice structure materials under quasi-static/dynamic compressive loads, which directly determine the energy absorption efficiency of the materials. This stage converts elastic to plastic energy of elastic potential energy into plastic deformation energy through a controllable layer-by-layer collapse mechanism, demonstrating a high-energy dissipation efficiency. The calculation is carried out by combining the stress–strain curve with the energy absorption formula (1) and the energy absorption efficiency formula (2):
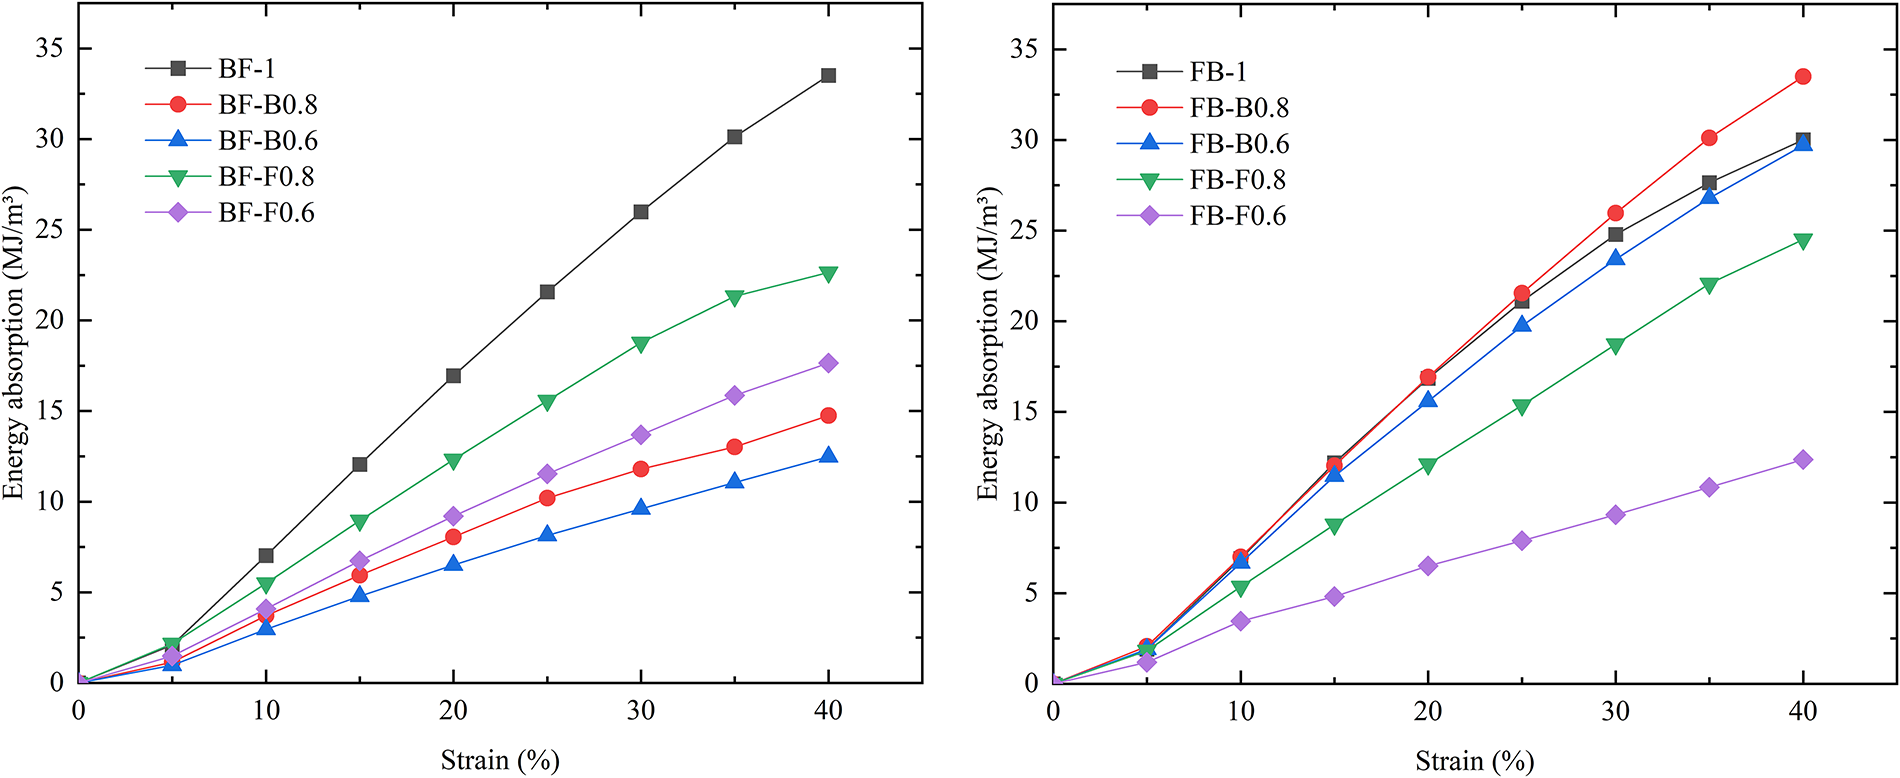
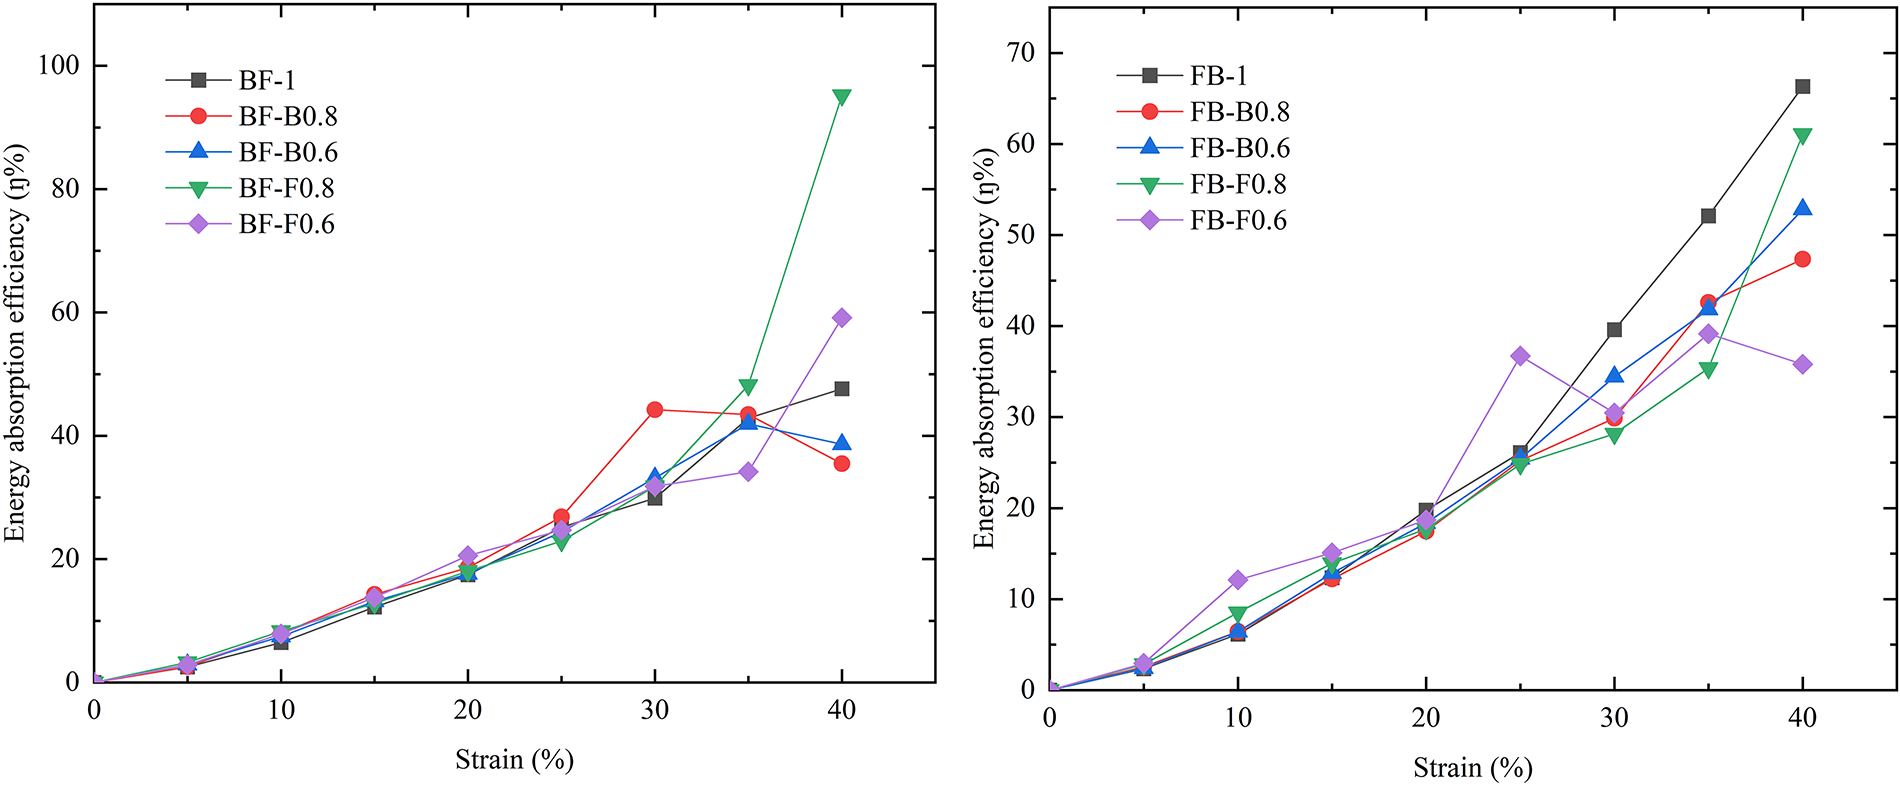
Thus, the energy absorption and energy absorption efficiency curves of the FB and BF lattice compression processes were calculated, as shown in Figures 18 and 19. As shown in Figure 18, the energy absorption of the BF structure exhibits linear growth when the strut diameters are 0.8 and 0.6. Notably, the energy absorption values for B-strut diameters of 0.8 and 0.6 are both higher than those for F-strut diameters of 0.8 and 0.6, indicating that B-struts dominate BF energy absorption of the B-strut diameter. In the BF structure shown in Figure 19, the energy absorption efficiency exhibits a similar increasing trend when the strain is less than 30%, while the FB lattice structure shows different fluctuations in absorption efficiency. This indicates that the BF structure can maintain a relatively consistent energy absorption efficiency when the relative density is changed.
Energy absorption curve.
Energy absorption efficiency curve.
As can be seen from the energy absorption curves, for the FB structure, even when the size of the B-strut diameter is changed, the total energy absorption of the overall structure at 40% strain is similar. Notably, reducing the size of the B-strut diameter can make the total energy absorption higher than that before the reduction, as shown in FB-B0.8 of Figure 18. When the F-strut diameters are changed to 0.8 and 0.6, the energy absorption of F0.8 is reduced to a certain extent compared with the FB-1 structure, while the energy absorption at F0.6 is significantly lower than that of FB-1. This indicates that excessively reducing the F-strut diameter in the FB structure significantly decreased the overall energy absorption. The energy absorption efficiency curve of the FB structure also shows that too small F-strut diameters cause large fluctuations in energy absorption efficiency. In summary, the FB structure demonstrates superior overall energy absorption compared with the BF structure, and in both FB and BF structures, FCC (F) structures play a decisive role in the overall energy absorption of the structure. Therefore, the application scenarios of the lattice can be optimized by appropriately changing the diameter of the F-strut.
Summary
The AlSi10Mg lattice structure prepared by SLM under the process parameters of laser power 340 W, scanning speed 1200 mm/s, scanning spacing 0.17 mm, and powder layer thickness 0.03 mm achieved peak mechanical properties and 99.2% density. Moreover, the exhibited <0.48 mm form errors the required 0.48 mm, demonstrating excellent forming accuracy.
The high stress–strain regions of FB and BF structures are localized in FCC (F) structures, which serve as the main load-bearing component of the inlaid lattice structure.
The compression fracture mode of the inlaid lattice mainly shows layer-by-layer fracture at small strains, and a 45° fracture zone appears under large strains. The fracture mechanisms of tensile and compression specimens are similar, both being mixed ductile and brittle fractures.
The maximum yield strength and tensile strength of the FB structure are 112 MPa and 48.2 MPa, respectively, with an elongation of 3–4%. The maximum yield strength and tensile strength of the BF structure are 105 MPa and 44.6 MPa, respectively, with an elongation of 4–5%. Under similar volume fractions, the energy absorption of the FB structure is higher than that of the BF structure.
Authors’ Contributions
L.H.J.: Conceptualization and supervision. Q.Q.Y.: Methodology and writing—original draft. Z.L.: Conceptualization and methodology.