
Abstract
Once persistent for around a month, tinnitus typically persists permanently. This transition from acute to chronic tinnitus is thought to reflect dynamic neurophysiological changes and plasticity within central auditory and non-auditory networks, but empirical evidence has been lacking. We hypothesized that, bottom-up neural mechanisms linked to tinnitus initiation, such as central gain and neural synchrony, are maximal around the time of its initiation, but subsequently return towards baseline as central plastic changes develop. We evaluated part of this hypothesis by measuring central auditory reactivity through the Intensity Dependence of Auditory Evoked Potential (IDAEP), a non-invasive index of higher-order inhibitory processing within the auditory system. A steeper IDAEP slope is associated with heightened sensory reactivity (higher sensitivity to changes in auditory stimuli), indicative of reduced central inhibition, whereas a shallower slope reflects greater inhibitory control. Studying a group with acute tinnitus (onset within past six weeks), with a repeated assessment after six months from onset, we found a significant longitudinal reduction in the IDAEP slope following initial tinnitus onset, and non-significantly higher IDAEP slope in Acute and Chronic tinnitus groups compared to matched controls. These findings support our hypothesis, indicating that IDAEP may serve as an objective marker of auditory reactivity for characterising the time course of certain tinnitus mechanisms.
Introduction
Studying acute tinnitus is essential for identifying early biomarkers and mechanisms that differentiate transient from persistent forms. The exact temporal demarcation from acute to chronic tinnitus is not standardised, with arbitrary cut-offs varying between 3 and 12 months (Haider et al., 2018). However it is defined, the acute window might help us understand the neurophysiological and neurochemical processes that first cause tinnitus, hopefully leading to advances that inform the development of targeted therapies and improve prognosis. Yet empirical human data on brain activity relating to acute tinnitus are largely lacking from the literature.
With respect to the mechanisms of tinnitus generation, tinnitus is often argued to result from a “central gain” mechanism, where the brain increases its internal sensitivity to compensate for a loss of peripheral input (Auerbach et al., 2014). When the auditory system is deprived of sound, even via “hidden” damage not seen on an audiogram, homeostatic plasticity triggers changes to restore neural activity levels. These changes include synaptic scaling, such as the reduction of GABAergic inhibition, and intrinsic adjustments to neuronal membranes that increase firing rates. While these adaptations aim to maintain coding efficiency, the resulting surge in spontaneous activity and neural synchrony may ultimately be perceived by the brain as a phantom sound (Noreña & Farley, 2013).
Theoretical models highlight that, as the tinnitus undergoes chronification, hypersensitivity may reduce or recalibrate. Noreña and Farley (2013) argued that, once the percept is established, it is sustained by high neural synchrony and functional coupling across a distributed network (including the parietal and cingulate cortices) rather than a persistence of increased gain. As one example of such accounts, the sensory precision model proposed by Sedley et al. (2016) posits that over time the brain learns to “predict” tinnitus as a persistent feature of the environment, leading to persistence of the percept. Various forms of plasticity in auditory, memory, or broader perceptual networks may enable tinnitus to persist without necessitating sustained or continuous enhancement of the auditory gain mechanisms that first produced it.
Assessments of auditory sensitivity serve as a functional gateway to mapping the nervous system’s internal scaling processes, as the magnitude of neural firing across the auditory pathway may tap into underlying central gain mechanisms (Zeng, 2013). Categorical Loudness Scaling (CLS) is one method used to quantify this relationship by measuring how an individual’s subjective perception of loudness changes as sound intensity increases (Hébert et al., 2013). This process establishes an input-output (I/O) function, where the “input” represents the physical intensity of the sound in decibels and the “output” represents the perceived loudness. By observing how these measures relate, researchers can identify the specific points at which the central nervous system modifies its sensitivity in response to sensory input (Hébert et al., 2013; Umashankar et al., 2025).
The slope of this input-output function is thought to be a critical indicator that reflects the state of central gain. In the active loudness model described by Zeng (2013), a standard slope represents a healthy balance between peripheral input and central processing. However, a steepening of the slope is thought to indicate an increase in nonlinear gain, suggesting the brain has “turned up” its internal amplification to compensate for a reduced or degraded signal. When evaluating the input-output function, a vertical shift in its intercept indicates an elevation in baseline internal activity, which reflects increased central noise and corresponds clinically to the generation of the tinnitus percept in the absence of external sound. Conversely, an alteration in the steepness of the function’s slope represents abnormally high growth of perceived loudness relative to physical sound intensity, which serves as a measurable footprint of hyperacusis. We recently utilized CLS to evaluate shifts in auditory sensitivity during the transition from acute to chronic tinnitus. Our longitudinal comparison revealed no significant changes in either individual loudness ratings or the CLS slope, suggesting that, the chronification of tinnitus may be independent of subjective auditory sensitivity. However, integrating objective measures of auditory sensitivity could complement these subjective findings and provide a more comprehensive means to tap into the state of central gain in tinnitus as a whole (Umashankar et al., 2025).
Evoked potentials may offer a robust physiological extension to subjective measures of auditory sensitivity, as they directly capture stimulus-driven neural activity across different stages of the ascending pathway. Unlike behavioural tests, which rely on subjective feedback, these objective measures provide a quantifiable assessment of how sound-evoked neural responses scale within the auditory pathway, potentially revealing the specific physiological footprints of central gain. In particular, the N1-P2 complex of the auditory evoked potential has been widely employed in both tinnitus and basic auditory research as an objective index of cortical sound processing. This complex is sensitive to auditory change detection, sensory gating, attentional allocation, and hypervigilance (Mohebbi et al., 2019; Spielmann Moura et al., 2010) with N1 being localized to the Heschl’s gyrus and the superior temporal gyrus, and P2 being localized to the secondary auditory cortex and deeper structures in the temporal plane of both hemispheres (Lightfoot, 2016). However, N1-P2 findings relating to tinnitus have been inconsistent, yielding varied results regarding their magnitude and latency (Azevedo et al., 2020), and it is hard to draw any clear conclusions.
A particularly informative extension of the N1-P2 complex is the Intensity Dependence of Auditory Evoked Potentials (IDAEP), sometimes termed ‘Loudness Dependence of Auditory Evoked Potentials’ (LDAEP), which quantifies the change in response amplitude per unit increase in stimulus intensity. In some respects, IDAEP serves as an objective physiological counterpart to the slope observed in CLS. Much like the subjective growth measured in loudness scaling, the slope of the IDAEP can be utilized as an objective metric of auditory sensitivity, quantifying how neural response magnitudes scale with increasing sound intensity to reflect the underlying state of central gain. IDAEP is typically measured at low stimulus frequencies, up to 1 kHz. A steeper IDAEP slope may be associated with increased reactivity to sensory input, while a shallower slope may reflect stronger inhibitory modulation (Fitzgerald et al., 2009; Zhang et al., 2017). In the context of central gain, the IDAEP slope may reflect central auditory gain mechanisms, by capturing how neural response amplitudes change as a function of increasing stimulus intensity.
While existing frameworks identify auditory sensitivity mechanisms like elevated central gain as primary drivers of tinnitus generation, these models fail to account for its long-term persistence. If auditory hypersensitivity habituates over time, it cannot fully explain why the tinnitus percept stabilizes rather than subsides. In fact, if elevated gain were a necessary condition for the presence of tinnitus at any time in its chronicity, then we would expect to see tinnitus as a predominantly intermittent rather than persistent condition, which waxed and waned as dynamically changing factors influenced central gain. Whilst this pattern is seen in some tinnitus cases, they are the minority. We therefore argue that the field must look beyond auditory sensitivity mechanisms like central gain to fully understand chronic tinnitus, but also that in parallel we need to better characterise central gain changes and how these evolve across the tinnitus timeline. Accordingly, this study utilizes objective, longitudinal measures to track shifts in auditory sensitivity from initial onset through to the chronic stage, definitively mapping these temporal changes to provide the necessary foundation for identifying the distinct neural mechanisms responsible for tinnitus initiation and tinnitus persistence.
Our recent findings on CLS (Umashankar et al., 2025) suggest that, while subjective auditory sensitivity remains stable over time, tinnitus loudness and severity naturally tends toward habituation, even in the absence of clinical intervention. The results of a pilot study in our lab (unpublished data from Sedley et al. (2019)) found greater N1 amplitude differences between stimuli with a 6 dB intensity difference in the acute stages of tinnitus compared to post 6 months (onset of chronification) in the same individuals. We hence hypothesized here that auditory sensitivity would peak around the onset of tinnitus as an indicator of acutely increased central gain as a contributor to tinnitus onset, and predict that the IDAEP slope, as a physiological marker of this gain, would decrease longitudinally as the tinnitus became chronic.
Methods
Participants
We studied 27 participants with Acute Tinnitus which we defined as a duration of less than 6 weeks, with mean tinnitus duration 3.96 weeks (SD 2.03 weeks) and a median duration of 4 weeks with one outlier with a duration of 12 weeks. The outlier subject was included in this study as they fell within the time limit identified by previous authors as acute, specifically a length of less than 3 months (Shim et al., 2011; Vielsmeier et al., 2020), and they also participated in the follow-up study.
We also recruited 20 participants with Chronic Tinnitus, defined as a duration more than 6 months, with a mean duration of 8.82 years (SD 8.38 years) and a median duration of 5 years, and 18 non-tinnitus Control participants. Participants were recruited through community advertising on Google Ads for Acute and Chronic tinnitus, and internally within Newcastle University’s research volunteer pool for Chronic tinnitus and Control groups. The 27 Acute Tinnitus participants were invited for reassessment after a minimum of 6 months from tinnitus onset which we took to indicate their chronic stage, and 13 of them volunteered for and completed this further testing. We refer to this as the ‘Post-Acute’ group, to distinguish it from the independently-recruited Chronic Tinnitus group. Due to a lack of pilot data and conflicting findings in existing literature regarding evoked potentials and tinnitus, formal sample size calculations were not performed. Instead, the target was determined by referring to a systematic review of evoked potential studies (Cardon et al., 2020), which showed a mean sample size of 20.96 across various tinnitus groups and subgroups. To ensure the post-acute tinnitus groups maintained a final count of approximately 20 participants, the initial recruitment for the acute group was increased by seven to account for a potential 25% attrition rate (Cardon et al., 2020). However, the study experienced an attrition rate exceeding 50%, with 14 of the original 27 participants withdrawing before completion. Among the 14 dropouts, one reported complete cessation of tinnitus following the introduction of a new medication by their general practitioner. Five individuals declined further participation due to personal constraints, citing a lack of time for scheduling or relocation away from the research centre. The remaining eight participants did not respond to repeated follow-up emails or telephone calls.
All participants provided written consent and individuals aged 18 and older were included, but those with Meniere’s disease, epilepsy, or middle ear pain or infections were excluded from the study.
The Participants Demographics for Each Group are Shown in Table
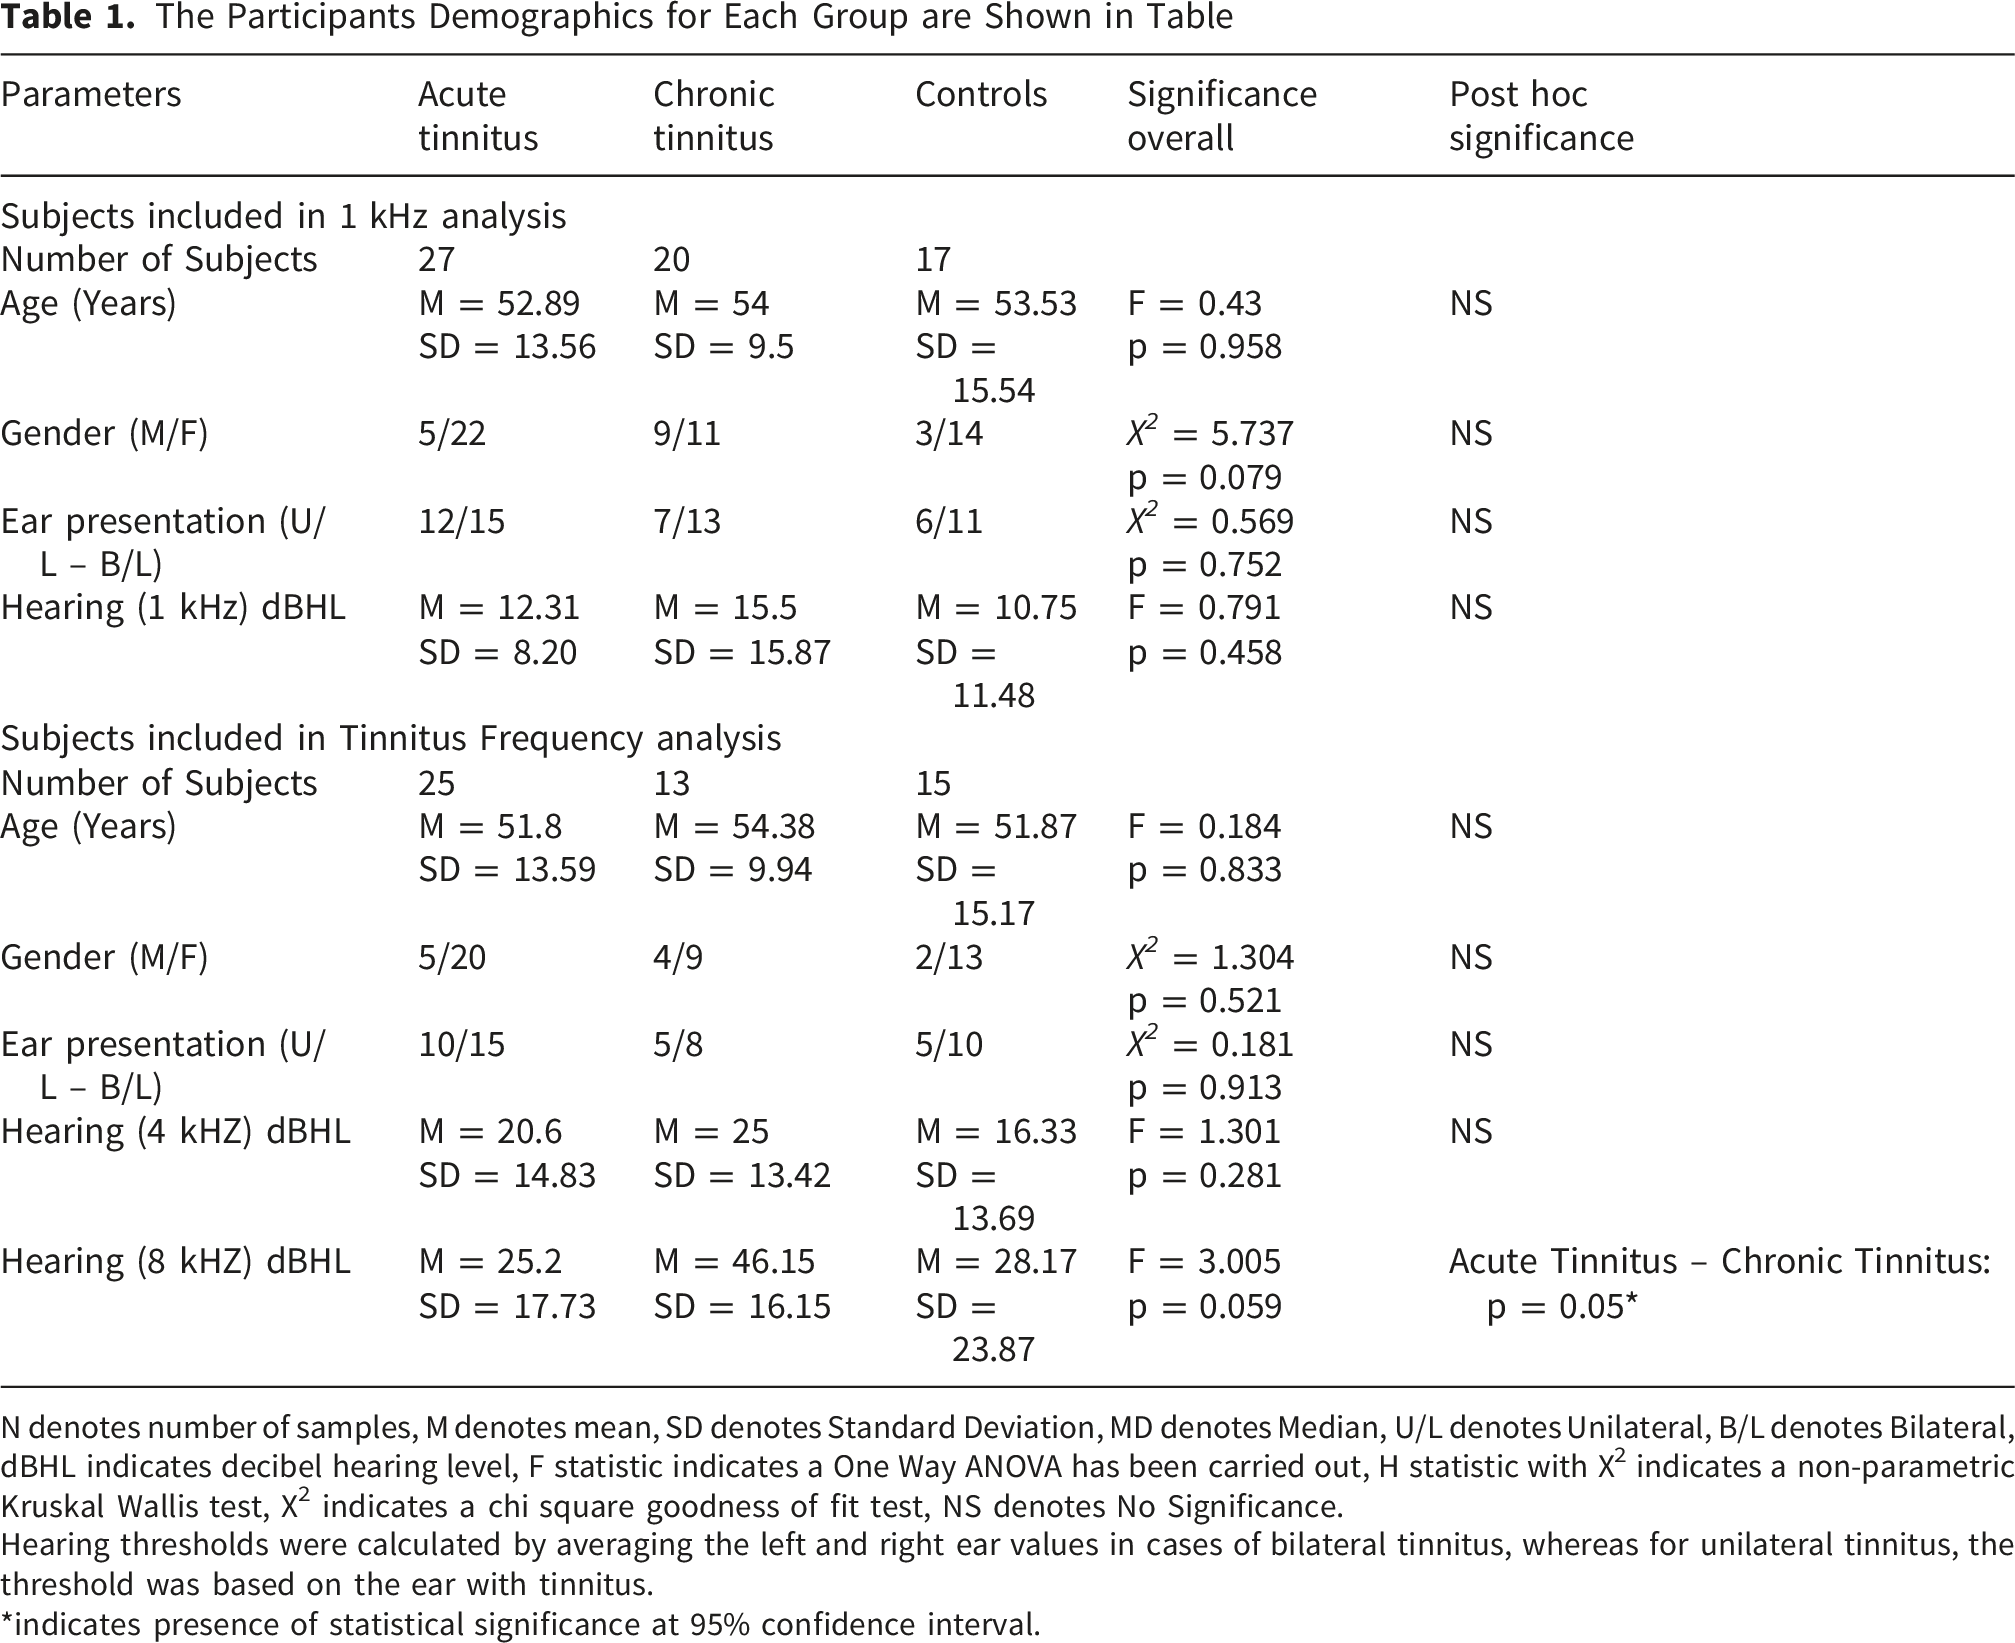
N denotes number of samples, M denotes mean, SD denotes Standard Deviation, MD denotes Median, U/L denotes Unilateral, B/L denotes Bilateral, dBHL indicates decibel hearing level, F statistic indicates a One Way ANOVA has been carried out, H statistic with X2 indicates a non-parametric Kruskal Wallis test, X2 indicates a chi square goodness of fit test, NS denotes No Significance.
Hearing thresholds were calculated by averaging the left and right ear values in cases of bilateral tinnitus, whereas for unilateral tinnitus, the threshold was based on the ear with tinnitus.
*indicates presence of statistical significance at 95% confidence interval.
Audiological Assessment
Prior to the experiment, participants completed a pre-screening form containing questions designed to confirm eligibility based on the inclusion and exclusion criteria. The experimenter, a qualified audiologist with experience in tinnitus, conducted interviews with the participants prior to the experiment, confirming a medical history consistent with subjective tinnitus and the lack of atypical symptoms or concerns about an unidentified underlying cause. Participants provided demographic information, including age and sex, as well as information about their tinnitus, such as type (tonal, noise-like, or other), duration, which ear(s), and a past physical and mental health history, including any otological disorders. Four common, validated questionnaires—the Tinnitus Handicap Inventory (THI) (Newman et al., 1996), the Tinnitus Functional Index (TFI) (Meikle et al., 2012), the Hyperacusis Questionnaire (HQ) (Khalfa et al., 2002), and the Inventory of Hyperacusis Symptoms (IHS) —were used to evaluate the impact and distress related to tinnitus and any co-existing hyperacusis symptoms (Greenberg & Carlos, 2018).
Participants underwent a Pure Tone Audiometry (PTA) test to establish hearing thresholds at octave frequencies ranging from 250 Hz to 8 kHz. Threshold estimation was done using the modified Hughson-Westlake procedure (Carhart & Jerger, 1959).
Tinnitometry
Tinnitus frequency and loudness were determined via a tinnitometry procedure, for participants with either acute or chronic tinnitus. In cases of unilateral tinnitus, matching stimuli were presented contralaterally, and in bilateral tinnitus they were presented bilaterally. Participants first matched their tinnitus for loudness and then for frequency from a starting reference stimulus of 6 kHz. In bilateral cases where the tinnitus was asymmetric, additional adjustments were made to balance the two ears. Both loudness, then frequency, were iteratively adjusted until the sound closely matched the participant’s tinnitus, and no further changes were judged necessary by the participant. This procedure was repeated across three trials, and a mean of the trials was taken and considered as the final loudness and frequency of the tinnitus. The stimulus used for this procedure was either a pure tone or narrow band noise (1/3 octave with Hanning spectrum) depending on the subjective similar bandwidth of the tinnitus.
IDAEP Stimuli
With a total of 200 stimuli for each of 3 intensities and 2 frequencies, and a 25-minute total experiment length, the IDAEP stimuli consisted of pure tones at 1 kHz and the individual’s matched tinnitus frequency (or, for controls, the matched tinnitus participant’s tinnitus frequency), with a duration of 100 ms, onset/offset ramp of 10 msec, and an interstimulus interval uniformly randomized between 1 sec and 1.5 sec. For each frequency (1 kHz and tinnitus-matched), three different intensities were presented (details of the intensities are explained below). Stimuli were presented in blocks, with each block containing stimuli of a fixed frequency and random intensity, with a total of 60 stimuli per block (i.e. 20 per intensity), and a total of 10 blocks per frequency. To attempt to at least partially compensate for hearing loss, loudness recruitment, and hyperacusis, stimulus intensities were individually adjusted based on each participant’s dynamic range—the span between hearing threshold and uncomfortable loudness level—for both 1 kHz and the tinnitus frequency. Hearing thresholds were established for the experimental stimuli using an ascending-descending run of 3 dB steps until at least a 50% positive response was obtained (i.e., two correct responses out of four trials) (Carhart & Jerger, 1959). The uncomfortable loudness level was established by presenting an ascending run of 3 dB step size from the threshold until the participant just perceived the tone to be uncomfortably loud or showed signs of discomfort (Carhart & Jerger, 1959). Dynamic range was defined as uncomfortable loudness level (ULL) minus hearing threshold. Stimulus intensities were determined as follows: a. Low Intensity: hearing threshold plus 60% of Dynamic Range b. High Intensity: ULL – 10 dB c. Medium Intensity: Mean of Low and High Intensity (Figure 1)
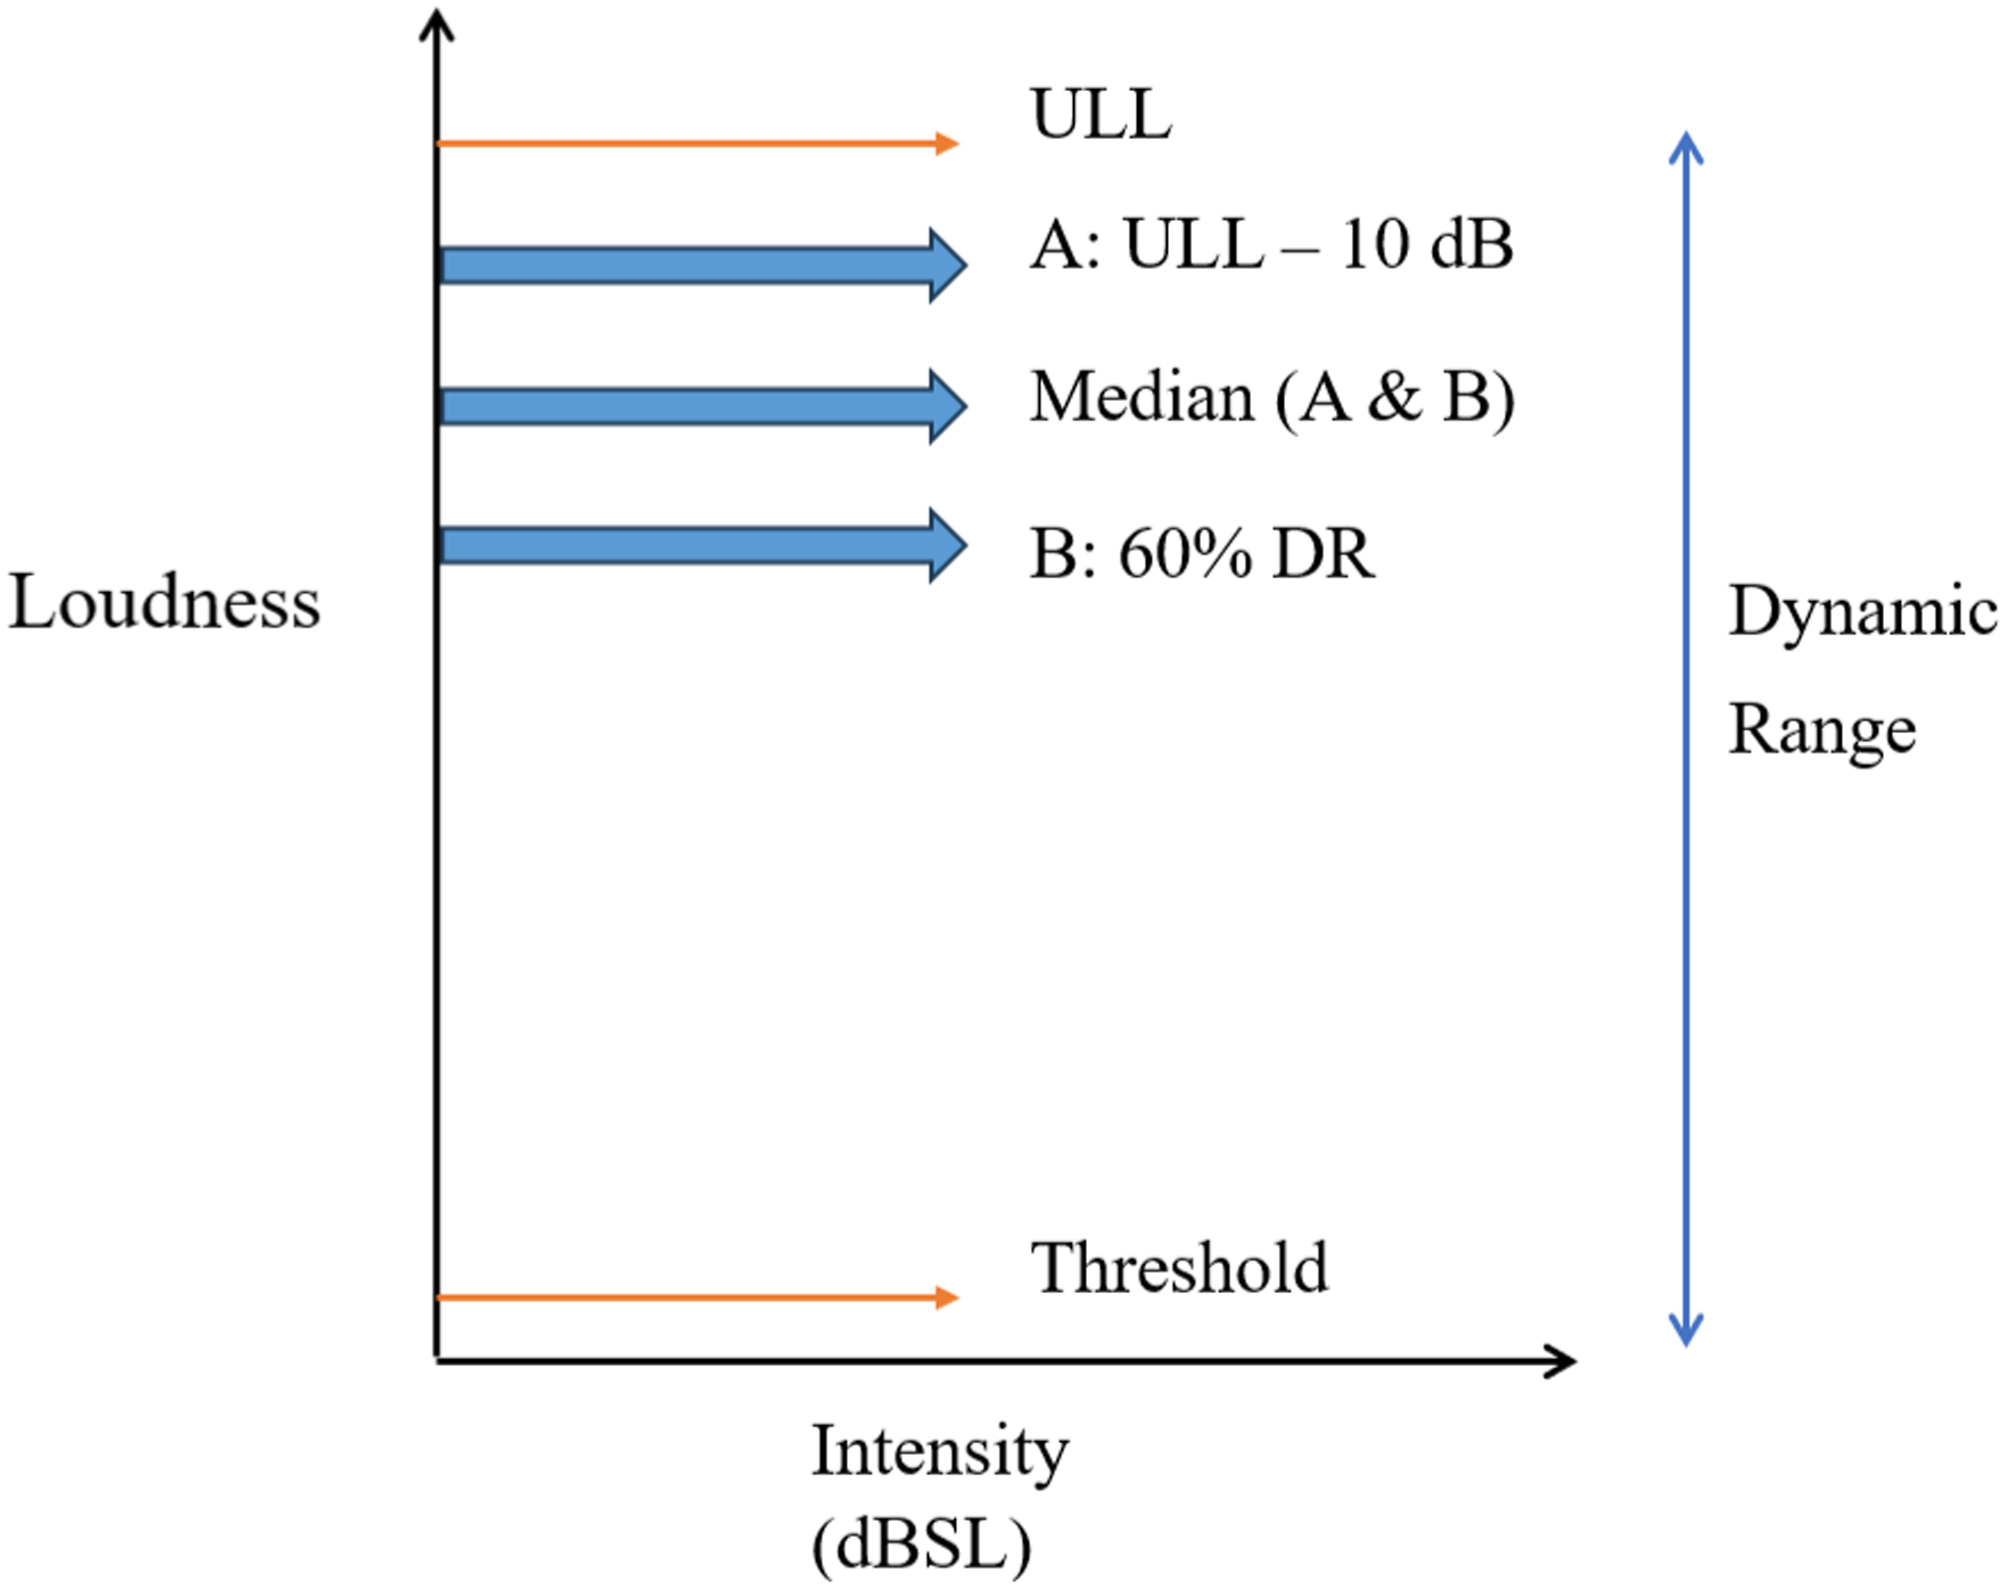
Stimulus presentation levels across 3 intensities based on tailored dynamic range for each subject
ULL: Uncomfortable Loudness Level, DR: Dynamic Range
For participants with (or controls matched to participants with) unilateral tinnitus, stimuli were only presented in the tinnitus ear; for those with bilateral tinnitus, they were presented in both ears. The controls also were individualised in intensity based on the same dynamic range procedure. Table 1 shows the demographic details and distribution of presentation ears for each group.
IDAEP EEG Recording
EEG was recorded using a 64-channel Active Two system (Biosemi) in a soundproof room. Electrode offset was kept at the manufacturer’s recommended limits of ±10 mV with a sampling rate of 256Hz.
The experiment was a passive task, during which the participants watched a silent subtitled movie of their choosing. All stimuli were generated and presented using Matrix Laboratory (Matlab) version R2019a and Psychtoolbox version 3 (Pelli, 1997).
EEG Preprocessing
Data were processed in Matlab, version R2019a, using the EEGlab toolbox (Delorme & Makeig, 2004) and customised code. Data were re-referenced to the P9/P10 (approximating a linked mastoids montage). Bandpass (non-phase-distorting) filtering was performed between 1 Hz and 30 Hz. Channels judged to contain excessive noise were removed and reconstructed by interpolation from neighbouring channels. Channel rejection was based on visual inspection and a correlation higher than 0.8 to other channels were also rejected to improve signal quality. This was followed by epoching between -0.1 and 0.5 s from stimulus onset. Independent Component Analysis (ICA) was performed, and components capturing predominantly eye blinks or eye movements were removed from the data. After ICA, artifact rejection was also carried out using individual component rejection where epochs were automatically rejected using a probability of 5 and Kurtosis of 8 as the threshold. Baseline correction was performed based on the period of -100 to 0 msec. All trials for each stimulus frequency and intensity were then averaged to yield the event-related potential.
Data Analysis
After preprocessing, we used customised MATLAB code to perform automatic peak detection to determine the N1 and P2 for each subject. At electrode FCz, we measured the most negative peak amplitude for N1 between post-stimulus latency 90 and 200 msec and the most positive peak amplitude for P2 between post-stimulus latency 150 and 250 msec (Crowley & Colrain, 2004; Schröder et al., 2014). The peak-to-peak amplitude between N1 and P2 in μV was taken as the variable of interest. Each subject had peak-to-peak amplitude calculated for the three intensities at each of 1 kHz and the tinnitus frequency.
The IDAEP slope function was the primary variable of interest and was calculated across the three intensities at each frequency as the quotient of the Amplitude Dynamic Range (ADR: relative difference of the high intensity and low intensity N1-P2 response amplitude) and Stimulus Dynamic Range (SDR: relative difference of the high and low stimulus intensity).
Units of the IDAEP slope are thus μV/dB. Note that the medium intensity stimuli were not used for analysis but were judged important to include in the paradigm for their influence on the overall statistical properties of presented stimuli, and to maintain consistency with other published IDAEP paradigms (Carrillo-de-la-Peña et al., 2006; Fitzgerald et al., 2009).
Participants were rejected from a particular analysis (1 kHz or tinnitus frequency) if they had insufficient overall ERP quality (peak quality through visual inspection), or less than 5 dB stimulus dynamic range. ERP quality was judged subjectively, and the minimum acceptable SDR was based on inspection of a funnel plot of SDR against IDAEP slope estimate, which showed an inflection point at 5 dB. Such exclusions were performed with the researcher blind to the group to which each participant belonged.
Statistical analysis was performed using the Statistical Package for Social Science (SPSS). Based on the Shapiro-Wilk test of normality, the data were normally distributed across the three groups for 1 kHz and tinnitus frequency for the N1-P2 amplitude, and hence parametric statistics were used. However, the data were normally distributed for 1 kHz and not normally distributed for tinnitus frequency for the slope, and hence a parametric statistic was used for 1 kHz and non-parametric statistic was used for the tinnitus frequency separately.
As a secondary analysis, for N1-P2 response amplitudes to specific stimulus intensities, a three-way factorial Analysis of Covariance (ANCOVA) was conducted to examine the effects of Group (Acute vs Chronic vs Control), Frequency (1 kHz vs tinnitus frequency), and Intensity (low vs medium vs high). Stimulus presentation level (which was individualised for each subject) was included as a covariate to control for its potential influence on the dependent measure. Main effects and interactions were assessed, and post hoc comparisons were corrected using the Bonferroni test where appropriate. Similarly, a repeated measures ANOVA was conducted with Group (Acute vs Post Acute Tinnitus), Frequency (1 kHz and tinnitus frequency), and Intensity (low, medium, high) as within-subject factors. Main effects and interaction effects were tested. Sphericity was assessed using Mauchly’s test, and Greenhouse–Geisser corrections were applied where necessary. Post hoc comparisons were adjusted using the Bonferroni correction.
The Participants’ Tinnitus Distress and Tinnitometry Related Data for Each Group are Shown in Table

N denotes number of samples, M denotes mean, SD denotes Standard Deviation, F statistic indicates a One Way ANOVA has been carried out, t statistic indicates an independent t test done, N/A- Not Applicable, NS denotes No Significance.
THI - Tinnitus Handicap Inventory, TFI – Tinnitus Functional Index, HQ – Hyperacusis Questionnaire, IHS – Inventory of Hyperacusis Symptoms. It is important to highlight that there is an asymmetry in the sample sizes between the questionnaires and the original sample, resulting from the exclusion of participant questionnaires with incomplete responses.
*indicates presence of statistical significance at 95% confidence interval
As there might be cross-sectional differences and longitudinal changes in tinnitus distress, which might in principle correlate with IDAEP, we also carried out a Pearson correlation between IDAEP slope at 1 kHz and THI score, which we considered could account for any distress-related effects that might otherwise be mistaken for correlates of tinnitus duration. This included one analysis using both Acute and Chronic tinnitus groups combined, and a second correlation between the change in IDAEP slope and the change in tinnitus distress from the acute to post-acute phase, reflecting how variations in one variable over time relate to variations in the other. We conducted an exploratory analysis to investigate the relationship between tinnitus loudness and IDAEP slope, to assess whether changes in IDAEP slope could serve as a potential measure of tinnitus loudness. Finally, we also conducted an exploratory analysis to investigate the relationship between stimulus dynamic range (SDR) and IDAEP slope, to assess whether differences in SDR might partially explain or mask group differences in IDAEP slope. A further reason for this analysis was to identify a minimum threshold for SDR as an additional quality control measure (refer to data analysis section relating to setting the minimum acceptable SDR at 5 dB), ensuring that no SDR outliers confounded the results. For each of the three groups, at each stimulus frequency, Pearson’s correlation tests were performed to examine the direction and strength of the association between SDR and slope. For all tests alpha significance threshold was set to 0.05.
Results
Final participant number, after data quality and SDR exclusions (stimulus dynamic range below 5 dB), comprised 27 Acute Tinnitus, 13 Post-acute Tinnitus (Acute Tinnitus individuals followed up six months after tinnitus onset), 20 Chronic Tinnitus, and 17 Controls for the 1 kHz stimulus condition. For the tinnitus frequency condition, the final numbers comprised 25 Acute Tinnitus, 11 Post-acute Tinnitus, 13 Chronic Tinnitus, and 15 Controls. The differences in subject group numbers between the two analyses reflects different numbers of instances of individuals’ data meeting exclusion criteria. While estimating the dynamic range for subjects at some of the tinnitus frequencies, there were issues where we could not measure the ULL at high frequencies for the participants due to the limits of sound intensities with our equipment, particularly in participants who had large degrees of hearing loss at high frequencies. In such instances, ULL was estimated to be maximum stimulation plus 10 dB. Participant group demographics and audiometric characteristics are summarised in Table 1.
IDAEP Slope: Longitudinal (Primary Dependent Variable)
A one-tailed t-test comparing longitudinal changes between Acute and Post-acute stages (only assessing decreases over time) revealed a significant decrease in IDAEP slope at 1 kHz over time (t (12) = -1.919, p = 0.04) with the Acute Tinnitus group (M = 0.186, SD = 0.114) having larger slopes than the Post-acute group (M = 0.133 SD = 0.142). Statistically significant differences were not obtained longitudinally between Acute and Post Acute Tinnitus at the tinnitus frequency, though the non-significant changes were in the same direction as for 1 kHz.
IDAEP Slope: Cross-Sectional
There was no significant effect of group on IDAEP slope comparing the Acute, Chronic, and Control groups cross-sectionally for either the 1 kHz (F (2,61) = 2.194, p = 0.12) upon a one-way ANOVA, or for the tinnitus frequency (X
2
(2) = 2.43, p = 0.297) upon a Kruskal Wallis test. Both Acute and Chronic groups had non-significantly larger IDAEP slopes than Controls, which we mention only to tentatively contextualise the longitudinal changes described above, as these cross-sectional differences were not statistically significant. Figure 2 illustrates the IDAEP slope across groups and frequencies. Variations in Amplitude Dynamic Range, Stimulus Dynamic Range, and IDAEP Slope (Amplitude Dynamic Range/Stimulus Dynamic Range) between groups across frequencies. Error bars indicate standard error of mean and TF indicates Tinnitus Frequency. A statistically significant difference was found between Controls and Acute Tinnitus, Controls and Chronic Tinnitus for Stimulus Dynamic Range at 1 kHz. A statistically significant difference was noted between Acute and Post Acute Tinnitus for Slope
Tinnitometry
With respect to the tinnitometry, the paired analysis between Acute and Post Acute Tinnitus yielded no significant differences for either tinnitus pitch (t(12) = 0.1, p = .888.) or tinnitus loudness (z = -1.165, p = 0.244). There were also no significant differences between Acute and Chronic Tinnitus for the tinnitus loudness (t(45) = 0.127, p = 0.899). Please refer to Table 2 for further details.
Symptom Questionnaires
With respect to the symptom questionnaires, there were no significant differences between Acute and Post Acute Tinnitus in either tinnitus distress or hyperacusis scores and there were no differences between Acute and Chronic Tinnitus for either tinnitus distress (THI: t(42) = t = -1.125, p = 0.148, TFI: t(42) = -1.814, p = 0.076) and hyperacusis symptoms (F(2,55) = 8.676, p<0.001). However, the controls (HQ: M = 6.35, SD = 4.6, IHS: M = 31.38, SD = 7.08) had significantly lower scores on the hyperacusis questionnaires when compared to Acute (HQ: M = 14.07, SD = 5.96, IHS: M=44.11, SD = 12.4) and Chronic Tinnitus groups (HQ: M = 17.41, SD = 10.9, IHS: M=49.35, SD = 18.1). Please refer to Table 2 for detailed statistics for both symptom questionnaires and tinnitometry.
N1-P2 Amplitude: Longitudinal
Stimulus presentation levels did not differ significantly between the groups, as indicated by no significant main effect of group in the three-way ANOVA, F(2, 10) = 0.897, p = 0.369. Therefore, no correction for this variable was included in N1-P2 analysis. With respect to the longitudinal comparisons between Acute and Post Acute Tinnitus, 3-way repeated measures ANOVA was carried out, and the sphericity was not violated as Mauchly’s Test of Sphericity yielded no significant difference for both simple main effect and interaction effects. Results revealed no 3-way interaction between Group, Frequency, and Intensity (F(2,9) = 1.169, p = 0.354) but significant main effects of Frequency (F(1,10) = 19.676, p = 0.001), and Intensity (F(2,9) = 11.99 p = 0.003) were found. A significant interaction was observed for frequency and intensity (F(2,9) = 4.607 p = 0.042) with both frequencies significantly differing under each intensity.
N1-P2 Amplitude: Cross-Sectional
Stimulus presentation levels differed significantly between groups, as indicated by a main effect of group in the three-way ANOVA, F(2, 330) = 14.6, p < .001, and was therefore the subject of correction in analysis of N1-P2 responses. For cross sectional comparisons between Acute, Chronic, and Controls, after adjusting for stimulus presentation level, the ANCOVA revealed significant main effects of Frequency (F(1,332) = 105.24, p < 0.001) and Intensity (F(2,332) = 4.08, p = 0.018), but no main effect of Group (F(2,332) = 1.929, p = 0.147.) There was no three-way interaction between Group, Frequency, and Intensity (F(2,332) = 0.071, p = 0.991). Figure 3 illustrates the N1-P2 waveforms across intensities and frequencies, and Figure 4 depicts the N1-P2 amplitude across intensities and frequencies. N1-P2 waveforms across three intensity levels and two frequencies Variations in N1-P2 amplitude between groups and across different stimulus presentation and frequencies. Error bars indicate standard error of the mean. Only a non-significant trend was observed between Acute and Post Acute Tinnitus for the low intensity presentation at 1 kHz. Remaining comparisons yielded no significant differences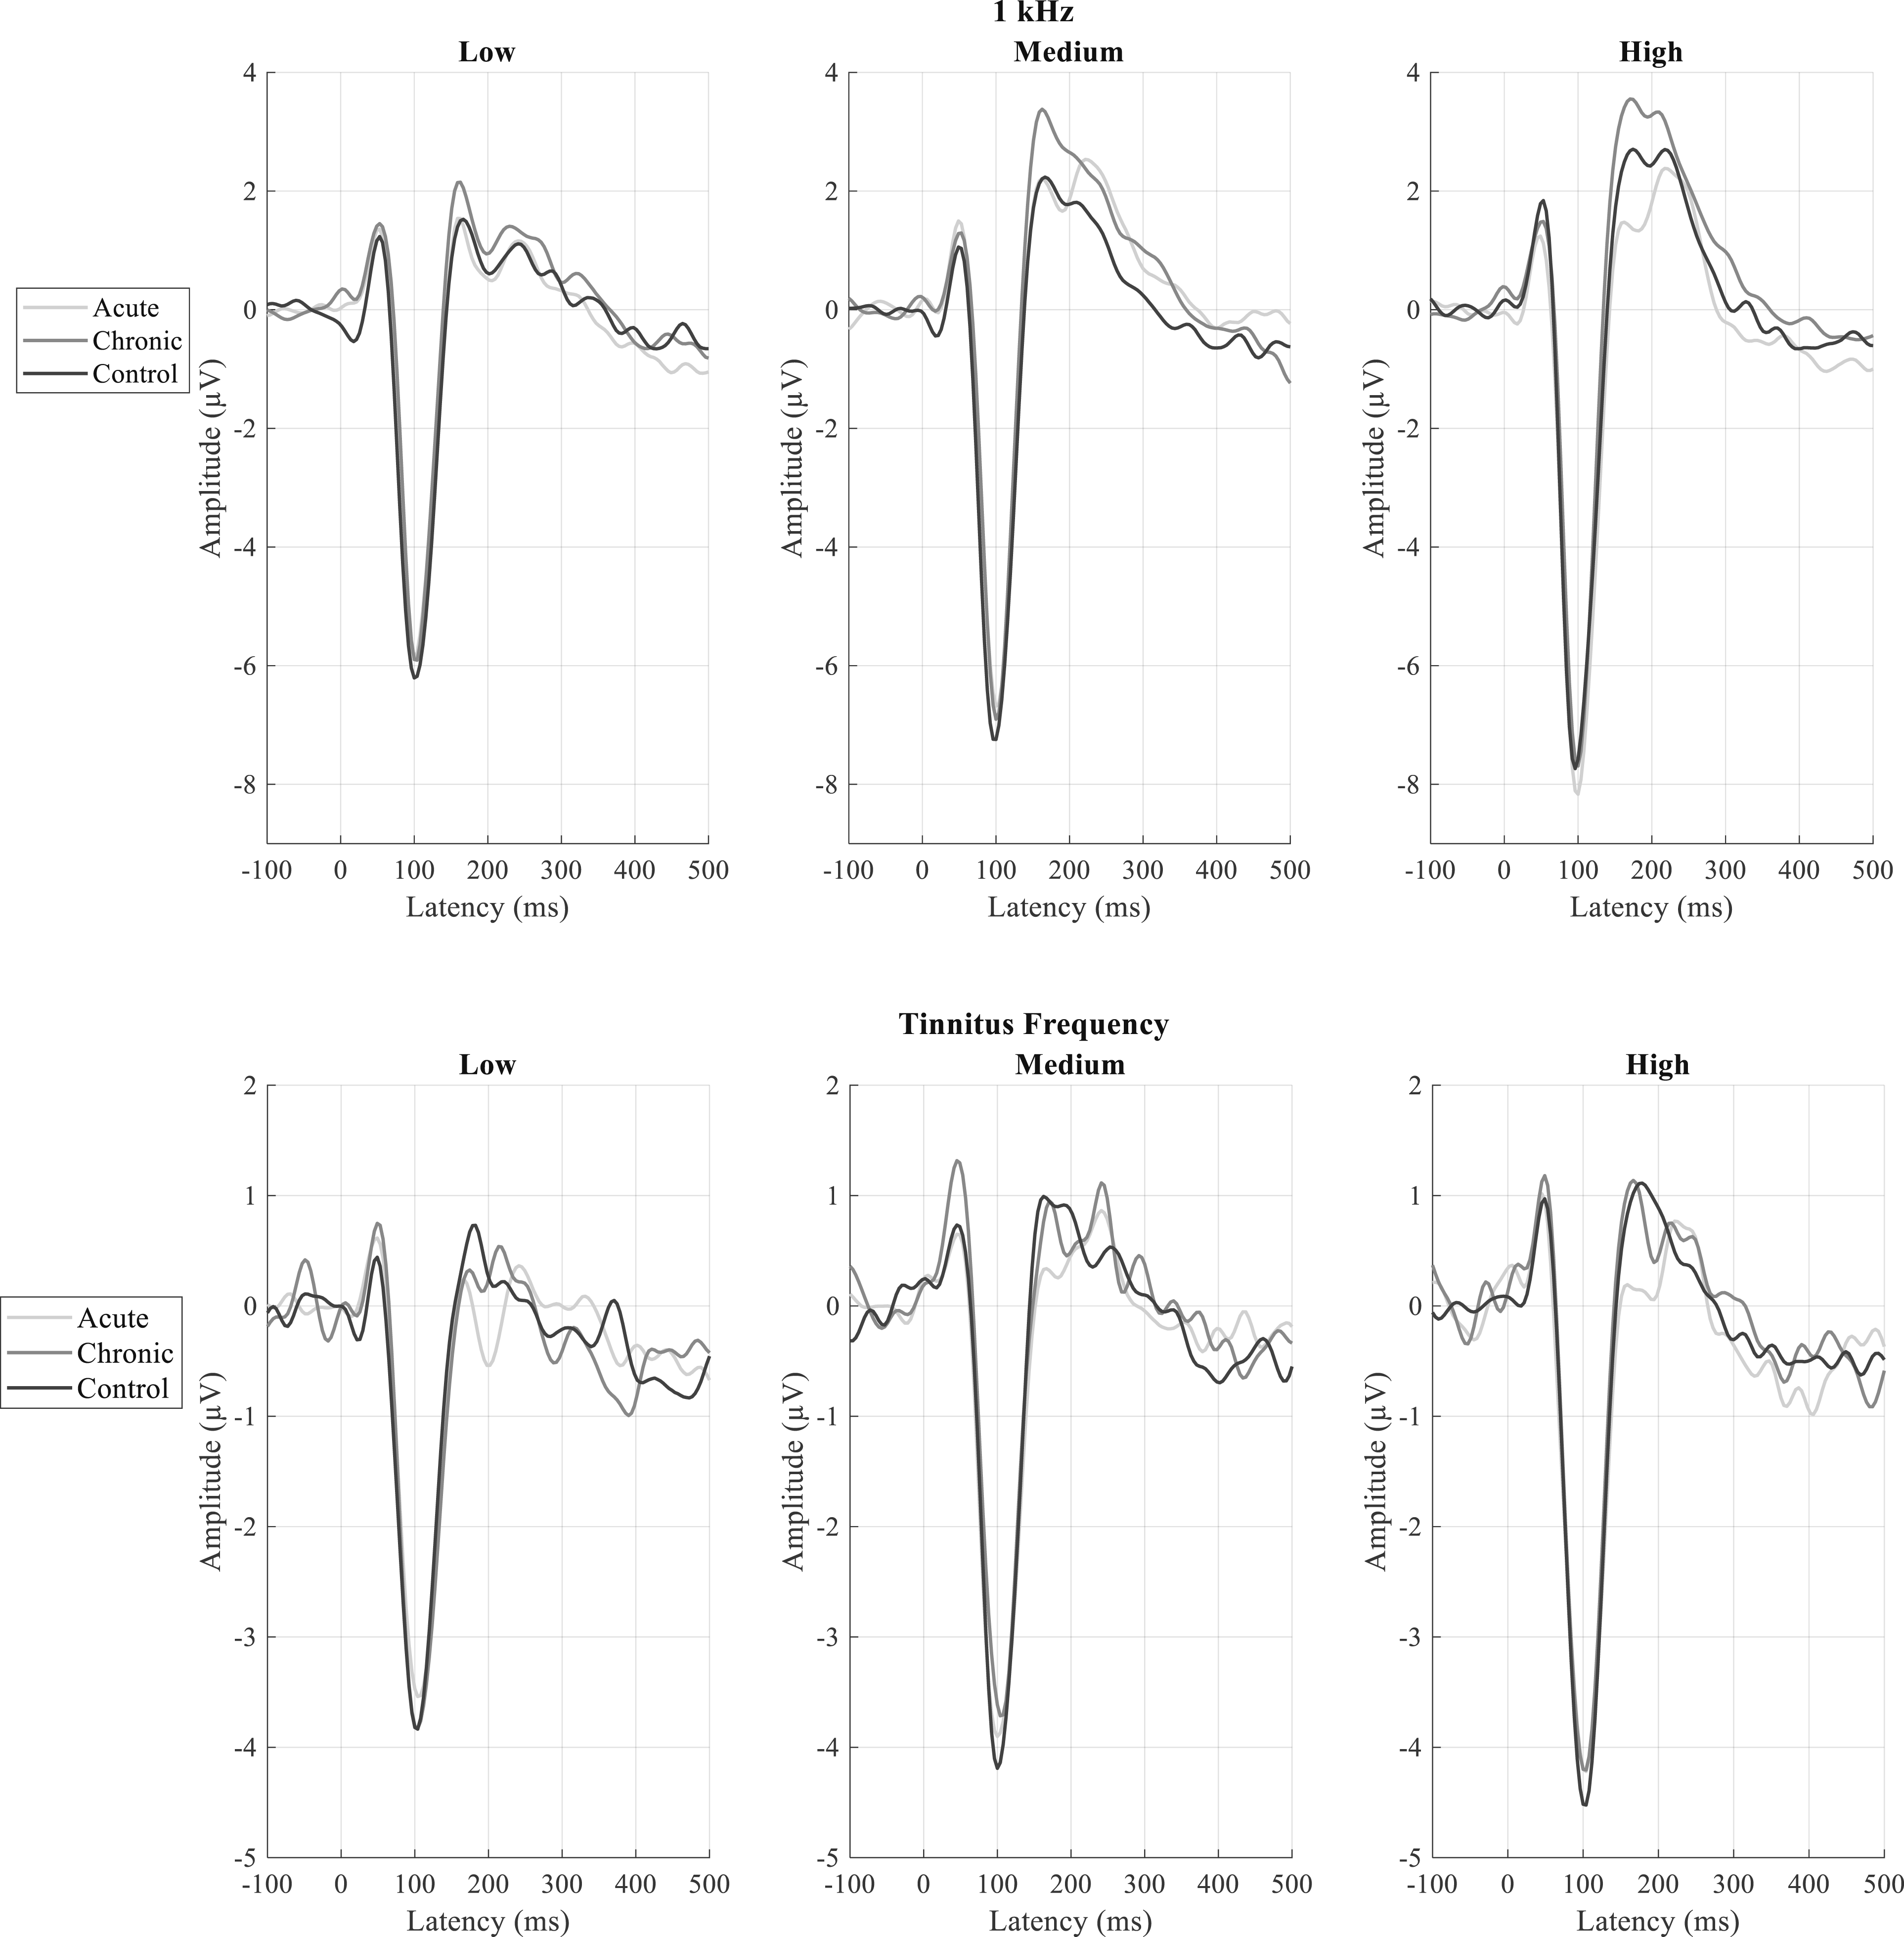

Stimulus and Amplitude (N1-P2) Dynamic Ranges
Whilst our primary outcome measure was IDAEP slope at 1 kHz (i.e., amplitude dynamic range divided by stimulus dynamic range), we also analysed these dynamic range variables separately.
Longitudinally, the group mean stimulus dynamic range did not change between Acute and Post-acute stages (1 kHz: t(12) = 0.482, p = 0.639; tinnitus frequency: t(10) = 0.036, p = 0.972), and no significant differences were found for the amplitude dynamic range (1 kHz: t(12) = -1.099, p = 0.293; tinnitus frequency: t(10) = -1.873, p = 0.09).
Cross-sectionally, there were statistically significant effects of group on the stimulus dynamic range for 1 kHz (F(2,61) = 3.346, p = 0.042). Due to differences in stimulus dynamic range, we carried out an analysis of covariance for IDAEP slope with stimulus dynamic range as a covariate and found no significant effect when comparing the Acute, Chronic, and Control groups cross-sectionally (F (2,60) = 1.608, p = 0.209).
Relationship Between Tinnitus Distress and IDAEP Slope
Considering the presence of statistically significant differences between Acute and Post-acute Tinnitus longitudinally for IDAEP slope at 1 kHz, we further aimed to explore the relationship between tinnitus distress (THI) and IDAEP slope, as tinnitus distress had a trend towards longitudinal reduction. A Pearson correlation analysis between tinnitus distress and IDAEP slope including both Acute and Chronic Tinnitus participants revealed a statistically significant negative correlation (r(41) = -.356, p= .019). However, a significant correlation between the Acute-to-Post-acute change in IDAEP slope and the Acute-to-Post-acute change in tinnitus distress was not observed (r(9) = .185, p = .586). Figure 5 illustrates the relationship between tinnitus distress and IDAEP slope. Relationship between Tinnitus Distress and IDAEP slope across both Acute-Chronic and Acute-Post Acute groups. THI indicates Tinnitus Handicap Inventory and there was statistically significant negative correlation between tinnitus distress and IDAEP slope across Acute-Chronic Tinnitus groups
Relationship Between IDAEP Slope and Tinnitus Loudness
We also further explored if there was a relationship between IDAEP slope and tinnitus loudness. A Pearson correlation between the Acute-to-Post-acute change in IDAEP slope and the Acute-to-Post-acute change in tinnitus loudness (psychoacoustically matched) was not observed (r(11) = 0.345, p = .248). Similarly, correlation analysis cross-sectionally between tinnitus loudness and IDAEP slope including both Acute and Chronic Tinnitus participants revealed no correlation (r(45) = 0.228, p = 0.132). Similarly Figure 6 illustrates the relationship between tinnitus loudness and IDAEP slope. Relationship between Tinnitus Loudness and IDAEP slope across both Acute-Chronic and Acute-Post Acute groups. dBSL indicates decibel sensation level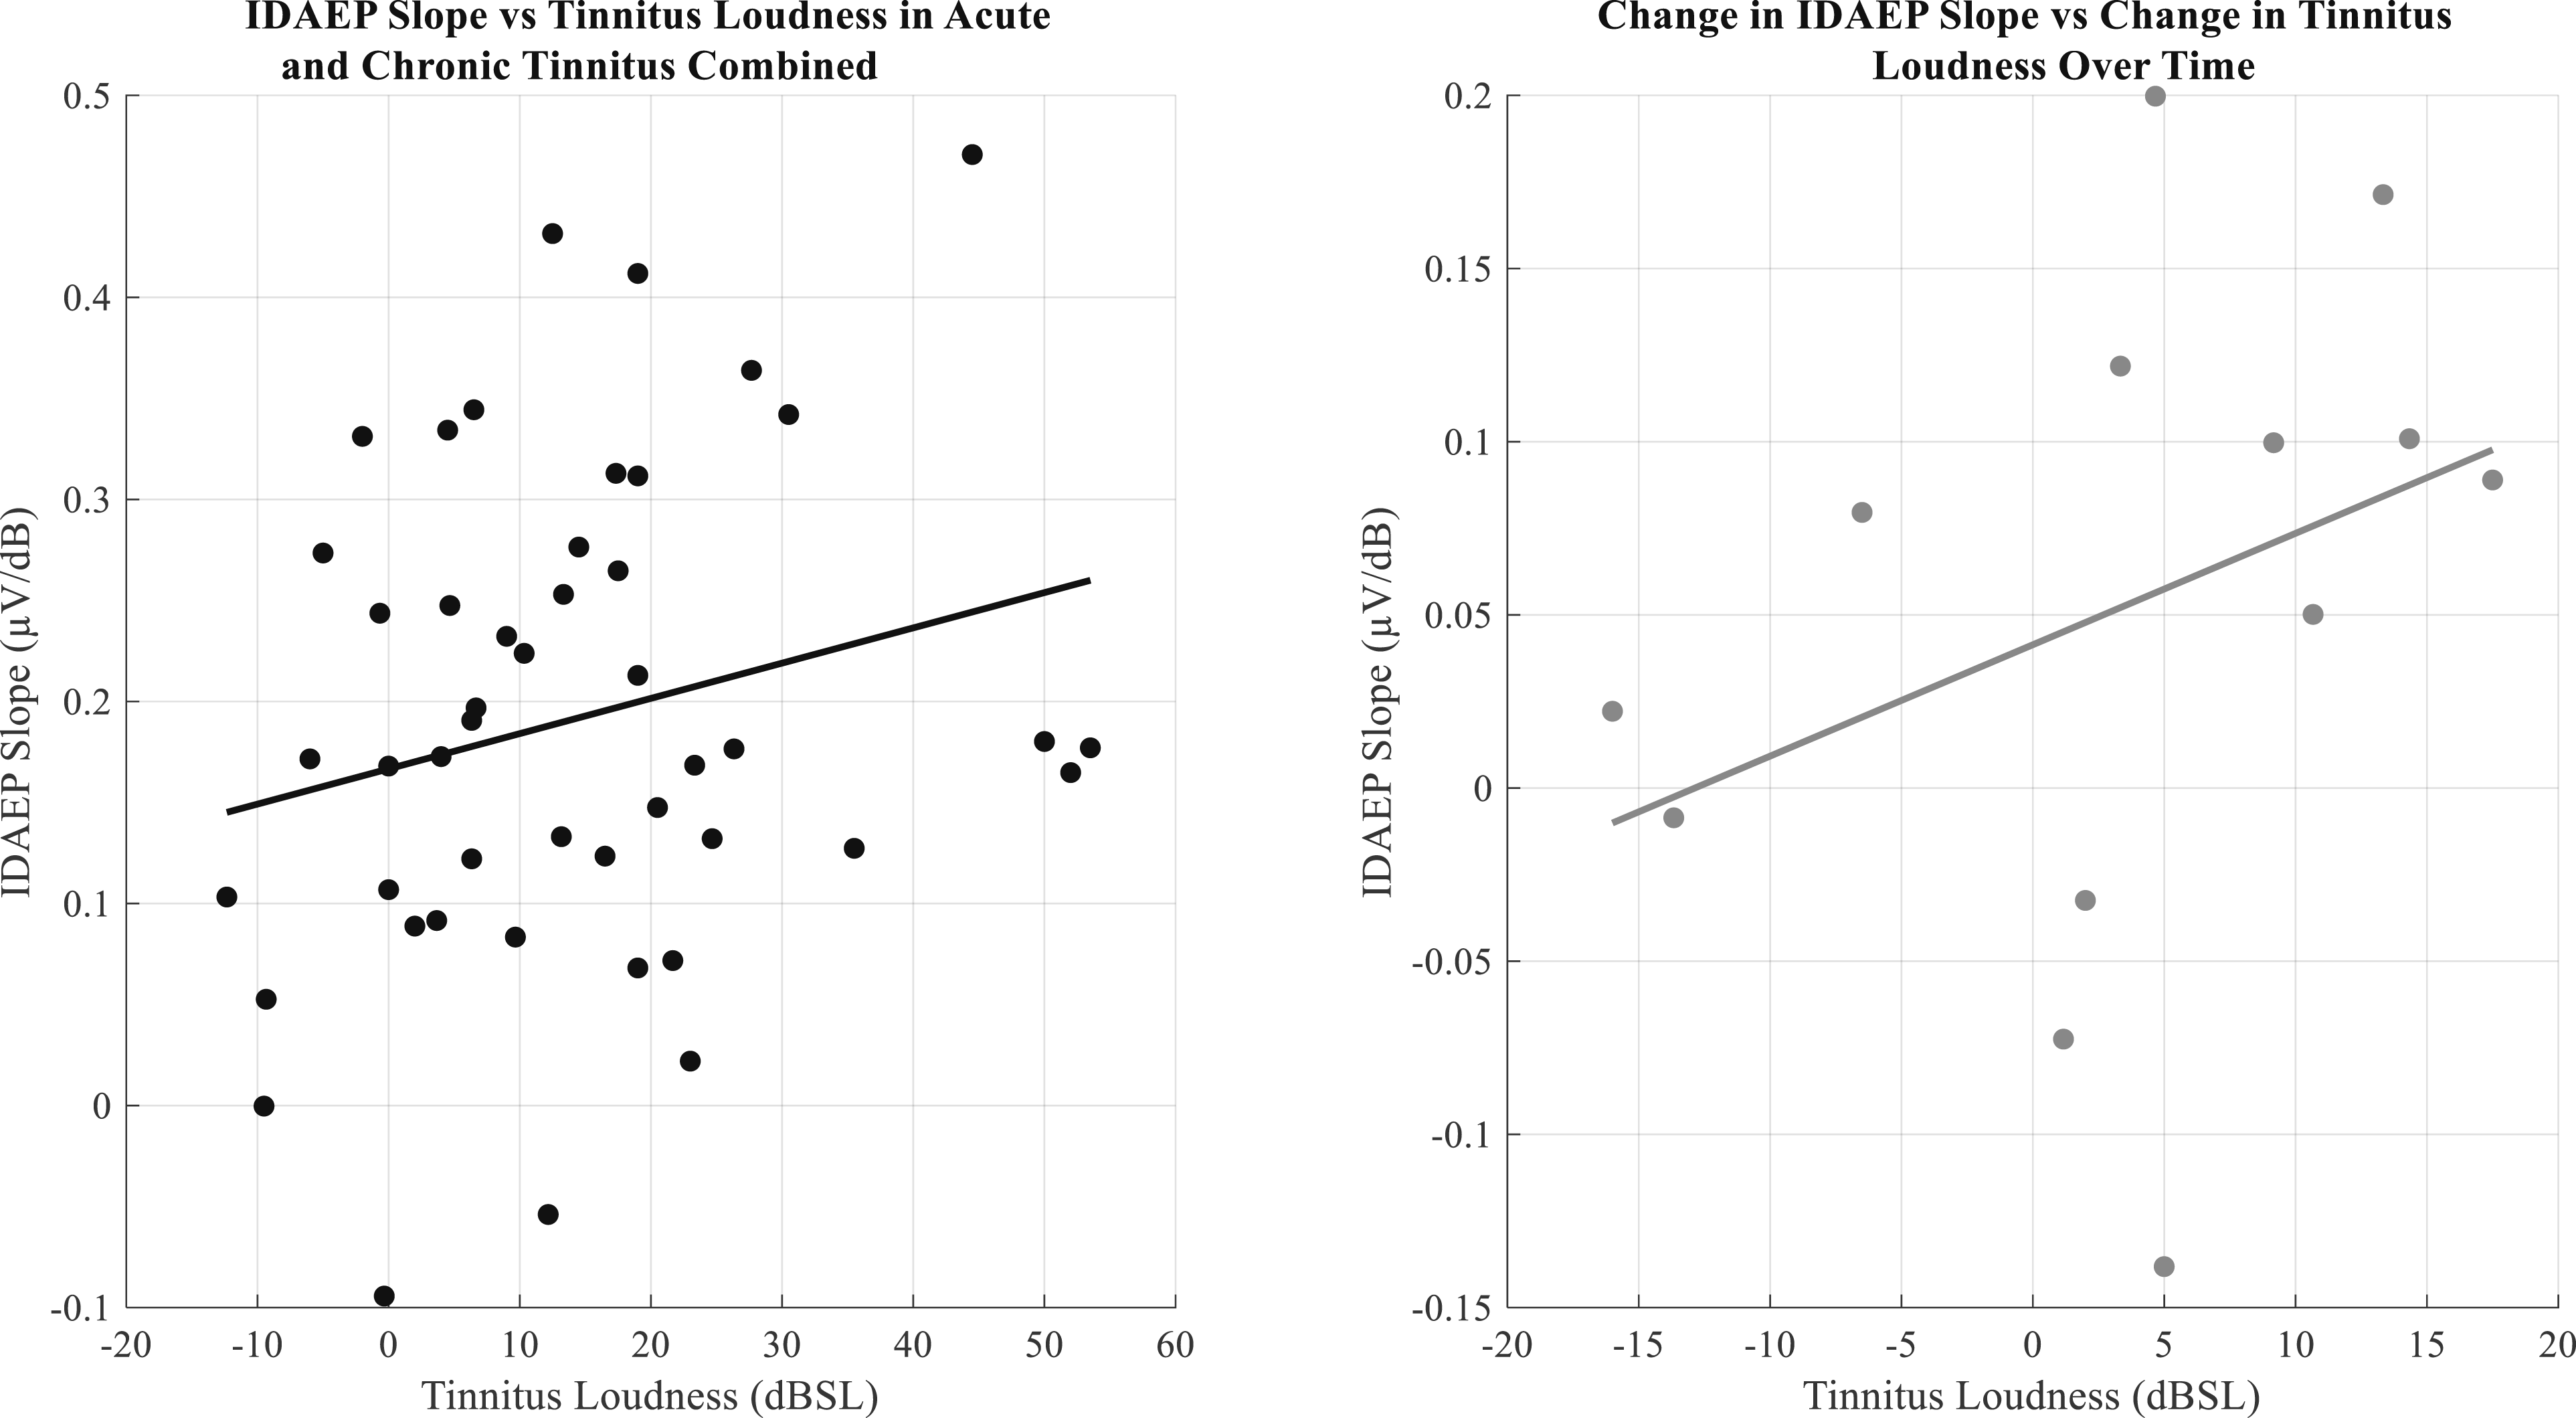
Relationship Between IDAEP Slope and Stimulus Dynamic Range
An additional exploratory analysis was conducted for the 1 kHz and tinnitus stimulus frequencies to determine the association between IDAEP slope and stimulus dynamic range (SDR). This was a control analysis, to ensure that any differences in IDAEP slope between groups were not due to differences in stimulus dynamic range between groups. Additionally, we were interested to determine whether different stages of tinnitus were associated with differences in dynamic range adaptation for IDAEP, which might manifest as different relationships between dynamic range and IDAEP slope.
A non-significant trend was found for the Acute tinnitus group (Correlation: r(25) = -0.356, β = -.0081, p = .068), and no correlation was observed for the chronic tinnitus group (Correlation: r(18) = 0.086, regression: β = .0014, p = .717), or for the non-tinnitus controls (Correlation: r(15) = 0.156, β = .0032, p = .485). There was no significant correlation for all groups across tinnitus frequency and no significant correlations in both Acute and Post Acute Tinnitus for 1 kHz and tinnitus frequency (all p-values > 0.05). For further details, please refer to Figure 7. Relationship between slope and stimulus dynamic range across groups and frequencies. SDR indicates Stimulus Dynamic Range. A non-significant negative trend was noted for Acute Tinnitus (upper left) at 1 kHz. The second Acute Tinnitus group (second-from-right) is the subset who returned for Post-Acute follow-up (right)
Discussion
IDAEP Reduces Over the Acute-To-Chronic Transition in Tinnitus
We hypothesized that the auditory sensitivity is maximal around the tinnitus onset and reduces during subsequent chronification due to habituation and recalibration as proposed by Noreña and Farley (2013). Their model suggests that while elevated central gain begins as an acute compensatory response to peripheral sensory loss, this hyperactivity eventually stabilizes into a permanent state through autonomous, self-sustaining neural networks that no longer require the initial high gain to maintain firing. This persistent network state might involve altered predictive mechanisms described by Sedley et al. (2016), where the chronic tinnitus signal is integrated into the brain’s top-down, default auditory predictions. Once the central nervous system shifts its baseline expectations to anticipate this internal sound, the auditory cortex treats the tinnitus as a permanent, expected element of the acoustic environment. Our hypothesis was further informed by recent evidence indicating that both the perceived intensity and the associated distress of tinnitus typically habituate as part of the condition’s natural history. (Umashankar et al., 2025). Consistent with our hypothesis, we observed an elevated IDAEP slope at 1 kHz in individuals with acute tinnitus, which subsequently diminished during the post-acute stages. As an objective marker of auditory sensitivity, this heightened IDAEP slope appears to peak near onset; its later decline during chronification may reflect a return to baseline state after a temporary period of increase leading to tinnitus onset, or processes such as habituation, sensory recalibration, or a reduction in auditory prediction errors.
However, we acknowledge that the cross-sectional differences between groups were non-significant, and therefore the direction of difference from controls in acute tinnitus is less certain than the longitudinal change within the group.
While prior research on event-related potentials in acute tinnitus is lacking, our recent investigation into subjective sensitivity which shared a subset of participants with the present study found no significant differences between acute and post-acute stages (Umashankar et al., 2025). Specifically, subjective markers of central gain, such as CLS slopes and hyperacusis questionnaire scores, remained stable across both groups. This distinction highlights the importance of distinguishing specific aspects and indicators of gain, and their individual relationships to tinnitus.
IDAEP and (Tinnitus) Distress
As an alternative or additional possibility to IDAEP being an indicator of processes initially causing tinnitus, we considered whether IDAEP reflects the degree of distress associated with tinnitus, because both tinnitus distress (THI and TFI) and IDAEP slope have now been found to decrease over time in Post Acute Tinnitus. IDAEP changes might have simply been explicable as correlates of (changing) tinnitus distress. However, our findings of no correlation between change in tinnitus distress and change in IDAEP slope across the longitudinal data of Acute and Post Acute Tinnitus, makes this unlikely to be an explanation for the longitudinal changes in IDAEP at a group level. Contrary to expectations, our findings within the combined acute and chronic tinnitus groups revealed a significant negative correlation between IDAEP slope and tinnitus-related distress, which demonstrates an unexpected effect in the opposite direction of what was anticipated. We are cautious to avoid overinterpretation of this correlation result in isolation, especially as it was an exploratory analysis. Although literature on tinnitus and IDAEP is limited, prior studies in depressive disorders also report increased IDAEP in affected individuals (Kangas et al., 2024; Lee et al., 2014). This divergence highlights the need for further investigation, particularly into the directionality of IDAEP changes in relation to tinnitus distress. Longitudinal studies, especially in individuals with acute tinnitus and escalating distress, might help to elucidate these dynamics over time (beyond 6 months), and would complement this study, in which the group showed a reduction in distress over time.
Relative Lack of IDAEP Differences at High Frequencies
The tinnitus frequency did not exhibit a strong mean IDAEP slope, and in some participants, it was zero or negative. This could in part be because of the individuals’ lower stimulus dynamic ranges at the tinnitus frequency, due to the presence of hearing loss at high frequencies in all our groups. Due to the limits of sound intensities possible with our equipment at high frequencies affected by hearing loss, there were some participants in whom we could not determine their ULL at the tinnitus frequency; stimulus frequency in these participants was thus limited by technical possibility rather than ULL. Finally, as IDAEP to high frequency stimuli is not well-studied in the literature, it may simply be the case that the N1-P2 complex at high frequencies is less intensity-dependent. However, it is notable that the non-significant trends observed, cross-sectionally and longitudinally, were in keeping with results observed for 1 kHz stimuli.
The Need to Explore Serotonergic Functions in Tinnitus
The observed changes in IDAEP slope may also carry implications for central neuromodulation. Because the IDAEP slope has been observed to be inversely correlated with central serotonergic activity (Carrillo-de-la-Peña et al., 2006), our results suggest that acute tinnitus may involve a temporary hyposerotonergic state that attenuates as the condition progresses. This aligns with animal models suggesting that altered serotonin levels can increase the sensitivity of the subcortical auditory pathway, potentially contributing to tinnitus generation (Tang & Trussell, 2017). Given the lack of human studies measuring central serotonergic function in early tinnitus, our IDAEP findings provide a preliminary basis for investigating neuromodulatory shifts during the transition from acute to chronic tinnitus. Such research could be vital for identifying early therapeutic opportunities that differ from treatments for established chronic tinnitus.
Dynamic Range Adaptation in Acute Tinnitus Warrants Future Study
It has been argued that tinnitus may be at least partly independent and distinct from central gain, a commonly proposed mechanism for tinnitus and hyperacusis pathophysiology (Knipper et al., 2013; Sedley et al., 2016; Zeng, 2013). Central gain is essentially a vertical scaling of a neuron’s input-output function and may be argued to relate more to hyperacusis than tinnitus (Zeng, 2013). Our exploratory investigation of the relationship between IDAEP slope and stimulus dynamic range, while not quite significant, alludes to the possibility that there might be a more nuanced relationship to tinnitus; the onset period of tinnitus could, for instance, be associated with increased dynamic range adaptation, which can be considered a horizontal scaling or shift of a neuronal system’s input-output function to match the distribution of input stimulus intensities. We observed a non-significant trend of negative correlation between IDAEP slope and stimulus dynamic range, which was specific to the Acute tinnitus group. This pattern is consistent with dynamic range adaptation, whereby neurons respond more sensitively (i.e., show greater IDAEP) to smaller dynamic ranges, and less sensitively (i.e., lesser IDAEP) to larger stimulus dynamic ranges. This preliminary finding raises the possibility of an increase in dynamic range adaptation in acute tinnitus, which, if confirmed in future studies, could indicate enhanced adaptive mechanisms associated with the onset of this condition. Consistent with this possibility, Diesch and Hassel-Adwan (2017) explored dynamic range adaptation in their study, where they used different amplitude modulated tones in both ascending and descending runs to compare tinnitus with control participants. They found that tinnitus individuals had stronger undershoot (strong decrease in amplitude with decrease in stimulus) and weaker overshoot (small increase in amplitude with increase in stimulus). In keeping with this, Yukhnovich et al. (2024) also observed that, once hyperacusis had been excluded, tinnitus was associated with larger mismatch negativity (MMN) responses to downward intensity deviants, which was best explained by an altered state of adaptation. Very limited literature has directly searched for the presence of dynamic range adaptation in tinnitus, and our tentative results indicate that this area should further be explored. However, as the finding was non-significant, we present this as simply a hypothesis for future study rather than a conclusive finding. We note one additional limitation of our findings in this regard, which is that multiple dynamic ranges were not contrasted within individuals, which should be a priority for future studies with each individual presented with stimulus sets from multiple dynamic ranges.
The Need to Explore Tinnitus Chronification Beyond Auditory Sensitivity
Our current results demonstrate the mechanisms of habituation or normalisation through a progressive reduction in the intensity dependence of auditory evoked potentials (IDAEP) slope over time, marking the transition from acute to post-acute tinnitus. However, a critical observation emerges despite the normalisation of auditory sensitivity, the percept of tinnitus does not cease, it persists. As Sedley et al. (2016) noted, the mechanisms driving tinnitus generation may be fundamentally distinct from those maintaining its persistence. In this study, heightened auditory sensitivity observed near onset, reflected by an increased IDAEP slope, may partially explain the initial generation of the phantom sound, but not the central neuroplastic mechanisms responsible for its persistence, which still require a more robust understanding.
Limitations
Despite attempts to account for several confounding factors that pose challenges in tinnitus research, one method to validate the findings is to conduct a longitudinal study from acute to chronic tinnitus, aiming to elucidate tinnitus processes and examine its evolution over time, with this being achieved in the current research. Whilst this approach can be powerful, high levels of attrition were a limitation, perhaps as tinnitus may cease to be a priority for people who are well-habituated.
A significant challenge we have encountered is determining the optimal presentation levels for an evoked potential study especially with respect to tinnitus frequency stimuli. We developed approaches to partially account for variables such as hearing threshold variations, recruitment levels, and hyperacusis by providing tailored presentation levels to the individual’s dynamic range. All tinnitus research utilising stimulus presentation in tinnitus encounters this issue, and there is no established gold standard method for controlling it. We have employed various methods in both experimental design and analysis to mitigate the impact, yet we recognise that these factors may still influence the results.
Conclusion
We report the novel finding that the IDAEP slope, a marker of auditory sensitivity and central gain, significantly decreases during the transition from acute to chronic tinnitus. Our data suggest that this sensitivity may be initially elevated during the acute stage before returning toward normal levels as the condition becomes chronic. Future research should consider acute tinnitus, as well as its enduring long-term correlates, which we have demonstrated here can look very different. Future studies should also specifically assess central serotonergic function and dynamic range adaptation in neuroimaging and IDAEP paradigms respectively, to further elucidate the mechanism of tinnitus generation and persistence.
Footnotes
Acknowledgment
The current work is a part of the funded project “Unravelling the neurobiological basis of tinnitus by studying its initial onset and subsequent chronification” jointly funded by the Royal National Institute for Deaf People (RNID) and Tinnitus UK (formerly the British Tinnitus Association), with additional contribution from the Wellcome Trust. We would like to extend our gratitude to the funders for their generous support in funding this research. We further would like to thank all our participants who took part in this study. During the preparation of this work the author(s) used ChatGPT/Gemini AI to fine tune Matlab coding for the aesthetic formatting of images and for grammatical accuracy but not for the processing of data itself. Aside from this, the author(s) made no use of AI, and take(s) full responsibility for the content of the publication.
Ethical Considerations
This study was approved by the Newcastle University Ethics Committee Approval Number 23242/2022. All procedures performed in this study were in accordance with the ethical standards of the institutional research committee and with the 1964 Helsinki Declaration and its later amendments or comparable ethical standards.
Consent to Participate
Written informed consent was obtained from all individual participants included in the study.
Funding
The authors disclosed receipt of the following financial support for the research, authorship, and/or publication of this article: This work was supported by the Royal National Institute for Deaf People (RNID), Tinnitus UK, and the Wellcome Trust.
Declaration of conflicting interests
The authors declared no potential conflicts of interest with respect to the research, authorship, and/or publication of this article.
Data Availability Statement
The datasets generated and/or analyzed during the current study are available at https://doi.org/10.25405/data.ncl.29803400.(![]() )
)