
Abstract
Speech perception relies critically on the processing of spectro-temporal modulations (STMs), yet the mechanisms supporting STM perception and their role in explaining individual variability remain incompletely understood. This study employed a reverse-correlation paradigm, previously used for STM detection, to investigate how listeners discriminate between upward- and downward-moving STMs of identical temporal and spectral rates. Normal-hearing participants completed the task under three surround conditions: (i) no surround sound, (ii) surround sound consisting of the upward-moving STM and (iii) surround sound consisting of the downward-moving STM. Each stimulus was perturbed with structured spectro-temporal noise, from which perceptual kernels were derived. The data showed that listeners primarily weighted upward-moving targets, showing limited evidence of simultaneous monitoring of both directions. Sensitivity was selectively reduced in the downward-moving surround condition, suggesting orientation-specific interference. Simulations with a modulation filterbank model under different configurations, as well as behavioural performance differences across different experimental conditions, further supported the conclusion that participants relied predominantly on upward-target templates, with phase sensitivity additionally playing a critical role in replicating behavioural patterns. Nonetheless, substantial variability was observed in individual perceptual kernels that could not be captured by the model in its normal-hearing configuration. Overall, the results provide new insights into the mechanisms of STM discrimination and demonstrate the utility of reverse-correlation approaches for evaluating auditory models and probing perceptual decision strategies.
1. Introduction
Much research has focused on the mechanisms supporting speech intelligibility, particularly in noisy and reverberant environments where individuals often struggle. One approach has been to decompose speech signals into constituent acoustic features, in order to identify cues most relevant for understanding. Among these, amplitude modulations (AM), or envelope fluctuations, have received particular attention. Speech with severely degraded spectral content but preserved envelope fluctuations can remain highly intelligible (Dorman et al., 1997; Shannon et al., 1995), whereas degradation of the temporal envelope substantially impairs intelligibility (Drullman et al., 1994a, 1994b; Apoux & Bacon, 2008). Psychoacoustic studies have shown that the auditory system is highly sensitive to AM and exhibits modulation frequency selectivity (Dau et al., 1997; Kohlrausch et al., 2000; Regev et al., 2023, 2024; Viemeister, 1979), findings that are further supported by neurophysiological evidence (Joris et al., 2004; Joris & Yin, 1992; Langner & Schreiner, 1988). These results have motivated auditory models incorporating modulation filterbanks (Dau et al., 1997; Jepsen et al., 2008; Relaño-Iborra et al., 2019, for a review, see Relaño-Iborra and Dau, 2022 ) which account for average outcomes in psychoacoustic masking paradigms and speech intelligibility experiments. However, despite the central role of AM in speech perception, individual measures of AM sensitivity or selectivity have generally failed to explain the substantial variance observed in speech-in-noise performance beyond that attributable to audibility. One likely reason is that AM tasks do not capture the auditory system’s ability to integrate envelope fluctuations across frequency channels - an essential feature of speech.
More recently, sensitivity to spectro-temporal modulations - the joint fluctuations of sound energy across spectral and temporal dimensions - has emerged as a particularly promising predictor of supra-threshold hearing difficulties. While spectral and temporal modulations have often been studied separately, STMs provide a unified framework into which complex signals such as speech can be decomposed (Singh & Theunissen, 2003). STMs are typically described by their spectral ripple rate (cycles/octave, c/o) and temporal modulation rate (in Hz). Speech relies heavily on specific STM ranges: intelligibility is primarily conveyed by temporal modulations between 1 − 7 Hz and spectral modulations below
While STM detection thresholds show strong potential for clinical applications, the mechanisms underlying STM perception and their link to speech intelligibility remain incompletely understood. STM sensitivity has been associated with both frequency selectivity and temporal fine structure (TFS) processing, often measured through frequency modulation (FM) detection, (Bernstein et al., 2013; Mehraei et al., 2014; Miller et al., 2018). However, observed patterns across STM conditions are not fully explained by these factors (Mehraei et al., 2014). The role of TFS in monoaural FM detection is itself debated (Shamma & Lorenzi, 2013; Whiteford et al., 2020; Whiteford & Oxenham, 2015), as is its contribution to age-versus hearing-related deficits (Moore et al., 2012; Sheft et al., 2012) and to speech perception. Moreover, large inter-individual differences in STM sensitivity have been reported even among NH listeners (Oetjen & Verhey, 2015, 2017; Ponsot et al., 2021, 2025), but it remains unclear whether these differences primarily reflect variation in spectral resolution, temporal resolution, or TFS encoding. These findings highlight the need for further research to clarify the perceptual cues and mechanisms underlying STM perception. In particular, understanding the sources of individual variability is critical both for explaining supra-threshold hearing deficits and for guiding more precise, personalised diagnostic and rehabilitative approaches.
To address these questions, recent work has applied a behavioural reverse-correlation technique to characterise the mechanisms underlying STM detection in both normal-hearing and hearing-impaired listeners (Ponsot et al., 2021). Reverse-correlation is a powerful tool for probing perceptual strategies in psychoacoustic tasks (Abbey & Eckstein, 2006; Ahumada & Lovell, 1971; Murray, 2011; Neri & Levi, 2006). By introducing random noise perturbations into the stimulus and analysing their influence on trial-by-trial responses, the method reveals which features drive perception. Aggregating these effects yields a perceptual kernel or classification image, highlighting the stimulus cues most relevant for the task. Unlike classical approaches that target performance at threshold, reverse-correlation paradigms operate at supra-threshold levels, where different mechanisms may come into play. Although used more extensively in vision, reverse correlation has previously been applied to auditory domains such as tone-in-noise detection (Ahumada et al., 1975), loudness perception (Ponsot et al., 2013, 2016), temporal modulation detection (Joosten et al., 2016; Varnet & Lorenzi, 2022), auditory motion perception (Park & Fine, 2023) and speech perception (Varnet et al., 2013, 2015).
Ponsot et al. (2021) applied this reverse correlation technique to an STM detection task in normal-hearing and hearing-impaired listeners. Participants were tasked to detect a target STM defined by a temporal rate of f t = 7.1 Hz and a spectral rate of f s = 1 c/o, imposed on a noise carrier. On each trial, the stimulus was perturbed with structured noise, constructed as a weighted sum of 12 STM components corresponding to rotations along an orientation axis in the spectro-temporal space. By analysing how the energies of these components influenced trial-by-trial responses, the authors could probe different regions of the modulation power spectrum (MPS). This approach provided detailed insights into listeners’ spectro-temporal selectivity and tuning. The resulting perceptual kernels were well captured by an auditory model based on a modulation filterbank (MFB) (Dau et al., 1997; King et al., 2019). Importantly, group differences between young normal-hearing (yNH) and older hearing-impaired (oHI) listeners could, on average, be accounted for by an approximately threefold increase in auditory filter bandwidth in the oHI group.
Interestingly, Ponsot et al. (2021) found limited evidence for upward/downward directional selectivity in the spectro-temporal space during the detection task, consistent with the idea that spectral and temporal dimensions are processed separately. STMs are inherently directional, corresponding to either upward- or downward-moving ripples. In a detection task, however, listeners can rely on separable spectral and temporal encoding strategies that suffice to identify the presence of modulation, even if directionality is not explicitly encoded. By contrast, discrimination of STM directionality requires either a joint encoding mechanism or integrative, across-frequency analysis. If listeners were monitoring spectral and temporal modulation channels independently, upward and downward ripples with the same modulation rates would produce identical activation patterns within each channel, making discrimination impossible. Yet, upward and downward STMs are perceptually discriminable (Denham, 2005), and some studies have even suggested that discrimination of STM direction could serve as a diagnostic tool for assessing cochlear tuning (Narne et al., 2020).
Several studies have sought to characterise directional encoding of STMs using psychophysical approaches. Sabin et al. (2012) examined perceptual learning for modulation depth discrimination. Listeners were trained on one of three conditions: spectral-only modulation, temporal-only modulation, or upward-moving STM. Performance was then evaluated across all three tasks, both before and after training. Learning effects were highly specific: improvement occurred only in the trained condition, with no transfer to untrained conditions. Notably, listeners trained on upward-moving STM did not improve on downward-moving STM, suggesting that learning enhanced a direction-specific mechanism rather than a general modulation processing strategy. Complementary evidence was provided by Oetjen and Verhey (2015, 2017), who measured psychophysical modulation masking patterns. They found the strongest masking when target and masker shared directionality as well as temporal and spectral modulation rates, consistent with a directionally sensitive encoding mechanism. More recently, Conroy et al. (2022) used a forward-masking paradigm to further probe directional selectivity. Detection thresholds for upward-moving STMs were measured following four different maskers: temporal-only, spectral-only, upward STM, and downward STM. As in the simultaneous masking results of Oetjen and Verhey (2017), the greatest masking occurred when the masker fully matched the target in rate and direction, providing converging evidence for a dedicated directional encoding mechanism.
While previous studies have assessed STM directionality indirectly - through learning effects or masking patterns - the present study takes a more direct approach. Listeners were explicitly tasked with discriminating between upward- and downward-moving STMs of identical temporal and spectral rates. This design allowed us to probe the perceptual strategies underlying directional discrimination using the reverse-correlation framework developed by Ponsot et al. (2021) for STM detection. As in that work, each stimulus was perturbed with spectro-temporal noise on every trial, enabling analysis of how individual STM components influenced responses. The resulting perceptual kernels reveal the cues and decision strategies employed to distinguish between the two directional patterns. In addition, we investigated how STM directionality is encoded in the presence of surrounding modulation. This question was motivated by work in the visual domain. While strong physiological and perceptual evidence exists for directionally selective motion mechanisms in vision (Adelson & Bergen, 1991; Ringach, 1998), the presence and organisation of analogous direction-tuned mechanisms for spectro-temporal modulation in audition remain far less established. Here, we explore whether similar principles, such as orientation-like selectivity and contextual modulation, as shown in vision (Bhat et al., 2018; Neri, 2014; Neri & Levi, 2009; Yazdani et al., 2015), might also operate in the spectro-temporal domain. The psychophysical findings summarised above suggest that directional selectivity may operate at a perceptual level, but far less is known about how such putative mechanisms might interact across frequency regions. In vision, surround paradigms have been used to probe interactions between motion-tuned detectors across space, leading to models of same-direction surround inhibition (Neri & Levi, 2009). By analogy, we introduced ”surround” STM conditions to test whether STM processing in one time-frequency region is influenced by co-occurring STM of the same or opposite direction in neighbouring regions. This can be viewed as a spectro-temporal extension of modulation detection interference (MDI), which examines how temporal modulation in one frequency band affects processing in another (Oxenham & Dau, 2001; Yost & Sheft, 1989). The surround conditions implemented here therefore serve as an initial exploratory step toward characterising potential interactions among STM-tuned processes across frequency regions. Finally, we evaluated whether a modulation filterbank model (Dau et al., 1997), which includes modulation phase sensitivity but no explicit joint spectro-temporal mechanism, could account for the discrimination data. This model successfully captured STM detection results in Ponsot et al. (2021).
2. Methods
2.1. Participants
Twelve listeners were recruited for the study; however, three were excluded because they were unable to perform the task even at very high signal-to-noise ratios (SNRs). Consequently, data were collected for nine participants aged 21-33 years (mean age = 26.8 years, 6 female). The task was performed monaurally and all participants had clinically normal hearing audiometric thresholds < = 20 dB HL in the range from 250 - 8000 Hz in the tested ear. All subjects gave their informed consent prior to the experiment in compliance with the Declaration of Helsinki and were paid for their participation.
2.2. Stimuli
Reverse correlation studies typically rely on perturbing noise traces presented on each trial to determine how the specific features of the noise influence the listener’s response. In this study, the perturbing noise and stimuli are constructed as described in the STM detection study by Ponsot et al. (2021). The ripple noise is generated by summing 12 elementary ripples with distinct spectral and temporal modulation rates. These rates correspond to rotations of 15° around the target ripple combination with a temporal rate of 7.1 Hz and a spectral modulation rate of ± 0.71 c/o, where + denotes a downward moving ripple, and − an upward moving ripple. The resulting rotations sample the orientation axis of the MPS and yield the following sets of spectro-temporal modulation pairs (temporal rate in Hz, spectral rate in c/o): (0, 1), (2.6, ±0.97), (5, ±0.87), (7.1, ±0.71), (8.7, ±0.50), (9.7, ±0.26), (10, 0). These combinations encompass regions critical for speech intelligibility (Elliott & Theunissen, 2009; Venezia et al., 2019), and include upward- and downward-moving ripples, a purely spectral ripple, and a purely temporal ripple (see Figure 1, A ). Each ripple j was assigned a random level k
j
, drawn from a normal distribution (SD = 3 dB), and a pseudo-random starting phase, selected from [0, π/2, π, 3π/2], in order to avoid phase-related cues that might facilitate performance. Because this pseudo-random selection already prevented listeners from using phase as a cue, full randomization of phase values was not necessary. The ripples were subsequently summed to create a composite noise envelope 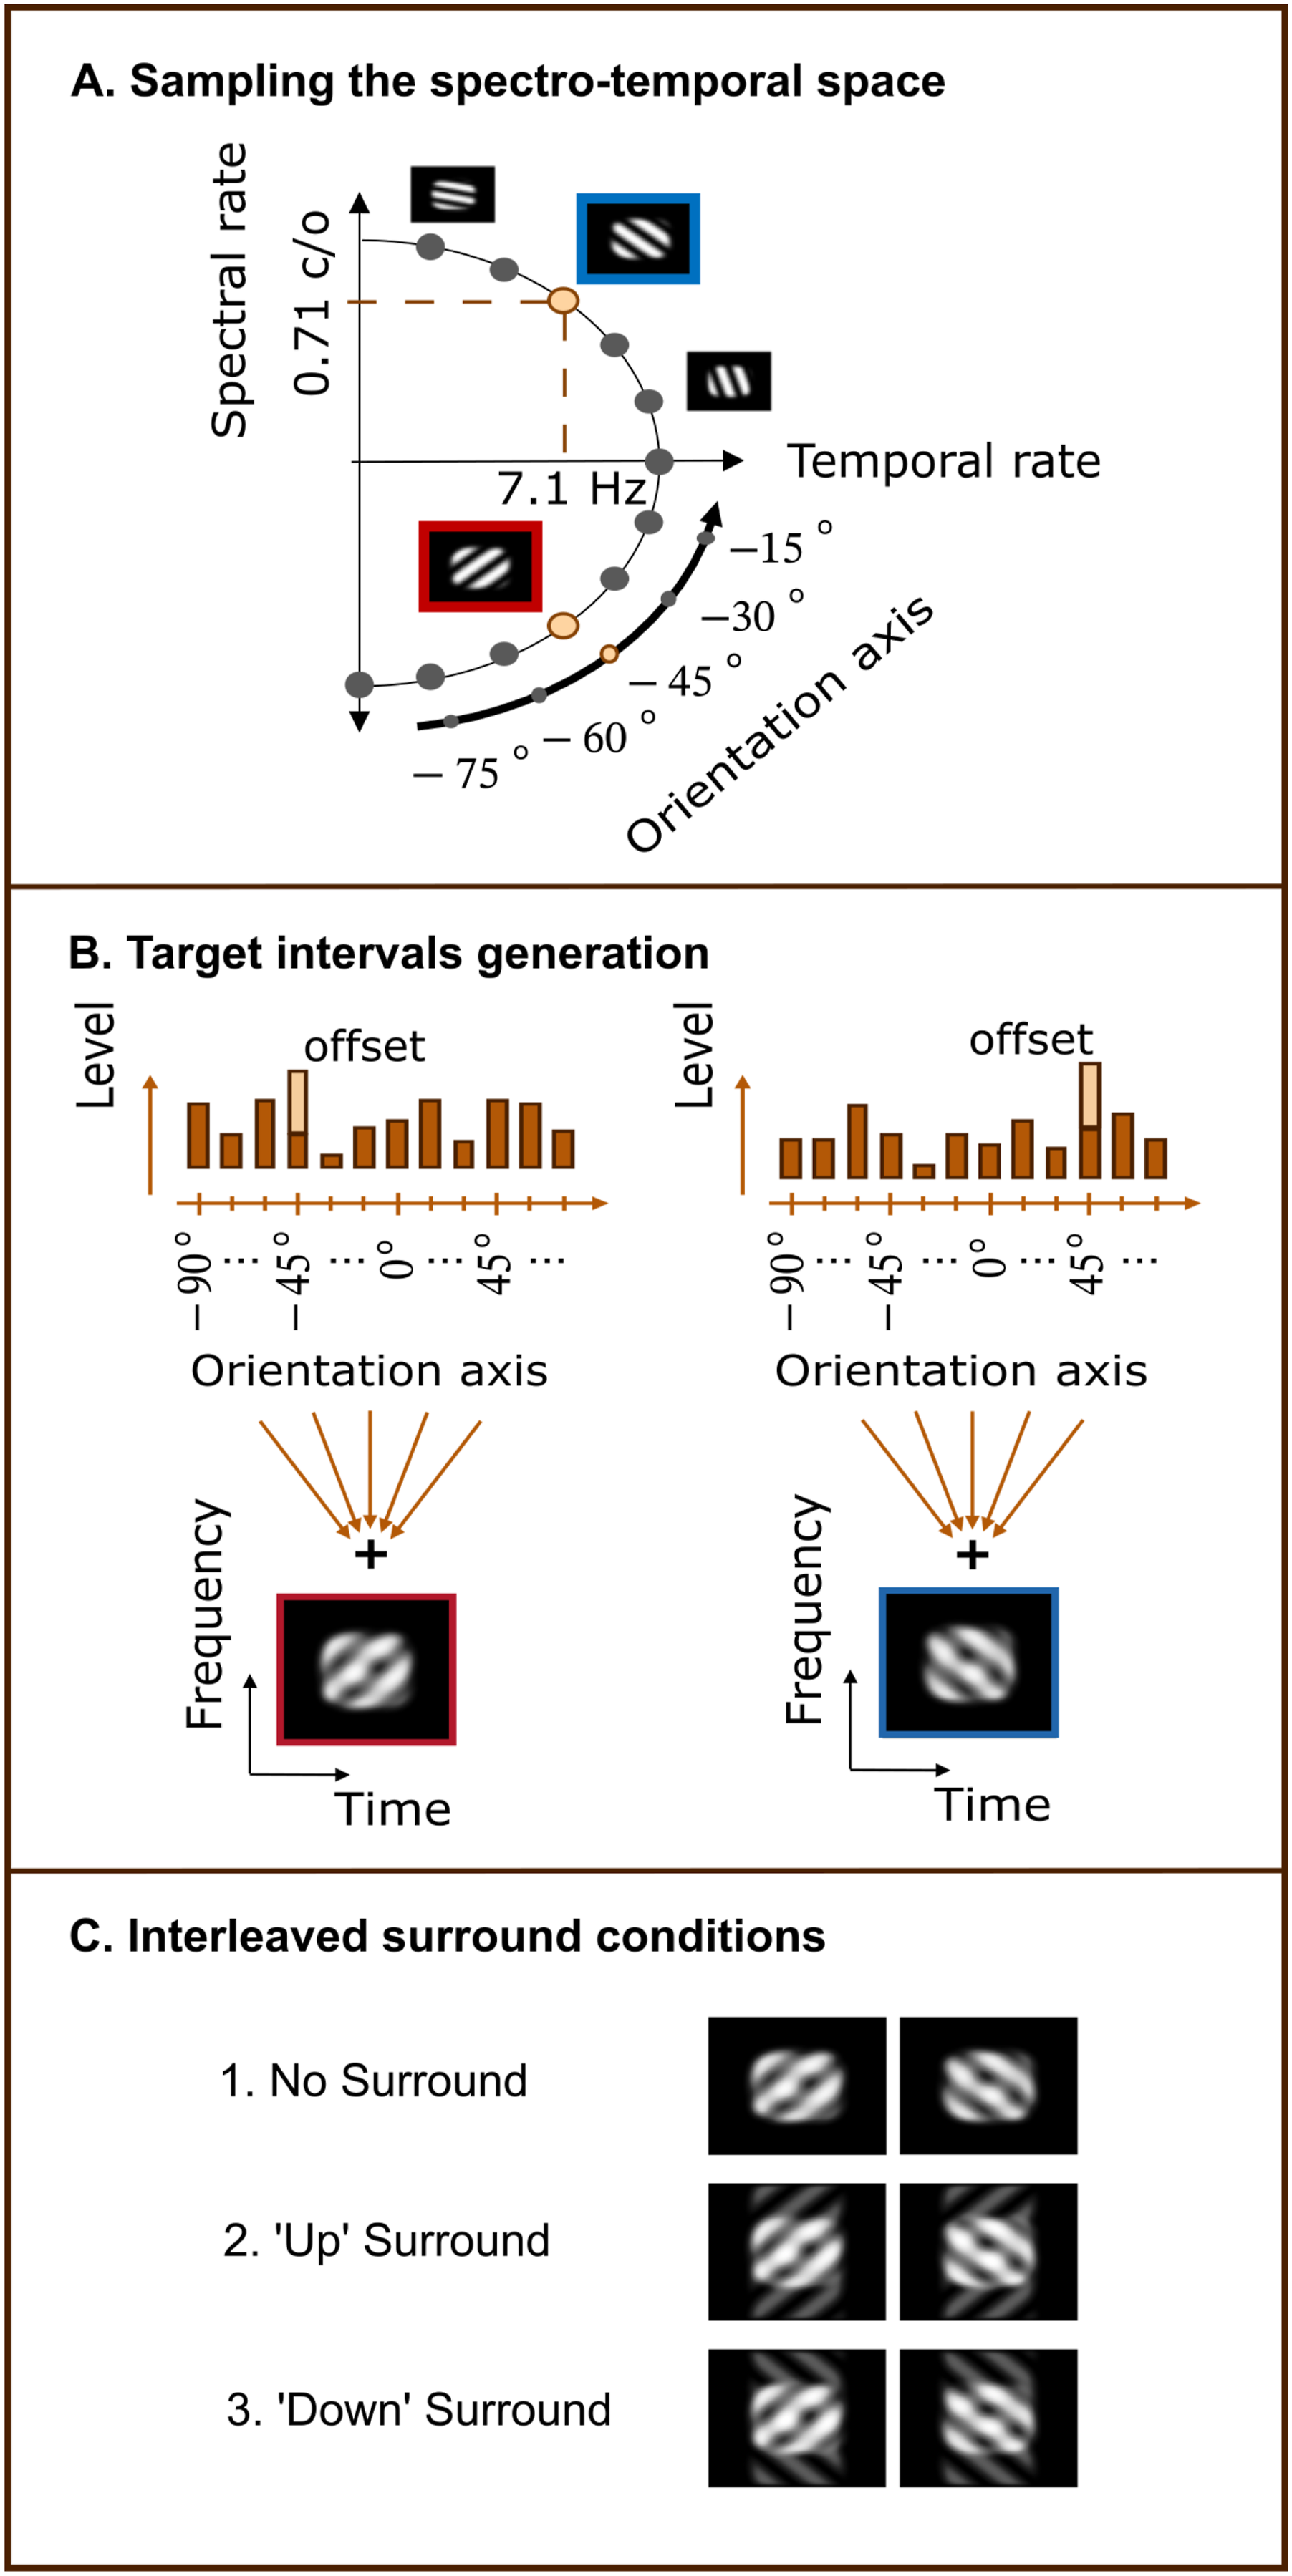
2.3. Procedure
The procedure for the experiment largely followed that of Ponsot et al. (2021). Sounds were generated at a sampling rate of 44.1 kHz and converted via a 16-bit resolution Meridian Explorer2 sound card. They were presented monaurally to the best ear through headphones (Beyerdynamic DT 770 pro 250 ohms). All stimuli were level-normalised and presented at 75 dB SPL with a duration of 250 ms and a 350 ms inter-stimulus duration. Sound level was calibrated using a Bruel & Kjaer artificial ear (Type 4153, IEC318). Listeners were presented with two intervals, one containing the enhanced upward-moving target (referred to as the up-target interval from here on), and one containing the enhanced downward-moving target (referred to as the down-target). Ripple noise was independently generated for each interval and on each trial. Half the listeners were assigned to indicate the interval containing the enhanced up-moving ripple (Participants 1-4) and the other half to indicate the interval containing the enhanced down-moving ripple (Participants 5-9). The offset value c determined the level enhancement of the given target ripple and was adjusted individually through preliminary testing to target a performance of d′ ∼ 1. Listeners completed five test sessions. Responses were entered via keyboard, and participants received audiovisual feedback after each trial. Each of these five sessions comprised a first training block of 25 trials (not used for analysis) followed by 9 blocks of 100 trials. The up-congruent and down-congruent surround conditions were randomly interleaved with the no surround condition so that on every trial each of the three conditions had the same probability of occurrence. Importantly, the surround sound provided no relevant information for performing the task and listeners were unable to adapt listening strategies due to the interleaved presentation manner. To aid participants in maintaining a stable memory representation of the upward/downward target signals, every 25 trials four repetitions of a pair composed of an up-target interval followed by a down-target interval for the group reporting the interval containing the up, or a pair composed of the down-target followed by an up-target for the group reporting the interval containing the down-target were presented. One block per session (randomly chosen) was repeated twice (at a random position in the session) to evaluate the percentage of agreement between the two passes for the purpose of computing internal noise intensity (Burgess & Colborne, 1988; Neri, 2010). For the analysis, this resulted in a total of
2.4. Analysis
A reverse correlation analysis was used to examine the relationship between listeners’ responses and the acoustic content of the stimuli on a trial-by-trial basis. Perceptual kernels were derived separately for intervals containing the up- and down-targets. Importantly, only the noise portions of the stimuli - excluding the added target offsets - were used for kernel estimation. On each trial, the 12 ripples were assigned random amplitude levels, representing their intended contribution. However, because the ripples were only approximately orthogonal after discretisation of the MPS space, the nominal amplitudes did not necessarily reflect their actual prominence in the final stimulus. To obtain a more accurate estimates, we computed the normalised projection of the noise trace onto the corresponding ripple basis functions. Specifically, for each ripple j, the noise was projected onto its in-phase (cosine) and quadrature (sine) components, defined as


This yields a phase-independent measure of the presence of each ripple in the stimulus. Because the basis functions were only approximately orthogonal in the discretised space, each projection should be interpreted as the best available estimate of ripple j’s strength. It reflects the intended contribution of that ripple but may also include minor leakage from nearby ripples with residual correlations. Kernels were computed separately for intervals containing the up-target and down-target. Because the task was 2-AFC, listeners did not classify each interval independently as ‘up’ or ‘down’; instead, they indicated which of the two intervals contained the upward (or downward) STM. However, for kernel estimation, their response was mapped onto both intervals: on each trial, if one interval was selected as containing the upward target, that interval was assigned an ‘up’ label and the other interval automatically a ‘down’ label. Using these interval-wise labels, kernels were then obtained by subtracting the average scores from trials categorized as ‘down’ from those categorized as ‘up’. Mathematically, the up-present kernel was defined as
To assess the robustness of the estimated perceptual kernels at the individual level, non-parametric bootstrap procedures were used (Ponsot et al., 2021; Varnet & Lorenzi, 2022). For each participant, 200 bootstrap estimates were generated by resampling the participant’s data with replacement, and the standard deviation across the resulting bootstrapped kernels was computed. Group-level kernels were obtained by averaging the individual kernels across participants, and variability at the group level was summarised using the standard error across participants. To further characterise behaviour, we calculated summary metrics capturing the difference in weight assigned to the upward-target ripple (at −45°) versus the downward-target ripple (at 45°). Each weight was calculated separately from the up-present and down-present kernels, and normalised by the root-mean-square over the entire kernel. Here, an optimal strategy would positively weight the up-moving target, while negatively weighting the down-moving target. Conversely, positive weights on the downward-moving target would indicate a suboptimal or confused strategy, where energy on the down influences a listener towards responding ‘up’. The robustness of these metrics was also assessed using bootstrapping.
Finally, statistical analyses were performed to evaluate the influence of surround condition. Friedman tests were used to assess effects on sensitivity, interval bias, estimated internal noise, and weighting patterns. Wilcoxon signed-rank tests were applied to test whether distributions differed significantly from zero, and Wilcoxon ranked-sum tests were used for pairwise comparisons between independent samples. The statistical significance level was set to 0.05, and Holm-Bonferroni corrections were applied to control for multiple comparisons.
2.5. Modulation Filterbank Model
As in the STM detection study (Ponsot et al., 2021), the perceptual kernels derived from listener responses were compared to those obtained with a variant of the modulation filterbank model (MFB) (Dau et al., 1997; King et al., 2019). Full details of the model’s preprocessing stages are provided in Ponsot et al. (2021). Briefly, the input signal was first filtered through a gammatone filterbank covering 250 - 8000 Hz, followed by envelope extraction via half-wave rectification and low-pass filtering, and then processed through a modulation filterbank centred at log-spaced frequencies from 0.5 to 20 Hz with a Q-value of 1. A key feature of the model preprocessing relevant to the present study is the final stage, which implements limitations in modulation phase sensitivity. For modulation filters centred above the modulation phase cut-off frequency, the Hilbert envelope of the bandpass filtered output is extracted. This operation preserves modulation energy while discarding phase information. When the cut-off is set to zero, only power at the filter outputs is retained, corresponding to a separable strategy across spectral and temporal dimensions. At the opposite extreme, when the cut-off is set to infinity, all phase information is preserved, corresponding to a fully non-separable strategy. To explore these different regimes, we tested three cut-off values: ρ cut = 0, 10, 50 Hz, with 10 Hz corresponding to the standard value used in the model. After preprocessing, internal noise with constant variance was added to the internal representations.
In the decision device, the model compared the two intervals of each trial to a template representation using normalised cross-correlation, computed jointly across time, auditory frequency, and modulation frequency. Templates were constructed by subtracting an average representation of noise-only stimuli (5 iterations) from that of target-plus-noise stimuli (5 iterations). We investigated three template configurations: (1) upward-target only, (2) downward-target only, and (3) a combined upward- and downward-target template. Separate templates were created for each of the four possible starting phases. On each trial, correlations were computed for all templates, and the interval with the highest score was chosen. The templates remained fixed across the three surround conditions, contained no surround sound, and were restricted to the time-frequency region covering 250 ms and 250 - 8000 Hz.
For consistency with the human data, the model was presented with the identical noise patterns used for the listeners, but with a fixed target offset of 16 dB (the lower end of the SNR range tested in the experiments). The variance of the added internal noise was calibrated such that the model performance in the No-Surround condition matched that of human listeners and subsequently kept constant in the other two surround conditions. Although it would be desirable to simulate each participant at their individual SNR, this is not feasible with the present, non-individualised model: using participant-specific SNRs would yield varying performance levels, whereas our goal was to hold performance approximately constant to isolate the effects of stimulus manipulations. Achieving matched performance across different SNRs would require ad-hoc adjustments to preprocessing or internal noise parameters. By fixing both SNR and model configuration, differences across simulations can therefore be attributed directly to stimulus differences rather than to parameter changes.
2.6. Additional Experiments
Based on the behavioural and modelling results from the main experiment, which suggested that listeners did not exploit upward and downward STM information symmetrically, we conducted two additional experiments to test the interpretation that they primarily relied on an internal template for the upward target. These experiments were conducted in a new cohort of young normal-hearing listeners (N = 15). STM discrimination was assessed (1) under different noise conditions (Figure 2A) and (2) using an alternative task paradigm (Figure 2B).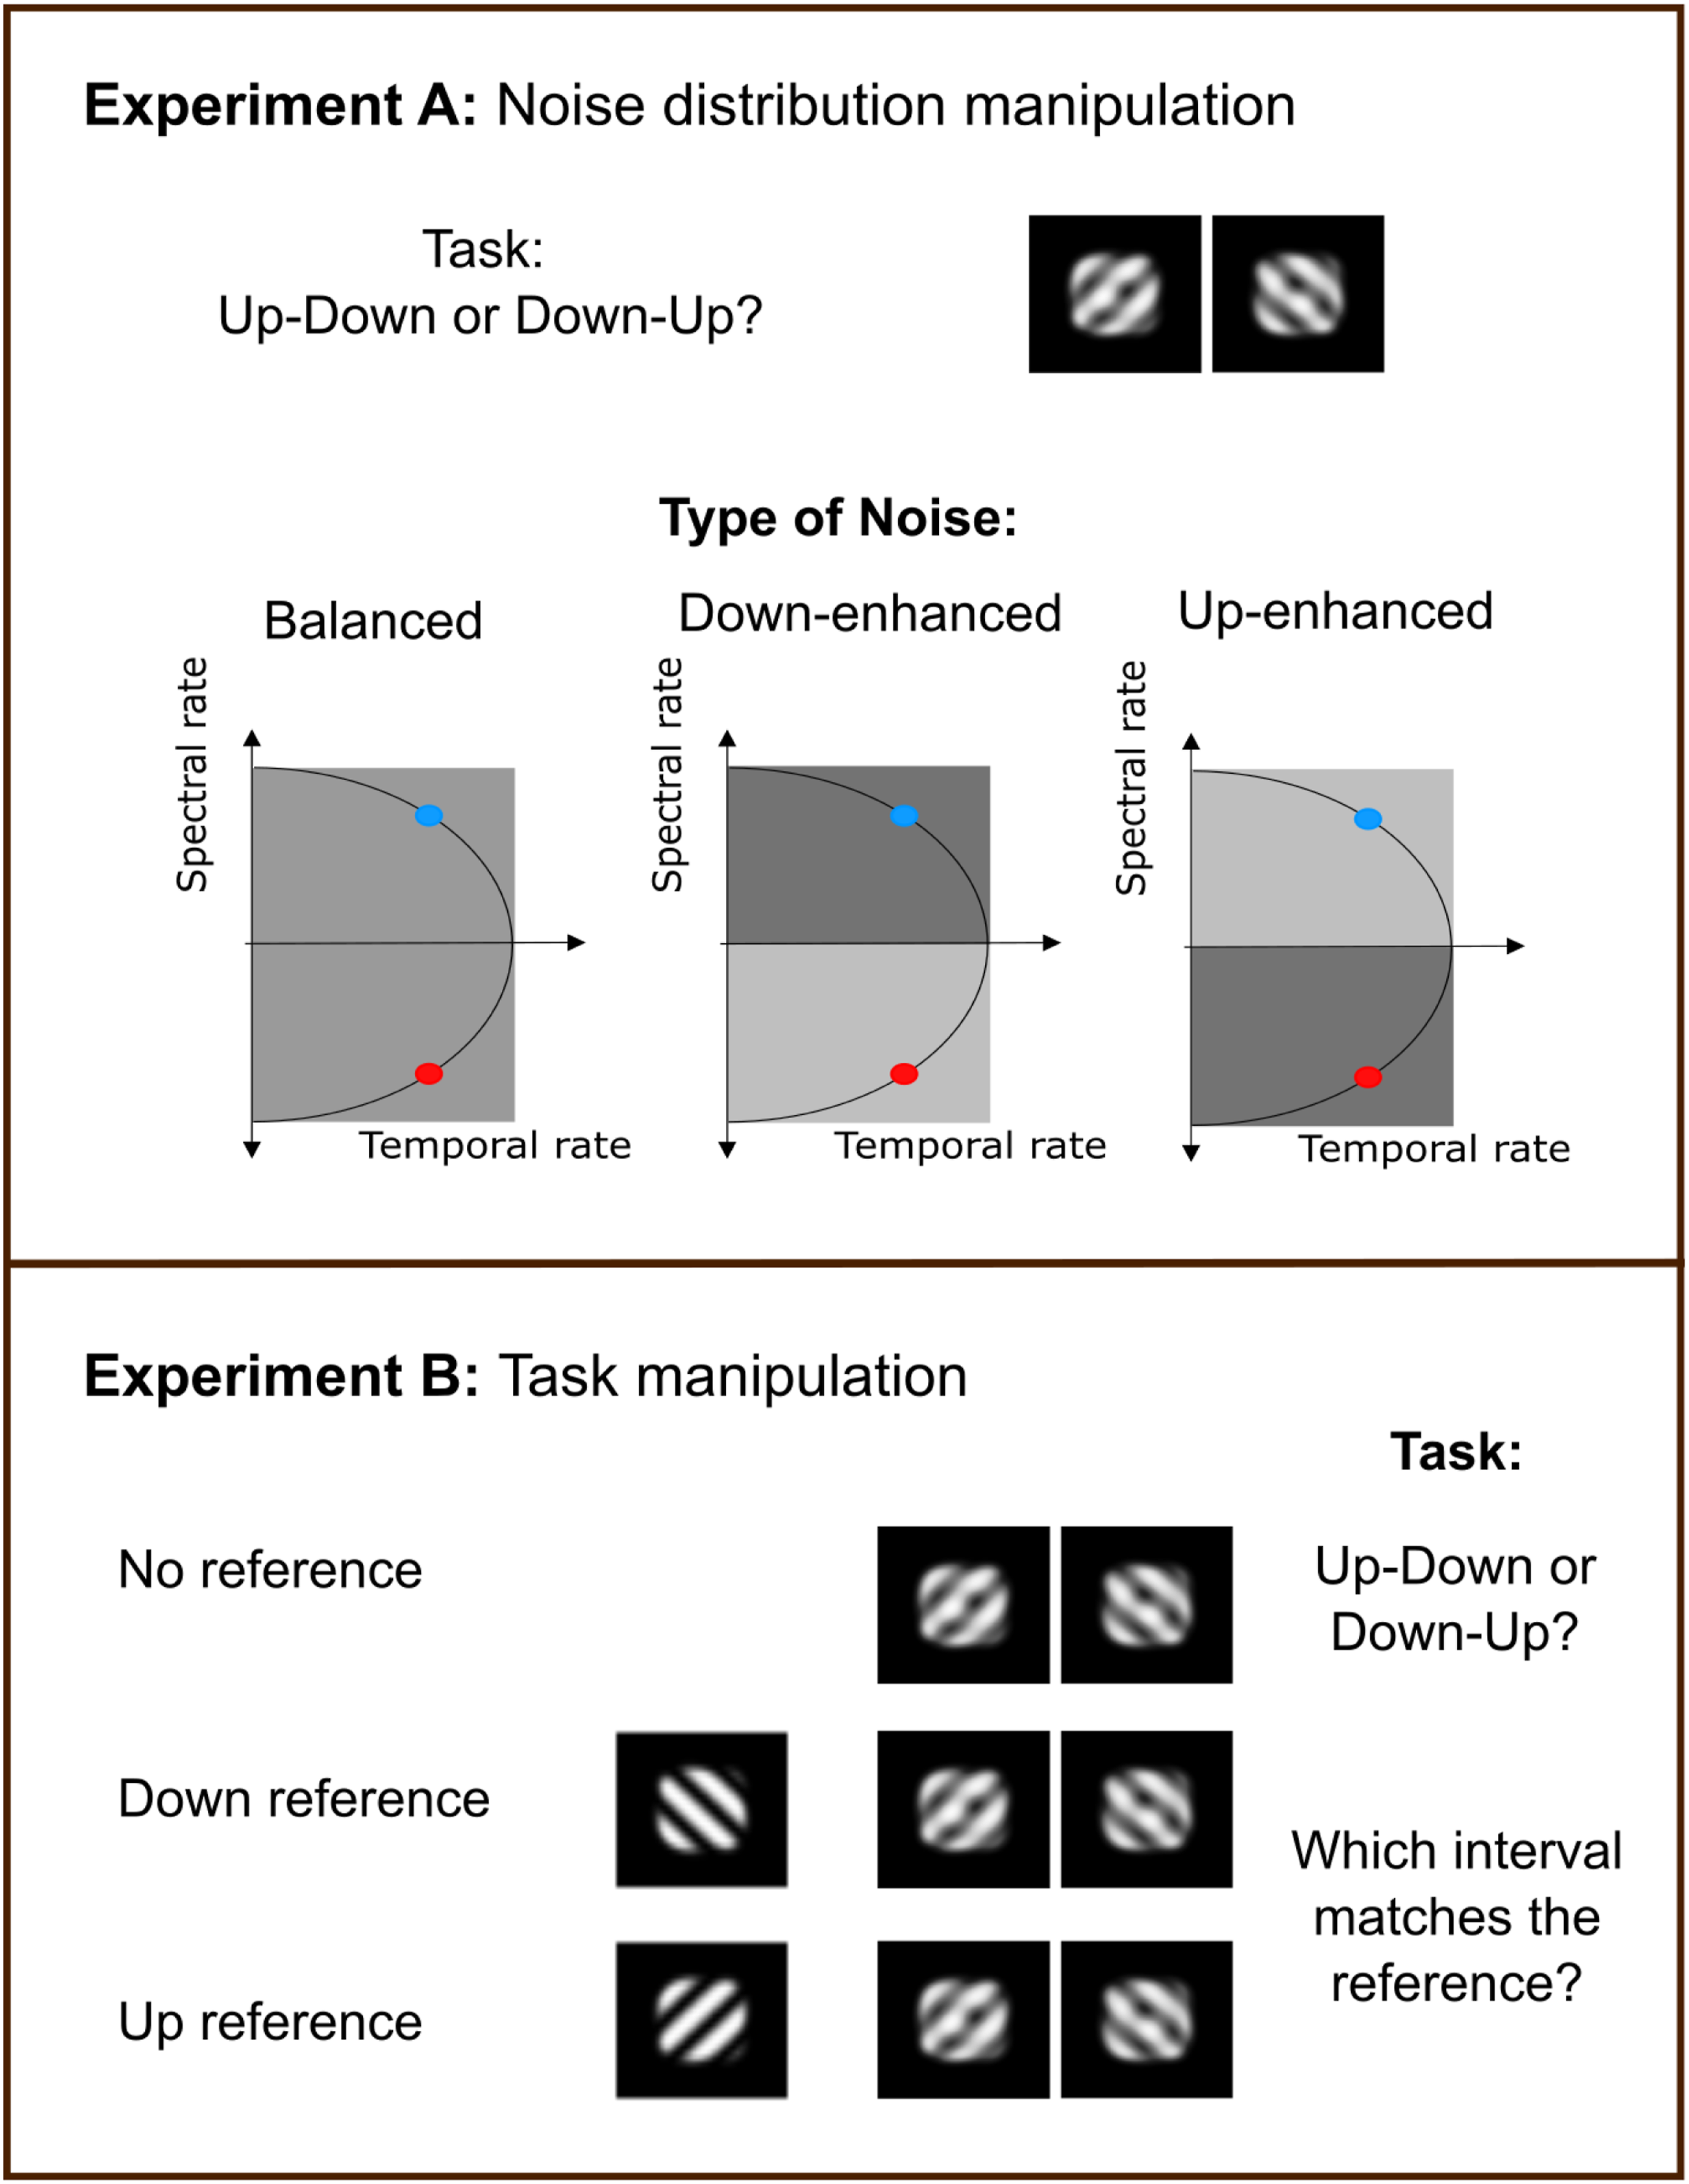
The first follow-up experiment tested whether performance would be affected more strongly by noise in the upward than in the downward region of modulation space, as would be expected if listeners primarily monitored upward STM information. Listeners discriminated between upward and downward STMs embedded in STM noise, as in the main experiment, but with the distribution of noise energy across the modulation space manipulated. Three noise conditions were tested: Balanced noise (equal energy in the upward- and downward-moving regions of the MPS), downward-enhanced noise, and upward-enhanced noise. In the latter two conditions, STM components corresponding to the emphasized direction were increased by 3 dB and those corresponding to the opposite direction were decreased by 3 dB, yielding a 6 dB difference between the two regions.
The second follow-up experiment asked whether explicitly cueing the target direction would alter STM discrimination sensitivity. We therefore used a reference-based paradigm in which participants first heard a clean upward or downward STM, followed by 800 ms of silence and then a noisy STM pair (inter-stimulus-interval of 400 ms), and were instructed to identify the noisy STM matching the reference. Because the noise contained equal energy in the upward- and downward-moving regions of modulation space, sensitivity in the Up-Reference and Down-Reference conditions was compared with the No-Reference condition with equal-energy noise. Further details on the participants and procedure for these two experiments can be found in the Appendix.
3. Results
3.1. Sensitivity, Bias and Internal Noise Across Surround Conditions
Individual participant measures are plotted in Figure 3 for the three surround conditions. The offset levels (SNR) required to achieve the target performance level of d′ ∼ 1 varied across participants, ranging from 15 to 26 dB (M = 19.54 dB, SD = 4.17 dB) and are represented by individual colours. A Friedman test revealed a significant effect of surround condition on sensitivity (χ2 (2) = 10.89, p = 0.004, W = 0.605). Sensitivity was comparable in the No-Surround (M = 1.15, SD = 0.39) and Up-Surround conditions (M = 1.13, SD = 0.38), but decreased in the Down-Surround condition (M = 0.71, SD = 0.21). Post hoc Wilcoxon signed-rank tests confirmed significant differences between No-Surround and Down-Surround (p = 0.012) and between Up-Surround and Down-Surround (p = 0.024), but not between No-Surround and Up-Surround (p > 0.05).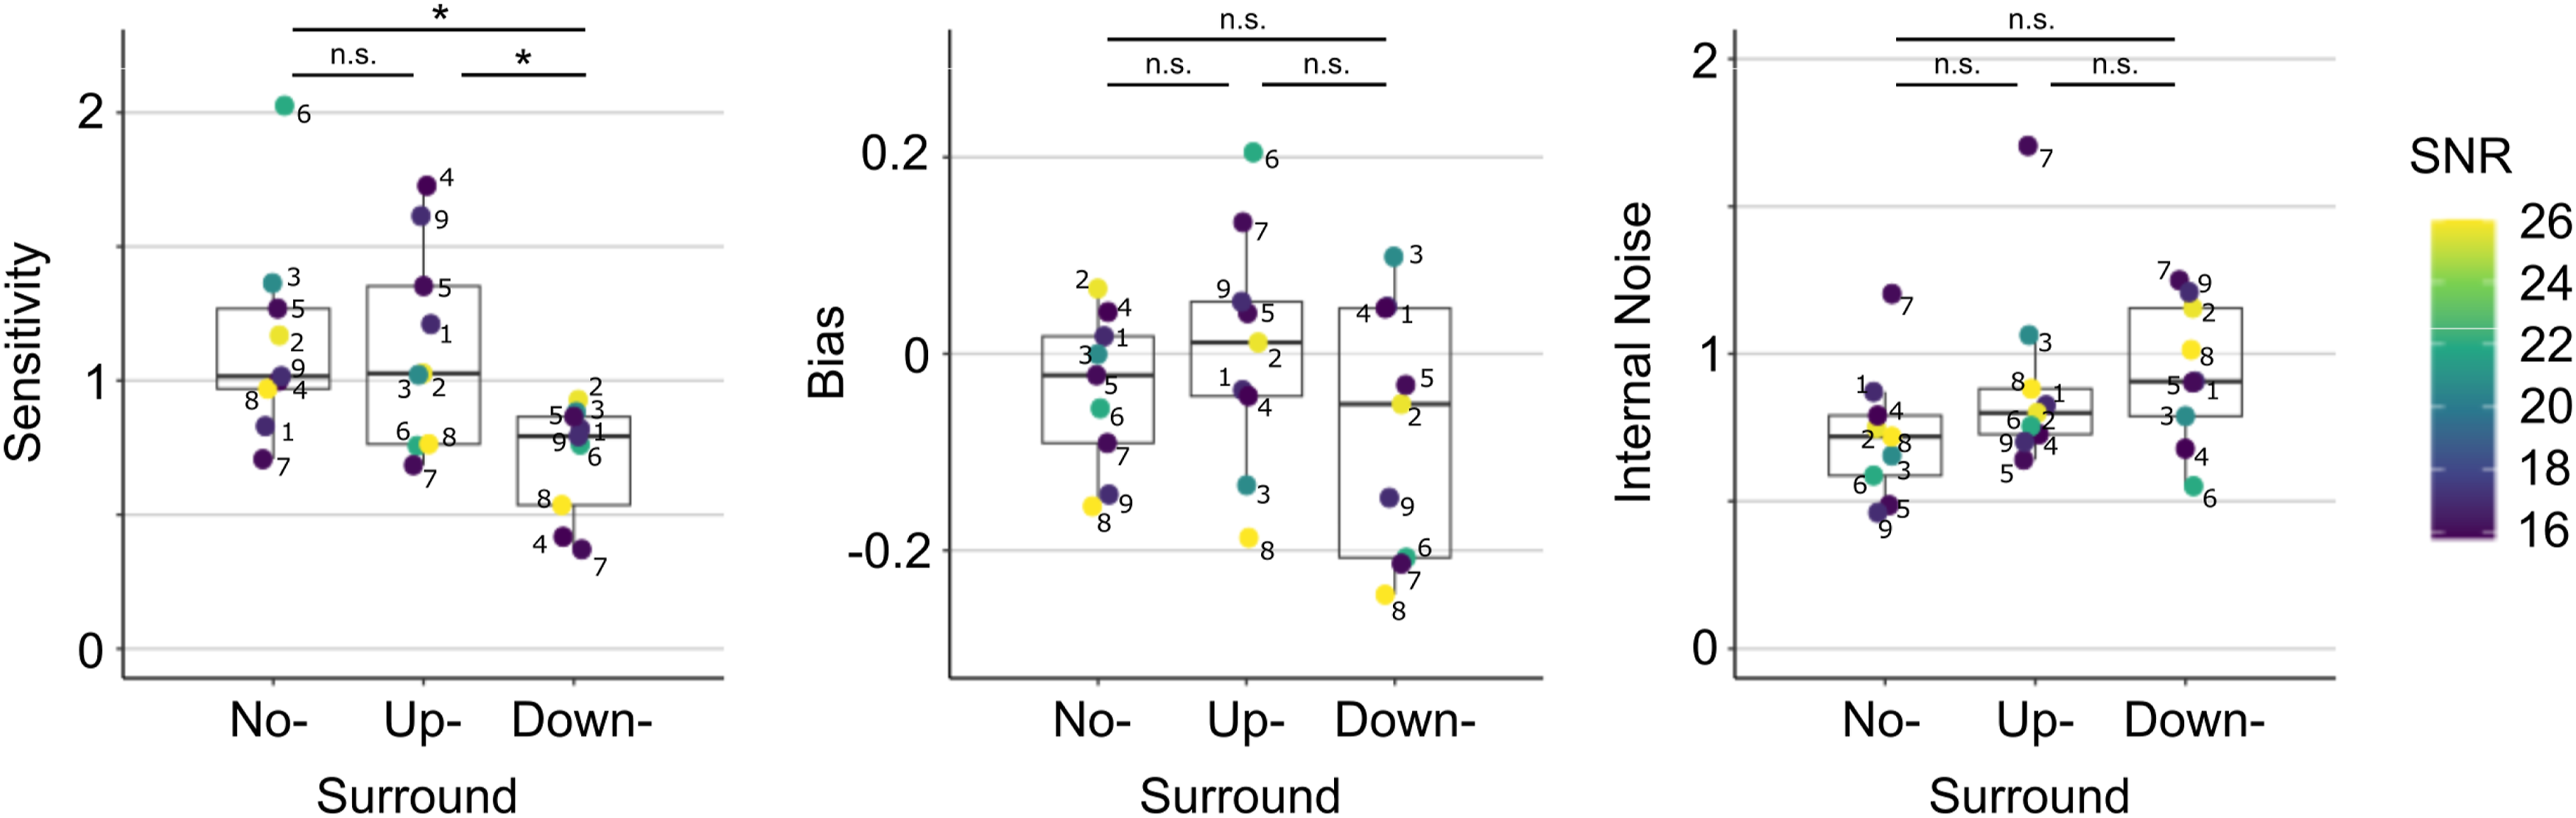
Interval bias was quantified as proportion of first-interval responses minus 0.5. Positive values reflect a bias toward the first interval, whereas negative values indicate a bias toward the second interval. Across conditions, bias did not differ significantly from zero (p > 0.05) and did not vary significantly across condition (χ2 (2) = 1.56, p = 0.459, W = 0.087). Nevertheless, notable individual biases were observed. For example, one participant showed a bias towards the first interval in the Up-Surround condition (β = 0.20) but the opposite bias in the Down-Surround (β = −0.21). Another participant consistently favoured the second interval in both Up- and Down-Surround conditions (β = −0.19, − 0.25, respectively).
Internal noise was estimated from the double-pass data by jointly considering the percent correct and percent agreement across repeated presentations of identical noise patterns, and fitting a signal detection model under the assumption of no response bias (Burgess & Colborne, 1988). Noise estimates did not vary significantly across conditions (χ2 (2) = 4.22, p = 0.121, W = 0.234). However, across all conditions and observers a moderate but significant negative correlation was observed between sensitivity and internal noise (ρ = −0.55, p = 0.003), indicating that higher sensitivity was associated with lower internal variability. No significant correlations were observed between individual SNR thresholds and any of the measured variables.
3.2. Perceptual Kernel Estimation
Perceptual kernels were derived separately for intervals containing the upward- and downward-target. As no systematic differences were observed between participant groups instructed to indicate the ‘up’-versus the ‘down’-interval, data were pooled across all listeners. The resulting kernels, computed from the trial-by-trial projection scores, are shown in Figure 4, Panel A, for all three surround conditions, plotted as a function of orientation in the MPS space (see Figure 1). These reverse-correlation kernels reflect the perceptual weighting of individual ripples. By convention, positive weights indicate a tendency to respond ‘up’ while negative weights indicate a tendency to respond ‘down’. Individual traces are shown to the left of each panel, and group-averaged kernels are shown in the main panels, with shaded regions indicating standard deviation and standard error, respectively. (A) Perceptual kernels for the three surround conditions are shown as a function of orientation along the MPS axis, with the target-up at −45° and the target-down at 45°. The y-axis shows kernel amplitude (unitless), reflecting the relative influence of each STM ripple orientation on listeners’ responses. The main panels display group-average kernels from up-present intervals (red) and down-present intervals (blue), with shaded regions indicating the standard error across participants. Individual participant kernels are shown to the left of each panel, with shaded regions indicating within-participant variability estimated as the standard deviation across bootstrapped samples. (B) Summary metrics: weights on the down-target versus the upward-target ripple for each surround condition. Pale points represent individual metrics for the up-present kernel (red) and down-present kernel (blue), with error bars showing the individual bootstrap standard deviation. Solid ellipses indicate group averages, with ellipse axes corresponding to the standard error across participants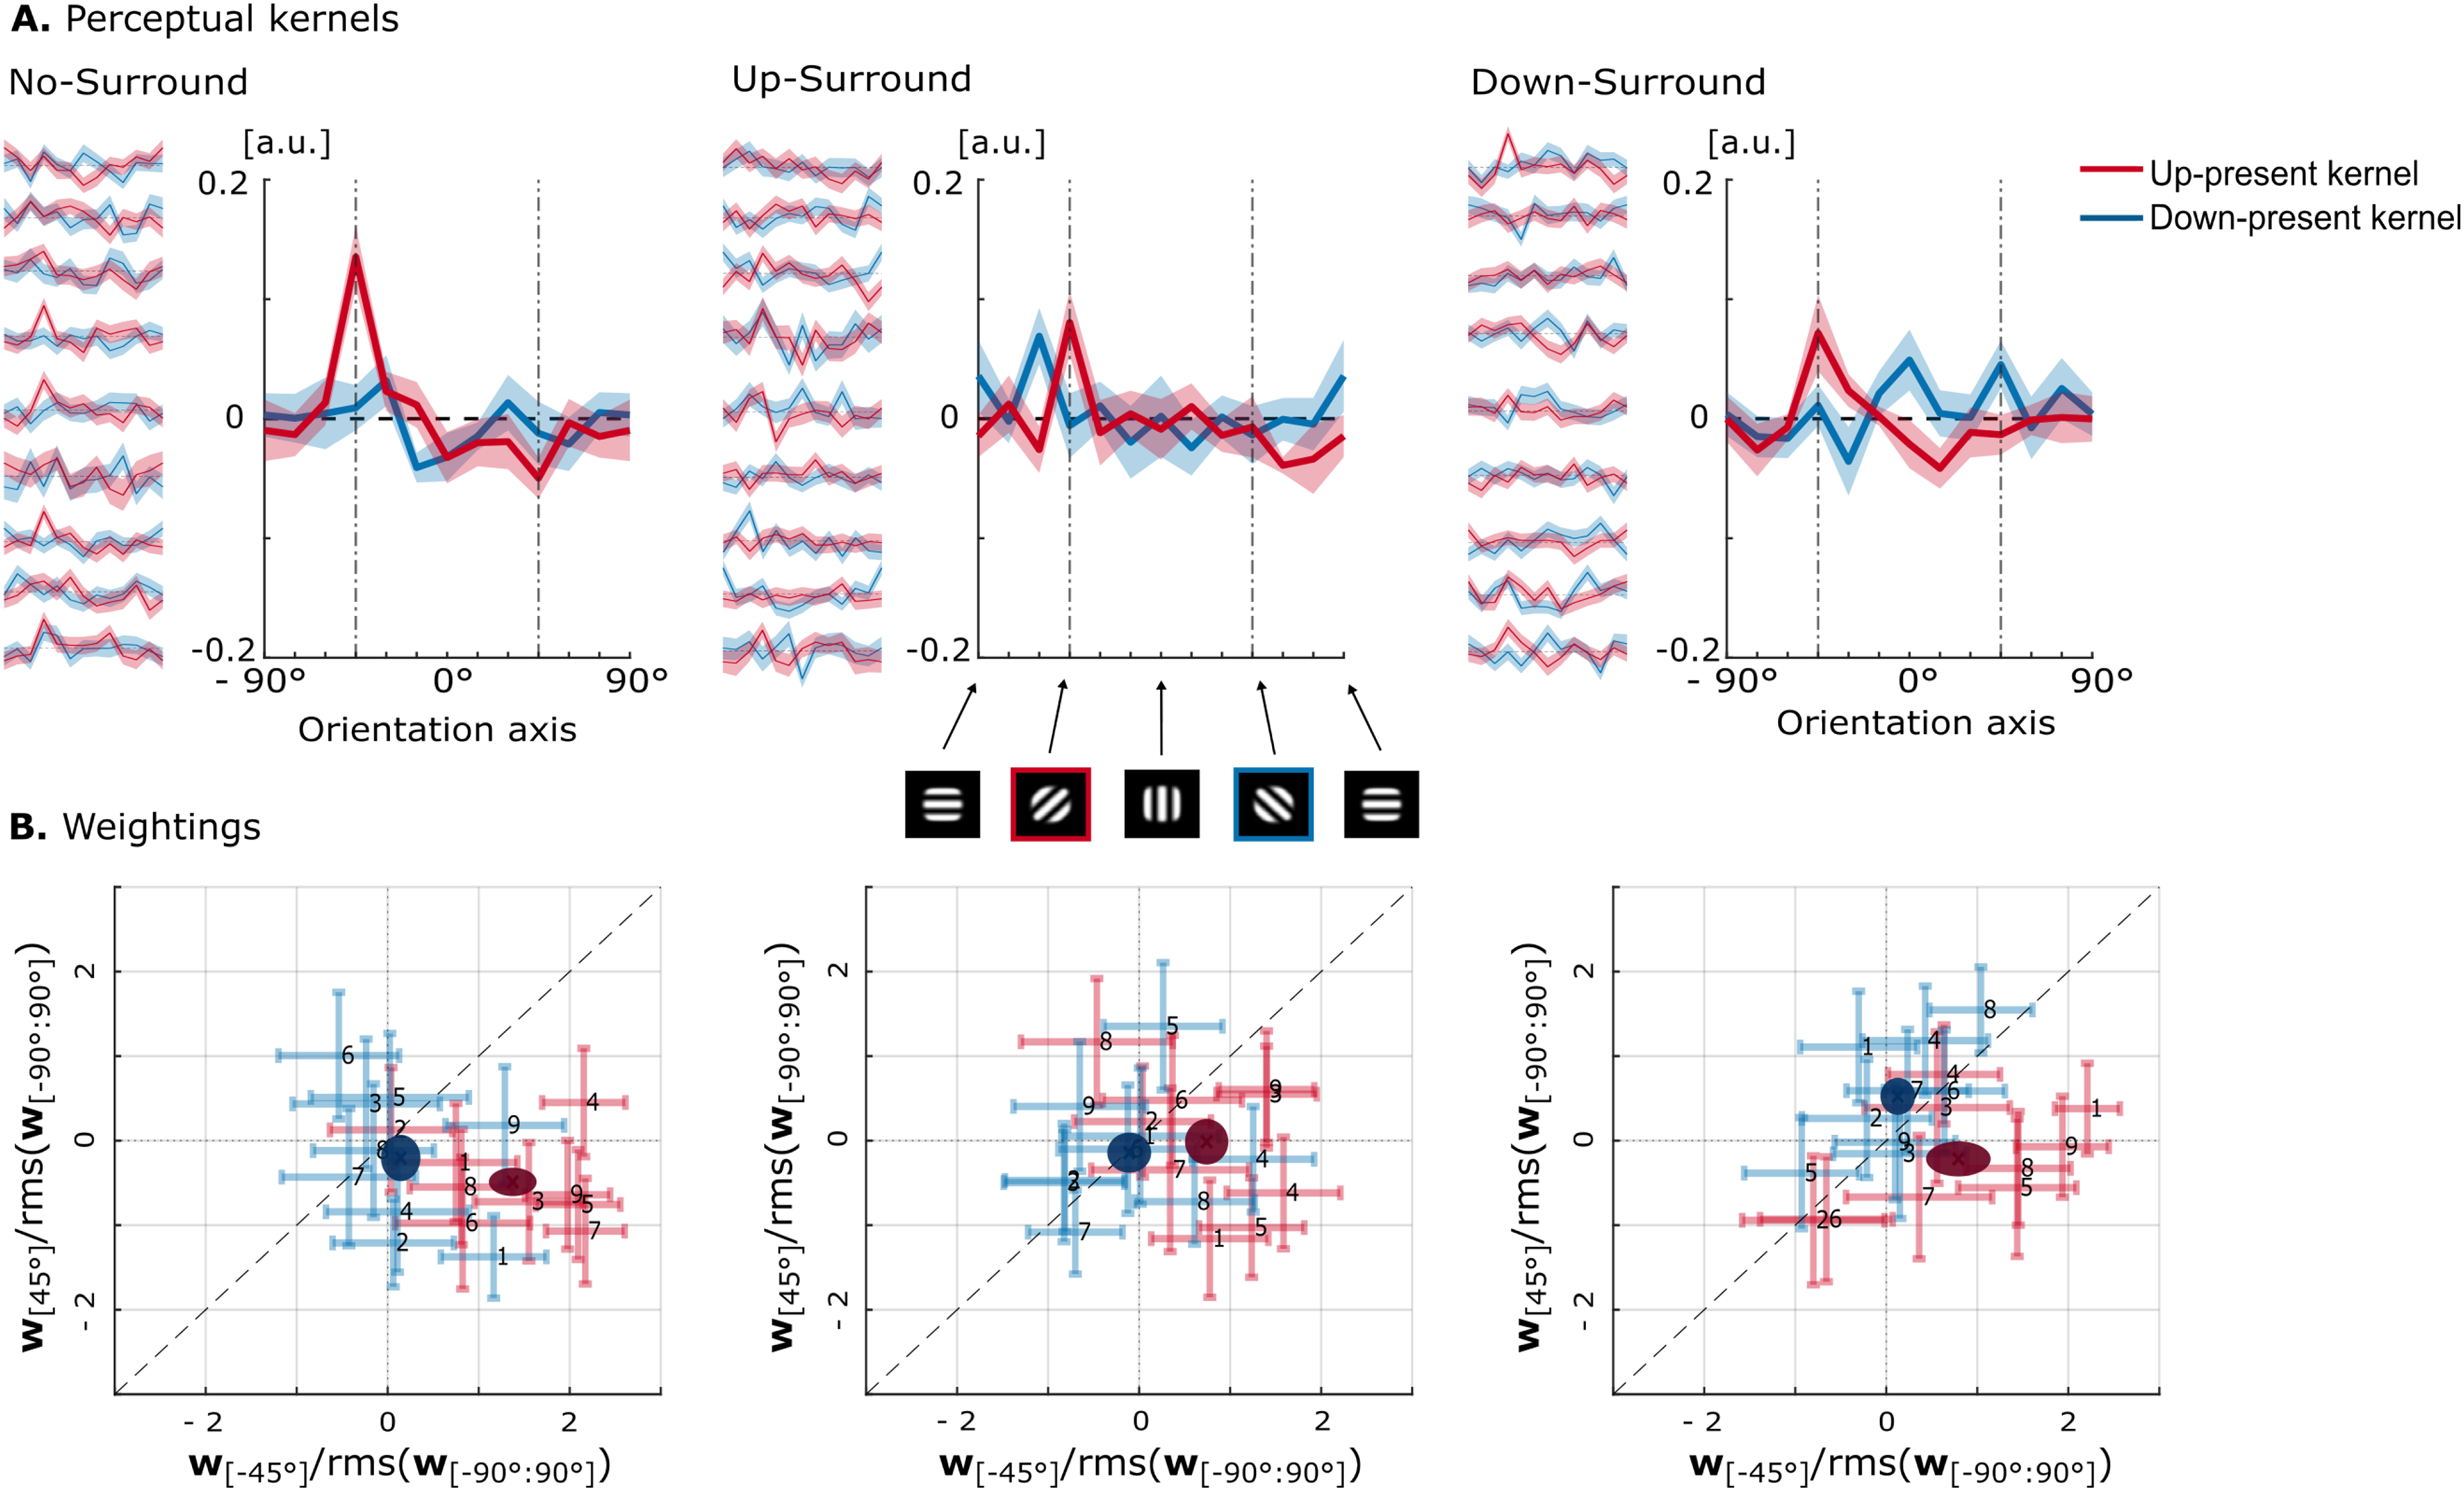
Panel B shows the summary metrics derived from these kernels, quantifying weights on the downward-moving target (at 45°) versus the upward-moving target (at −45°), normalised by the root-mean-square of the full kernel. Metrics were computed separately for up-present (red) and down-present kernels (blue). Pale symbols represent individual participants with bootstrap error bars; solid ellipses indicate group means with axes reflecting standard error. An optimal strategy would assign positive weight to the upward-moving target and negative weight to the downward-moving target, resulting in points falling in the bottom-right quadrant. By contrast, positive weighting of the downward ripple would suggest a suboptimal or confused strategy, where downward energy increases responses toward ‘up’.
Clear differences were observed between kernels derived from up-present and down-present intervals. For up-present kernels, weights on the upward target varied across conditions but did not show a significant overall effect (χ2 (2) = 4.22, p = 0.121, W = 0.24). Nonetheless, up-target weights were significantly greater than zero in the No-Surround condition (M = 1.35, SD = 0.82, p = 0.012, red data points in the left panel of Figure 4B, fall to the right of the 0 vertical midline) and marginal in the Up-Surround condition (M = 0.71, SD = 0.75, p = 0.055), but not significant in the Down-Surround condition. Pairwise contrasts did not survive correction, although the No-Surround versus Up-Surround comparison approached significance (p = 0.058). Weights on the downward target did not differ across conditions (χ2 (2) = 2.89, p = 0.236, W = 0.16) and were not reliably different from zero, though the No-Surround condition showed a descriptive trend toward negative weighting (M = – 0.50, SD = 0.50, p = 0.082).
For down-present kernels, neither upward- nor downward-target weights showed significant effects of condition (χ2 (2) = 0.89, p = 0.641; χ2 (2) = 1.56, p = 0.459, respectively). None of the weights differed significantly from zero after correction (all p ≥ 0.164, blue data points in Figure 4B fall near the origin).
3.3. Predictions Using the Modulation Filterbank
Figure 5 shows perceptual kernels in the No-Surround condition derived from model simulations under different configurations. Two parameters were manipulated: the modulation phase-sensitivity cut-off (ρ
cut
= 0, 10, 50 Hz) in the preprocessing stages, and the choice of template representation in the backend (up-template, down-template, or combined up and down). Kernels were computed using the exact stimulus set pooled across all participants in the No-Surround condition (solid light lines) and using a stimulus set that was 10 times larger than that (dashed dark lines), in order to disentangle the effects of external noise. The kernels derived from the human-matched stimulus set revealed substantial variability compared to when using 10 times the number of trials. Perceptual kernels derived from model simulations in the No-Surround condition under different configurations, shown as a function of STM ripple orientation (x-axis), with kernel amplitude on the y-axis reflecting the unitless decision weight assigned to each ripple. Two parameters were varied: the phase-sensitivity cutoff in the preprocessing stage (ρ
cut
= 0, 10, 50 Hz) and the backend template representation (up-template, down-template, or combined up and down). Kernels were computed using the exact stimulus set pooled across all participants in the No-Surround condition (solid light lines) and using a stimulus set that was 10 times larger than that used for individual participants (dashed dark lines), in order to disentangle the effects of external noise. Shaded regions indicate the bootstrap standard deviation across samples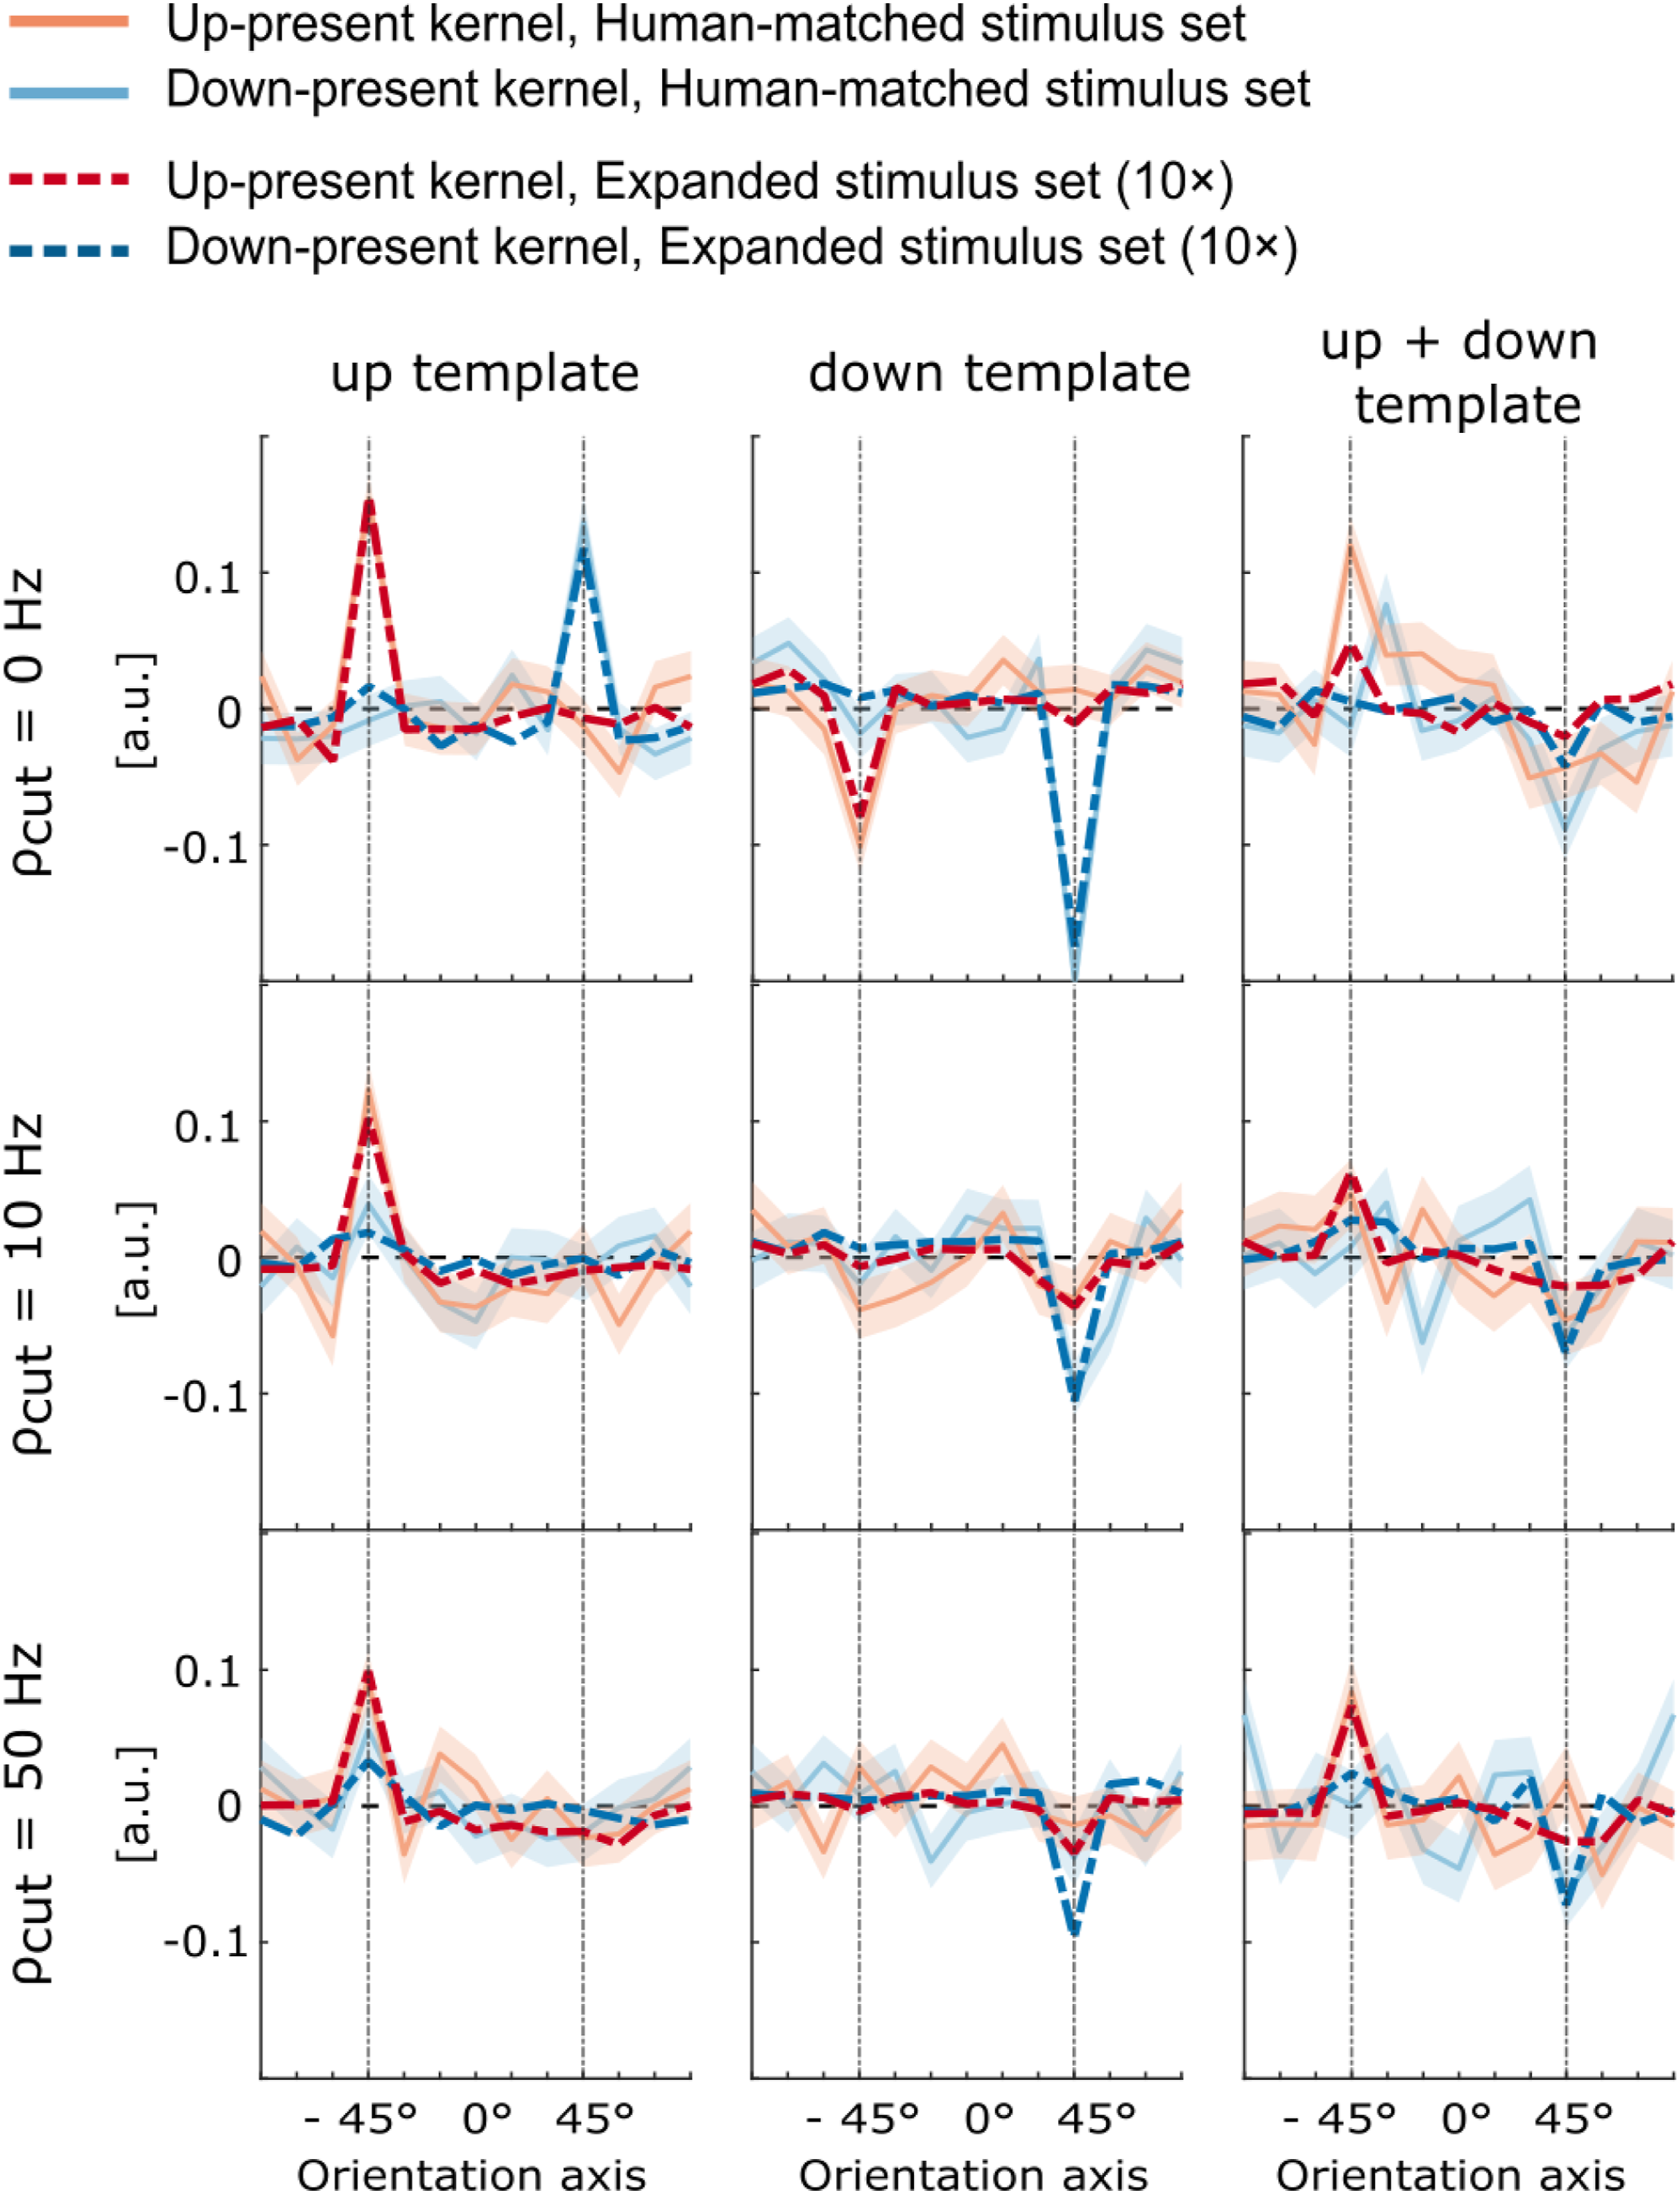
Furthermore, the simulations revealed clear effects of both model parameters. With the up-template, kernels showed strong positive structure around the up-target orientation (−45°), indicating reliable sensitivity to upward motion. The down-template, conversely, produced tuning around the down orientation (45°). The combined template yielded responses at both orientations, though with reduced amplitude compared to the single templates, consistent with concurrent monitoring of both motion directions. At a phase-sensitivity cut-off of 0 Hz, strong directional confusion was evident: kernels derived from single-template configurations exhibited similar structure at both target orientations, indicating poor selectivity between upward and downward motion. Increasing the phase-sensitivity cut-off to 10 Hz substantially reduced this confusion, yielding near-zero structure at the non-target orientation. Further increases in cut-off frequency produced only minor additional changes. Across configurations, kernel structure was consistently stronger at orientations corresponding to the active template than at the non-present orientation. Together, these simulations highlight two main trends: (i) tuning aligned with the orientation specified by the template representation, and (ii) increased directional confusion when modulation phase sensitivity is absent.
The model configuration with an up-template and ρ
cut
= 10 Hz, which showed the closest descriptive agreement with the human data in the No-Surround condition, was then used to simulate responses across the different surround conditions. Model performance dropped slightly across conditions: from d′ = 1.15 (No-Surround) to d′ = 1.06 (Up-Surround), and d′ = 0.97 (Down-Surround). A similar but more pronounced decline was observed in the human data. Figure 6 shows the resulting kernels (Panel A) and corresponding target weightings (Panel B). In each case, group-averaged kernels with standard errors are displayed in the main panels, while individual kernels are shown to the left. Weighting results are presented both at the group level and for individuals, with errorbars on the individual data indicating bootstrap standard deviations. Importantly, the model was not fitted to individual participants; any variability across simulations reflects differences in stimulus sets (identical to those assigned to the listeners) as well as the internal model noise. (A) Perceptual kernels derived from the model responses for the three surround conditions, plotted as a function of orientation with the up-target at −45° and the down-target at 45°. The y-axis represents kernel amplitude (unitless), reflecting the relative influence of each STM ripple orientation on listeners’ responses. The main panels show average kernels from up-present (red) and down-present (blue) intervals, with shaded regions indicating standard error across simulated participants using the same noise set as the listeners. Individual kernels are shown to the left, with shaded regions representing bootstrap standard deviations. (B) Summary metrics for each surround condition. Pale points represent individual metrics for up-present (red) and down-present (blue) kernels, with error bars showing bootstrap standard deviations. Solid ellipses indicate group averages, with axes corresponding to the standard error across simulated participants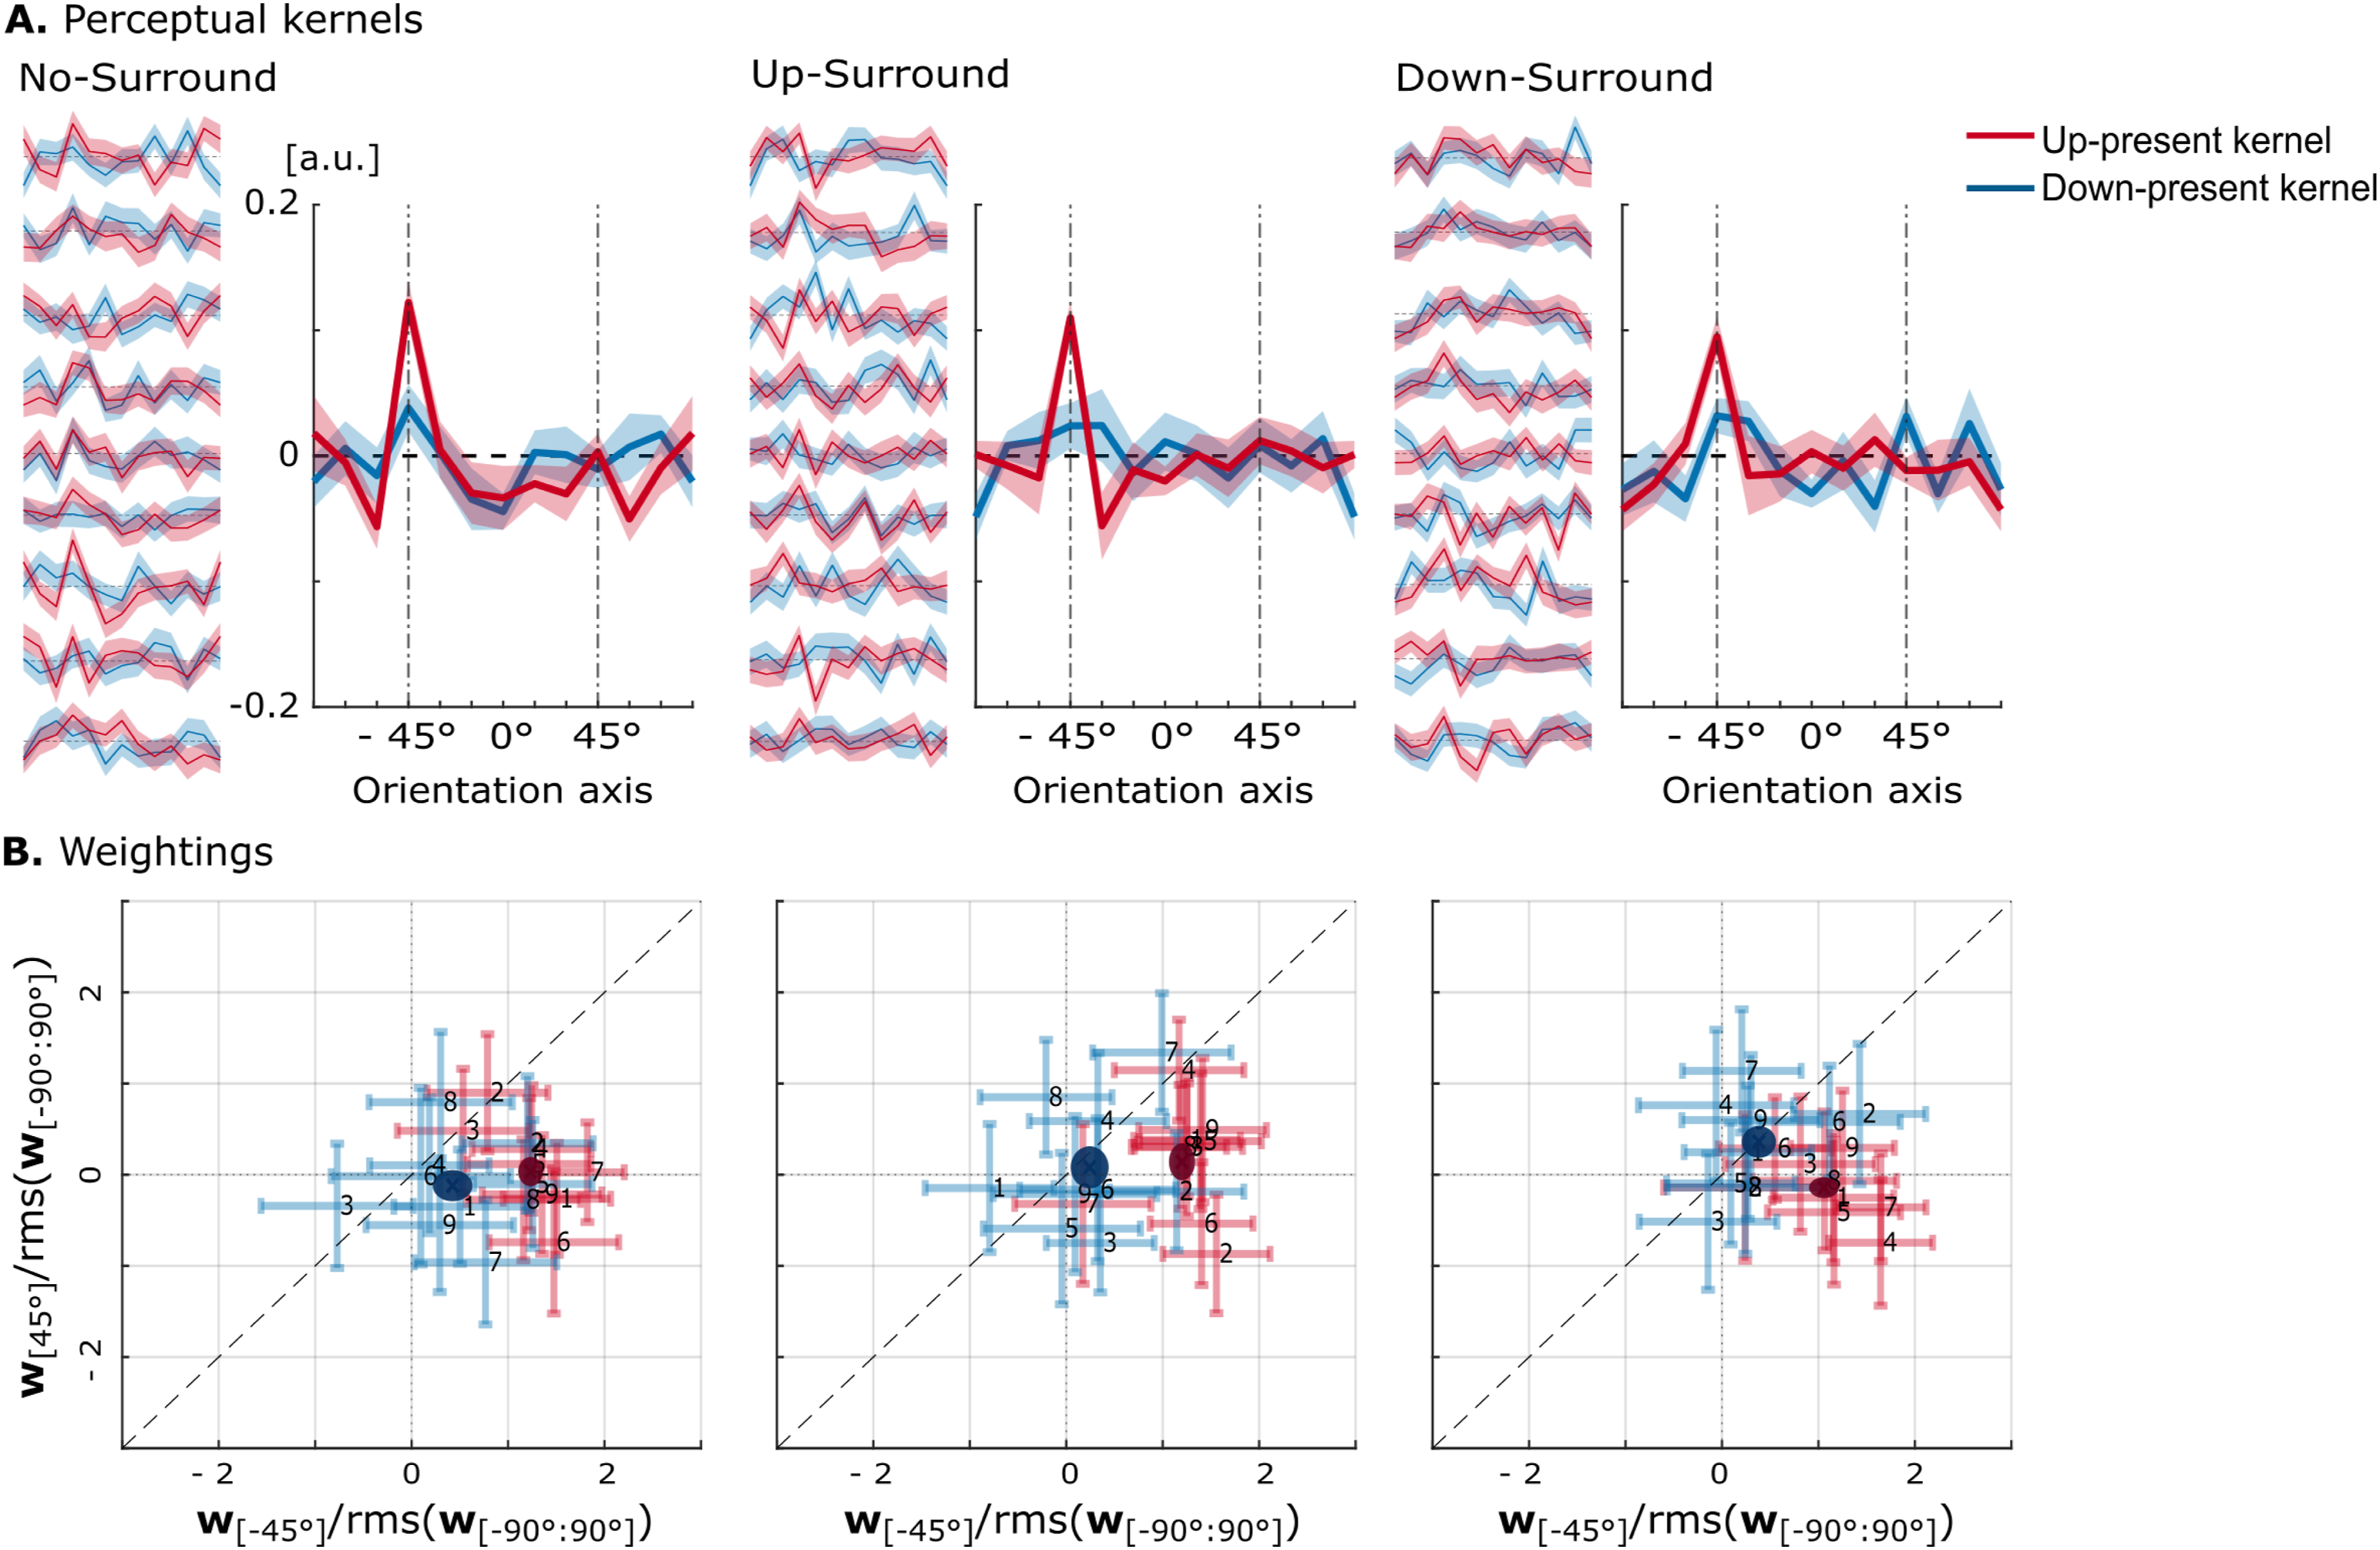
Despite this constraint, considerable variability was observed across individual model kernels: some showed more pronounced structure, whereas others were flatter, with large differences in target weightings. On average, however, no strong differences emerged across surround conditions. In all three surrounds, up-present kernels showed a clear peak at the up-target and near-zero weighting at the down-target. In contrast, down-present kernels were largely flat, though small positive weights were observed at the up-target in the No-Surround condition and at both up- and down-targets in the Down-Surround. Overall, the weighting patterns of the model resembled those of the human listeners at the group level (Figure 4), though not at the level of individual participants.
3.4. Additional Experiments
To evaluate whether STM discrimination performance generalised across changes in noise statistics and task structure, sensitivity was compared across the conditions of the two follow-up experiments (see Figure 2). The results are shown in Figure 7. In the first follow-up experiment, sensitivity was similar across the three tested noise conditions. A Friedman test revealed no significant effect of noise condition on sensitivity (χ2 (2) = 0.533, p = 0.766, W = 0.017), indicating that the distribution of background STM noise energy did not systematically affect STM discrimination performance. Because the estimated d′ of some participants fell within the 95% confidence interval for chance performance, the analysis was repeated after excluding participants performing at chance level in the No-Reference, Balanced Noise condition, yielding a subgroup of N = 7 (Figure 7A, right). In this subgroup, sensitivity again did not differ across noise conditions, and the Friedman test remained non-significant (χ2 (2) = 0.286, p = 0.867, W = 0.02).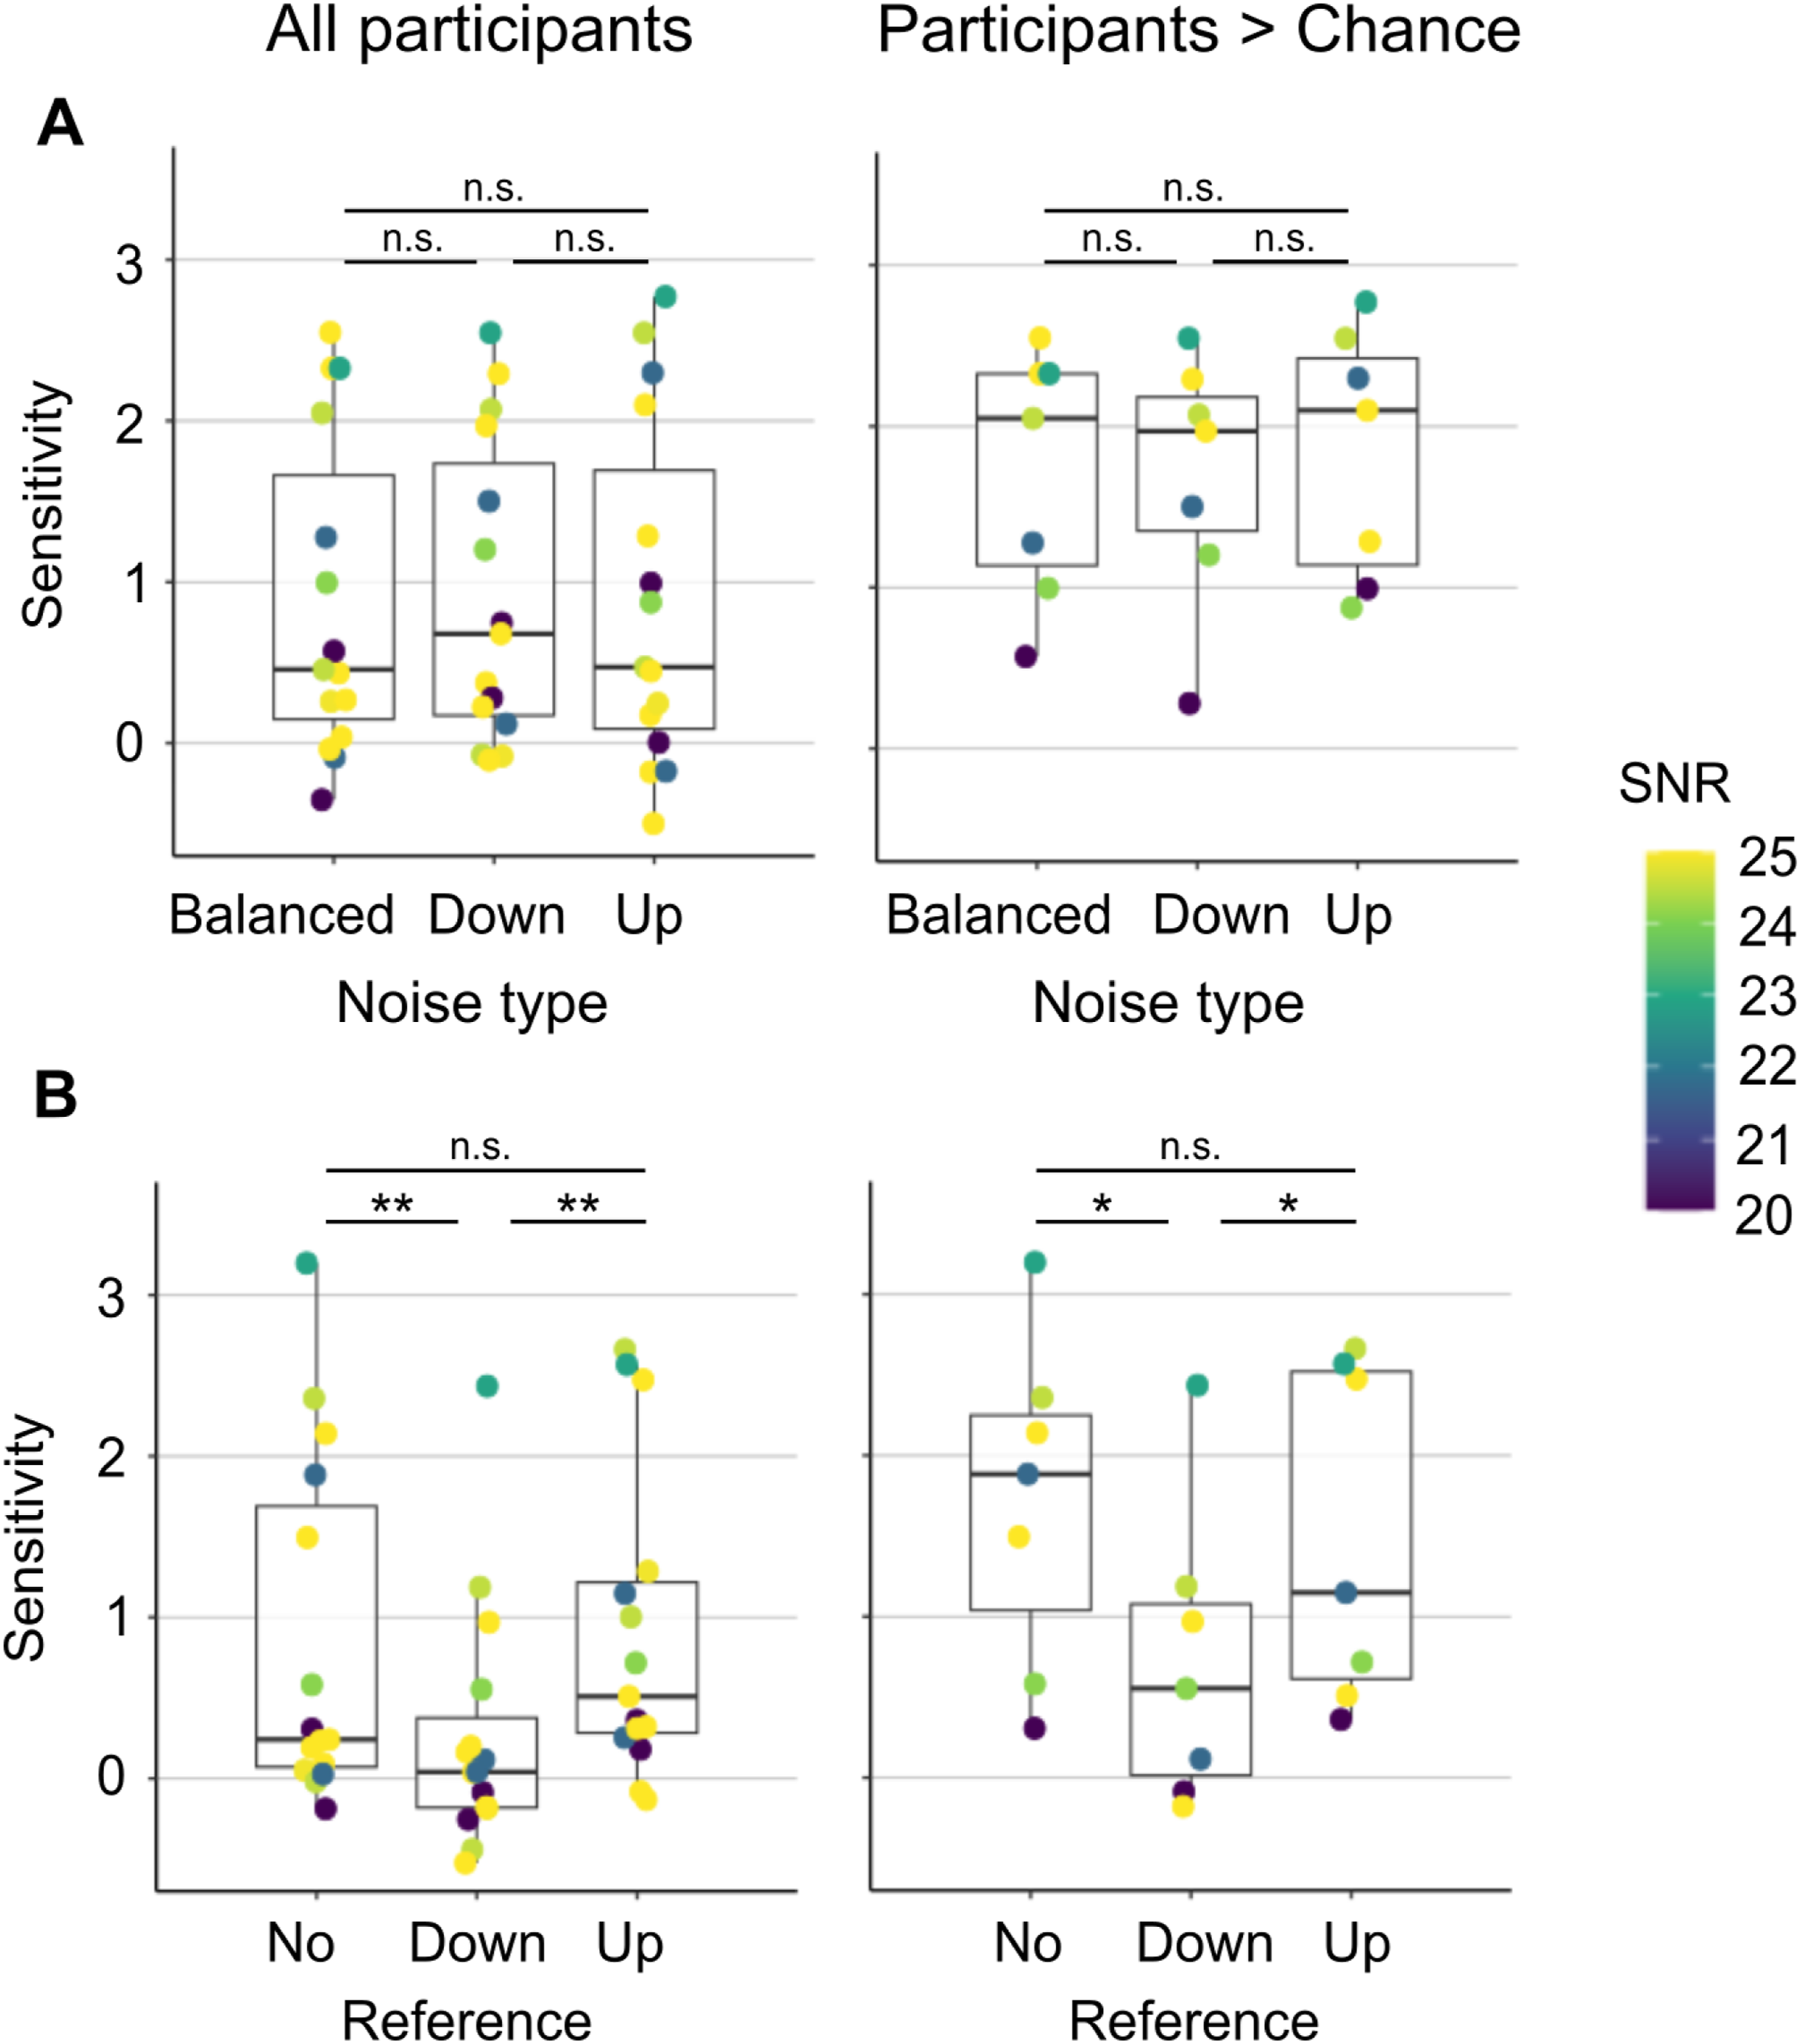
In the second follow-up experiment, which assessed STM discrimination using a reference-based paradigm, sensitivity differed across task conditions (Figure 7B). Sensitivity was comparable between the No-Reference and Up-Reference conditions, but was reduced in the Down-Reference condition. A Friedman test confirmed a significant effect of condition (χ2 (2) = 12.9, p = 0.002, W = 0.431). One-tailed Wilcoxon signed-rank tests revealed significantly higher sensitivity in the No-Reference and Up-Reference conditions compared with the Down-Reference condition (WWilcoxon = 114, p = 0.001; WWilcoxon = 10, p = 0.003, respectively). A two-tailed Wilcoxon test showed no significant difference between the No-Reference and Up-Reference conditions (WWilcoxon = 50, p = 1). This pattern of results remained unchanged after excluding participants performing at chance level (Figure 7B, right). In the reduced sample, the Friedman test again indicated a significant effect of condition (χ2 (2) = 10.6, p = 0.005, W = 0.755). Post-hoc Wilcoxon tests confirmed significantly greater sensitivity in the No-Reference and Up-Reference conditions relative to the Down-Reference condition (WWilcoxon = 28, p = 0.024; WWilcoxon = 0, p = 0.024, respectively), with no difference between the No-Reference and Up-Reference conditions (WWilcoxon = 16, p = 1).
4. Discussion
This study adapted the reverse-correlation framework of Ponsot et al. (2021) for STM detection to a directional discrimination (upward vs. downward) task, replacing the detection paradigm with a 2-AFC discrimination task of STM direction. The reverse-correlation analysis was expanded in two key ways: (1) rather than directly using amplitude levels assigned to the elementary ripples, trial-by-trial projection scores were computed post-hoc, after the noise was generated. As a result, the kernels reflect not only the perceptual weighting of the ripples but also statistical dependencies between them; and (2) unlike many prior reverse-correlation studies (Ahumada & Lovell, 1971; Ponsot et al., 2021; Varnet & Lorenzi, 2022), no true target-absent condition was included, as each interval contained either an up- or down-target. Target-absent kernels are generally considered more reliable indicators of listeners’ strategies, since they are not distorted by interactions between the energy increment and potential nonlinear strategies involved (Neri, 2004). At the same time, had we not adopted two orthogonal signals to be discriminated from one another, listeners may have engaged non-oriented mechanisms to perform the task (a strategy we wished to avoid).
Perceptual kernels were derived to examine how listeners weighted different ripple orientations when making their discrimination judgments. Based on the task design, we expected a degree of symmetry: (i) between the up-present and down-present kernels, such that each would display a mirror pattern of weighting; and (ii) between the two quadrants of the MPS space, i.e. between [–90°,0°] and [0°,90°] on the orientation axis. Contrary to these expectations, the observed kernels showed no such symmetry. Instead, up-present kernels consistently exhibited more prominent structure, regardless of whether listeners were instructed to identify the up- or the down-target. This suggests that participants did not simultaneously monitor both ripple directions, but rather selectively tracked the up-target. This pattern appeared robust across participants and independent of task instructions, and may instead reflect an inherent preference for listening to upward-moving ripples - even though STM detection studies have reported no consistent sensitivity advantage for upward over downward STMs (Chi et al., 1999). We come back to this aspect later in the discussion.
4.1. Task Difficulty and Individual Variability
The task of discriminating upward from downward STM proved to be inherently challenging for young normal-hearing listeners. Notably, SNRs required for participants to reach a performance level of d′ ∼ 1 were substantially higher than those reported in the STM detection task (M = 3.4 dB compared to M = 19.54 dB; Ponsot et al., 2021), indicating that STM discrimination demands considerably clearer representations of the STM ripples. This demanding nature of the task was further underscored by the exclusion of three listeners who were unable to perform the task even at very high SNRs (i.e. large offset levels), as well as by the presence of interval biases in some participants, suggesting possible lapses of engagement under demanding conditions. Additionally, there was pronounced inter-individual variability in performance levels: while some participants could not perform the task even with minimal perturbing noise, others achieved criterion performance with offset levels of 15 dB. For reverse-correlation analyses to yield meaningful perceptual kernels, task difficulty must be carefully balanced: external noise should exert a measurable influence on decisions, while performance must remain sufficiently above chance to prevent random responding, which contributes no information to kernel estimation. In the present study, the high SNRs required to sustain modest performance suggest that this balance was difficult to achieve, potentially limiting the extent to which external noise shaped behaviour, in contrast to the STM detection paradigm of Ponsot et al. (2021).
This behavioural variability was mirrored in the perceptual kernels. Individual kernels often differed substantially in structure, magnitude and even sign. In such cases, averaging across listeners can be misleading: heterogeneous or noise-driven weighting patterns may cancel out, producing a mean kernel that does not reflect any individual strategy. Thus, weak or absent structure in the group-averaged kernels should not be taken as evidence for a lack of systematic weighting at the individual level. For this reason, we focused on summary metrics capturing weighting at theoretically relevant orientations (e.g. up- and down-target locations) and assessed their consistency across listeners using statistical tests. This approach allows systematic trends to be identified despite substantial inter-individual variability and provides a more robust characterisation of decision strategies than reliance on averaged kernels alone.
It should also be noted that the number of participants in the present study was relatively limited, as is common in psychophysical experiments that rely on extensive testing per listener. While this design enables detailed characterisation of individual strategies, future studies with larger cohorts could help to further assess the generalisability of the observed weighting patterns and the extent of inter-individual variability.
A similar pattern of difficulty and variability was evident in the follow-up experiments, where a substantial proportion of participants failed to perform above chance, even in conditions without added STM noise. Such high levels of difficulty have not been reported in previous studies and may be attributable to the restricted time–frequency region covered by the STM stimuli used here, compared to previous studies (Narne et al., 2020), or to the use of noise composed of explicit STM signals.
In addition to behavioural variability, considerable variability was observed in the individual model kernels. Although each model configuration comprised 1500 trials and included no individualised parameters, kernels still differed substantially across stimulus sets. One explanation is that this number of trials may be insufficient for stable kernel estimation. Alternatively, in an up/down discrimination task, certain noise realisations may favour “correct” weightings, whereas others induce confused or reversed weightings; when averaged, these opposing effects largely cancel, yielding weak overall structure. This interpretation suggests that much of the observed variability reflects the dominance of external noise rather than unstable decision strategies. Future work could assess whether specific noise configurations systematically promote confusion. Beyond first-order kernels, second-order reverse-correlation analyses (Neri, 2004) could also help determine whether higher-order interactions among ripple components contribute to the observed variability.
4.2. Effects of Surround Noise
Inspired by findings in visual motion processing (Neri & Levi, 2009), we examined how directional surround signals in the time-frequency space influence auditory STM processing. Surround conditions were presented in an interleaved manner, preventing participants from adopting surround-specific strategies, and the surround motion itself provided no task-relevant information.
In contrast to the visual findings (Neri & Levi, 2009), we observed no symmetry between positive and negative orientations in any surround condition. Instead, listeners appeared unable to monitor both upward and downward motion simultaneously, predominantly focusing on the upward-moving target. This asymmetry has important implications: if listeners selectively track upward motion, any expected effect on downward motion, such as the same-direction suppression reported in vision, would be unlikely to emerge, because the downward ripple was not actively weighted in the first place. Thus, the lack of symmetry in these auditory kernels may have precluded the appearance of visual-like surround effects.
Furthermore, sensitivity decreased only in the Down-Surround condition. Sensitivity in the No-Surround and Up-Surround conditions was comparable, suggesting that the mere presence of a surround signal does not necessarily make the task more difficult. Instead, the effect depended on the specific orientation of the surround. This orientation-specific influence supports the idea that listeners primarily tracked the upward-moving target: when the surround was upward-moving, it did not substantially disrupt performance, but when it was downward-moving, interference or increased confusion may have reduced sensitivity.
Although internal noise estimates did not differ significantly across conditions, sensitivity correlated moderately with internal noise, suggesting that part of the sensitivity change was driven by internal variability. Directional weightings were generally non-significant in the presence of surround signals, showing no clear tuning patterns. A small, non-significant trend toward positive weighting of the down-target in the Down-Surround condition is nonetheless consistent with increased confusion and the observed sensitivity reduction.
Overall, the strong same-direction suppression reported in vision could not be confirmed in the auditory domain. Instead, our data point to a more general reduction in tuning in the presence of surround modulation, with orientation-specific effects on performance. Future work could explore tasks or stimulus designs that explicitly encourage balanced monitoring of both upward and downward motion, to assess whether suppression effects more analogous to those in vision might then emerge. Additionally, more basic forms of spectro-temporal modulation detection interference, in analogy to MDI experiments, may provide a fruitful avenue for understanding contextual interactions among STM-tuned processes. Classical MDI studies have demonstrated that temporal modulation processing can be influenced by modulation in neighbouring frequency bands (Oxenham & Dau, 2001), but these effects have typically been investigated without directional structure. Systematically extending these paradigms to include directionally defined STMs, using simpler tasks, longer stimuli, and carefully controlled manipulations of the masker’s frequency region, could help establish the conditions under which interactions among putative STM-tuned filters arise.
4.3. Robustness of the Inferred Decision Strategy
The additional experiments were designed to assess whether the apparent upward-biased strategy observed in the main experiment reflected a task-specific artifact or a more general decision strategy. Notably, during the initial calibration procedure used to determine individual SNR levels, several participants did not converge to stable performance even at the maximum tested SNR of 25 dB. This calibration issue affected both of the follow-up experiments, as performance in the reference condition deviated from the intended (d′ ∼ 1), indicating that stable performance levels were not fully achieved for all participants. Nevertheless, it remains worthwhile to discuss the results: analyses including all participants, as well as analyses restricted to those performing above chance in the reference condition, yielded consistent patterns and did not alter the overall interpretation.
In the first experiment, manipulating the distribution of STM noise energy across the MPS had no measurable effect on sensitivity. This result does not provide evidence for asymmetric processing and leaves open the possibility that listeners flexibly adjusted their strategy across conditions. Alternatively, the absence of an effect may reflect limited sensitivity of the paradigm to the intended manipulation. The task required unusually high SNRs for reliable performance, such that the STM signal was already highly salient relative to the background noise. Under these conditions, redistributing energy within the noise may have produced only subtle changes that were insufficient to elicit measurable behavioural differences. This interpretation is consistent with the limited kernel structure away from the target-orientations observed in the main experiment, and suggests that stronger or more targeted manipulations, or alternatively task designs that permit reliable performance at lower SNRs, may be required to more effectively probe directional asymmetries. In contrast, the reference-based task yielded a more differentiated pattern. When listeners were explicitly cued to match a specific STM direction, sensitivity was selectively reduced in the Down-Reference condition, while performance in the Up-Reference condition was comparable to the No-Reference baseline. This finding would suggest that the upward-biased strategy is not simply induced by the specific noise statistics and procedure of the main experiment. Why the auditory system would adopt such a seemingly suboptimal strategy remains an open question. One possibility is that integration of spectro-temporal information from low to high frequencies is intrinsically more efficient, favouring upward modulation. Alternatively, the bias may reflect ecological adaptations, although analyses of natural sounds in MPS space have suggested greater prevalence of downward modulation (Osmanski et al., 2009). A more tentative possibility is that the present effect relates to the literature on auditory looming, according to which sounds signalling approach are processed with higher priority than sounds signalling recession (Bach et al., 2008; Baumgartner et al., 2017; Seifritz et al., 2002). However, the comparison is limited: looming is typically defined by acoustic cues to approach, such as rising intensity or approach-consistent spectral change, rather than by spectrotemporal modulation direction itself. Thus, while the present upward bias may be broadly consistent with a greater auditory sensitivity to approach-like acoustic change, any link to looming remains speculative and would require direct testing. Another important question is whether listeners can be trained to adopt alternative strategies, such as monitoring downward motion or both directions simultaneously. Recent work using game-based training paradigms for STM discrimination (de Larrea-Mancera et al., 2022) suggests this may be feasible. Understanding how such training alters perceptual weighting could help explain individual differences.
4.4. Model Interpretation
Combining reverse correlation with auditory modelling provides a powerful framework for disentangling sensory encoding from decisional strategies. By systematically varying model parameters, specifically modulation phase sensitivity and template representation, we showed that both factors strongly influence the resulting kernels. Within the modulation filterbank framework, the phase-sensitivity cut-off determines the temporal rates at which directional information is preserved. Simulations indicated that some degree of phase sensitivity was necessary both to perform the task and to reproduce the observed kernel asymmetries. When the cut-off was set to 0 Hz, the model weighted upward and downward motion similarly, rendering discrimination ineffective. Human sensitivity to envelope-modulation phase is generally thought to decline for temporal modulation rates above roughly 10 Hz (Dau, 1996; Sheft & Yost, 2007). Although this background helps contextualize our findings, it is important to note that the present experiment was not designed to characterise the limits of modulation-phase sensitivity. The rate–scale parameters were selected to target the spectro-temporal modulation region most relevant for speech intelligibility, as in our previous work (Ponsot et al., 2021), rather than to probe phase sensitivity per se. A dedicated test of the phase-sensitivity cutoff would require different choices of modulation parameters, including rates below and above 10 Hz, and substantially longer stimuli to provide sufficient cycles at low modulation rates. Thus, the approximate 10-Hz boundary observable in our results should be interpreted as a secondary outcome that aligns with the existing literature, rather than a primary objective of the study. Nevertheless, it highlights the value of more extensive behavioural investigations and dedicated research into phase sensitivity across listeners and its relation to STM and speech processing. An interesting feature of the model simulations, which was also reflected in the behavioural data, was the selective performance drop in the Down-Surround condition when using an up-target template. Although the template itself does not encode the surround, the anti-aligned down-surround interacts differently with the template across intervals, effectively reducing the difference in correlation between the up- and down-target intervals. In contrast, an up-surround is positively correlated with the template in both intervals, leaving the decision variable largely unaffected. This asymmetry indicates that the model can confuse up- and down-targets when the surround is opposite to the template, demonstrating that surround energy can influence template-based decisions in a directionally specific manner. These results suggest that the observed surround-dependent effects reflect the interaction between the target, the template, and the surround, rather than any explicit encoding of the surround itself.
4.5. Non-linear Target–Noise Interactions
The absence of structure in the down-present kernels when using an up-template highlights important non-linear interactions between stimuli and decisional processes. Although kernels are computed from the noise alone, the stimuli always contained a target, which interacts with the noise. These non-linear interactions appear strong, particularly at the high SNRs used here, suppressing structure that might otherwise emerge and yielding relatively flat down-present kernels. This effect is especially clear in simulations with a 0 Hz phase-sensitivity cut-off: the model weights both up- and down-targets equally at the filter output, yet the up-present kernel displayed a single peak at the up-target, while the down-present kernel showed a single peak at the down-target, rather than dual peaks. This phenomenon helps explain why reverse-correlation studies typically include noise-only intervals: kernels from such intervals provide a more reliable estimate of the perceptual weighting, uncontaminated by non-linear distortions from the target. Given the strong impact of these interactions in the present study, future work should explore the design of discrimination paradigms that incorporate noise-only intervals, enabling a cleaner isolation of listeners’ weighting strategies.
5. Conclusion
This work extended reverse-correlation methods to STM direction discrimination, offering insights into how listeners encode upward- and downward-moving spectro-temporal patterns. Behavioural data revealed that STM discrimination is considerably more demanding than STM detection, with large inter-individual variability and a systematic bias toward monitoring upward motion. Surround manipulations showed orientation-specific effects, with decreased sensitivity only in the down-surround condition, further supporting an asymmetric perceptual strategy. Model simulations, as well as behavioural performance differences observed under different experimental conditions, aligned with these findings, indicating that the observed discrimination strategies required both modulation phase sensitivity and reliance on an upward-target template. Collectively, these results suggest that listeners do not employ a symmetric, joint encoding of motion directions but instead preferentially track upward-moving ripples. Future work should explore whether training or alternative task designs can promote balanced monitoring of motion directions, and how such strategies might relate to speech processing.
Footnotes
Acknowledgements
We would like to thank Helia Relaño-Iborra and Torsten Dau for helpful comments on earlier versions of the manuscript.
Funding
The authors disclosed receipt of the following financial support for the research, authorship, and/or publication of this article: This work was supported by the Center for Applied Hearing Research (CAHR), the Agence nationale de la recherche (ANR-22-FRAL-0003, ANR-10-LABX-0087, ANR-10-IDEX-0001-02, ANR-19-CE28-0010-01, ANR-22-CE28-0010), Fondation pour l’Audition (FPA 2020-005F2) and IIT (grant IVXX000701).
Declaration of Conflicting Interests
The authors declared no potential conflicts of interest with respect to the research, authorship, and/or publication of this article.
Data Availability Statement
Data and model implementation will be made available upon request.