






Abstract
The benefit provided by hearing devices often differs between laboratory evaluations and real-world conditions, due to low signal-to-noise ratio (SNR) in adaptive speech tests and differences in head movement behavior between laboratory evaluations and real conversations. This study aimed to investigate whether SNR improvement provided by a spatial filter can be measured during free conversation in virtual reality (VR) and to compare this SNR improvement with the benefit measured using a speech test with two spatially separated talkers in the same VR. Two experimental conditions were tested in 11 normal-hearing participants. Condition 1 involved free conversations between a participant and two confederates represented by avatars, and Condition 2 utilized an adaptive speech test with two speakers, presented by the same avatars. Acoustic simulations were used to render speech signals, background noise and room acoustics. A spatial filter with two levels of selectivity was simulated in VR using the participant’s actual dynamic head orientation. Acoustic measures of the benefit of the spatial filter were derived from these simulated signals. The benefit was higher when measured in free conversations than in the speech test. Additionally, participants were found to move their heads closer to active speakers during free conversation than during the speech test. Furthermore, SNR in free conversations was closer to SNRs typical of conversational environments. These findings suggest that the effectiveness of hearing devices can be evaluated through conversations in VR at more realistic SNRs. Consequently, this approach may improve the ecological validity of hearing aid research outcomes.
Keywords
Introduction
The effectiveness of modern directional hearing aids is closely linked to the head movement behavior of their users (Hendrikse, Grimm, & Hohmann, 2020). Recent advances in hearing aid technology have introduced novel algorithms that are controlled by both gaze and head movements (Best et al., 2017; Grimm et al., 2018; Hart et al., 2009). But also more conventional algorithms like spatial filtering can be influenced by head movement behavior, due to misalignment or mal-adaptation (Hendrikse, Grimm, & Hohmann, 2020). With increasing spatial selectivity of algorithms as for example provided by recent machine learning approaches (e.g., Westhausen et al., 2024), misalignment may play an increasingly important role. This interaction between hearing aid performance and movement behavior highlights the need for users to behave naturally in terms of communication-related gaze and head movements during the evaluation process.
Ecological validity in hearing research describes the degree to which the outcome of studies is representative of performance in real life (Keidser et al., 2020). This means that a traditional assessment of hearing device benefit, e.g., using speech reception thresholds in simple spatial configurations, may be ecologically valid if the hearing aid user behave in a way that the benefit provided by a device is the same during the assessment as in real life. To achieve natural communication behavior, interactivity is required (Hadley et al., 2019; Hartwig et al., 2021; Schilbach et al., 2013), e.g., in the form of interactive free conversation. Turn take timing (Hadley & Culling, 2022; Heldner & Edlund, 2010), gaze behavior (Holler & Kendrick, 2015; Vertegaal et al., 2001) and movement behavior (Grimm et al., 2020) are critical aspects of natural communication that must be preserved during evaluations.
In order to accurately assess the performance of advanced hearing devices in a controlled laboratory environment, such as behavior-controlled or machine-learning-based devices, it is necessary to replicate real-world communication scenarios (Hohmann et al., 2020), opposed to experimental paradigms of low complexity. This involves creating settings in which users engage in interactive conversations that allow for a natural flow of communication behaviors, such as eye gaze and head movement, but also speech production. The present study aims to refine evaluation methods along these lines, ensuring they correctly quantify device performance while preserving the naturalness of underlying communication behaviors.
Many hearing aid benefit studies rely on speech audiometry, such as sentence tests in noise, to derive a single metric, the speech reception threshold (SRT) (Davidson et al., 2021). However, due to the artificial nature of the test and the single target source typically used, no conversation-related head movement patterns can be expected. Our central research question is: Can acoustic measures of real ongoing conversations in VR be used to estimate the benefit of speech enhancement, such as spatial filtering, while preserving the natural communication behavior of their users? In addressing this question, we aim to bridge the gap between conventional, highly controlled audiometric procedures and increasingly complex, behavior-dependent algorithms. This may enhance the ecological validity of laboratory-based hearing aid assessments.
In order to answer our research question, we engaged test participants in free triadic interactive conversations with two confederates in a noisy environment. The participants were asked to communicate freely and successfully for a few minutes during a test run. For the test participants, we applied a spatial filter algorithm and performed test runs with different levels of spatial selectivity to investigate the interaction effect of speech enhancement and movement behavior on the ongoing conversation. The participants and the confederates experienced the same acoustic environment, which forced them to adapt their behavior (e.g. vocal effort) individually in order to maintain successful communication during each test run. The experiment was implemented using interactive, low-delay, virtual reality and telepresence technology. Free, interactive conversations were interleaved with speech tests in which the avatars reproduced the test’s speech material, using the same spatial geometry and avatar animations as in the conversations. The key comparison is the signal-to-noise ratio (SNR) improvement due to spatial filtering measured during free conversation versus the SNR improvement obtained during the speech test. These two SNR improvements are expected to differ because participants adopt different head-movement strategies in these two tasks and because the adaptive level-adaptation procedure of the speech test drives the SNR to lower values than those that naturally arise in conversation.
Methods
Experimental Paradigm, Tasks and Conditions
Figure 1 shows an overview of the experiment. The test participants were seated in a spatial audio laboratory (bottom center block and bottom left picture in Figure 1) and surrounded by a spherical loudspeaker array positioned behind a cylindrical projection screen. They were placed in a virtual audiovisual simulation of a pub environment, with two avatars positioned in front of them. Overview of the experimental setup, in the free conversation condition. The test participant was seated in the laboratory and surrounded by 45 loudspeakers and a projection screen displaying an animated image of a virtual pub environment. This environment included two avatars representing the experimenter and another confederate. The experimenter and confederate were placed in a remote office, and their voices as well as their head movements were transmitted to the reproduction system.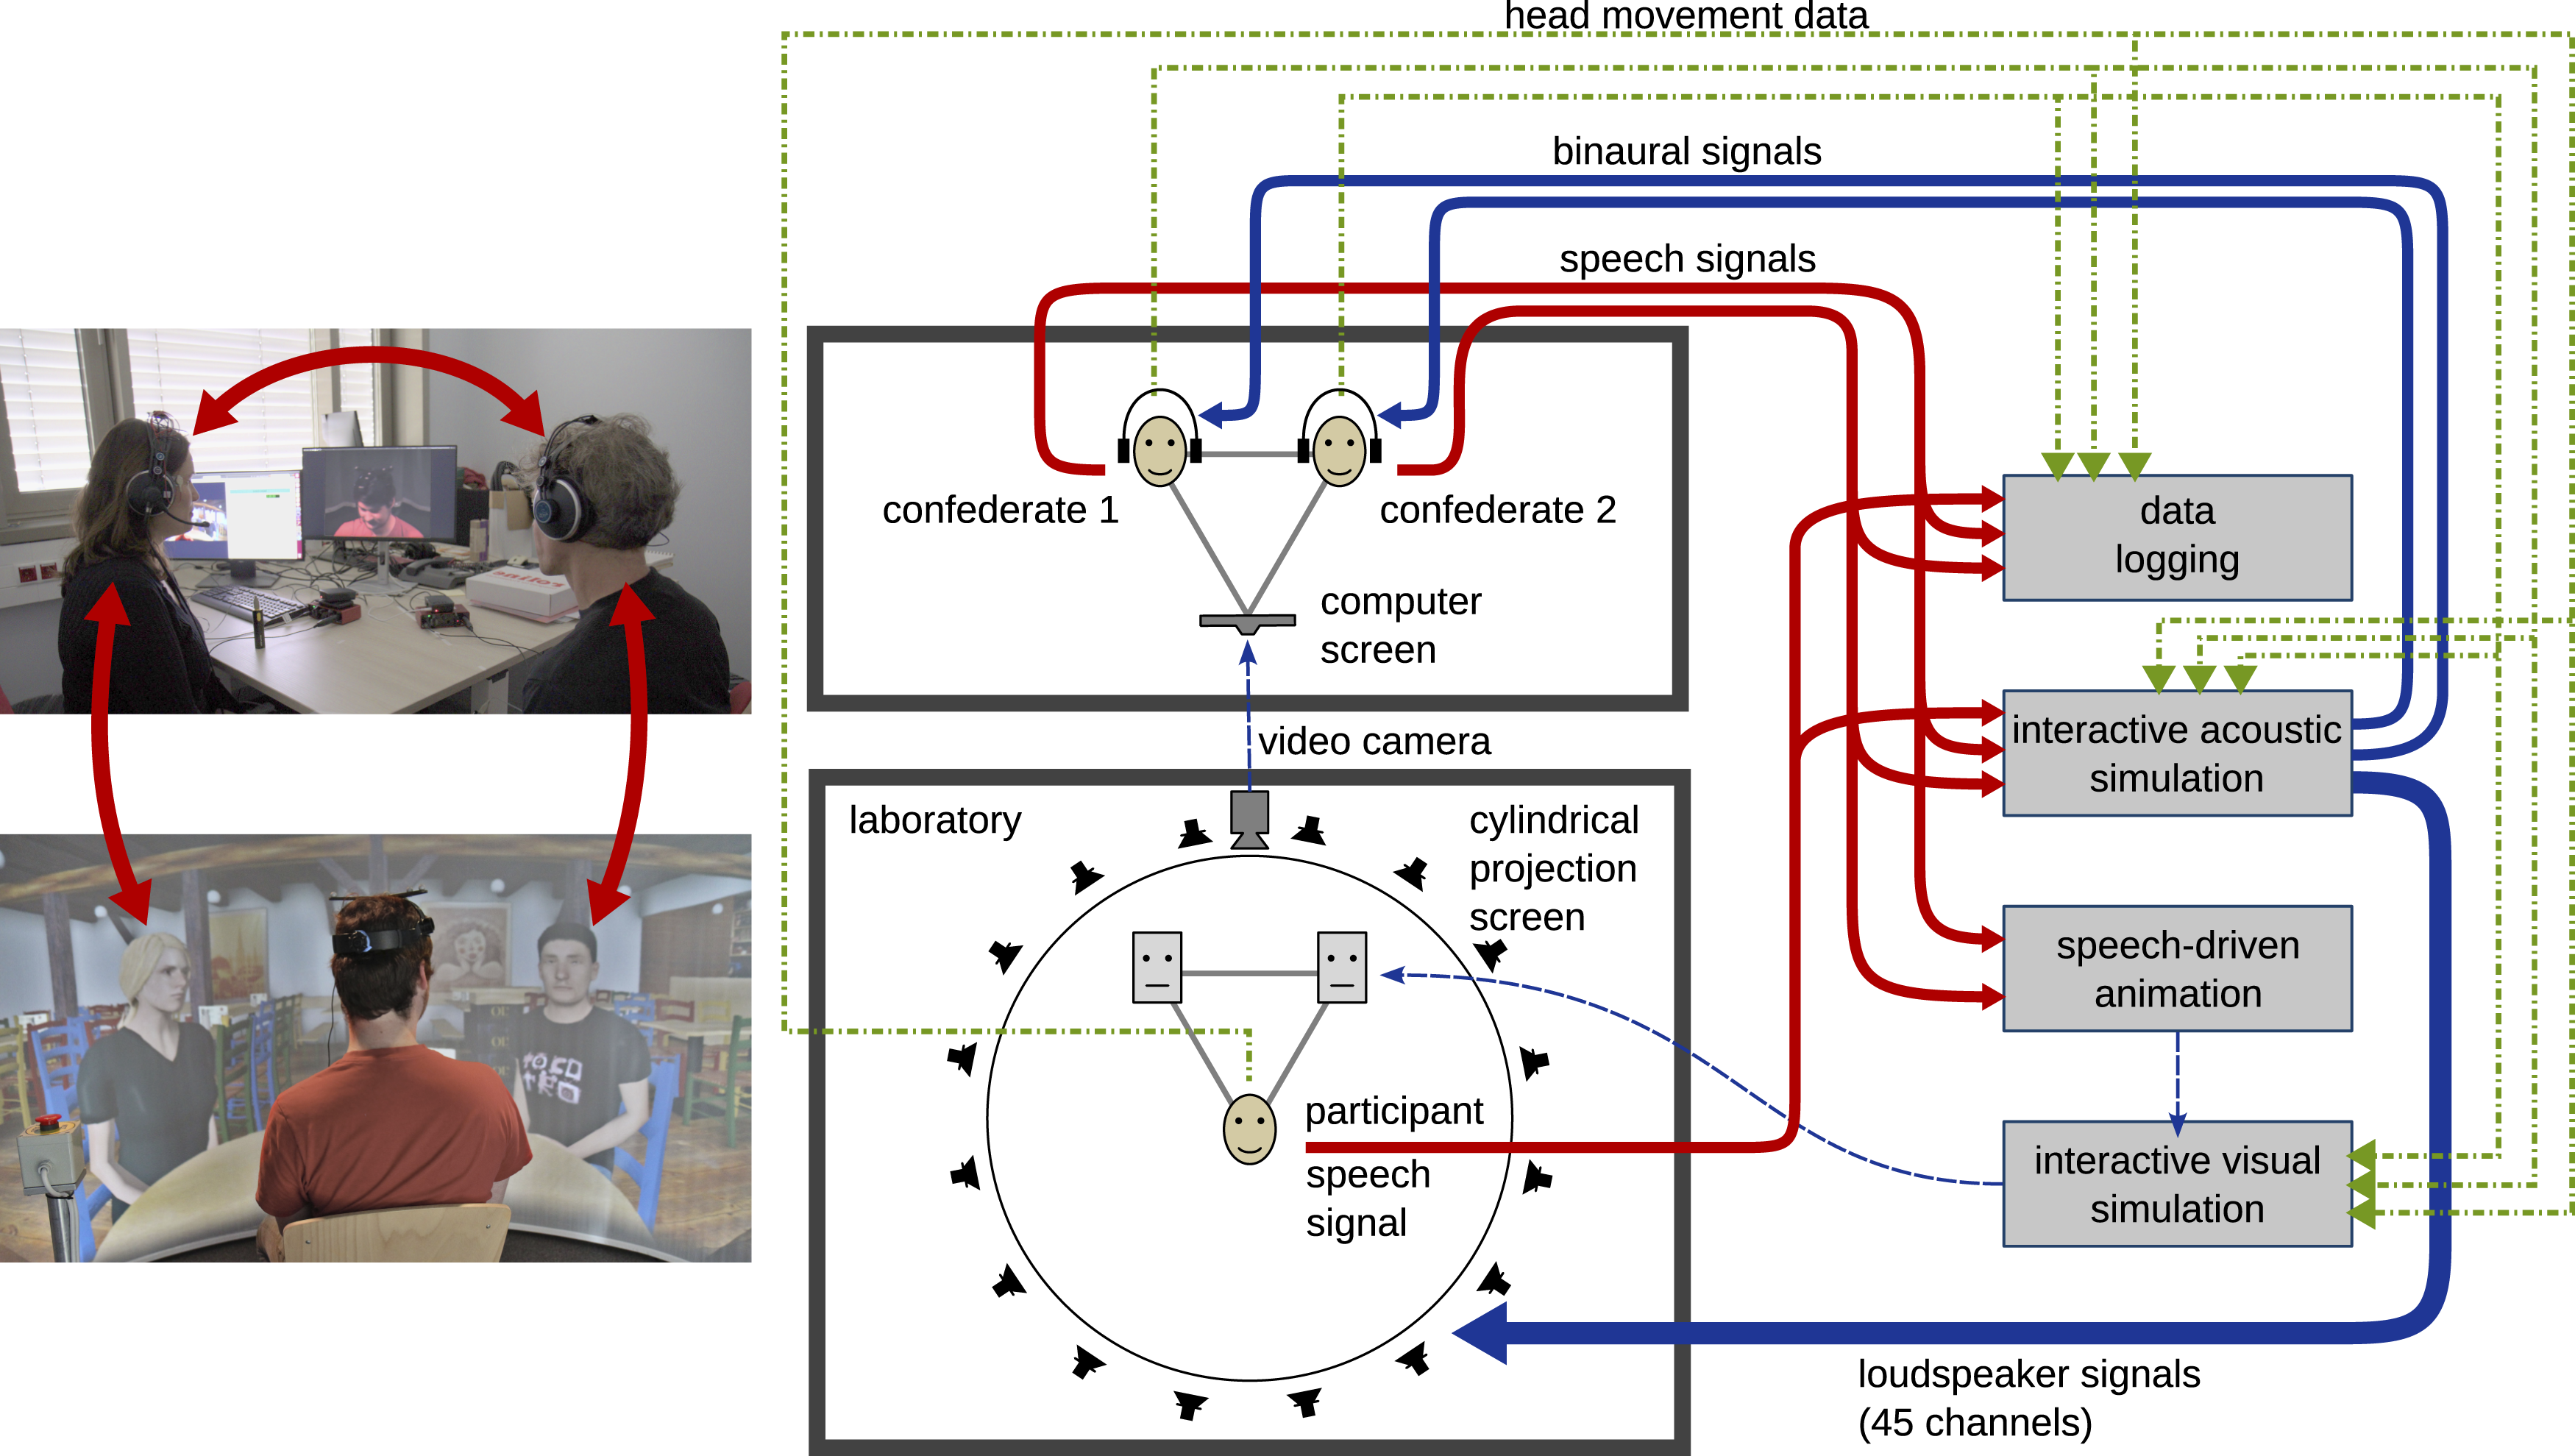
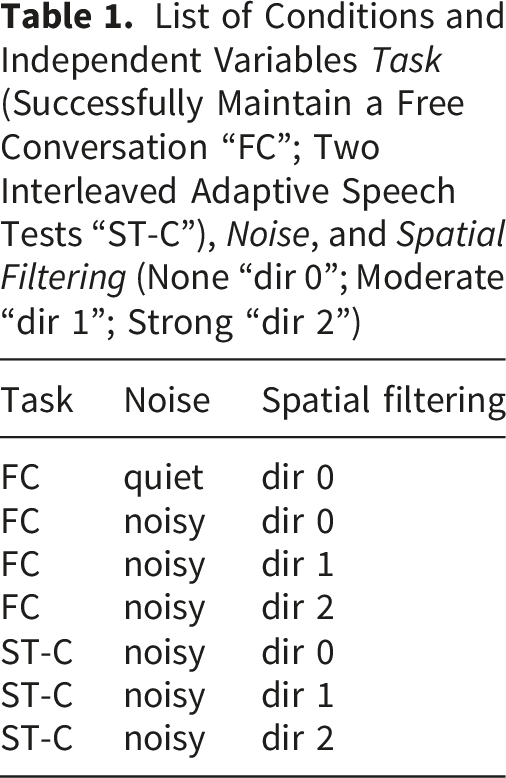
The participants had to complete two different tasks, depending on the experimental condition. One task was to successfully maintain a free conversation (“FC”) in noise in a triadic setting between the participant and two confederates (top center block and top left picture in Figure 1). Although no topics were provided, the confederates initiated the conversation with casual topics such as food preferences, travel, and vacation plans. The confederates were displayed in the laboratory, represented by avatars. They saw the test participant on a computer screen.
List of Conditions and Independent Variables Task (Successfully Maintain a Free Conversation “FC”; Two Interleaved Adaptive Speech Tests “ST-C”), Noise, and Spatial Filtering (None “dir 0”; Moderate “dir 1”; Strong “dir 2”)
Interactive Acoustic Simulation
This study’s experiment was performed using a virtual audiovisual simulation. The acoustic part was rendered with TASCAR (Grimm, Luberadzka, & Hohmann, 2019); see block “interactive acoustic simulation” in Figure 1. Depending on the condition, speech signals originated either from the confederates in a triadic conversation (upper red lines in Figure 1), or from a speech matrix test. The speech signals were placed as omni-directional acoustic sources in the virtual acoustic environment. Early reflections from surfaces such as tables, walls, and ceiling were simulated using a first-order geometric image source model. The early reflections and late reverberation of the test participant’s voice (red line from participant to acoustic simulation) was rendered via loudspeakers, to achieve the same acoustics for the confederates and the participants and thus to increase the level of immersion. The signals were reproduced via 45 loudspeakers positioned around the participant, using Vector Base Amplitude Panning (VBAP) (Pulkki, 1997). This way, virtual sound sources can also be placed between loudspeakers, and continuous movement patterns are possible; the localisation error for virtual sound sources, as well as the minimum audible angle for this setup, is in the order of 2° (Gerken et al., 2024). Later parts of the reverberation were simulated using a feedback delay network (FDN). The feedback matrix was designed as suggested by Rocchesso and Smith (1997). The output of the FDN, as well as diffuse background noise signals, were processed as first-order ambisonic signals. For the reproduction via the overdetermined loudspeaker reproduction system, a
The head movement behavior of the participant as well as the head movement behavior of the confederates influenced the acoustic simulation presented to the participants: The horizontal translation of the participant’s head influenced the listening position within the virtual scene, resulting in subtle timbral effects due to altered reflections, level changes due to altered distances to the virtual sources, and dynamic spatial cues due to angular changes. The head orientation of the confederates resulted in a rotation of the acoustic source around the neck position, here simulated as a distance of 15 cm. This resulted in subtle timbral changes due to altered reflections and Doppler shift. The level changes caused by the altered distance between participant and sound source due to the source rotation are in the order of 0.3 dB and therefore probably not noticeable.
For the confederates, the stimuli were reproduced via headphones. They listened to a simplified version of the acoustic model that did not include a simulation of early reflections. Their head orientations were used to achieve head-tracked binaural rendering, i.e., the orientation recorded by a motion sensor attached to their headphones was used to render the stimuli from the correct listener-centric direction of the sound source. A non-individualized parametric head-related transfer function (HRTF) model (Ewert et al., 2021; Schwark et al., 2022) was used to render the stimuli. Speech and noise levels were calibrated to match those experienced by the test participants.
Simulated Spatial Filter
A spatial filter was simulated within the rendering system. The steering direction of the spatial filter was controlled by the participant’s head movements. The desired directivity pattern was achieved by applying attenuation according to the angular distance between the steering direction (i.e. head orientation) and the sound sources’ incidence direction. Image sources created by the geometric image source model were treated in the same way as direct sound sources. In the acoustic simulation engine, diffuse sound fields (e.g., background noise and reverberation) are rendered as first-order ambisonic signals. The output of the diffuse sound field simulation, i.e., the sum of diffuse reverberation and diffuse noise sound fields, was filtered using modal beamforming, before decoding to loudspeakers.
This study employed three levels of directivity. A directivity of 0 (“dir 0”) corresponds to an omni-directional setting, i.e. bypassing the filter. A directivity of 1 (“dir 1”) represents a cardioid pattern. A directivity of 2 (“dir 2”) results in an even narrower pattern. As modal beamforming in first-order ambisonics does not permit arbitrarily narrow beams, direction-independent attenuation of the first-order ambisonic signal was applied heuristically, in addition to the modal beamformer. This additional gain was identified in advance by comparing the attenuation in a diffuse sound field, which was created using a large number of statistically independent sound sources arranged on a sphere, with the corresponding first-order ambisonic sound field. The off-axis attenuation of the simulated spatial filtering was limited to 12 dB. Figure 2 shows the directivity patterns for the settings used in this study. Directivity pattern of the simulated spatial filter. Setting ‘dir 0’ is omnidirectional, ‘dir 1’ is similar to a cardioid directionality pattern, and ‘dir 2’ has a higher spatial selectivity.
The position of all sound sources and the steering vector were updated every 5.3 ms. The gains resulting from the spatial filtering were then interpolated within each 5.3 ms audio block. This enabled continuous filtering for dynamic head orientations and moving sources. This spatial filtering is independent of the SNR, similar to linear multi-microphone beamforming. This contrasts with adaptive spatial filtering, which is commonly used to achieve higher spatial selectivity in hearing devices.
Audiovisual Virtual Environment
This study was virtually set in a pub environment with ambient noise. The audiovisual simulation was modelled after an existing location, the “OLs Brauhaus” in Oldenburg (Grimm et al., 2021; van de Par et al., 2022). Early reflections from the walls, ceiling, floor and a table were simulated using a geometric image source model, together with late reverberation generated by a feedback delay network. The reverberation time T30 was 0.67 s. The target speakers and the test participant formed an equilateral triangle with an edge length of 1.2 m, with the female avatar positioned to the left of the participant and the male avatar positioned to the right.
In the noisy conditions, the acoustic background scene consisted of diffuse noise, recorded in a cafeteria (Grimm, Kothe, & Hohmann, 2019) with a level of 66 dB SPL(C) at the listening position. Additionally, a music signal (Dokapi, 2015) was played back from two simulated loudspeakers in a distance of 4.2 and 5.9 m, with a level of 65 dB SPL(C) at the listening position. Finally, both in the noisy and quiet conditions, a diffuse sound field recorded in a kitchen, resembling the sound of a refrigerator, was added with a level of 42 dB SPL(C) at the listening position (Grimm, Kothe, & Hohmann, 2019). This sound was primarily used to mask the varying sound of the video projector with a defined constant sound level. A top view scale model of the acoustic environment can be seen in Figure 3. A true-to-scale top view of the acoustic environment. The simulated room was 10.2 m wide, 14.76 m long and 2.9 m high.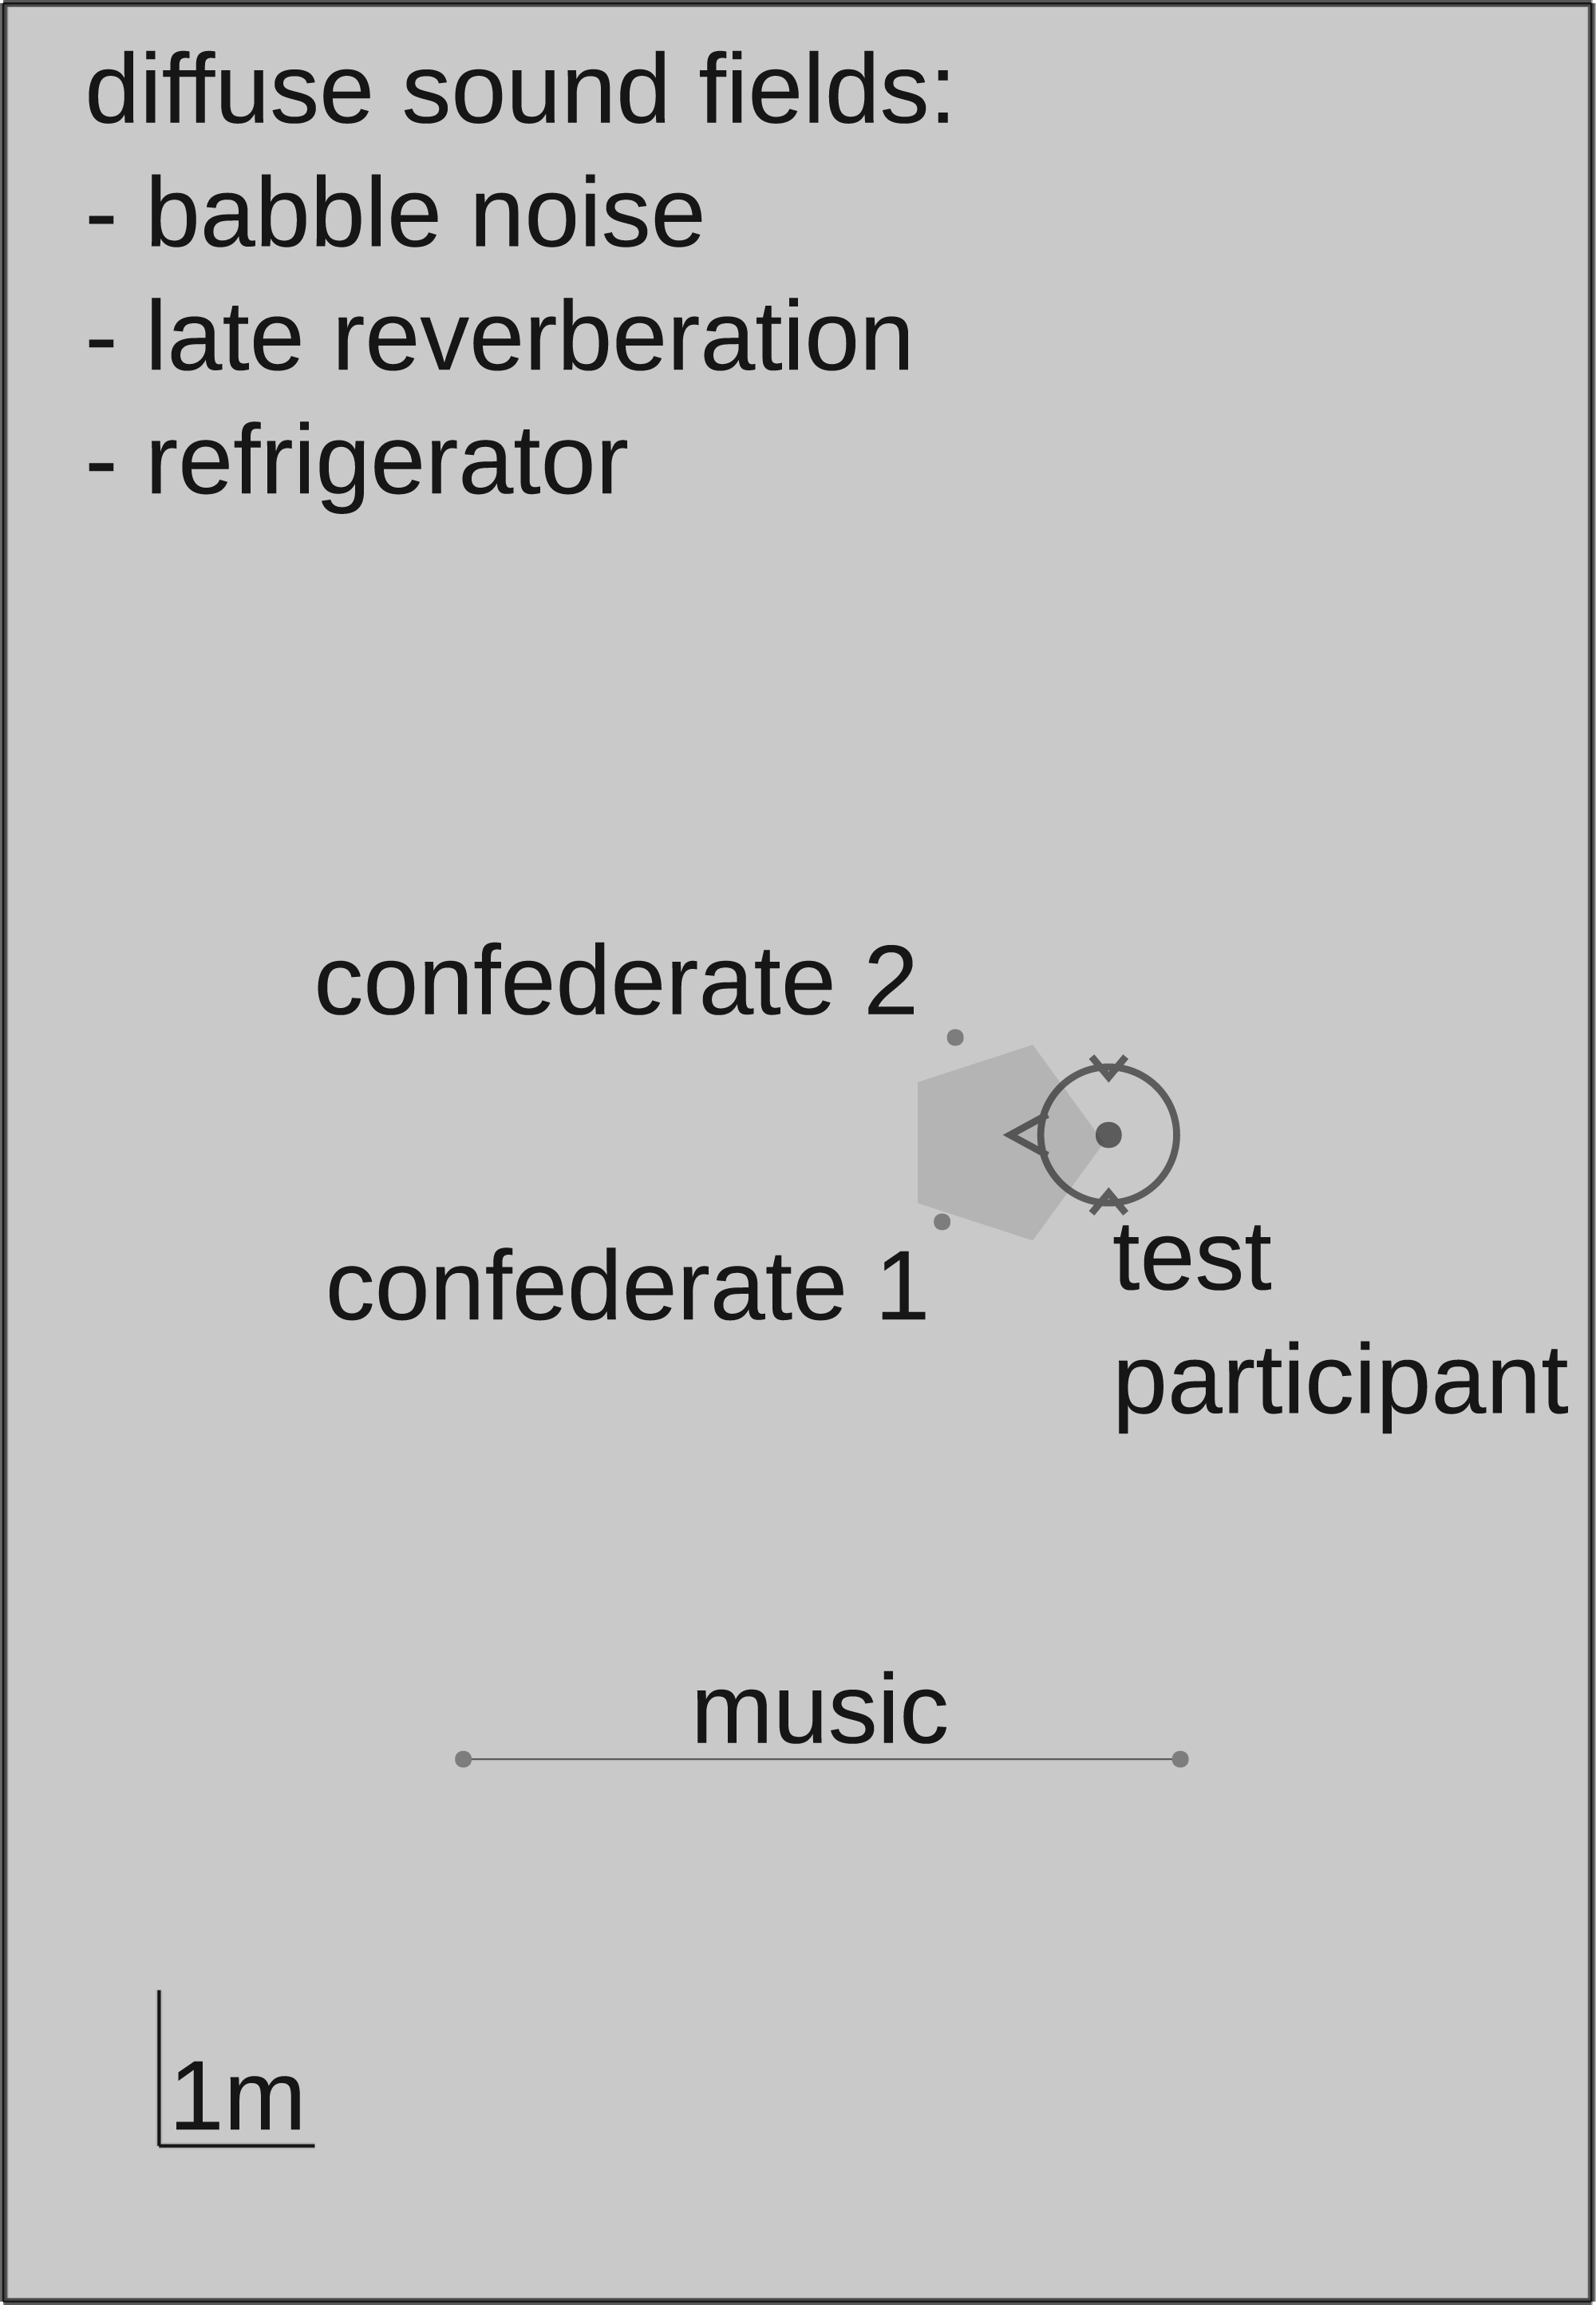
The visual environment was rendered using the Blender Game Engine (version 2.79c). The avatars of the confederates as well as guests in the background were simulated as virtual animated characters. Lip movements of the avatars were animated in real time with low delay using a speech-driven lip animation method (Llorach et al., 2016) (see block “speech-driven animation” in Figure 1), which was based solely on the respective acoustic sound sources, i.e. the confederates’ speech signal in the “FC” conditions and the speech matrix test signals in the “ST-C” conditions.
The head movements of avatars depended on experimental condition: In the “FC” conditions, the avatars’ head movements were controlled by the real head movements of the confederates they represented (Kothe et al., 2026). In the speech test (“ST-C”), the head movements were controlled by the speech test. Here, the avatar representing the target speaker began to turn the head towards the test participant 0.7 s before the next sentence began. The other avatar, who remained silent, turned the head towards the target speaker at the start of the sentence, and towards the test participant, when they started to speak to repeat what they understood. These automated head movements lasted approximately 0.7 s, reaching a peak velocity of approximately 120°/s. The gaze direction of the avatars was controlled by their head movements and either directed towards the test participant or the other confederate, depending on which was closer to their head orientation. Gaze changes were instantaneous. Eye blinks were simulated at random times, and a slow torso movement simulating breathing was applied to the avatars.
To increase the immersion into the virtual environment and to create a sense of depth despite the two-dimensional video projection, the head translation of the participants was used to calculate a parallax effect, by shifting the virtual camera in the game engine as well as the receiver position in the acoustic simulation, as described in Hendrikse et al. (2019). This effect visually allowed to look behind objects and resolve ambiguities in depth perception.
Apparatus
In the experiment, the test participants were located in a virtual reality laboratory surrounded by 45 Genelec 8020 loudspeakers and a video projection with a field of view of 300° on a cylindrical screen (bottom centre block in Figure 1); see also Hohmann et al. (2020). Sixteen loudspeakers were located at ear level, spaced at 22.5° intervals, starting at 11.25°. A second ring of 16 loudspeakers was positioned at an elevation of 15.5°, spaced at 22.5° intervals starting from 11.25°. A ring of six loudspeakers was positioned at floor level, corresponding to -30° elevation and spaced at 60° intervals, starting at 30°. A second ring of six loudspeakers was positioned at an elevation of approximately 45°, spaced at 60° intervals, starting at 0°. Finally, one loudspeaker was positioned directly above the participant.
The interlocutors were located in a separate room. Audio signals as well as head movement and gaze data (not used here) were transmitted to the laboratory via the internet with low latency using the OVBOX system (Grimm, 2024). In the virtual reality laboratory, the virtual acoustic environment was rendered using version 0.229.2.58-6a04339 of TASCAR (Grimm, Luberadzka, & Hohmann, 2019).
The head movements of the participants were recorded using a Qualisys Miqus M3 optical marker-crown tracking system comprising six cameras. Head movements of the confederates were recorded with a IMU sensor attached to the headsets, consisting of a MPU6050 motion sensor and processor, with an ESP8266 Wifi micro-controller to send the data as OSC messages (Grimm, 2025).
The speech level was recorded with a head-attached microphone for the participant, and with the headset microphones for the confederates. All data were recorded in a central data logging implemented in TASCAR. For illustration, videos of the setup can be found in the Supplementary Material section.
Measures
The dependent variables comprised acoustic and behavioral measures obtained under experimental conditions described in Section “Experimental paradigm, tasks and conditions”.
The speech level at the source was recorded using a head-mounted microphone positioned near the speaker’s mouth. To compensate the near-field effect of the microphone, a second order highpass filter with a cut-off frequency of 180 Hz was applied to the signal before further processing. As the microphone moves with the head, this level reflects the sound pressure level of the target speech, regardless of subsequent head translation or rotation.
To estimate the sound pressure level at the participant’s ears, a non-individualized parametric head-related transfer function (HRTF) model (Ewert et al., 2021; Schwark et al., 2022) was embedded in the virtual acoustic scene. This model can be interpreted as a virtual in-ear microphone. It generated binaural signals, separately for the target speech S, and combination of background babble noise, refrigerator sound and late reverberation N at the listening position, while explicitly accounting for the participant’s head movements in terms of translation and rotation. The binaural signals for S and N were computed both unprocessed (without spatial filtering), labeled with ‘u’, and processed, labeled with ‘p’, using the simulated spatial filter. In other words, a set of four binaural signals was generated, l and r denoting the left and right channels:
It is important to note that the unprocessed signals x
u
are an approximation of those that would have been heard by the participants without spatial filtering. In contrast, the processed signals x
p
are an estimate of those that were actually heard. In the filter condition “dir 0”, the signals x
u
and x
p
are identical. A set of short-term levels in 10 ms windows
An estimate of the signal-to-noise ratio (SNR) at the participant’s left ear, 
Typically, SNR may differ between the left and right ears, with the SNR of the better ear being the primary factor limiting performance. Therefore, for the evaluation of hearing device algorithms, it is a common approach to select the signal of the ear with the better SNR (Hendrikse et al., 2022; Jespersen et al., 2021). To account for this effect, here the better ear was identified within each 10 ms time segment. This was based on the processed signals, and the same selection was used when calculating the unprocessed SNR:

For the unprocessed SNR, SNR
u
, the criterion depended also on SNR
p
, because the participants received only the processed signals. The SNR improvement, ΔSNR, is the difference between those:
For further analysis of these measures,
Note that the SNR was measured based on the speech signals produced in the virtual acoustic environment interactively, i.e., the speakers adapted their voice to the noise condition, and therefore influenced the recorded SNR.
Speech intelligibility was quantified using the SRT, which was measured via an adaptive procedure that varied the speech level while maintaining a constant noise level (OLSA; Wagener et al., 1999; Wagener & Brand, 2005). The level adaptation method was configured to converge at the speech level at which the participant correctly identified 80% of words. The background noise of the environment was used as the noise stimulus. A psychometric function was fitted to the data. The SRT is the SNR at which the psychometric function reaches 80% (SRT80). In this study, the control of the sentence test was based on the raw speech material and an assumed stationary noise, with regard to which all SNRs and the SRT are calibrated. Therefore, the absolute SRT had an arbitrary offset, which was corrected by adjusting the median SRT pooled across all speech test conditions and participants to the median SNR pooled across the last 10 sentences of each list and the same conditions. This approach resulted in a single calibration offset for the whole experiment and therefore maintained all individual differences and variance across conditions. The benefit measured in SRT, ΔSRT, is the difference between the SRT in a condition with spatial filtering (“ST-C” with “dir 1”/“dir 2”) and the SRT in the condition without spatial filtering (“ST-C” with “dir 0”).
Two test lists, each containing 20 sentences, were randomly interleaved: one with a male voice and one with a female voice. The acoustic source positions were the same as in the triadic conversation. The voice and avatar sex were always matched. Due to the target speaker’s head movement animation (turning towards the participant) and the non-target speaker’s head movement animation (turning towards the target speaker), the spatial uncertainty was reduced. By using a spatially more complex and moderately fluctuating background noise, as well as spatially distributed, randomly interleaved target sound sources, the speech test was more complex than the typically used original version with a single target source and stationary speech-shaped noise. The speech test with 40 sentences in total had a duration of approximately 5 minutes.
Hypotheses and Statistical Analysis
Our research question is whether the benefit provided by hearing aids can be assessed in free conversation with a similar outcome to that achieved in speech tests. In free conversation, the benefit cannot be directly quantified. However, it is possible to measure or at least estimate the SNR using virtual acoustic simulation techniques. Furthermore, since target and noise signals are accessible separately, it is possible to measure the SNR improvement provided by signal enhancement schemes. This study is based on the following measures: • The SNR at the listener’s ear before and after processing during FC • The SNR at the listener’s ear during ST-C • The SRT as measured from the SNR at the source during ST-C
The primary hypotheses of this study are: The benefit provided by directional filtering, as measured by the speech-reception threshold (SRT) in a speech test, is comparable to the improvement of the signal-to-noise ratio (SNR) during the test. Furthermore, we hypothesize that the SNR improvement in a speech test is comparable to the SNR improvement in free, interactive conversation. A repeated measures analysis of variance (ANOVA) was used for analysis of main effects and interaction effects. The dependent variable was the algorithm benefit in dB. Mauchly’s test of sphericity was applied, and Greenhouse-Geisser corrections were used when sphericity was violated. Post-hoc pairwise comparisons were conducted to examine significant main effects. For each factor, paired-samples t-tests were performed due to the within-subjects nature of the design. p-values were adjusted for multiple comparisons using the Bonferroni correction. All analyses were performed in R (version 4.5.2) using the rstatix package.
Furthermore, based on previous observations, we assume that the head movement differs between free conversation and speech tests (H2). Again, a repeated measures analysis of variance (ANOVA) was used for analysis of main effects and interaction effects. The dependent variable was the angular distance between head orientation and active speaker. The post-hoc analysis was performed as before.
We expect that evaluating hearing devices using free conversation will result in a more typical SNR, thereby increasing the ecological validity of device evaluation outcomes (H3). However, ecological validity cannot be directly quantified. Therefore, we compare our results with data from the literature on typical SNRs (Smeds et al., 2015). Similarly, we investigate the interaction between spatial filtering and the vocal effort, expressed in speech level (H4).
The internal validity of the paradigm and the apparatus was tested based on the Lombard effect (Brumm & Zollinger, 2011; Garnier & Henrich, 2014), i.e., the effect of noise level on speech production, here measured in terms of broadband speech level. This effect should be consistent for all speakers, regardless of the reproduction method or their role.
Test Participants
A total of 11 young test participants were recruited, with a mean age of 25.1 years (standard deviation 5.2 years). All participants were native German speakers who self-reported normal hearing. None of the participants knew the experimenters beforehand. All participants provided written consent after being fully informed about the study. The study was approved by the ethics committee of the Carl von Ossietzky Universität Oldenburg (Drs.EK/2021/068).
Results
Signal to Noise Ratio Before and After Spatial Filtering
Figure 4 shows the SNR without (label ‘u’) and with (label ‘p’) spatial filtering in the different tasks ‘FC’ (top left panel) and ‘ST-C’ (top middle panel) as well as the SRT (top right panel). During free conversation, the SNR
u
before any spatial processing (data points with label ‘u’) is around −6 dB (Figure 4, top left panel). It depends only on the background noise and the speech level of the confederates. For the test participants, it is independent of the spatial selectivity, because the confederates’ speech level did not or only marginally depend on the spatial filter provided to the test participant. SNR in free conversation (top left panel), SNR in speech test (top middle panel) and SRT (top right panel), together with the corresponding improvements (bottom panels). The unprocessed SNR (’u’, thin lines) is the SNR which would be present at the input of a hearing aid, the processed SNR (’p’, thick lines) is the SNR at the ear of the device user. The increase due to the spatial filtering was larger when quantified as SNR (bottom left and middle panel) than when quantified as SRT (bottom right panel). The SNR improvement measured in free conversation (left panel) was slightly higher than in the speech test (middle panel). In free conversation, the variance in SNR improvement is higher for dir2 than for dir1. These findings may indicate an effect of head motion.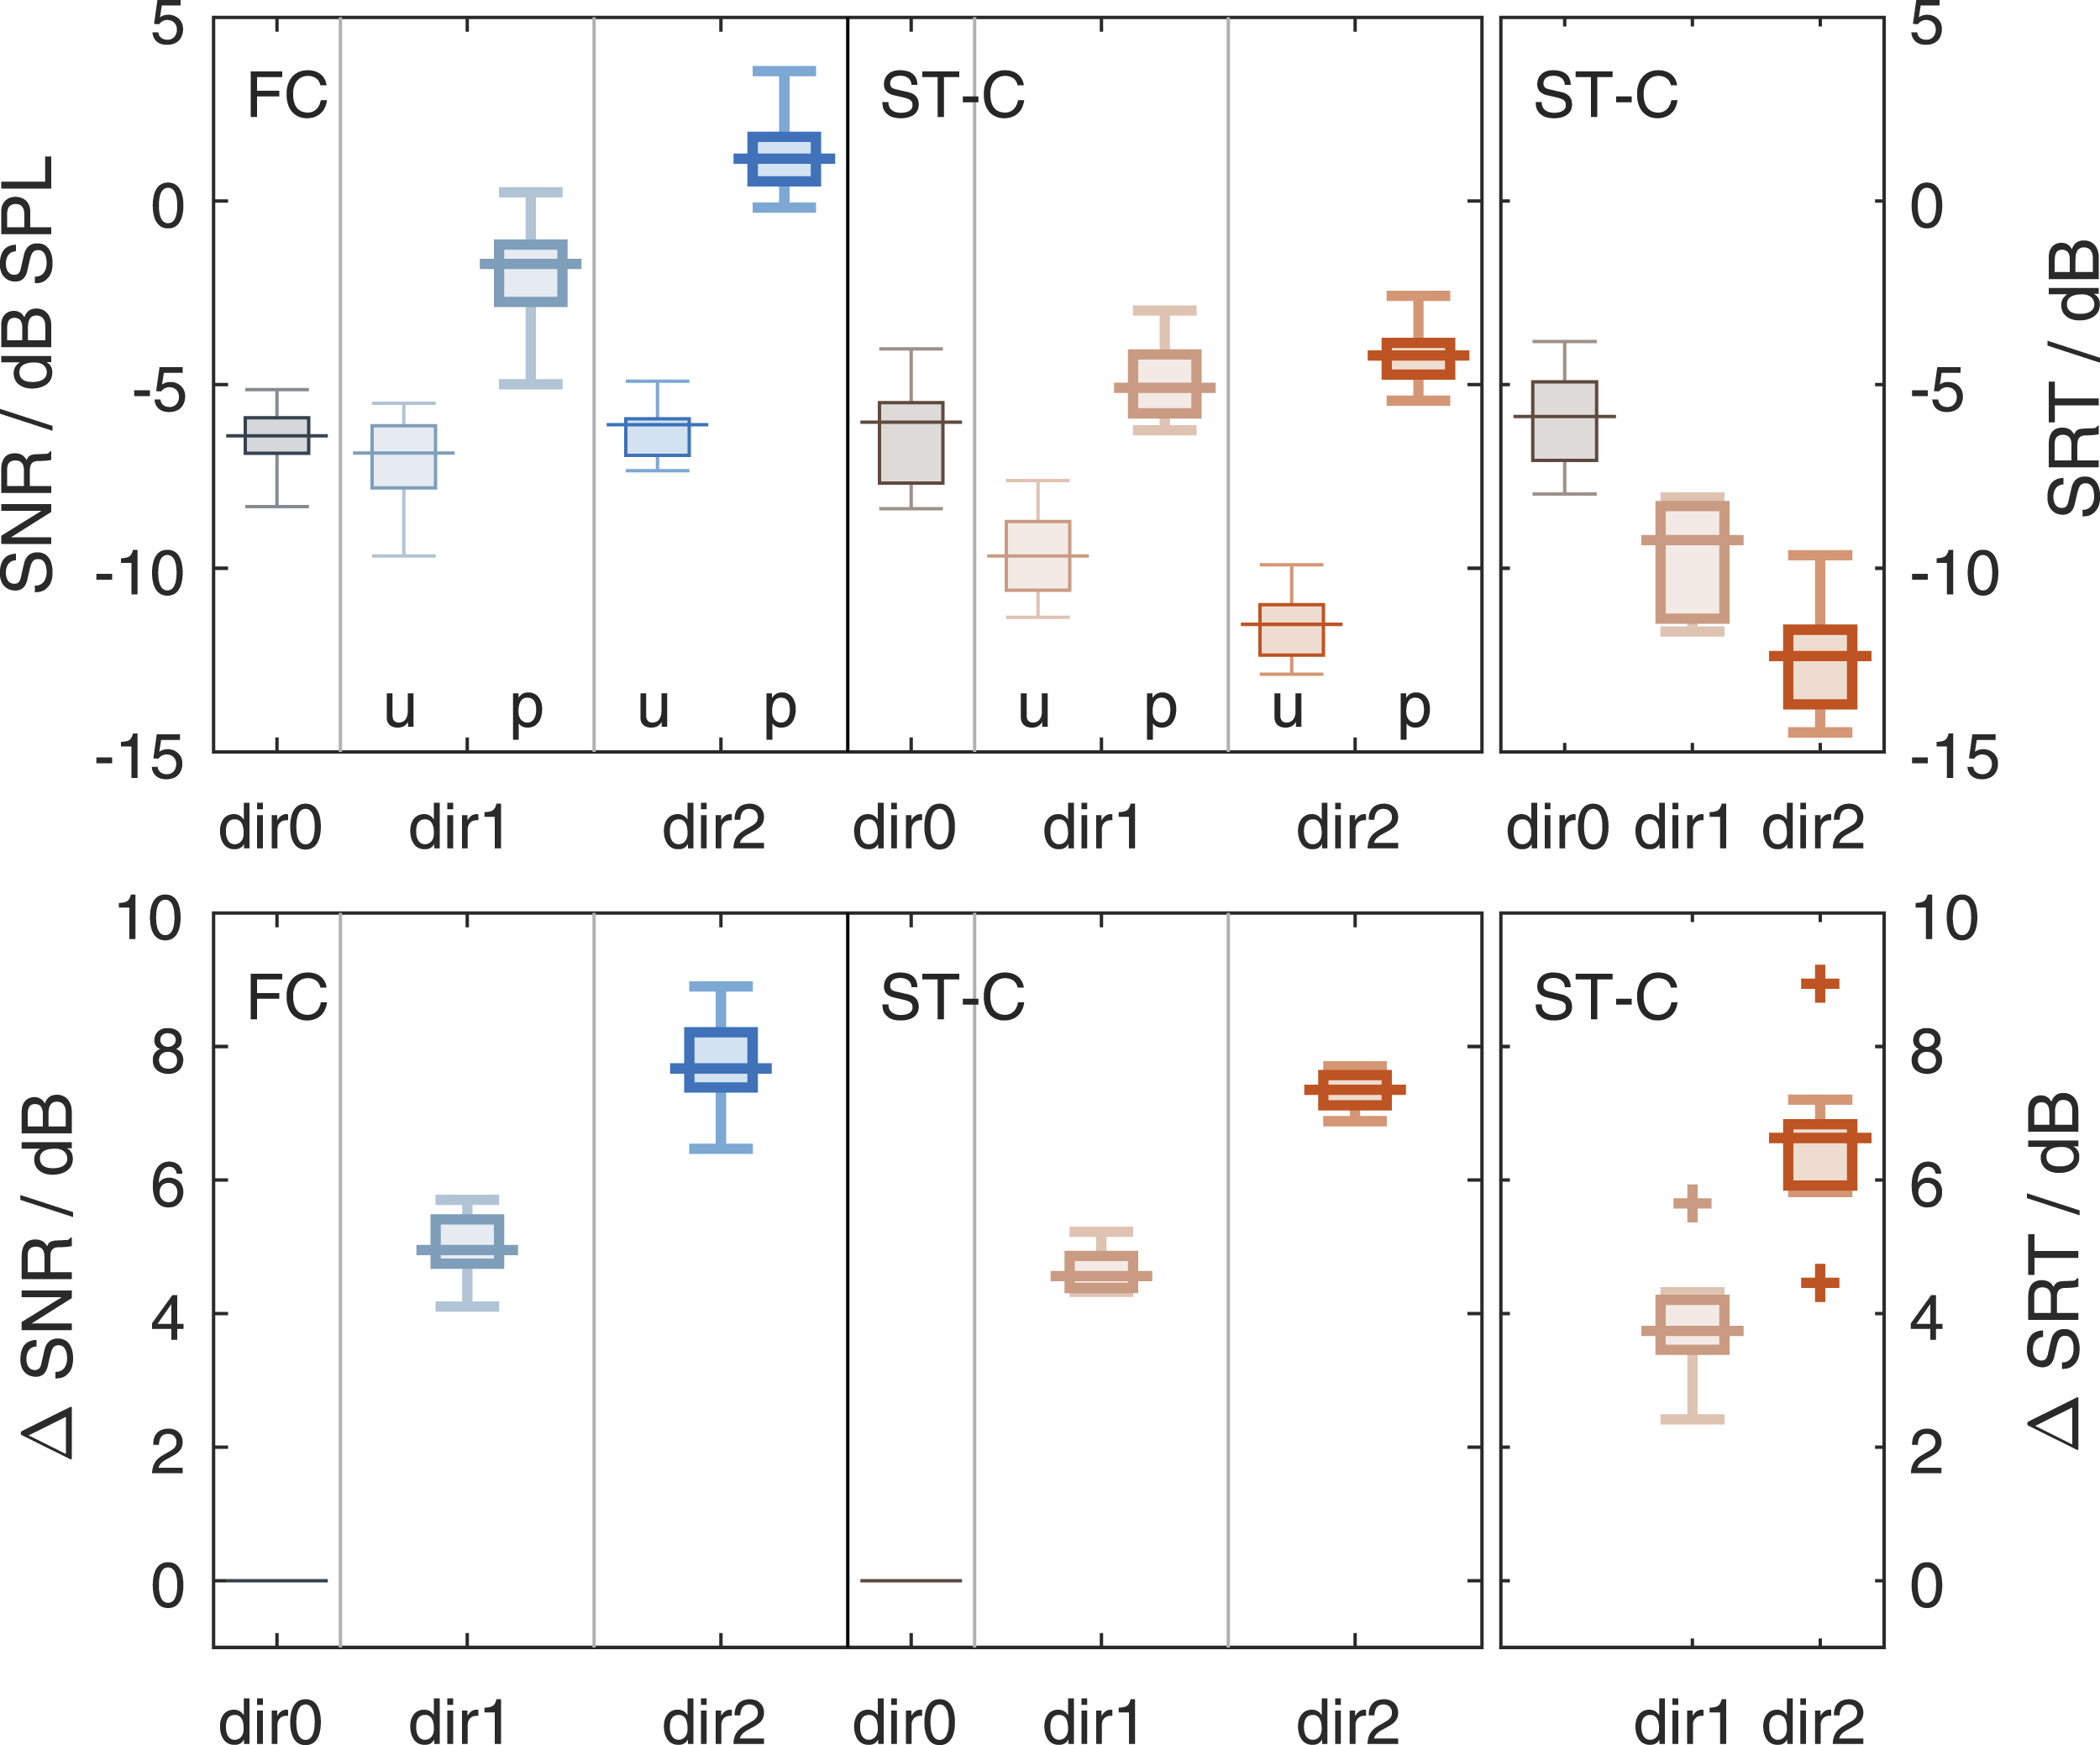
In the speech test (Figure 4, top middle panel), the unprocessed SNR depends not only on the background noise and speech level, but also on the level of spatial filter, due to the adaptive nature of the speech test. Without spatial filtering (‘dir0’), it is around −6 dB; with ‘dir1’ it is −9.5 dB; and with ‘dir2’ it is around −11.5 dB. A two (task, levels ‘ST-C’ and ‘FC’) by three (spatial filter, levels ‘dir0’, ‘dir1’ and ‘dir2’) repeated measures ANOVA revealed main effects of task (F = 44.77, p < .001) and spatial filter (F = 44.66, p < .001), as well as an interaction effect (F = 72.10, p < .001). See Table 2a for details.
In free conversation, the SNR p , i.e., after spatial filtering, increases with increasing spatial selectivity (top left panel). The SNR depends on the background noise, the speech level of the confederates, and the head orientation. The maximum SNR can only be achieved when the test participant perfectly orients the head towards the currently active confederate. In the speech test, there is also a slight increase in SNR p with increasing selectivity, which indicates an adverse effect of selectivity on SRT. If selectivity had no influence on SRT, the SNR improvement would have to correspond exactly to the SRT improvement, so that SNR p would be constant.
SNR Improvement Through Spatial Filtering
The SNR improvement due to the spatial filtering is shown in the bottom panels of 4. The SNR improvement achieved through spatial filtering (Figure 4, bottom panels) is approximately 4–5 dB for ‘dir 1’ and 7–8 dB for ‘dir 2’; however, the benefit is about 1 dB lower when measured in ΔSRT compared to ΔSNR.
For the statistical analysis, three comparisons were performed. First the effect of task (levels ‘ST-C’ and ‘FC’) and spatial filtering (levels ‘dir1’ and ‘dir2’) on ΔSNR in ‘FC’ (bottom left panel of Figure 4) and on ΔSRT in ‘ST-C’ (bottom right panel), was investigated. Analysis of variances (see Table 2b for details) revealed main effect of task (F = 17.44, p = .002) and spatial filter (F = 385.22, p < .001). The t-test with Bonferroni correction for multiple comparisons was used for the post hoc analysis. On average, this test yielded an improvement that was 2.8 dB larger with ‘dir2’ than with ‘dir1’ (p < .001), and 1.2 dB larger in ‘FC’ than in ‘ST-C’ (p < .001); see Table 3a.
The analysis of variances of ΔSNR for the factors task (‘FC’, bottom left panel in Figure 4, and ‘ST-C’, bottom middle panel) and spatial filter (levels ‘dir1’ and ‘dir2’), is shown in Table 2c. The analysis revealed significant main effects of task (F = 6.39, p = .03) and spatial filter (F = 1173.26, p < .001), but no interaction effects. The SNR improvement was 0.4 dB smaller in ‘ST-C’ than in ‘FC’, and 2.7 dB larger for ‘dir2’ than for ‘dir1’; see Table 3b.
An analysis of variances of the benefit in ‘ST-C’ for the factors measure (levels ΔSNR, bottom mittle panel in Figure 4, and ΔSRT, bottom right panel) and spatial filter (levels ‘dir1’ and ‘dir2’) showed a significant main effect of measure (F = 11.72, p).007) and spatial filtering (F = 167.24, p < .001), but no interaction effect, see Table 2d. The benefit was 0.8 dB larger when measured in terms of ‘ΔSNR’, compared to the measurement in terms of ‘ΔSRT’. The spatial filtering ‘dir2’ performed 2.7 dB better than ‘dir1’; see Table 3c.
Head Movement Behavior
The influence of the task on the head movement behavior, here measured as the RMS of the angular distance to the active speaker, is shown in Figure 5, left panel. It can be seen that in free conversation, the angular distance is slightly smaller than in the speech test, which means that the participants turned their heads closer to the active speaker, compared to the speech test conditions. A two (task, levels ‘ST-C’ and ‘FC’) by three (spatial filter, levels ‘dir0’, ‘dir1’ and ‘dir2’) repeated measures ANOVA revealed a significant effect of task (F = 5.13, p = .047), but no significant effect of spatial filter or an interaction effect (Table 2e). The RMS angular distance to the active speaker is 2° smaller in ‘FC’ than in ‘ST-C’ (see Table 3e). RMS angular distance to the active speaker in the two tasks, for each participant and condition (left panel), and SNR improvement versus RMS angular distance to the active speaker (right panel). A small but significant effect of the task on the angular distance was found. Furthermore, a significant correlation between angular distance and SNR improvement was found for spatial filter setting ‘dir1’ (ρ = −0.56) and ‘dir2’ (ρ = −0.93).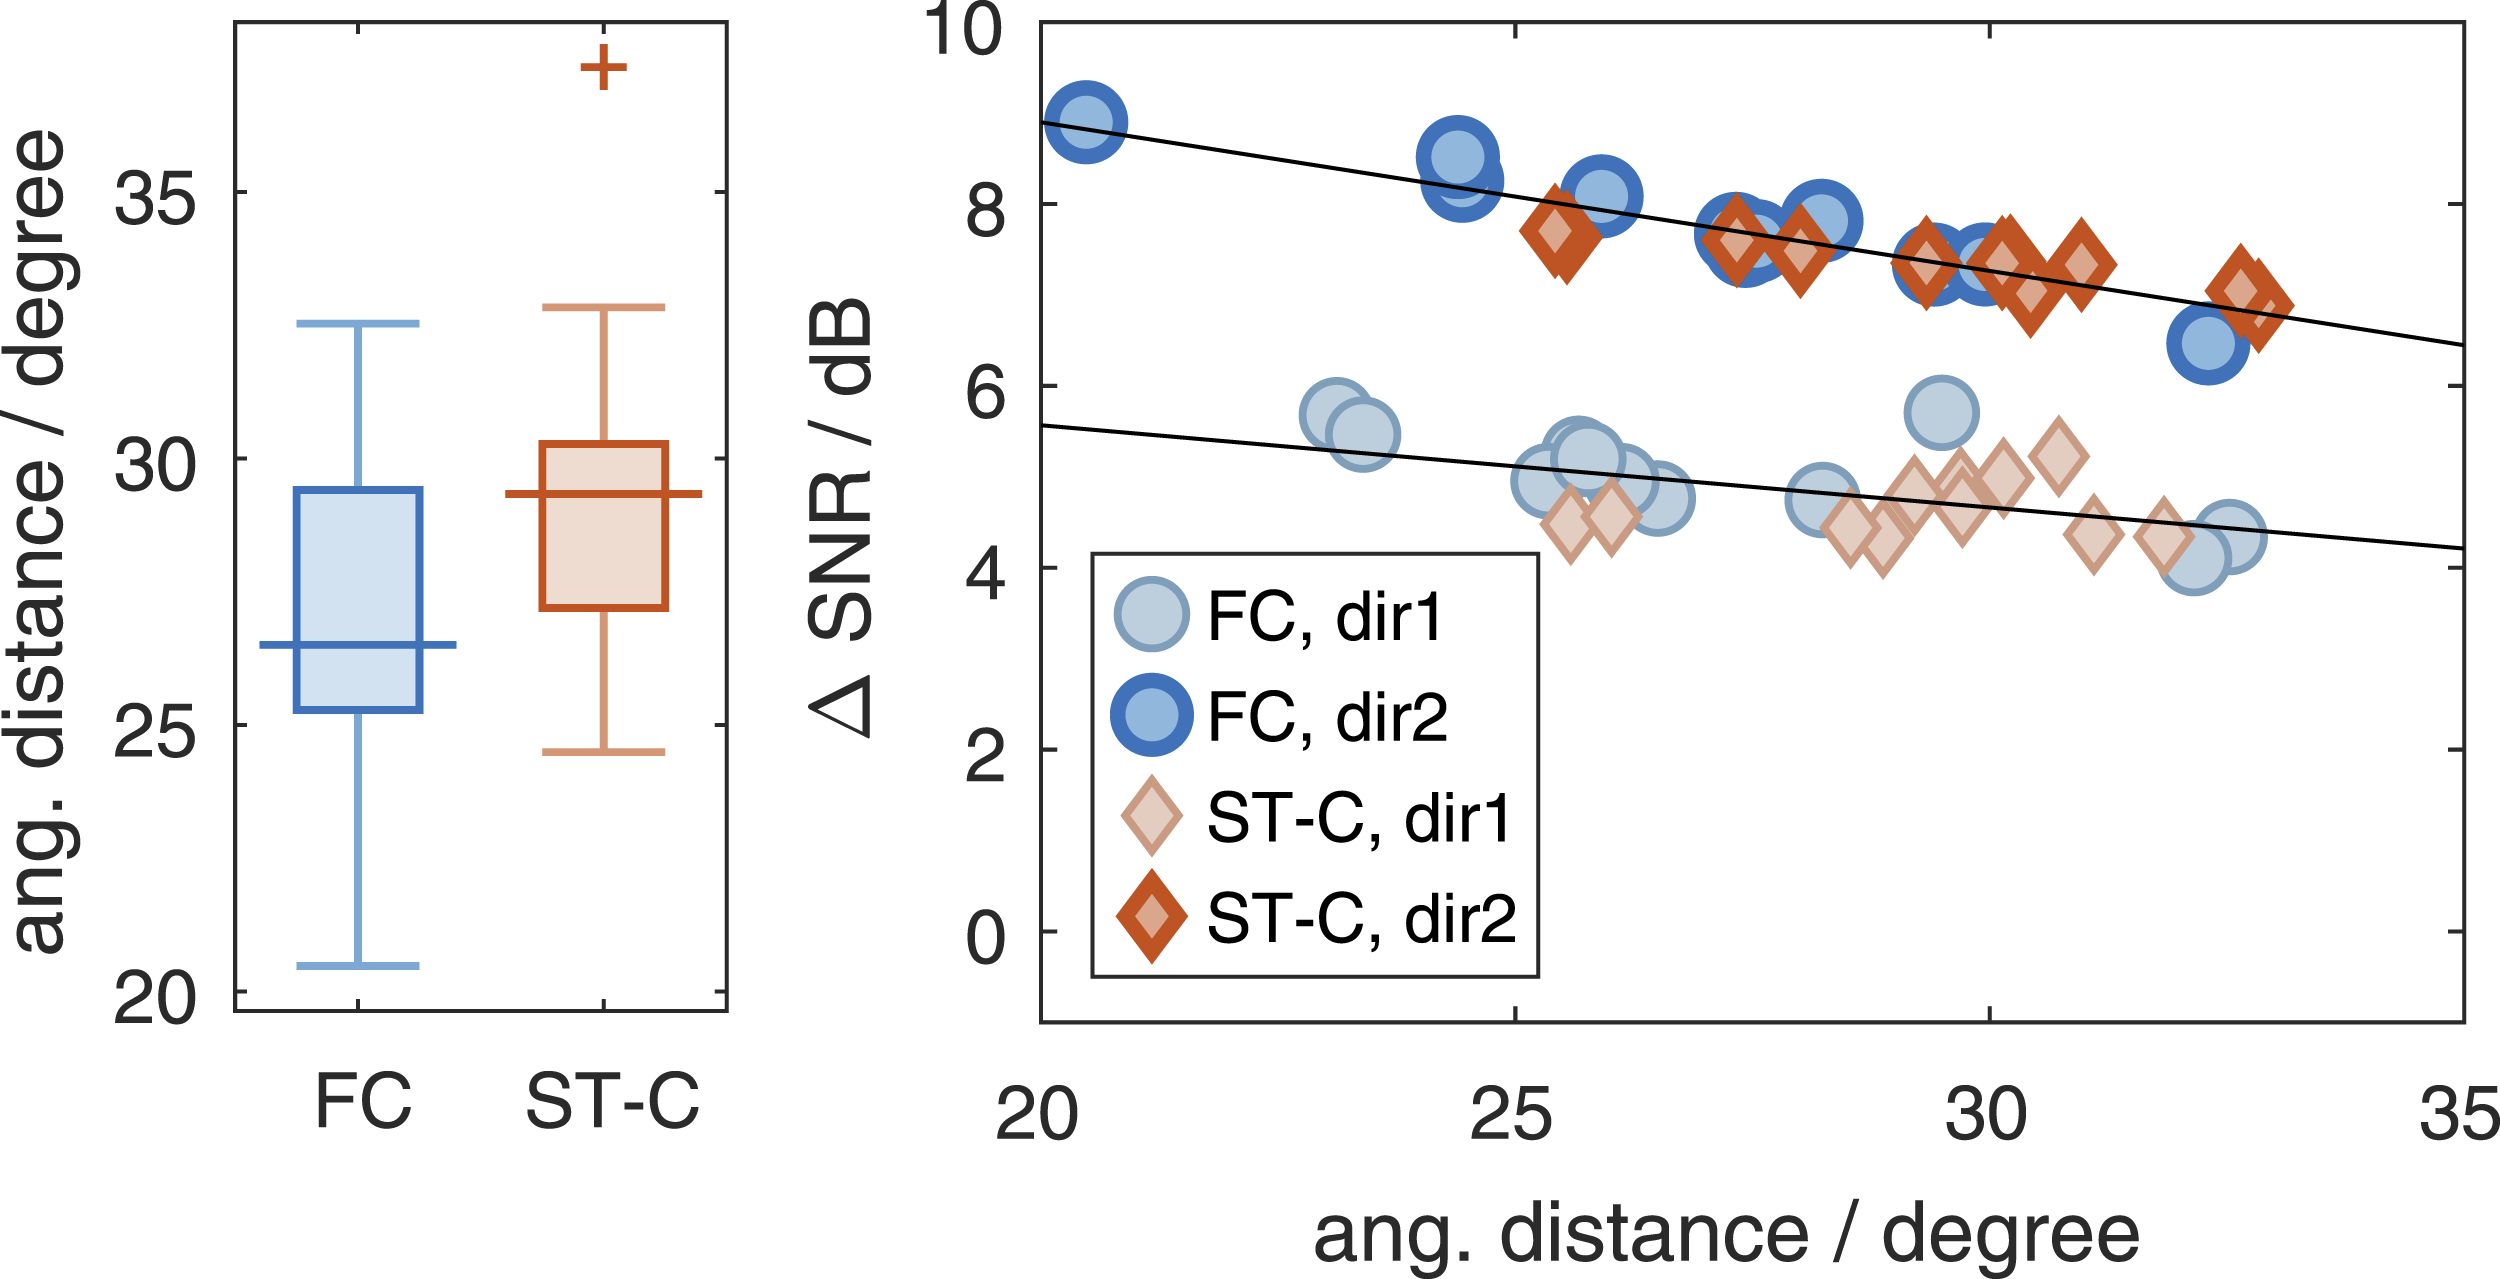
A significant correlation was found between angular distance and SNR improvement for ‘dir2’ (p < .001), see Figure 5, right panel. The Pearson’s correlation coefficient is ρ = −0.93, the SNR improvement decreases by 0.16 dB per degree as angular distance increases. A significant correlation was also found for ‘dir1’ (p = .007), with a correlation coefficient ρ = −0.56 and a decrease in SNR improvement of 0.09 dB per degree with increasing angular distance. The data show that participants who on average turned their heads closer to the active speaker gained a larger SNR improvement from the spatial filtering. Note that these are the average SNR improvements and angular distances across the entire condition. Although the SNR improvement can theoretically be predicted based on the spatial distribution of background noise, speech and noise levels, and the angular distance of head orientation from the active speech source, this is not feasible due to the dynamic nature of speech levels and head movements.
Speech Level
The increase in speech level with increasing noise level is part of the Lombard effect, see left panel of Figure 6. The speech level (label ‘S’) was lowest in the quiet condition, and up to 10 dB higher in the noise conditions. Here, the speech level decreases with increasing spatial selectivity of the spatial filter. When relating this speech level increase with the noise level increase at the ear, i.e., after processing, then a Lombard effect of 0.35 to 0.4 dB increase of speech level per dB increase of noise level can be found. The increase of speech level of the confederates (data not shown) was on average 9.8 dB for the experimenter, and 6.6 dB for the other confederate, resulting in an increase of speech level of 0.41 (experimenter) or 0.28 (confederate) dB per dB increase of noise level. Left panel: Lombard effect, i.e. speech level of participants as a function of noise level. A typical rise of speech level with noise can be found, as well as a shallower slope at high noise levels. Right panel: Correlation between speech level of participants and speech level of the experimenter. For the experimenter, a correlation between participant speech level and experimenter speech level can be found. For the other confederate, this effect was not found.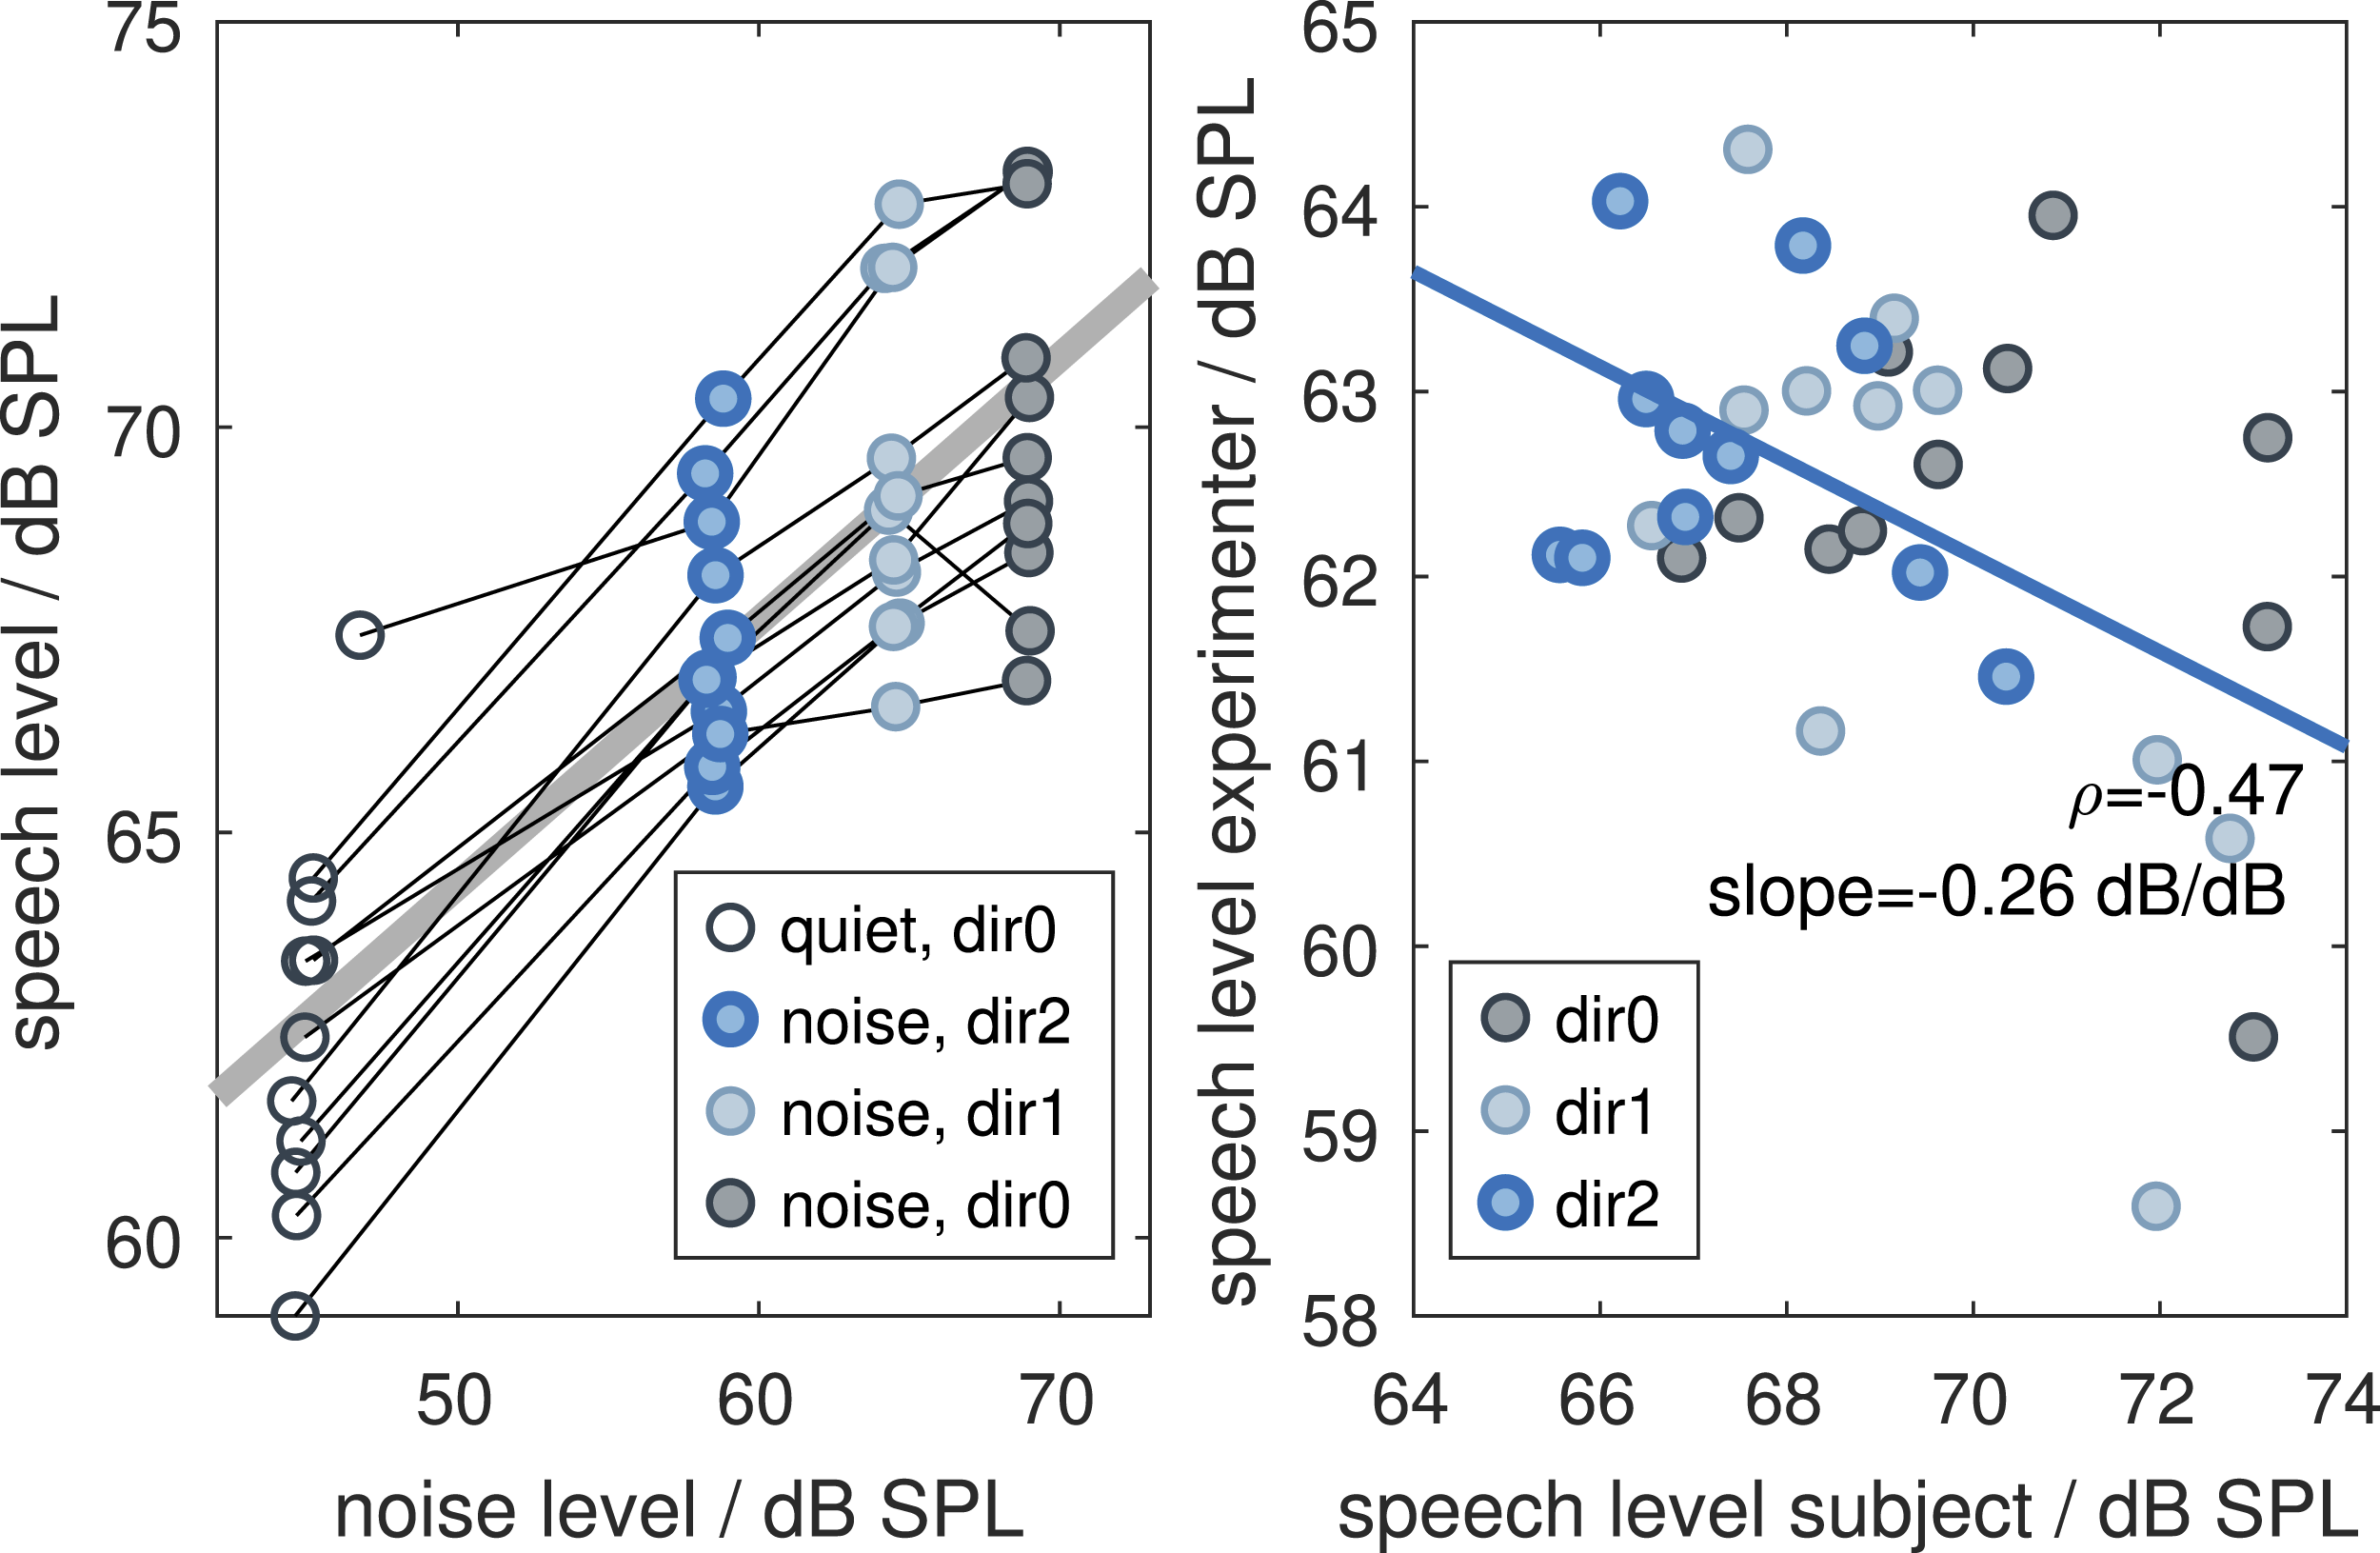
The average speech levels in quiet were 62.6 dB SPL(C) for the participant, 52.6 dB SPL(C) for the experimenter, and 51.7 dB SPL(C) for the other confederate.
Discussion
According to Keidser et al. (2020), ecological validity describes to what extent a hearing device study is representative of real-life functioning of the device. Hearing devices are typically needed in situations including group conversations, which according to Wolters et al. (2016) are common and very important, yet difficult situations. Thus, hearing aid evaluation outcomes should be representative of conversation situations, which may not be the case when assessed in passive listening alone. By comparing the benefit measured in terms of SNR improvement in free conversation with the benefit provided in passive listening, this study provides a step in direction of more ecologically valid evaluation paradigms. Specifically, the ecological validity of the outcome of assessing hearing device benefit in free conversation in virtual reality depends only on the extent to which the participants’ communication behavior is representative of real conversations. In this sense, neither the experimental paradigm nor the simulation technology requires a high level of realism, beyond the level which is required to achieve ecologically valid behavior and correct signal enhancement. Kothe et al. (2026) showed that, in a virtual audiovisual environment similar to the one presented here, participants experienced the co-presence of interlocutors, despite them being represented as animated avatars. Participants also experienced a sense of presence in the virtual environment. This suggests that using virtual reality and telepresence technology is a valid approach to achieve characteristic communication behavior in free conversations.
Speech tests tend to converge on low signal-to-noise ratios (SNRs), which are not representative of typical everyday listening environments (Smeds et al., 2015), particularly when highly directional settings or other effective signal enhancement strategies are employed. This discrepancy may result in the potential benefits of real hearing aid algorithms being underestimated. This is particularly the case for adaptive nonlinear algorithms, which are designed to operate effectively at higher SNRs. In contrast, free conversations allow better control of background noise levels. Virtual acoustic environments allow better control of background noise levels, which can be chosen arbitrarily in virtual acoustic environments. However, it is challenging to control SNR directly due to the Lombard effect, whereby participants adjust their speech levels in response to noise (Garnier & Henrich, 2014). Nevertheless, free conversations can achieve a reasonable SNR range that more closely reflects real-life conditions.
Although the SNR in ST-C converges to significantly lower SNRs than in a free conversation, and the movement behavior is slightly altered, the distributed speech test may still be suitable for testing the limits of an algorithm with regard to speech detection at low SNR. In particular, the difference between ΔSNR and ΔSRT shows that the simulated spatial filter used here has an influence on speech comprehension independent of the SNR improvement, as would be the case for linear beamforming algorithms. This can be examined more closely in a speech test by analyzing word intelligibility separately for each word in a sentence, for example.
One remaining question is which metric provides a more ecologically valid indication of hearing aid performance: the SRT, which is perceptually meaningful but obtained under constrained head movement behavior, or the SNR improvement, which is technically derived and measured during free, interactive conversation with unrestricted and natural head movements. Resolving this issue will require examining how well each of these measures predicts real-world outcomes, such as user satisfaction with hearing aids or device benefit, as measured by ecological momentary assessment (EMA). Only by establishing the predictive validity of the SRT and SNR improvement for field-based performance can we determine which approach offers the most relevant assessment of hearing aid benefit.
To ensure that the noise signal had a typical effect on the test participants, and a similar effect across interlocutors, the speech level in different noise conditions was measured. An increase of speech level with increasing noise level, which is part of the Lombard effect (Brumm & Zollinger, 2011), was expected. Here, the background noise changed from about 40 dB SPL in quiet to 66 dB SPL in the noisy conditions. At the same time, the speech level increased by 8 to 10 dB (see Figure 6, left panel). This is in line with the literature, however, different studies report the effect of increasing the speech level in different ways. For example, Hadley et al. (2019) found a slope of 0.31 dB/dB in conversations with varying background noise levels. In their review paper, Patel and Schell (2008) mention a level increase ranging from 4.2 dB between quiet and 107 dB noise, up to an increase of 18.2 dB between quiet and 80 dB noise. In the study of (Hodgson et al., 2007) they measure noise levels and acoustics in eating establishments of different size and density, and develop a model to estimate speech level based on a sigmoid function. A shallower slope of the speech level increase at higher noise levels can be anticipated also here (see left panel of Figure 6) and in the data of Hadley et al. (2019).
A similar increase in speech level was found for the two confederates as for the test participants. This suggests that the background noise affected both groups in a similar way, despite the different reproduction methods used (headphones versus loudspeakers). Tweedy and Culling (2014) investigated the effect of one person’s SNR on the speech level of an interlocutor, e.g., in telephone conversations. They found no systematic influence of participant’s SNR on interlocutor speech; however, they identified a trend that with increasing speech level the interlocutors decreased level by −0.1 dB/dB. In this study, a significant correlation between the participants’ speech level and the experimenter’s speech level was found, see Figure 6, right panel, with a slope of −0.26 dB/dB. However, no correlation between participants’ speech level and the speech level of the other confederate was found.
Hendrikse, Grimm, and Hohmann (2020) found a misalignment effect for spatially selective algorithms, which was confirmed in this study. This indicates that typical head movement behavior is required for evaluations. In this study, we found a significant effect of task on head movement behavior, which can partly explain the reduced effectiveness of spatially selective algorithms when assessed using speech tests. This is despite the fact that the speech test used here is ’conversation-like’, involving two distributed, randomly alternating speakers and avatars representing the speakers with conversation-related head and lip movement animations. In conventional speech tests with a single speech and noise source, and without relevant visual cues, an even larger effect on head movement behavior would be expected.
Although the general applicability of the proposed method was demonstrated, this study has some limitations. Firstly, either the algorithm must be fully simulated, as in this study, or the SNR improvement must be determined using the method described in Hagerman and Olofsson (2004). This can be achieved post hoc by recording the audio signals of all interlocutors and re-rendering the conversation, including the recorded head movements. By rendering and processing the scene with alternating signs of the noise signal, the processed speech signal and noise signal can be estimated separately. This approach was applied by Hendrikse, Schwarte, et al. (2020), therefore this is not a fundamental limitation of this study; however, the re-rendering approach proposed by Hendrikse, Schwarte, et al. (2020) does not simulate the own voice effect, and therefore might not provide reliable results for all types of hearing devices. Furthermore, this study involved participants with normal hearing. It is known from the literature that hearing status can affect head movement behavior (Grimm et al., 2020). However, as focus of this study was on the methodology, the conclusions drawn from this study should not be affected by this limitation.
Another potential limitation is how natural the conversation feels in virtual reality. In our study, the interlocutors were represented by avatars in the form of virtual animated characters with a limited set of animations. Kothe et al. (2026) showed that a high level of co-presence can be achieved in such a setup; however, the avatars did not display any facial expressions, which are essential for expressing emotions in conversations (e.g., Ruusuvuori, 2012). One way to overcome these limitations is to perform face-to-face conversations instead of using VR and telepresence, and estimate SNR based on acoustic simulations using near-mouth recordings. Examples of such face-to-face conversation setups can be found in recently published datasets (Dourado et al., 2026; Hinrichs et al., 2025), which combine speech features with behavioral analysis. By using the re-rendering approach of Hendrikse, Schwarte, et al. (2020) it is possible to analyze SNR improvement of real algorithms. However, we used virtual reality and telepresence in this study to enable a direct comparison of the speech test and free conversation without the confounding factor of visual representation, which would otherwise differ between the two.
To achieve natural communication behavior in the conversation condition and, where possible, in the speech test condition too, we added head movement animation because these cues provide non-verbal information that can be used to predict who will take the next turn (Hadley & Culling, 2022; Templeton et al., 2022). In the acoustic simulation of this study, the source directivity was not included; therefore, no spectral acoustic cues were provided in the direct sound of the confederates. The addition of source directivity cues would have impacted the direct to reverberant ratio and also frequency-dependent SNR, and therefore should be added in all future studies. However, we do not consider this to be a critical limitation of this study, because such cues do not provide sufficient information to detect head movements within the range of typical conversation-related movements Moriarty et al. (2024). Despite the lack of directional acoustic cues in the direct sound, the confederates’ sound was not fully static because rotation was performed around the neck and the acoustic sound source was simulated 15 cm in front of the neck. This results in subtle spectral changes due to head movement caused by the Doppler shift of the primary sound source, as well as time-varying comb-filter effects due to simulated reflections.
Using virtual reality to evaluate hearing aids in free conversation instead of conventional speech audiometry has implications for clinical tests. In this study, each condition lasted approximately five minutes, which is similar to the duration of a speech matrix test. One limitation is the requirement for confederates to act as interlocutors, which could be problematic in a clinical context. However, this could be overcome by using conversational agents, as advancements in machine learning mean these agents can now achieve a level of naturalness similar to that of unknown interlocutors represented by their avatars. Further simplifications of the experimental setup would be required for clinical applications. For example, a large virtual reality lab is typically not feasible in clinical environments, so the setup could be reduced to a single loudspeaker for each confederate and a few loudspeakers for the diffuse background. Although head-mounted displays offer an alternative to large projection screens with little impact on the acoustic signals (Porschmann et al., 2019), they might be less suitable due to lower acceptance, particularly among elderly people (Llorach et al., 2020). Despite the limitations of the proposed evaluation paradigm, significant changes in hearing aid algorithm complexity, such as the incorporation of machine learning and multimodal signal processing, will necessitate substantial enhancements to the naturalness of behavior during assessment in the near future.
Conclusions
This study demonstrates that the benefit of spatial filtering can be assessed in free conversation using telepresence technology and virtual reality. Using free conversation as a task allows for more natural signal-to-noise ratios to be achieved and for test participants to exhibit more natural movement behavior. Similarly, speech tests embedded in a virtual environment with distributed speakers can elicit movement behavior similar to that observed in conversation, through visual cues and interactive elements; however, significant differences in behavior persist, resulting in changes to the measured algorithm benefit. This methodology can be applied to simulated idealized algorithms, as well as to more complex nonlinear and black-box processing. It provides a robust framework for evaluating hearing aid performance in more realistic conditions, ultimately increasing the ecological validity of hearing device evaluation.
Supplemental Material
Supplemental Material
Supplemental Material
Supplemental Material
Supplemental Material
Supplemental material - Interaction Between Head Movement Behavior and Simulated Spatial Filtering: Comparing Free Conversation and Speech Tests in Virtual Reality
Supplemental material for Interaction Between Head Movement Behavior and Simulated Spatial Filtering: Comparing Free Conversation and Speech Tests in Virtual Reality by Giso Grimm, Angelika Kothe, Volker Hohmann in Trends in Hearing
Footnotes

Ethical Considerations
The study was approved by the ethics committee of the Carl von Ossietzky Universität Oldenburg (Drs.EK/2021/068).
Consent to Participate
All participants provided written consent after being fully informed about the study.
Funding
The authors disclosed receipt of the following financial support for the research, authorship, and/or publication of this article: This work was funded by the Deutsche Forschungsgemeinschaft (DFG, German Research Foundation), Project-ID 352015383 – SFB 1330 project B1.
Declaration of Conflicting Interests
The authors declared no potential conflicts of interest with respect to the research, authorship, and/or publication of this article.
Data Availability Statement
The data and analysis scripts have been made available under https://doi.org/10.5281/zenodo.17865437 (Grimm et al., 2025). The virtual pub environment is published under https://doi.org/10.5281/ZENODO.5886987 (Grimm et al., 2021).
Supplemental Material
Supplemental material for this article is available online.
Appendix
References
Supplementary Material
Please find the following supplemental material available below.
For Open Access articles published under a Creative Commons License, all supplemental material carries the same license as the article it is associated with.
For non-Open Access articles published, all supplemental material carries a non-exclusive license, and permission requests for re-use of supplemental material or any part of supplemental material shall be sent directly to the copyright owner as specified in the copyright notice associated with the article.
