
Abstract
Executive Summary
This report presents estimates of the undocumented population residing in the United States in 2018, highlighting demographic changes since 2010. The Center for Migration Studies of New York (CMS) compiled these estimates based primarily on information collected in the US Census Bureau’s American Community Survey (ACS). The annual CMS estimates of undocumented residents for 2010 to 2018 include all the detailed characteristics collected in the ACS. 1 A summary of the CMS estimation procedures, as well as a discussion of the plausibility of the estimates, is provided in the Appendix.
The total undocumented population in the United States continued to decline in 2018, primarily because large numbers of undocumented residents returned to Mexico. From 2010 to 2018, a total of 2.6 million Mexican nationals left the US undocumented population;
2
about 1.1 million, or 45 percent of them, returned to Mexico voluntarily. The decline in the US undocumented population from Mexico since 2010 contributed to declines in the undocumented population in many states. Major findings include the following: The total US undocumented population was 10.6 million in 2018, a decline of about 80,000 from 2017, and a drop of 1.2 million, or 10 percent, since 2010. Since 2010, about two-thirds of new arrivals have overstayed temporary visas and one-third entered illegally across the border. The undocumented population from Mexico fell from 6.6 million in 2010 to 5.1 million in 2018, a decline of 1.5 million, or 23 percent. Total arrivals in the US undocumented population from El Salvador, Guatemala, and Honduras — despite high numbers of Border Patrol apprehensions of these populations in recent years — remained at about the same level in 2018 as in the previous four years.
3
The total undocumented population in California was 2.3 million in 2018, a decline of about 600,000 compared to 2.9 million in 2010. The number from Mexico residing in the state dropped by 605,000 from 2010 to 2018. The undocumented population in New York State fell by 230,000, or 25 percent, from 2010 to 2018. Declines were largest for Jamaica (−51 percent), Trinidad and Tobago (−50 percent), Ecuador (−44 percent), and Mexico (−34 percent). The results shown here reinforce the view that improving social and economic conditions in sending countries would not only reduce pressure at the border but also likely cause a large decline in the undocumented population. Two countries had especially large population changes — in different directions — in the 2010 to 2018 period. The population from Poland dropped steadily, from 93,000 to 39,000, while the population from Venezuela increased from 65,000 to 172,000. Almost all the increase from Venezuela occurred after 2014.
Total Population
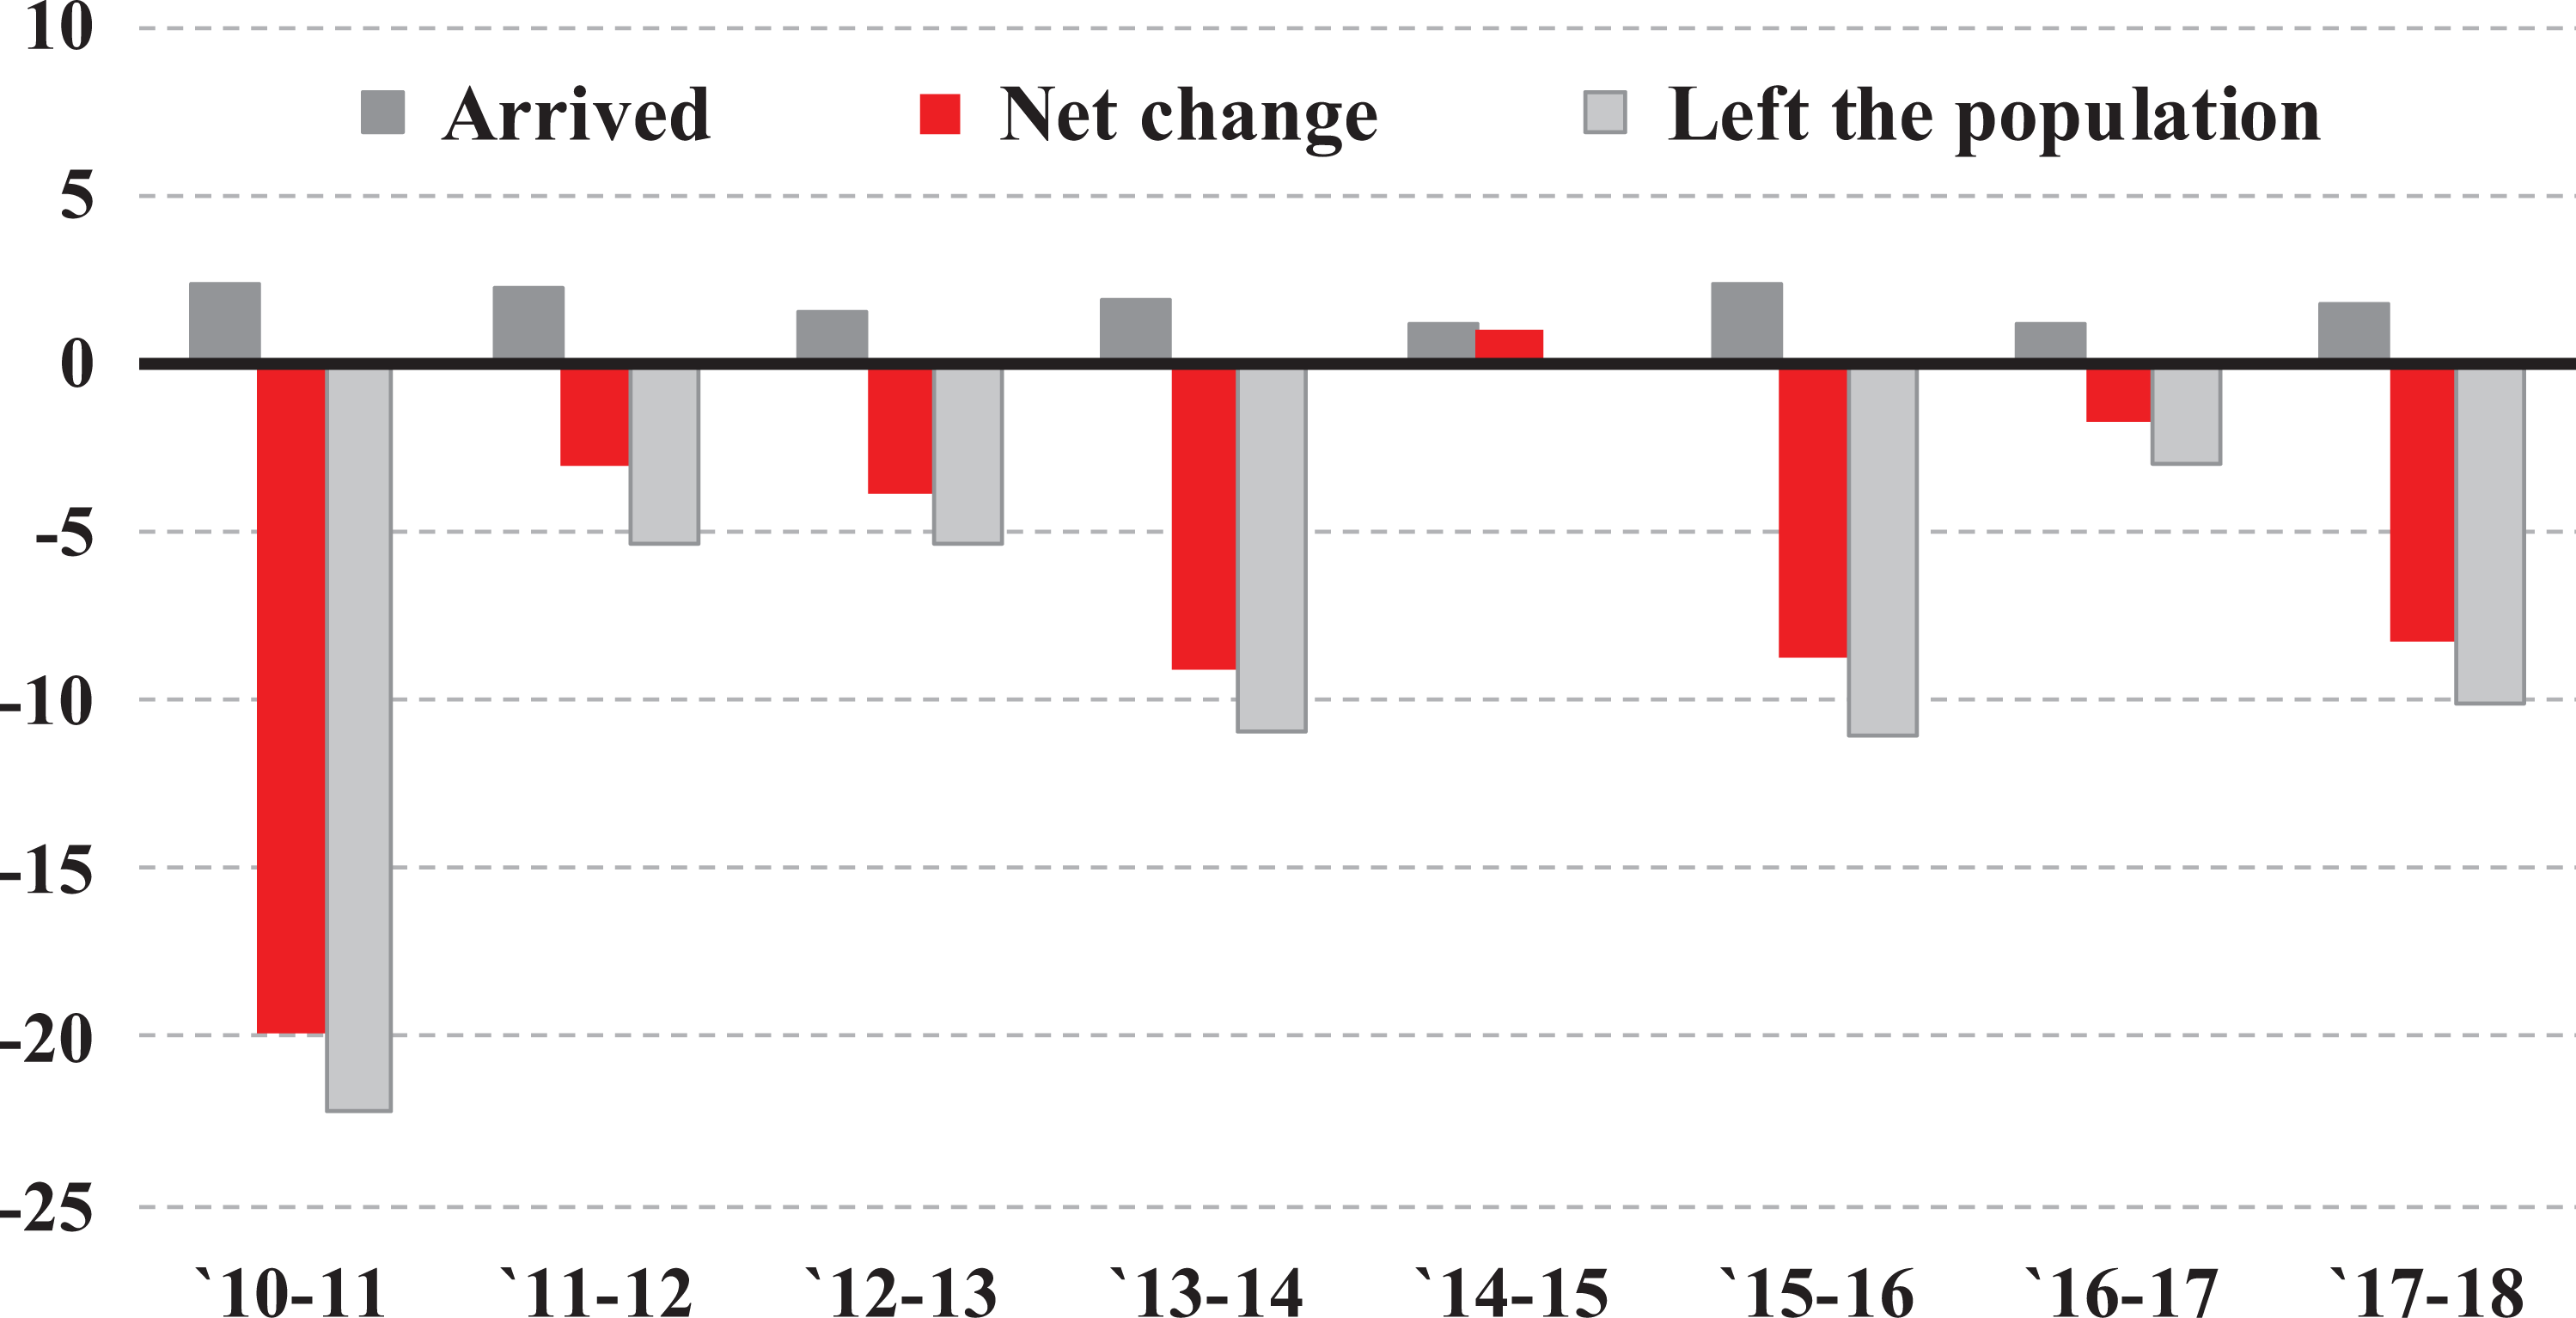
The total US undocumented population declined from 11,750,000 in 2010 to 10,565,000 in 2018. The decline of 1.2 million during the eight-year period occurred despite an increasing number of arrivals, from about 425,000 in 2010 to about 550,000 per year in 2018 (Figure 1). The estimated numbers of arrivals in Figure 1 include illegal arrivals across the border as well as visa overstays. 4
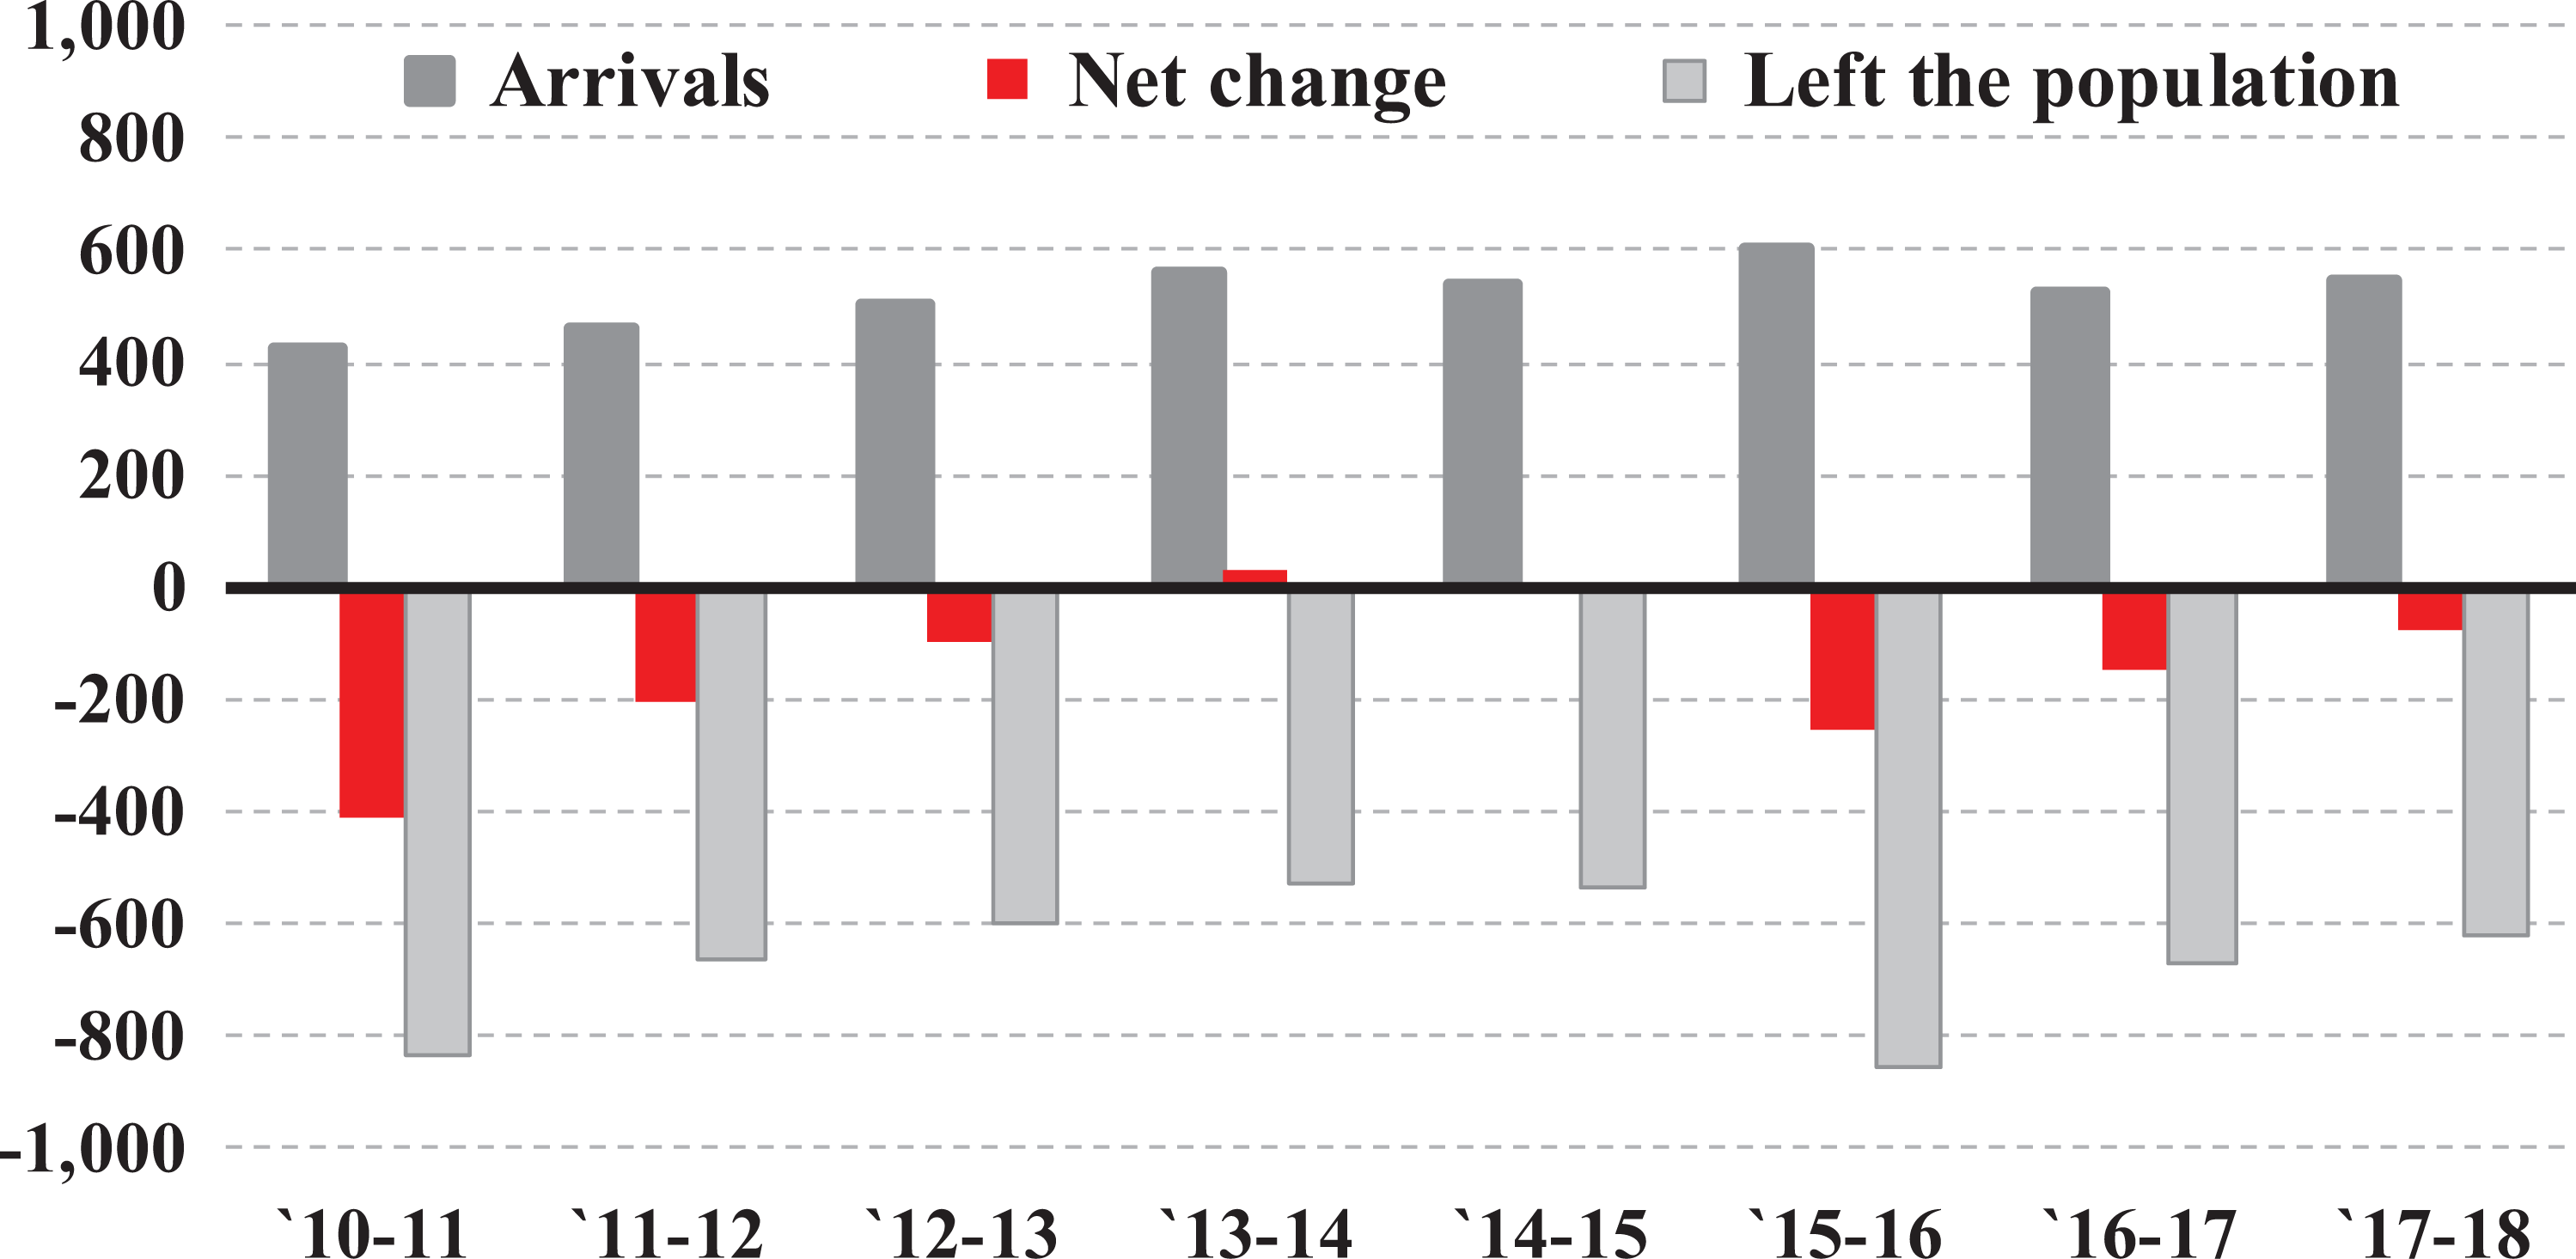
Components of Change in the Total Undocumented Population: 2010 to 2018 (in thousands).
As Figure 1 shows (red bars), the total population declined in most of the years from 2010 to 2018. Population change since 2010 could be characterized as slightly lower than zero growth.
The light gray bars below the “zero” line in Figure 1 illustrate an aspect of undocumented population change — the number that left the population — that is rarely discussed, partly because of the lack of data and possibly because of the false idea that “everybody wants to come here, and nobody leaves.” From 2010 to 2018, a total of 5.3 million left the undocumented population (the sum of the numbers in the light gray bars in Figure 1), an average of 665,000 per year. Removal by the US Department of Homeland Security (DHS), adjustments to lawful permanent resident (LPR) status, and deaths accounted for approximately 360,000 5 of the 665,000 departures from the undocumented population each year. The remainder, an average of 305,000, emigrated voluntarily each year.
Mode of Entry
About 4.0 million of the 10.6 million who resided here in 2018 arrived in the 2010 to 2018 period. Of those, 2.6 million (66 percent) overstayed their temporary visas, and 1.3 million (34 percent) entered illegally across the border. In each year since 2010, about two-thirds of all arrivals have been visa overstays. Of the 10.6 million total undocumented population living in the United States in 2018, about 5.7 million (54 percent) entered across the border, and 4.9 million (46 percent) entered with a temporary visa and overstayed.
Country of Origin
The steep decline in the US undocumented population from Mexico continues to be a significant demographic event. The population dropped by 1.5 million, or 23 percent, from 2010 to 2018 (Table 1). Other countries that had substantial declines included Ecuador (−36 percent), Korea (−22 percent), and Philippines (−20 percent) (Table 1).
Estimates of the Undocumented Population in 2010 and 2018: Top 15 Countries of Origin in 2018 (numbers in thousands).
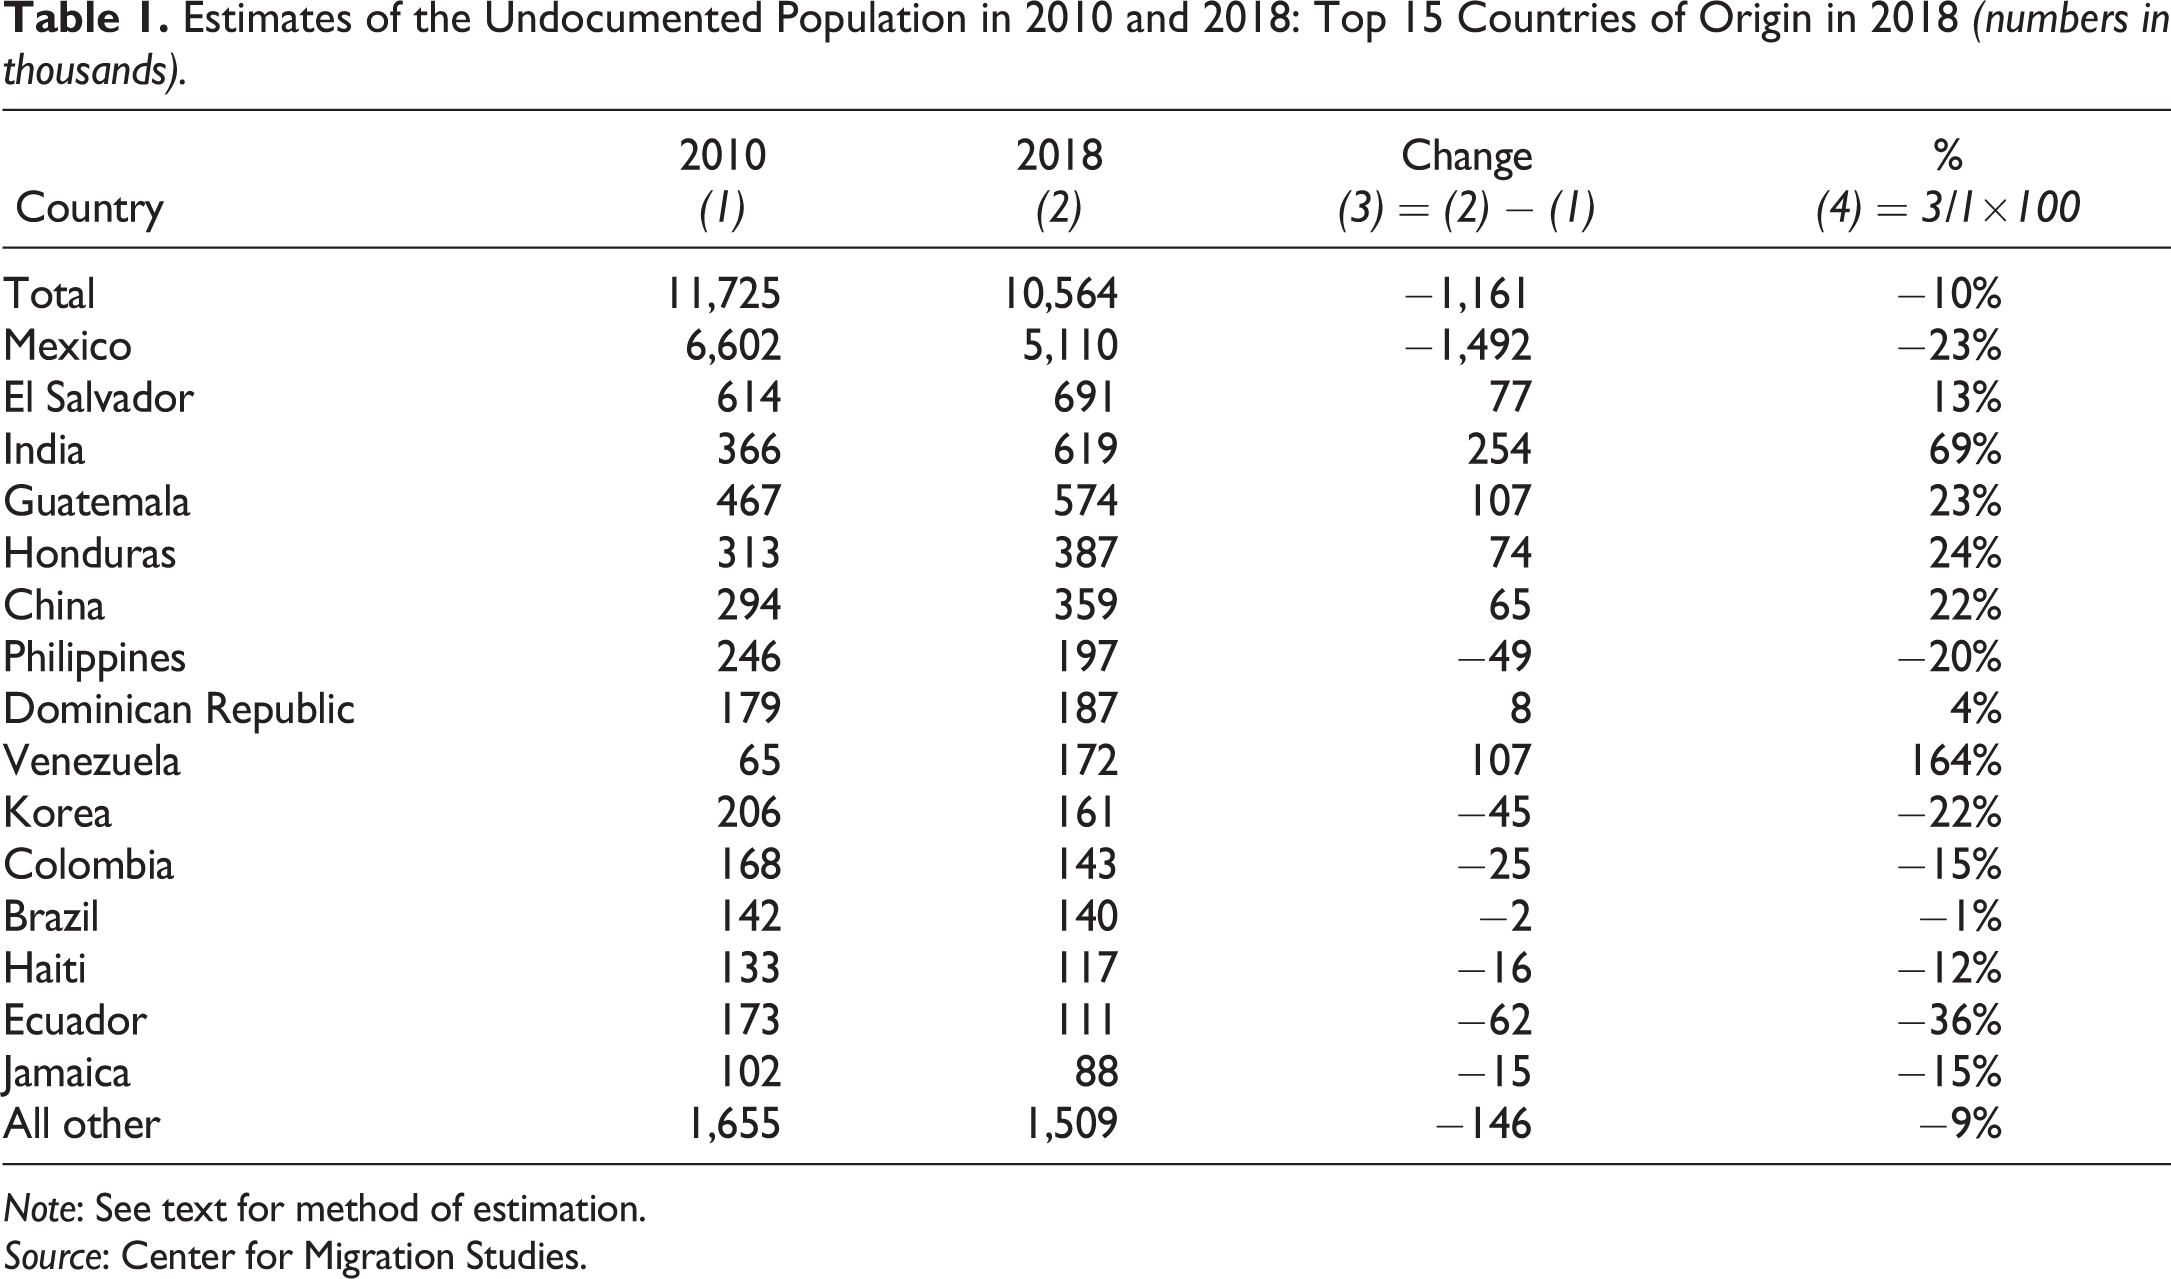
Note: See text for method of estimation.
Source: Center for Migration Studies.
Table 1 shows the 15 countries with the largest undocumented population in 2018. The population from India increased from 366,000 in 2010 to 619,000 in 2018. 6 Other countries with large percentage increases since 2010 include Venezuela (164 percent), China (22 percent), and three Central American countries — El Salvador (13 percent), Guatemala (23 percent), and Honduras (24 percent).
Figure 2 shows annual arrivals, departures from the population, and net population change for Mexico from 2010 to 2018. For this population in this eight-year period, the graph illustrates that undocumented population change is largely a function of departures from the population. That is, arrivals (dark gray bars above the zero line) were stable, while population growth varied with the number leaving the population. This finding, that departures from the population are a significant component of undocumented population change, reinforces the idea that improving social and economic conditions in sending countries could lead to a substantial decline in the undocumented population.
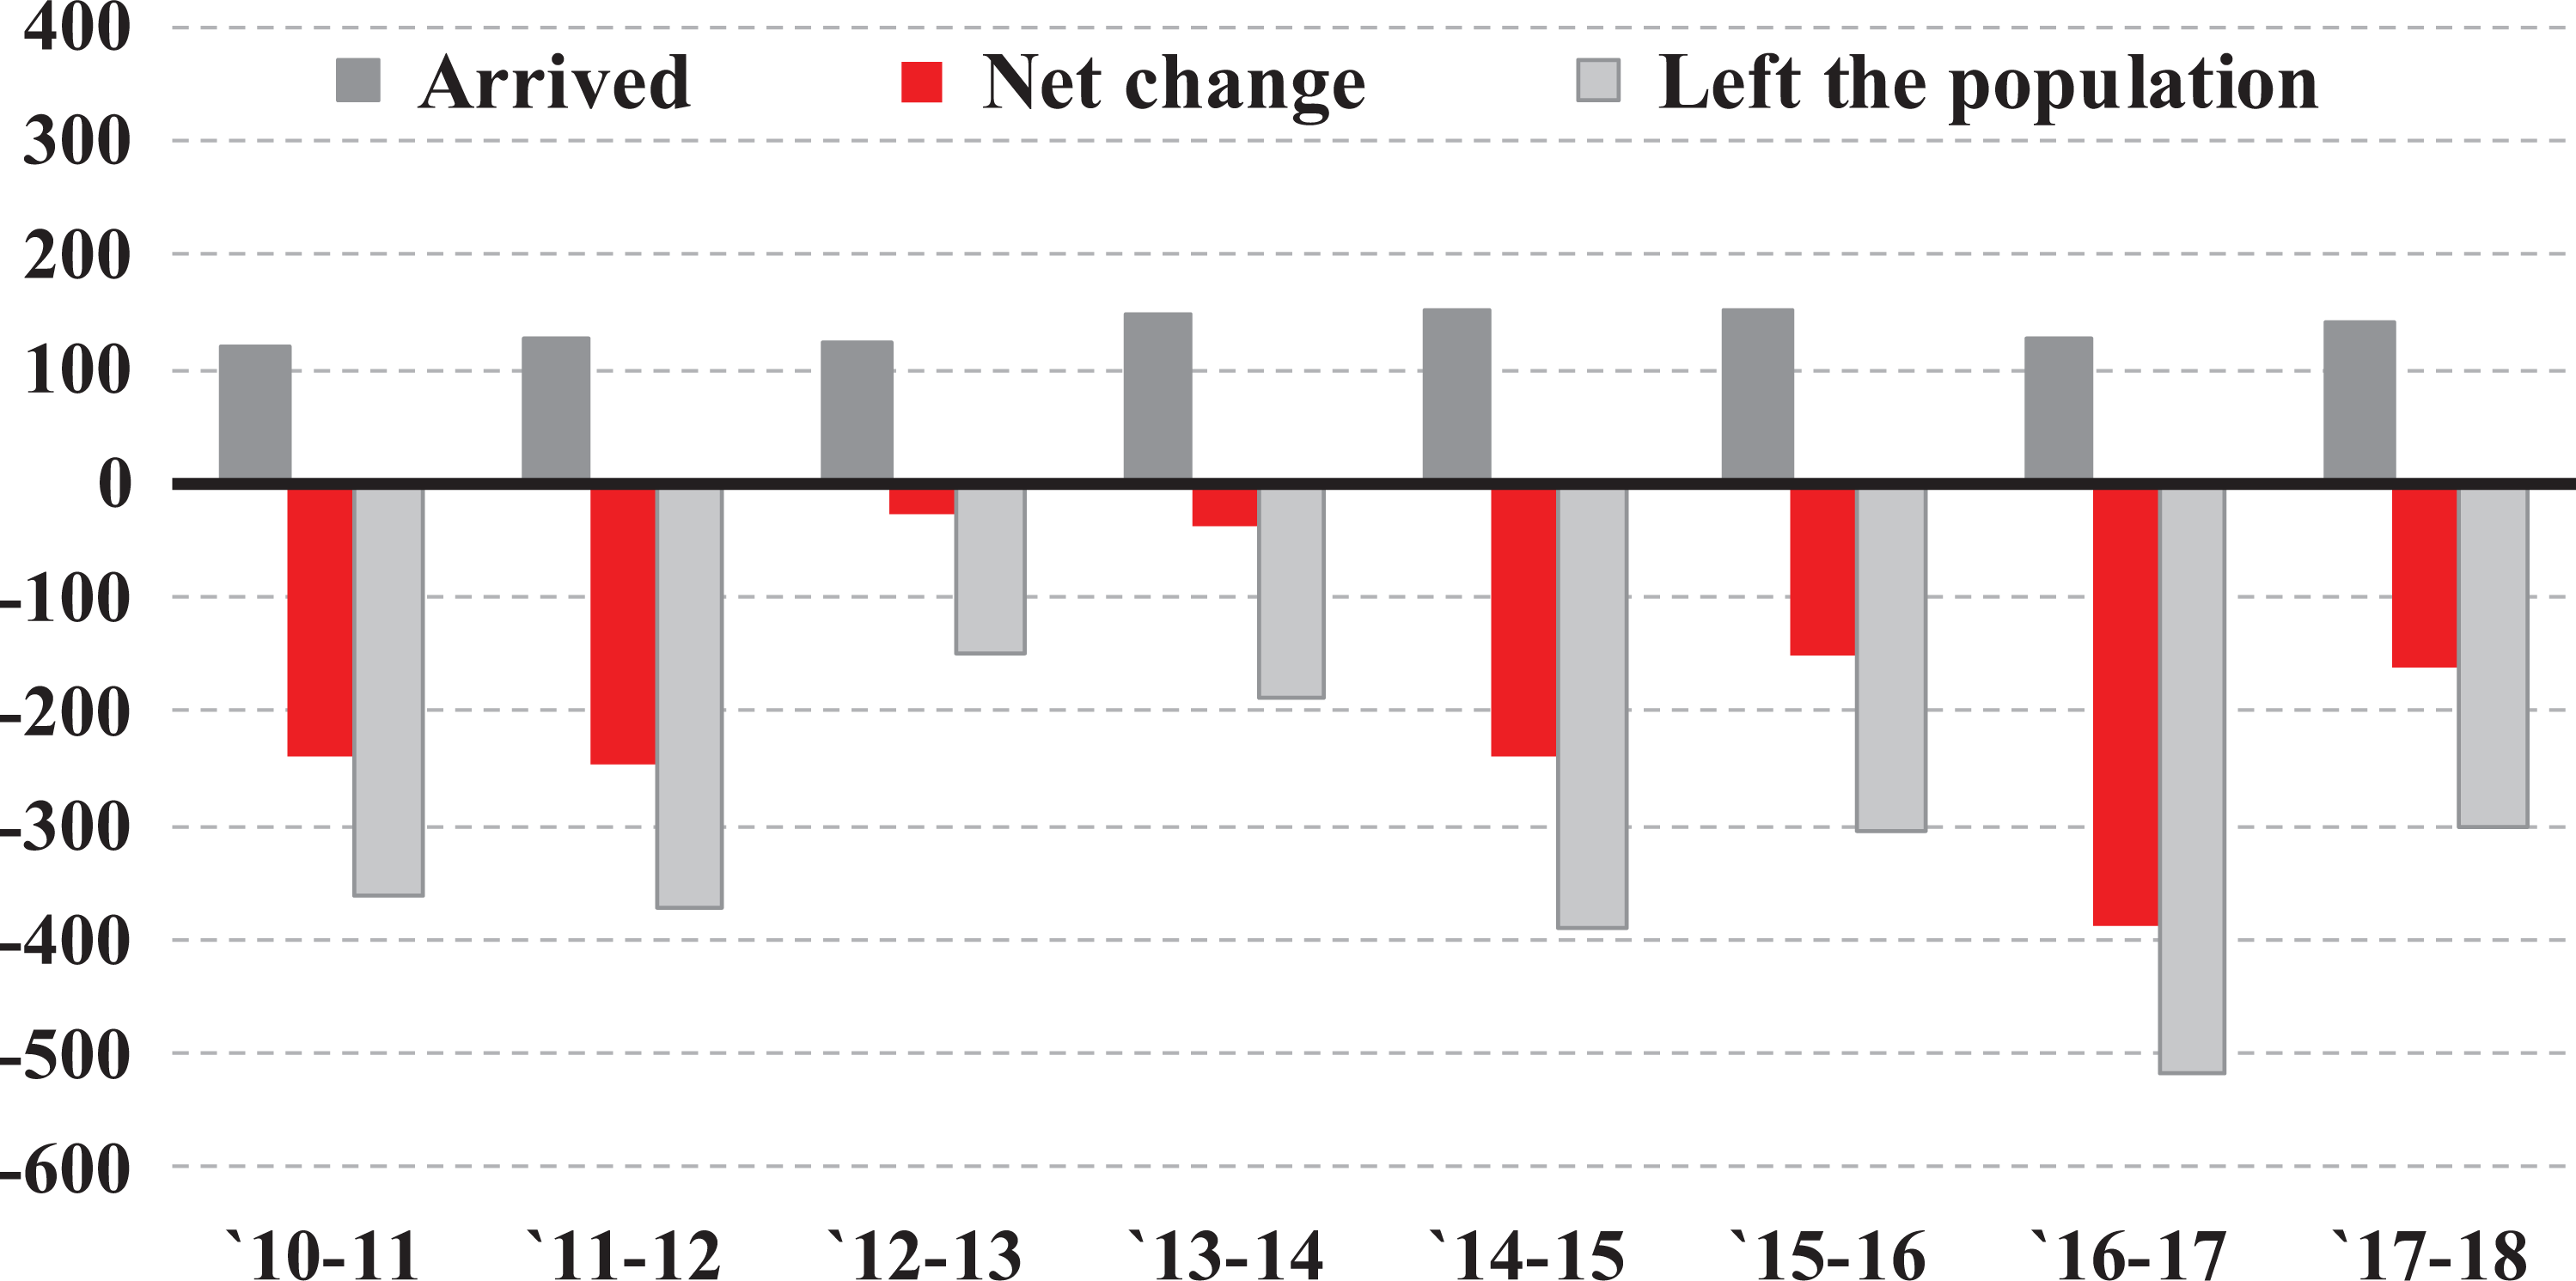
Components of Change in the Undocumented Population from Mexico: 2010 to 2018 (in thousands).
Figure 3 shows trends in population change for Venezuela and Poland since 2010. The very different population trends provide additional evidence that conditions in sending countries strongly influence the size and growth of the US undocumented population. Political unrest in Venezuela appears to have added more than 100,000 to the US undocumented population in just four years (Figure 3).
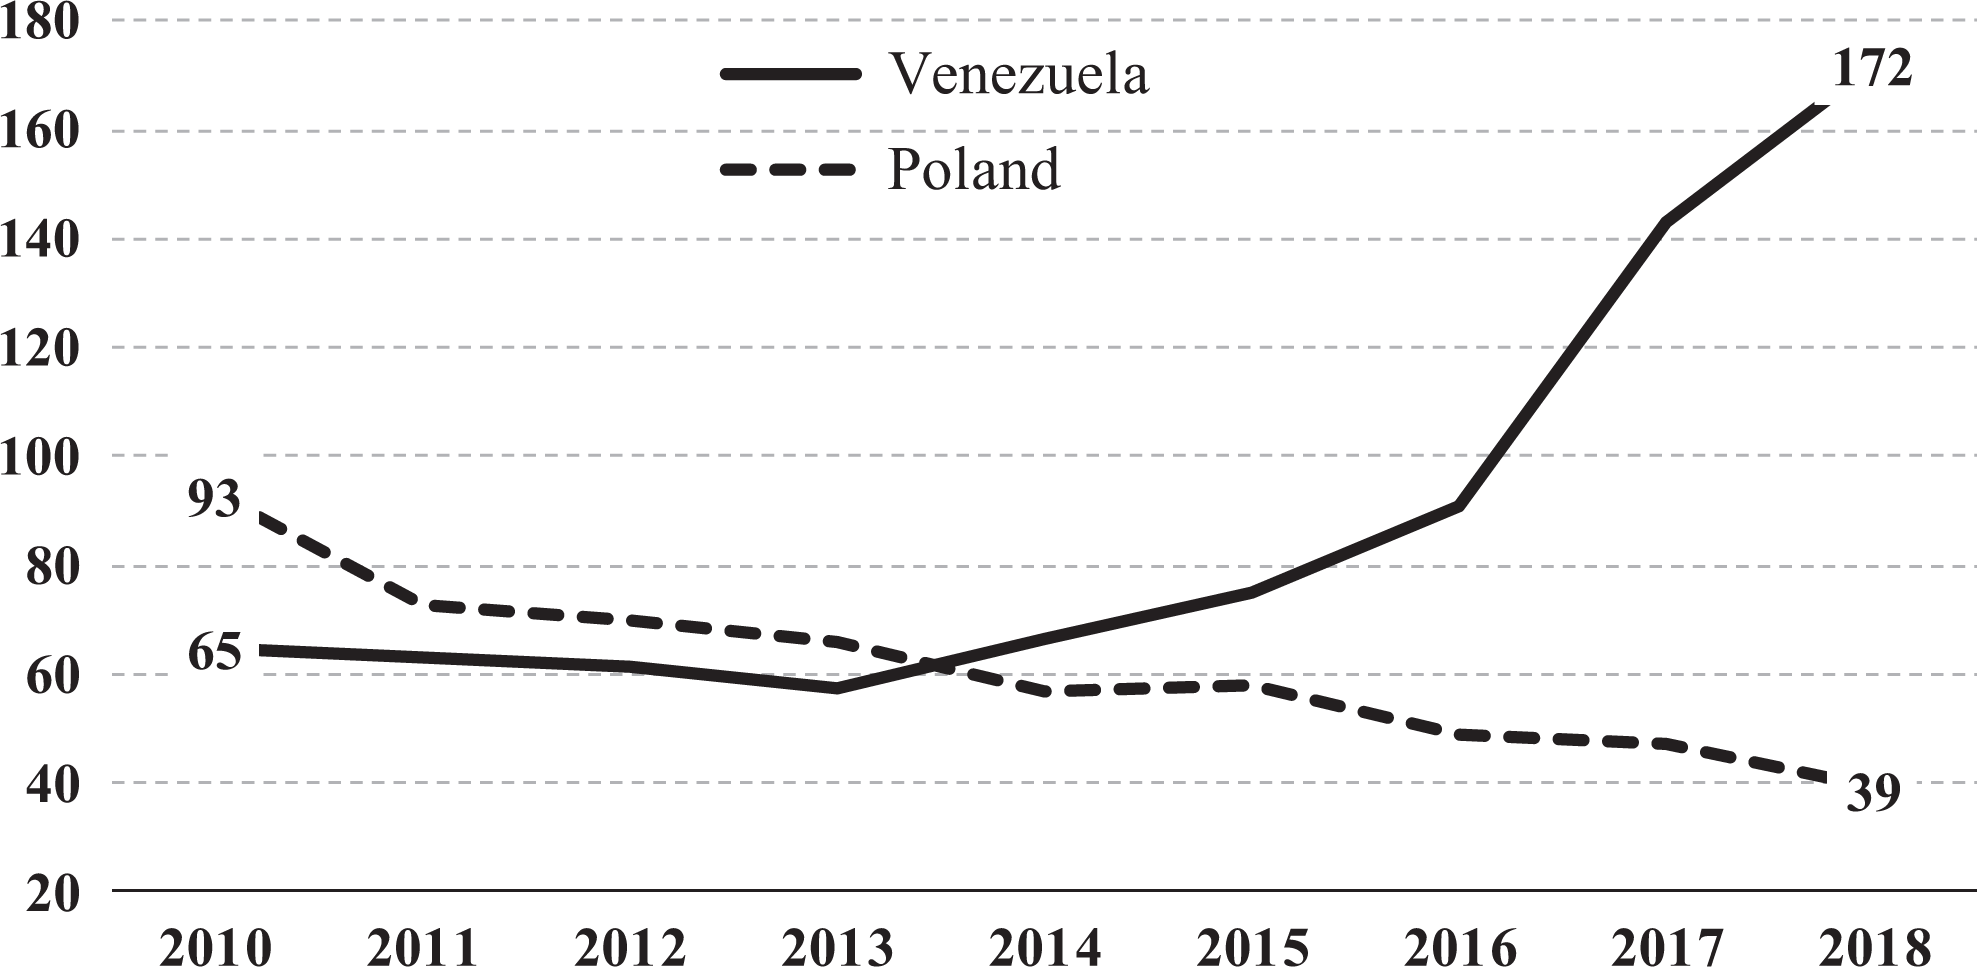
Estimated Undocumented Population from Venezuela and Poland: 2010 to 2018 (in thousands).
The role of political turmoil in increasing the undocumented population from Venezuela is evident. The sustained decline in the undocumented population from Poland — the dotted line in Figure 3 — merits additional analysis. Figure 4 shows that tens of thousands returned to Poland in the 2010 to 2018 period. The population from Poland fell from 93,000 to 39,000 in just eight years not because arrivals dropped (they averaged 1,800 annually) but because, on average, about 8,500 left the population each year (Figure 4).
Components of Change in the Undocumented Population from Poland: 2010 to 2018 (in thousands).
The excess of departures to arrivals from Poland (Figure 4) shows that emigration to Poland, rather than a decline in arrivals, accounted for the decline in the population. The large return flow was most likely due to steadily improving economic and social conditions in Poland. A recent article, “How Poland’s ‘Golden Age’ of Economic Growth Is Going Unreported” (Fredriksson 2019), noted that the economy grew by an average of 4.2 percent annually from 1992 to 2019. The article also noted, “The government’s policy of significant increases in social transfers is fuelling this growth even further.” In a summary of recent economic developments in Poland, the World Bank reported that “Poland’s GDP grew by 5.1 percent in 2018, driven by expanding domestic consumption and high investments. Private consumption was fueled by a strong labor market, increases in average salaries, and social programs such as ‘Family 500+’” (World Bank 2019).
Relationship between Arrivals and Apprehensions: El Salvador, Guatemala, and Honduras
Asylum requests and apprehensions at the southern border have increased considerably in the past few years for migrants from El Salvador, Guatemala, and Honduras, raising concerns about rapid undocumented population growth. The CMS estimates of arrivals, computed as described in the Appendix, provide an opportunity to examine the relationship between the number entering the undocumented population and apprehensions from these countries. Table 2 shows CMS estimates of arrivals for the three countries, along with DHS apprehension statistics, for fiscal years 2011 to 2018. 7
Relationship between Undocumented Arrivals and DHS Apprehensions for El Salvador, Guatemala, and Honduras: FY 2011 to 2018 (numbers in thousands).
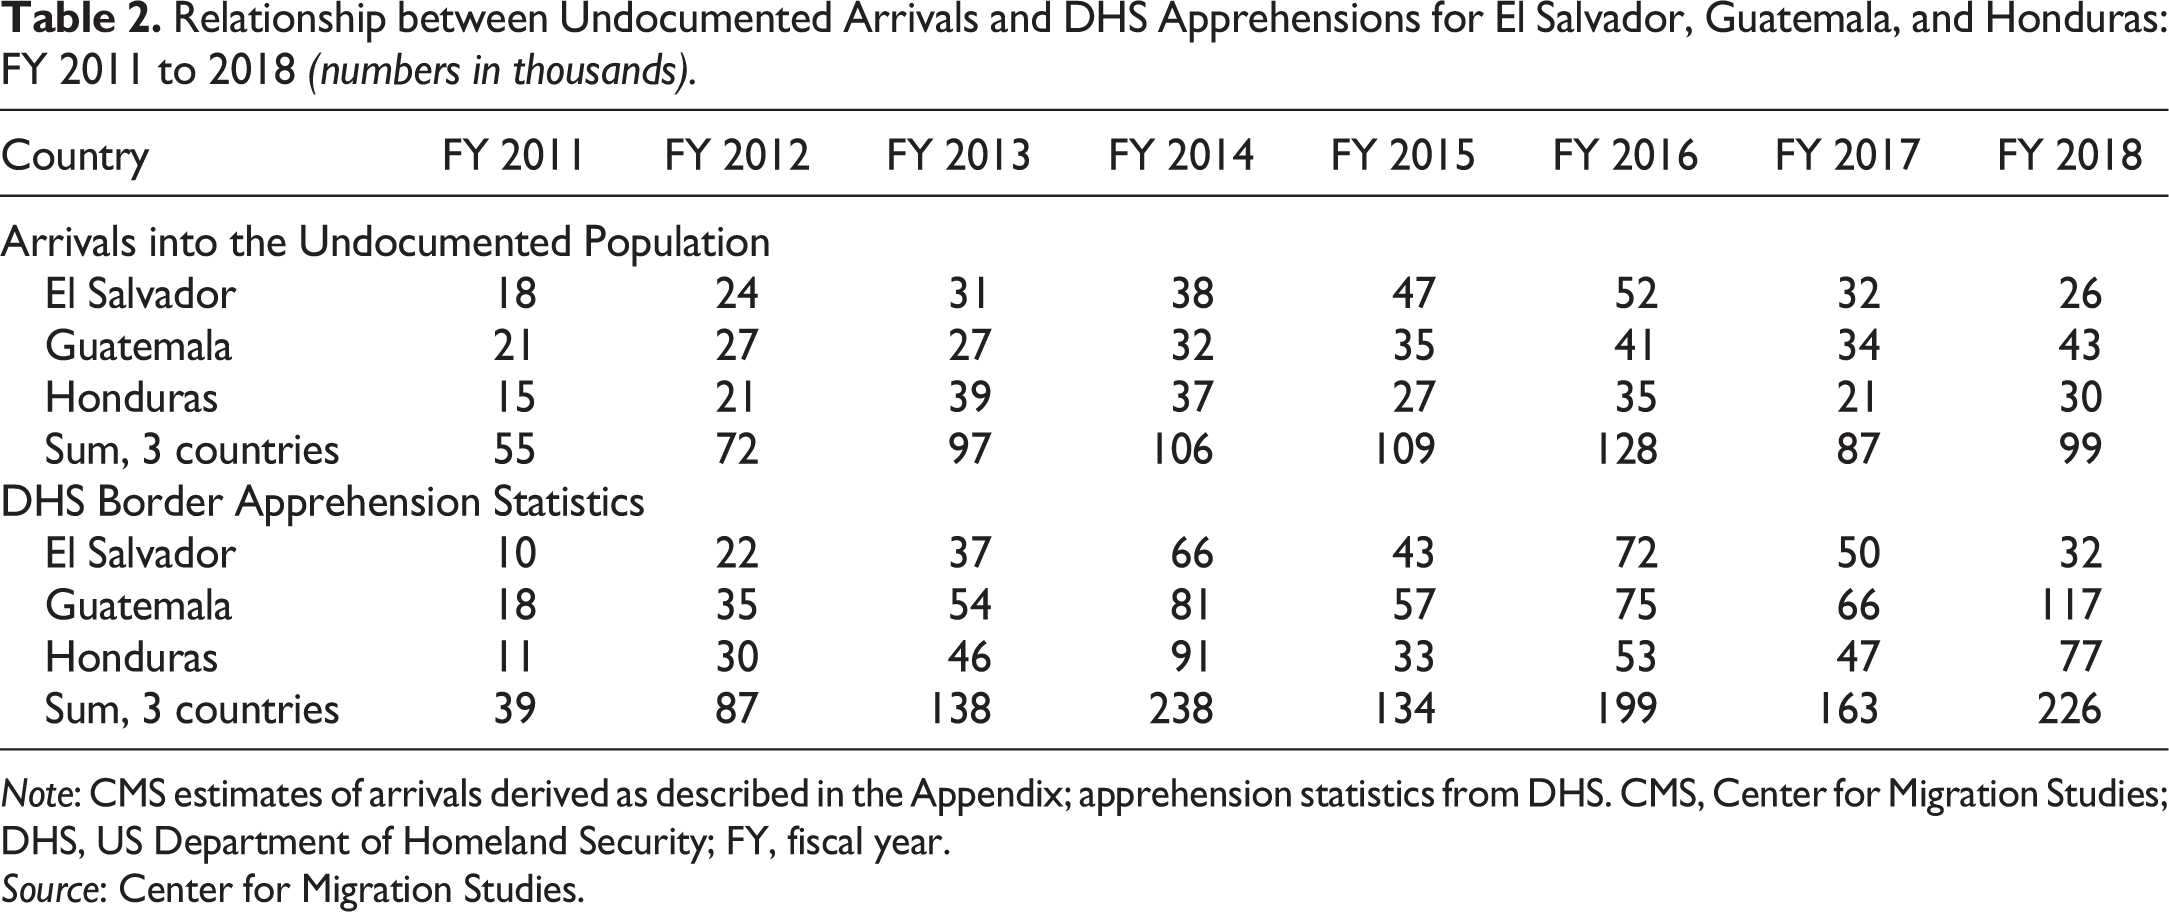
Note: CMS estimates of arrivals derived as described in the Appendix; apprehension statistics from DHS. CMS, Center for Migration Studies; DHS, US Department of Homeland Security; FY, fiscal year.
Source: Center for Migration Studies.
As Table 2 shows, increases in apprehensions at the border do not correspond to increases in the number entering the undocumented population. For example, as apprehensions for Guatemala increased by 100,000 during the eight-year period, the number entering the undocumented population from Guatemala increased by 22,000; in 2017 to 2018, apprehensions increased by 51,000, but arrivals increased by only 9,000 (Table 2). Total arrivals into the US undocumented population from El Salvador, Guatemala, and Honduras were lower in 2018 than they were in 2016.
These findings are significant because they indicate that undocumented migration from Central America has been constant, rather than increasing, since 2014, and they illustrate that increases in border apprehensions should not be equated with increases in arrivals into the undocumented resident population.
State Population Estimates
Table 3 shows estimates of the undocumented population in each state in 2010 and 2018. California had an estimated 2.3 million in 2018, a decline of 600,000 since 2010. The population in Texas increased to 1.8 million in 2018. In 2010, the population in California was 1.2 million higher than in Texas; by 2018, that difference had dropped to 500,000 (Table 3). Other states that had substantial population declines from 2010 to 2018 included New York (−233,000), Illinois (−145,000), New Jersey (−70,000), and Georgia (−53,000).
Estimates of the Undocumented Population, by State: 2010 and 2018 (in thousands).
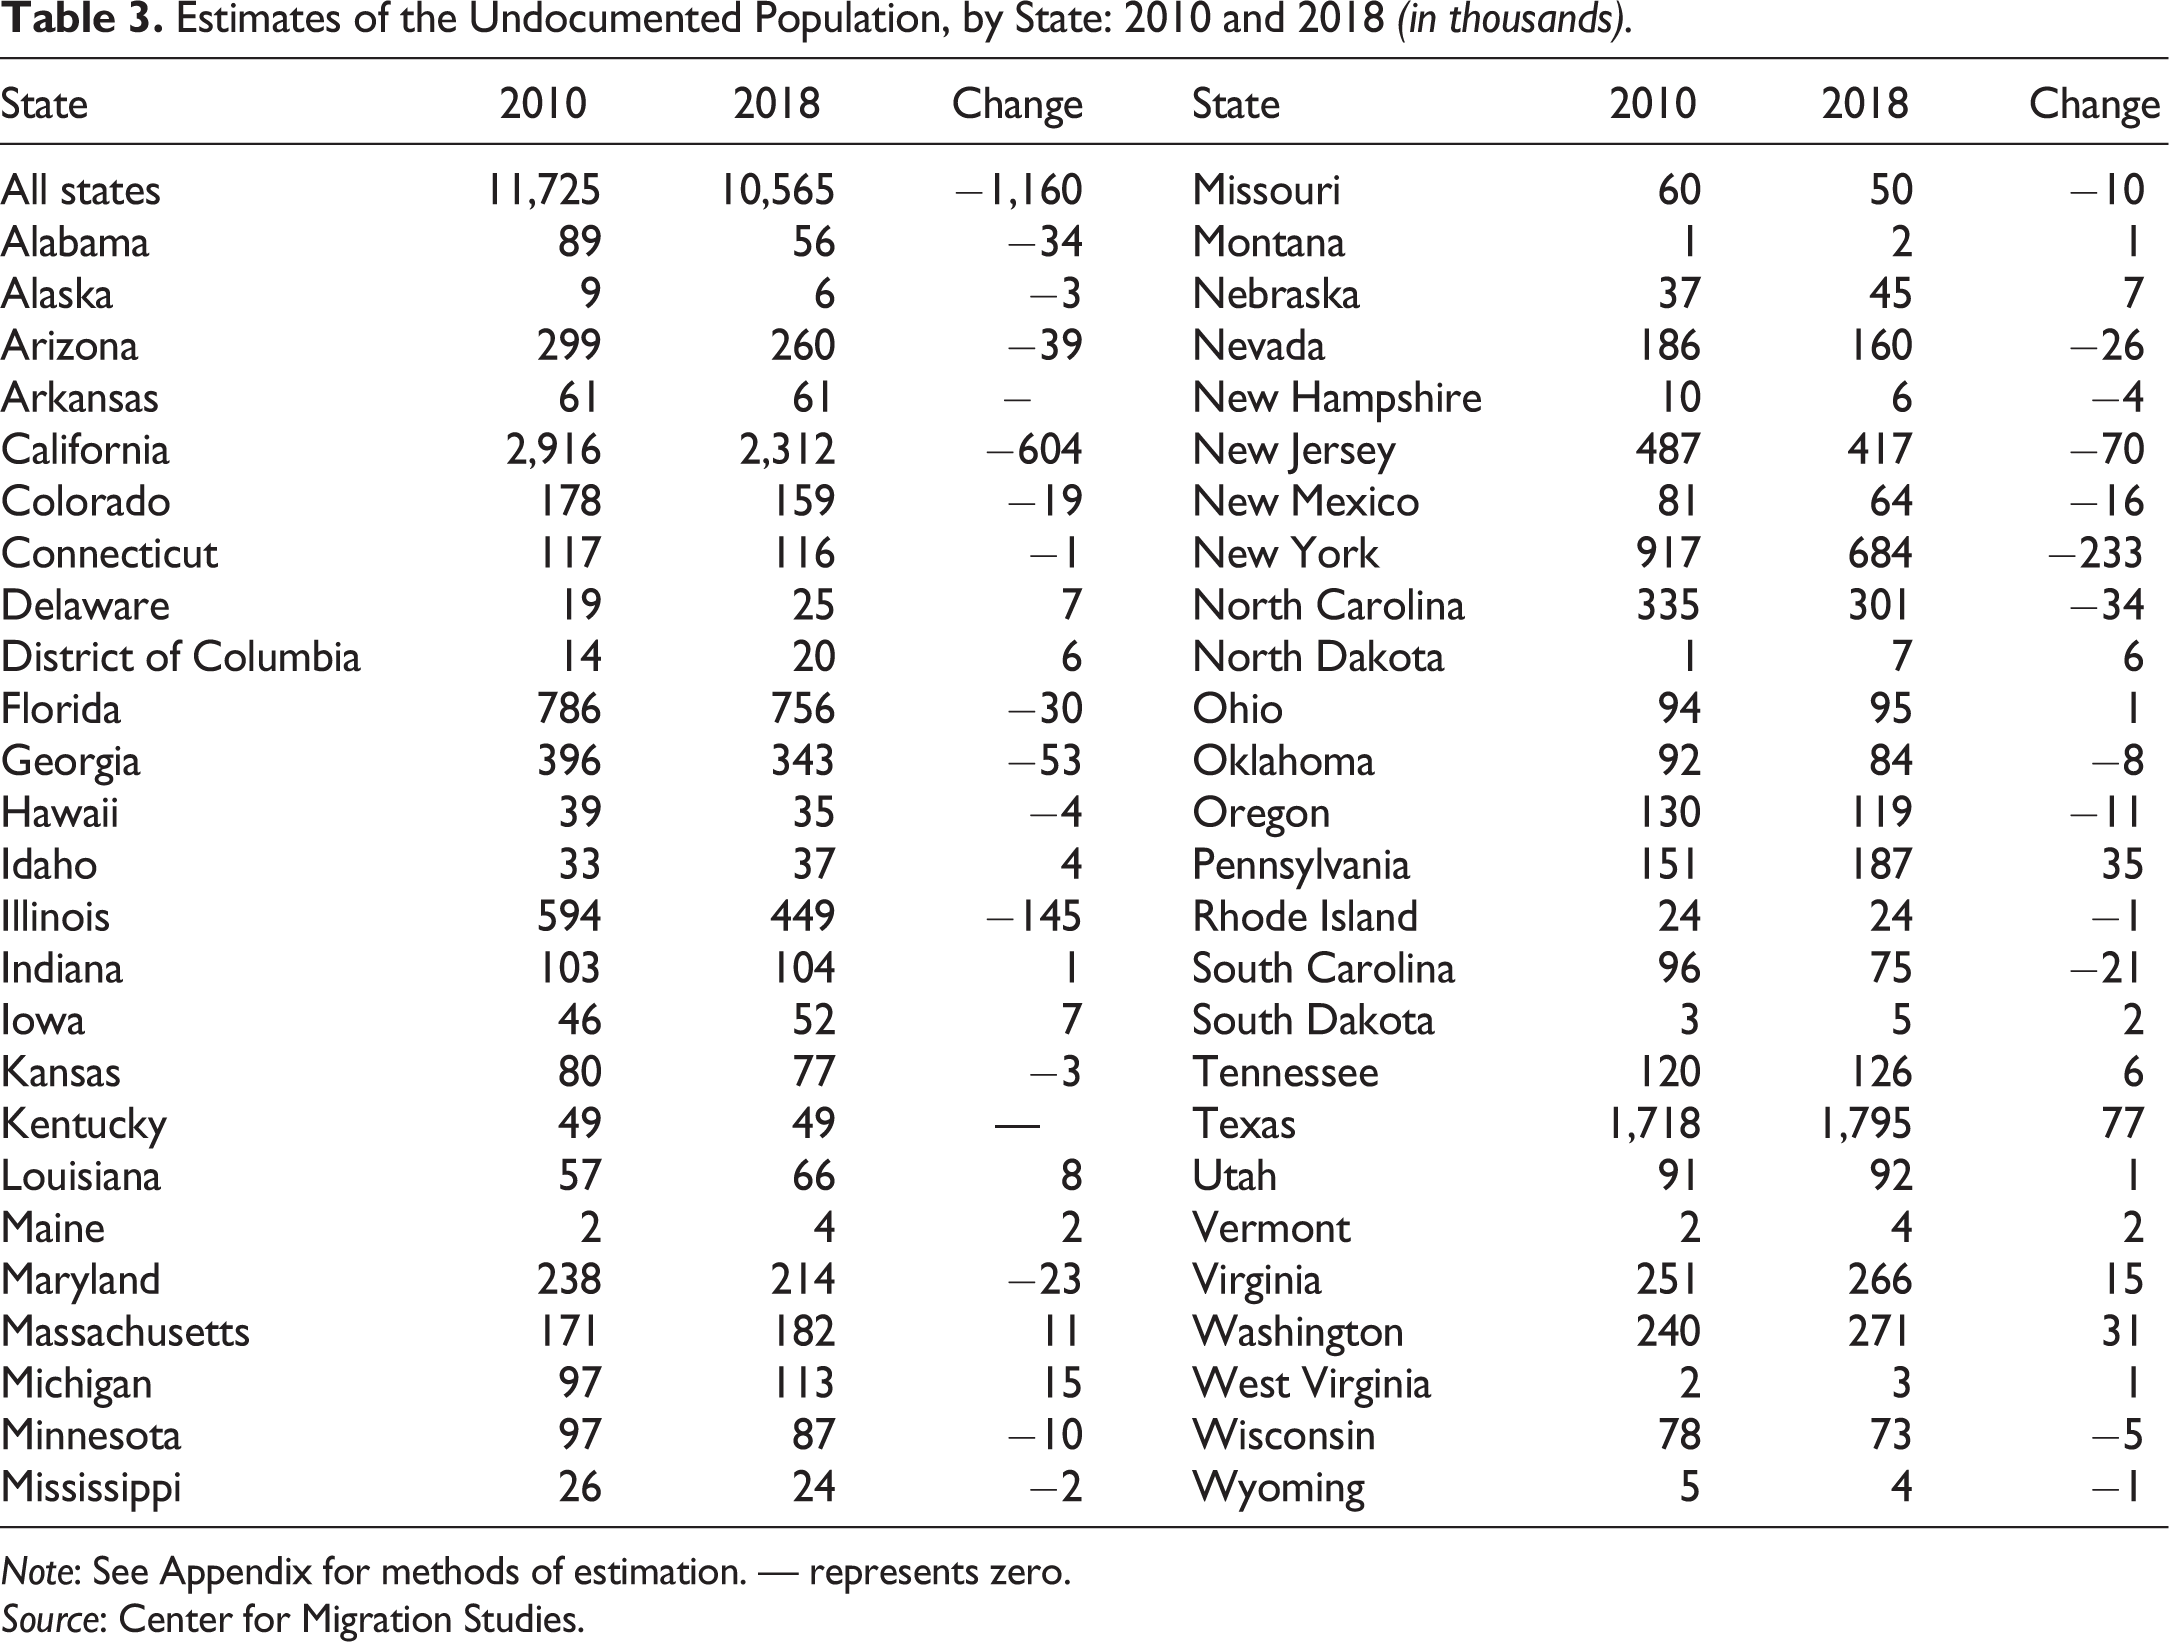
Note: See Appendix for methods of estimation. — represents zero.
Source: Center for Migration Studies.
The population dropped fastest in the 2010 to 2018 period in states that cooperate the least with federal immigration enforcement efforts — New York (−25 percent), Illinois (−24 percent), and California (−21 percent) — while the population in Texas, which is not a so-called sanctuary state, continued to grow (Table 3).
The largest increase in population for any state from 2010 to 2018 was for Texas, which grew by 77,000, or 4.5 percent (Table 3). The population in Texas increased even as the number from Mexico (residing in Texas) fell by 123,000 throughout the period. That decline was offset by increases in undocumented residents from Central America (+87,000), Venezuela (+21,000), and Nigeria (+13,000).
Many of the states that declined from 2010 to 2018 did so because the undocumented population from Mexico declined. As with the population in Texas, however, population change for a state is determined by the net effect of declines and increases from various countries, as shown for California and New York in Table 4. For California, the large declines for Mexico and, to a lesser extent, Vietnam, Philippines, and Korea were partially offset by increases from India and China. For New York, the 25 percent population decline from 2010 to 2018 was primarily due to large declines in undocumented residents from Jamaica, Trinidad and Tobago, Ecuador, Mexico, El Salvador, and Dominican Republic (Table 4).
Change in the Undocumented Population in California and New York, 2010 to 2018: Top 10 Countries for Each State (in thousands) Ranked by Top 10 Countries in 2010.
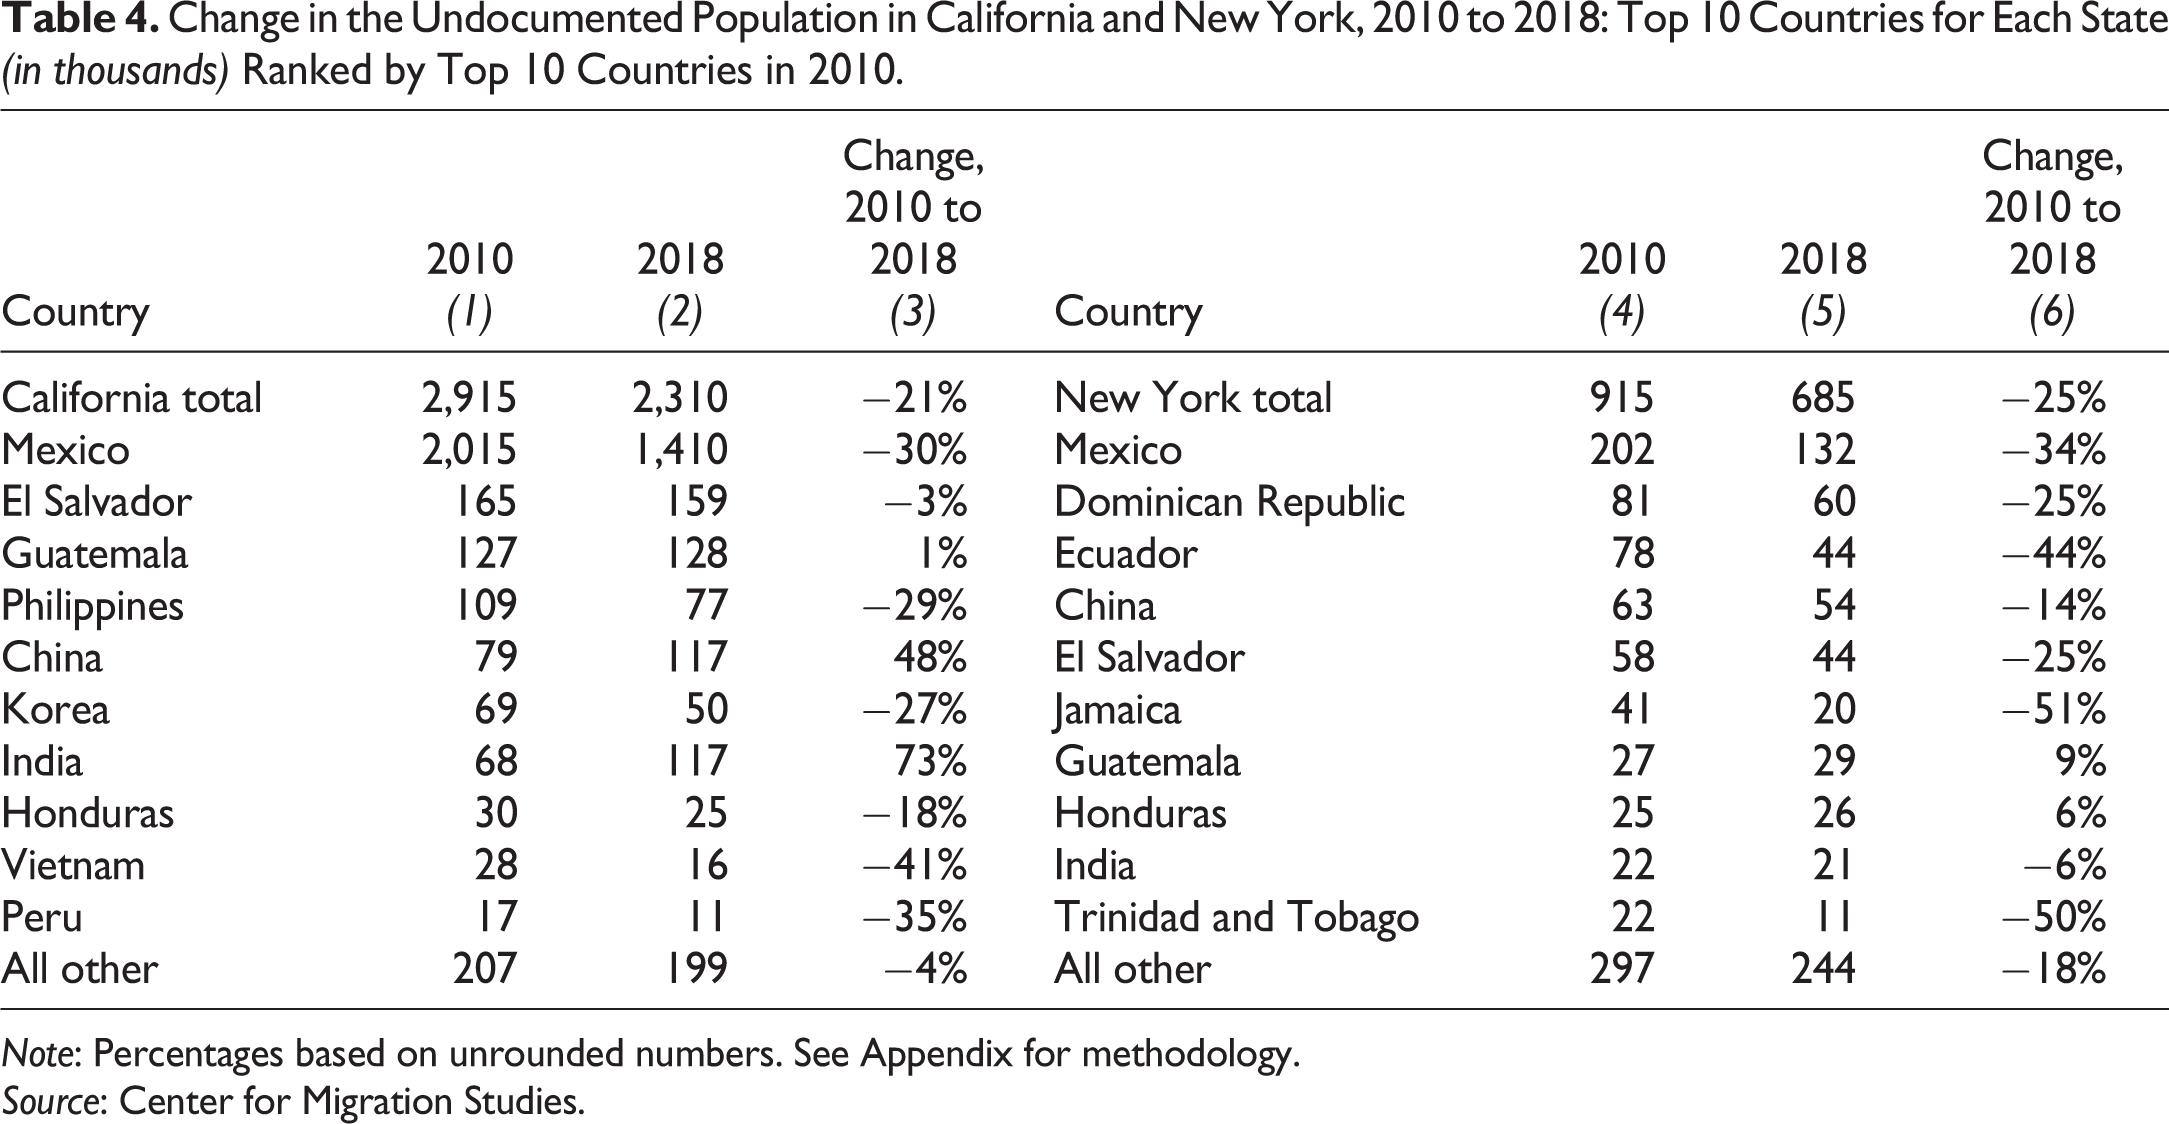
Note: Percentages based on unrounded numbers. See Appendix for methodology.
Source: Center for Migration Studies.
Summary
This analysis of changes in the undocumented population from 2010 to 2018 shows that some important trends continued. The total US undocumented population stayed just lower than zero growth, the population from Mexico continued to fall sharply, and overstays continued to make up two-thirds of newly undocumented residents. It also revealed, however, other significant aspects of undocumented population change.
Even though total border apprehensions from El Salvador, Guatemala, and Honduras increased by 63,000 in 2018, from 163,000 to 226,000, total undocumented arrivals from the three countries increased by only 12,000. Total arrivals from the three countries were at about the same level in 2018 as in the previous four years. Arrivals and apprehensions are related only tangentially: arrivals join the population; apprehensions do not.
These estimates reveal for the first time the critical role that departures play in undocumented population change. As Figure 2 shows, arrivals from Mexico increased slightly from 2010 to 2018 but remained in the 125,000 to 150,000 range. The total number leaving the population (due to voluntary emigration, removal, adjustment of status, or death) varied greatly, however. Departures not only exceeded arrivals every year; they were the primary determinants of change in the population from Mexico (Figure 2). Nearly half of the departures shown in Figure 2 were voluntarily returns to Mexico. 8
The decline in the undocumented population from Poland illustrates the importance of voluntary emigration to countries that experience improving conditions. Since 2010, a steady stream of about 1,800 overstays arrived from Poland each year, possibly passing through the same airports 9 as the 8,500 who were returning to Poland. A determined US program for improving the economic and security conditions in El Salvador, Guatemala, and Honduras would likely have similar results and would be more humane and less costly than building a 2,000-mile wall, tracking migrants in the desert, or exposing US asylum seekers to life-threatening conditions in Mexican border cities.
Footnotes
Appendix
Declaration of Conflicting Interests
The author declared no potential conflicts of interest with respect to the research, authorship, and/or publication of this article.
Funding
The author received no financial support for the research, authorship, and/or publication of this article.