
Abstract
Executive Summary
This article provides detailed estimates of foreign-born (immigrant) workers in the United States who are employed in “essential critical infrastructure” sectors, as defined by the Cybersecurity and Infrastructure Security Agency (CISA) of the US Department of Homeland Security (DHS) (DHS 2020). Building on earlier work by the Center for Migration Studies (CMS), the article offers exhaustive estimates on essential workers on a national level, by state, for large metropolitan statistical areas (MSAs), and for smaller communities that heavily rely on immigrant labor. It also reports on these workers by job sector; immigration status; eligibility for tax rebates under the Coronavirus Aid, Relief, and Economic Security Act (CARES Act); and other characteristics. It finds that: Sixty-nine percent of all immigrants in the US labor force and 74 percent of undocumented workers are essential workers, compared to 65 percent of the native-born labor force. Seventy percent of refugees and 78 percent of Black refugees are essential workers. In all but eight US states, the foreign-born share of the essential workforce equals or exceeds that of all foreign-born workers, indicating that immigrant essential workers are disproportionately represented in the labor force. The percentage of undocumented essential workers exceeds that of native-born essential workers by nine percentage points in the 15 states with the largest labor force. In the ten largest MSAs, the percentages of undocumented and naturalized essential workers exceed the percentage of native-born essential workers by 12 and 6 percent, respectively. A total of 6.2 million essential workers are not eligible for relief payments under the CARES Act, as well as large numbers of their 3.8 million US citizen children (younger than age 17), including 1.2 million US citizen children living in households below the poverty level. The foreign-born comprise 33 percent of health care workers in New York State, 32 percent in California, 31 percent in New Jersey, 28 percent in Florida, 25 percent in Nevada and Maryland, 24 percent in Hawaii, 23 percent in Massachusetts, and 19 percent in Texas.
Section I of the article describes the central policy paradox for foreign-born workers during the COVID-19 pandemic: that they are “essential” at very high rates, but many lack status and they have been marginalized by US immigration and COVID-19-related policies. Section II sets forth the article’s main findings. Section III outlines major policy recommendations.
I. Foreign-Born Workers and COVID-19: The Policy Context
Scholars have abundantly documented the contributions of immigrants to the US labor force and economy, but these contributions remain poorly acknowledged in US political discourse. Foreign-born participation rates in the labor force have long exceeded those of the native-born (BLS 2019). Immigrants fill gaps in the US economy, improve labor market efficiency, and support the aging US population (Sherman et al. 2019). Immigration has also “brought to the United States an inordinate share of the world’s best talent which has been a windfall in a global economy where heavy advantages accrue to the most innovative companies and countries” (CFR 2009).
As immigrants progress to permanent residence and naturalization, they contribute more significantly to US communities and the nation (Kerwin and Warren 2019). Yet the Trump administration has sought to strip several populations of legal status and to decrease legal immigration through a laundry list of administrative measures (ibid.). The administration has repeatedly argued that immigrants displace and diminish the prospects of native-born workers, a notion that rests on the “fundamental misconception that there is a fixed amount of work in society” (Nowrasteh 2020) and that ignores the myriad ways immigrants create jobs.
The administration has designated many immigrant-dense sectors “essential,” but has failed to make Centers for Disease Control and Prevention (CDC) guidelines for safeguarding these workers enforceable, or to offer hazard pay, access to health care, assistance with child care, temporary housing (as necessary), or other needed assistance to them (Evich and Crampton 2020). Instead, it has used the pandemic to reduce workplace protections for essential workers, particularly immigrants (Mayer 2020), and to restrict legal immigration and refugee admissions (Trump 2020a, 2020b).
Moreover, at the peak of foreign-born workers acknowledged importance to the country, the Coronavirus Aid, Relief, and Economic Security Act (CARES Act) denied federal tax rebates to persons who filed tax returns without a “valid identification number” (defined as a Social Security number) or, in the case of a joint return, if either spouse lacked a Social Security number. 1 US residents who filed their taxes with Individual Taxpayer Identification Numbers (ITINs) did not qualify for benefits. Yet ITIN filers pay more than $9 billion in withheld payroll taxes annually and contribute to the solvency of federal retirement programs (Hallman 2018). The CARES Act excluded most US taxpaying, mixed-status families — with undocumented and US citizen members (typically children) — from obtaining badly needed financial relief.
US Citizenship and Immigration Services (USCIS) has announced that “medical treatment or preventive services” for COVID-19 or symptoms that resemble COVID-19 will not be held against immigrants under the new “public charge” rule, when they seek to adjust to permanent residence (USCIS 2020). In addition, it has vowed to take into “consideration” evidence that COVID-19 or related policies caused the use of public benefits or influenced other “relevant” factors in a public charge determination (ibid.).
The administration has refused to suspend the public charge rule during the pandemic, although in late July of 2020 a federal court enjoined enforcement of the rule during the national health emergency. Nonetheless, there have been numerous reports of immigrants and their family members — sick with COVID-19 — who refuse to access health services or benefits for fear that doing so would compromise their ability or that of family members to obtain permanent residence (Hlavinka 2020; Raff 2020). This chilling effect appeared even prior to the pandemic and implementation of the new rule. A team of scholars from the Urban Institute found “a statistically significant increase (from 21.8 percent to 31.0 percent)” between 2018 and 2019 in chilling effects among adults in immigrant families in which at least one member was not a permanent resident (Bernstein et al. 2020, 4). 2 Beyond longstanding barriers to immigrants accessing public programs, the study concluded that the new rule’s “complexity — along with the broader enforcement-oriented immigration policy climate — raises additional barriers and may have spillover effects on families and programs not targeted by the rule” (ibid., 4).
This article shows that the foreign-born work at high rates in the US “essential critical infrastructure” workforce — such as in meatpacking and poultry processing, agricultural work, health care, construction, child care, and critical retail — as defined by DHS’s Cybersecurity and Infrastructure Security Agency (DHS-CISA 2020). 3 The federal government, states, and localities have acknowledged the crucial contributions of these workers, many of whom risk their lives as “front-line” responders. Federal guidelines seek to promote the ability of essential workers “to continue to work during periods of community restriction” (ibid.). States, in turn, have produced template letters for use by critical infrastructure employers and employees that seek to ensure that essential workers can travel to and from work, and can carry out their job responsibilities without interference from public officials (Suro and Findling 2020).
COVID-19 has exacted a grim toll on immigrants and other vulnerable communities. Several industries with large numbers and substantial rates of foreign-born workers have experienced high rates of infection. According to the Midwest Center for Investigative Reporting, as of August 25, 2020, a reported 37,500 workers in 416 meatpacking plants in 40 states had tested positive for COVID-19, and “at least” 170 workers had died (Chadde 2020). These figures almost certainly undercount the numbers of meatpacking plant workers who have contracted COVID-19 and who have died from related complications.
On April 26, the CDC and the Occupational Safety and Health Administration (OSHA) issued interim guidance, with a series of recommendations, on how meatpacking and poultry-processing facilities can safeguard workers from infection, reduce COVID-19’s spread, and prepare for their recovered workers to return to work (CDC and OSHA 2020). This nonbinding guidance makes it exceedingly difficult for workers to prevail in legal challenges to unsafe working conditions by stipulating that “some employers may face difficulties complying with certain OSHA standards due to the ongoing health emergency” and that OSHA will evaluate employers on whether they have made “a good faith effort to comply with applicable OSHA standards” (ibid.). Despite the risk to workers — indeed, because of closures and the reduced capacity of meatpacking and poultry-processing facilities due to worker illness — the president subsequently delegated the Secretary of Agriculture to “take all appropriate action” to ensure that these “essential infrastructure” continue their operations (Trump 2020b). Many have harshly criticized the administration’s actions as valuing production over lives and of using the pandemic to advance goals, such as weakened workplace protections, that it has long championed (Axon, Bagenstose, and Chadde 2020). OSHA has failed to act on thousands of workplace complaints related to COVID-19 (Mayer 2020).
Migrant farmworkers have also been hard hit. In Immokalee, Florida, for example, 1,910 persons had tested positive for COVID-19 by July 20 (Florida Department of Health 2020), the overwhelming majority of them agricultural workers for whom social distancing, at home or at work, can be difficult, if not impossible (Reiley 2020). Agricultural workers in New York, Washington, North Carolina, and California have also suffered large-scale outbreaks (Evich and Crampton 2020). In short, immigrants have been on the front lines in stemming the spread of COVID-19, disproportionately represented among its victims, and mostly left by the federal government to fend on their own with unsafe working conditions and the economic downturn.
II. Findings
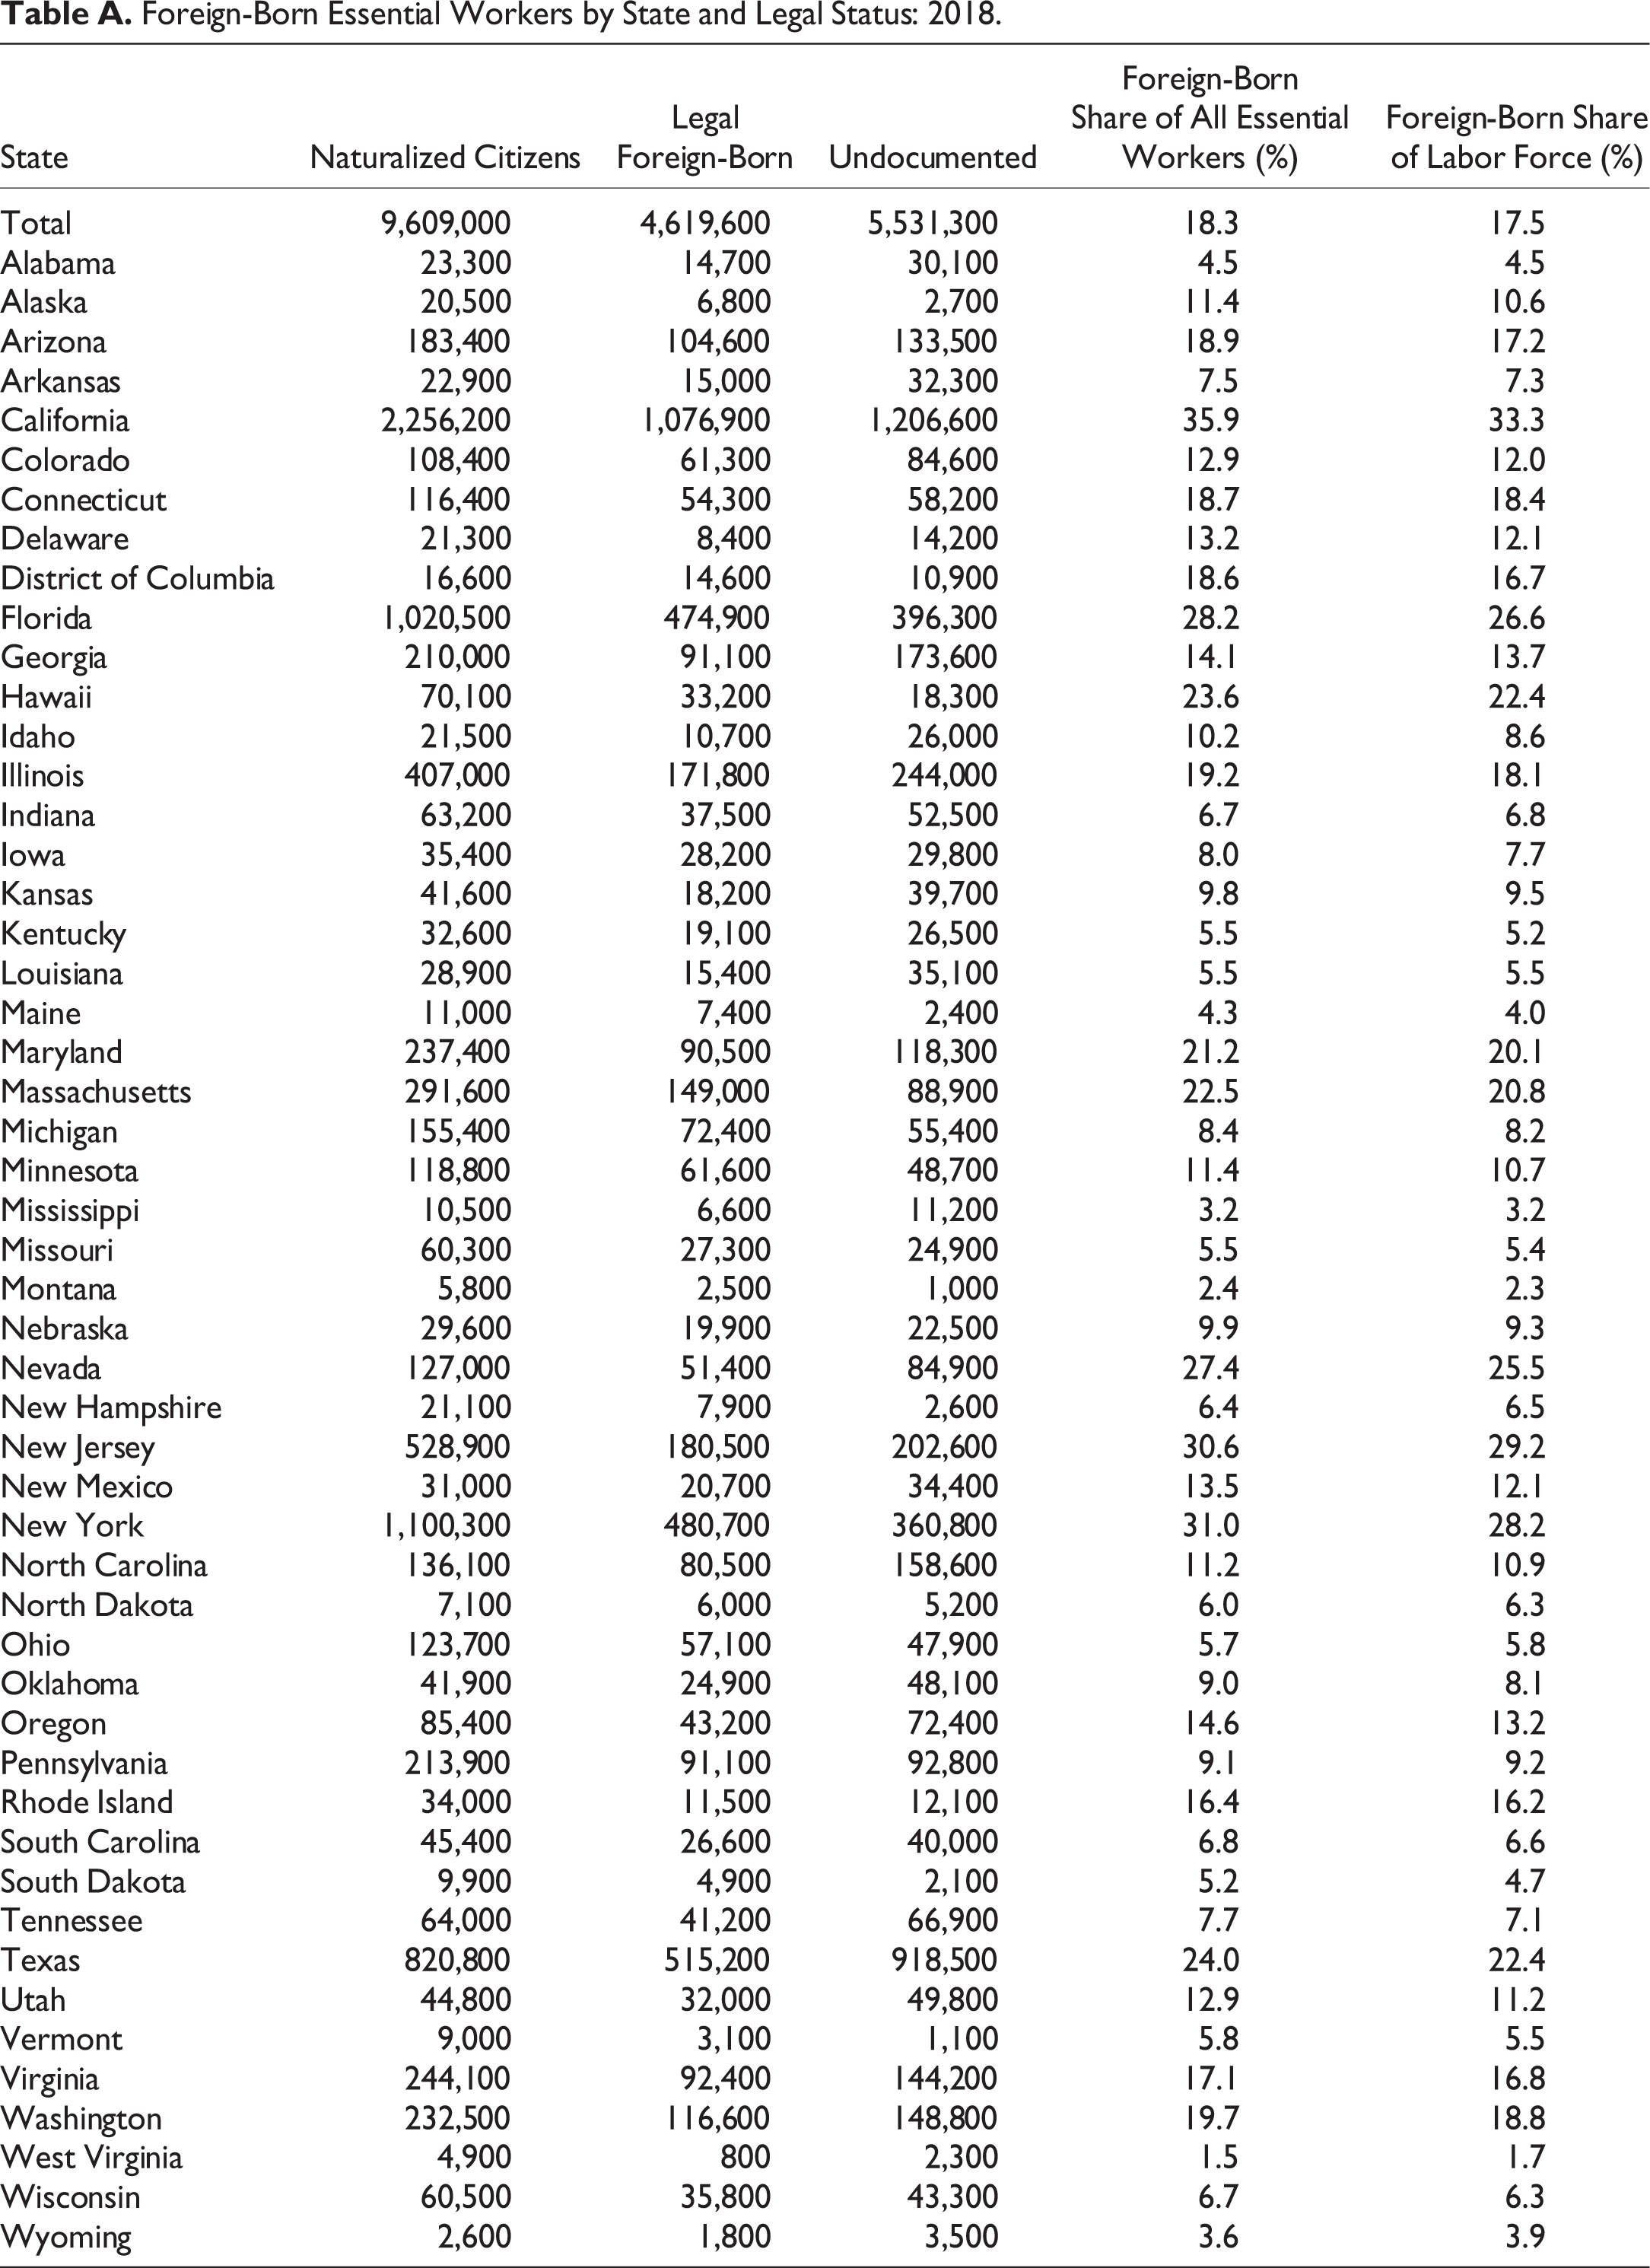
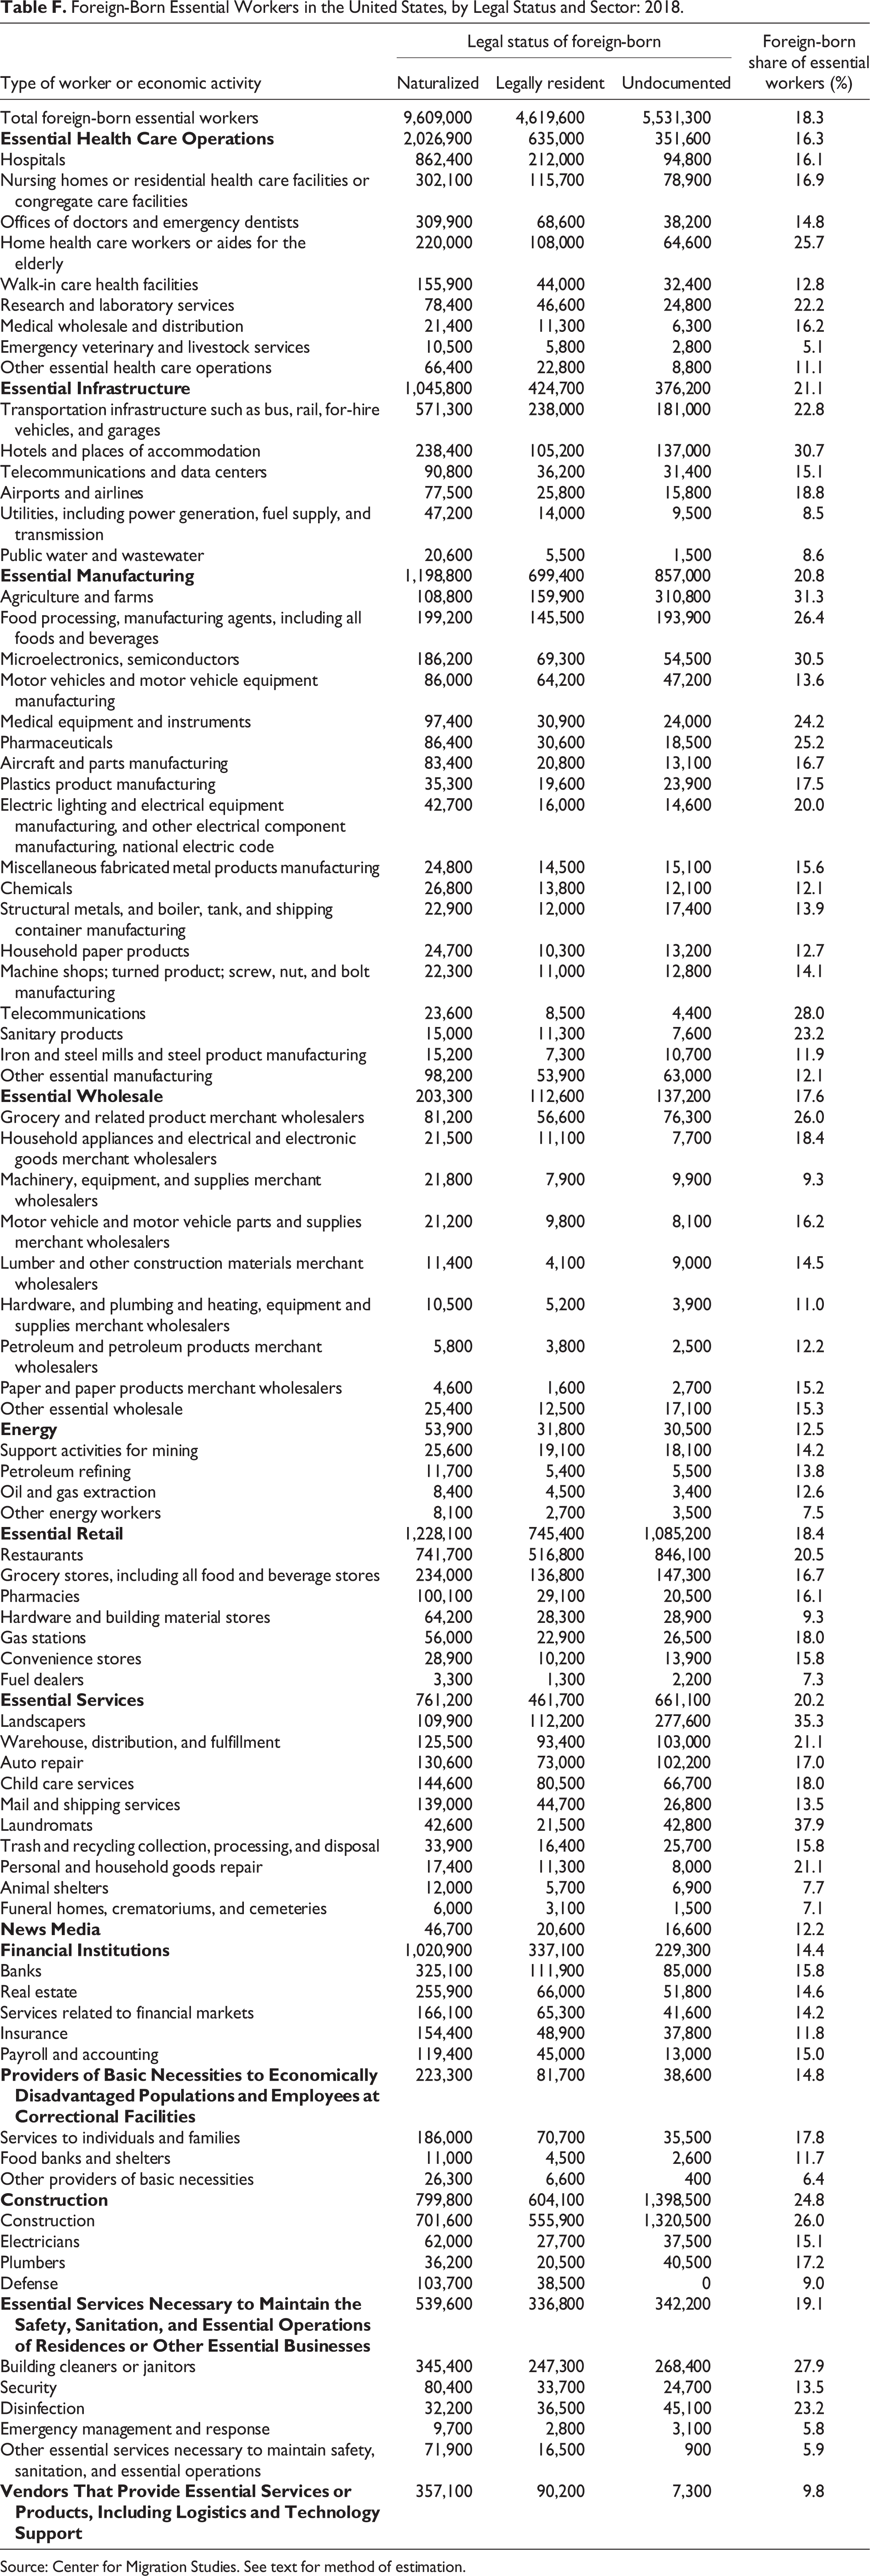
Based on 2018 US Census Bureau data, the Center for Migration Studies (CMS) estimates that 19.8 million immigrants (69 percent) work in “essential critical infrastructure” sectors (DHS-CISA 2020), 4 compared to 65 percent of the native-born labor force (Table 1). Essential workers make up a larger share (74 percent) of all undocumented workers than the native-born or legally resident populations; that is, undocumented workers supply relatively more essential workers during the pandemic. As column 7 in Table 1 shows, the share of undocumented workers that are essential exceeds the native-born share by about nine percentage points. In many states, this disparity is even more pronounced (Table 1). These workers meet the health, infrastructure, manufacturing, service, food, safety, and other needs of all Americans. Roughly one-half of US foreign-born essential workers — 9.6 million — are naturalized citizens, 4.6 million are legal noncitizens (mostly lawful permanent residents or LPRs), and 5.5 million are undocumented (Appendix, Table A). 5
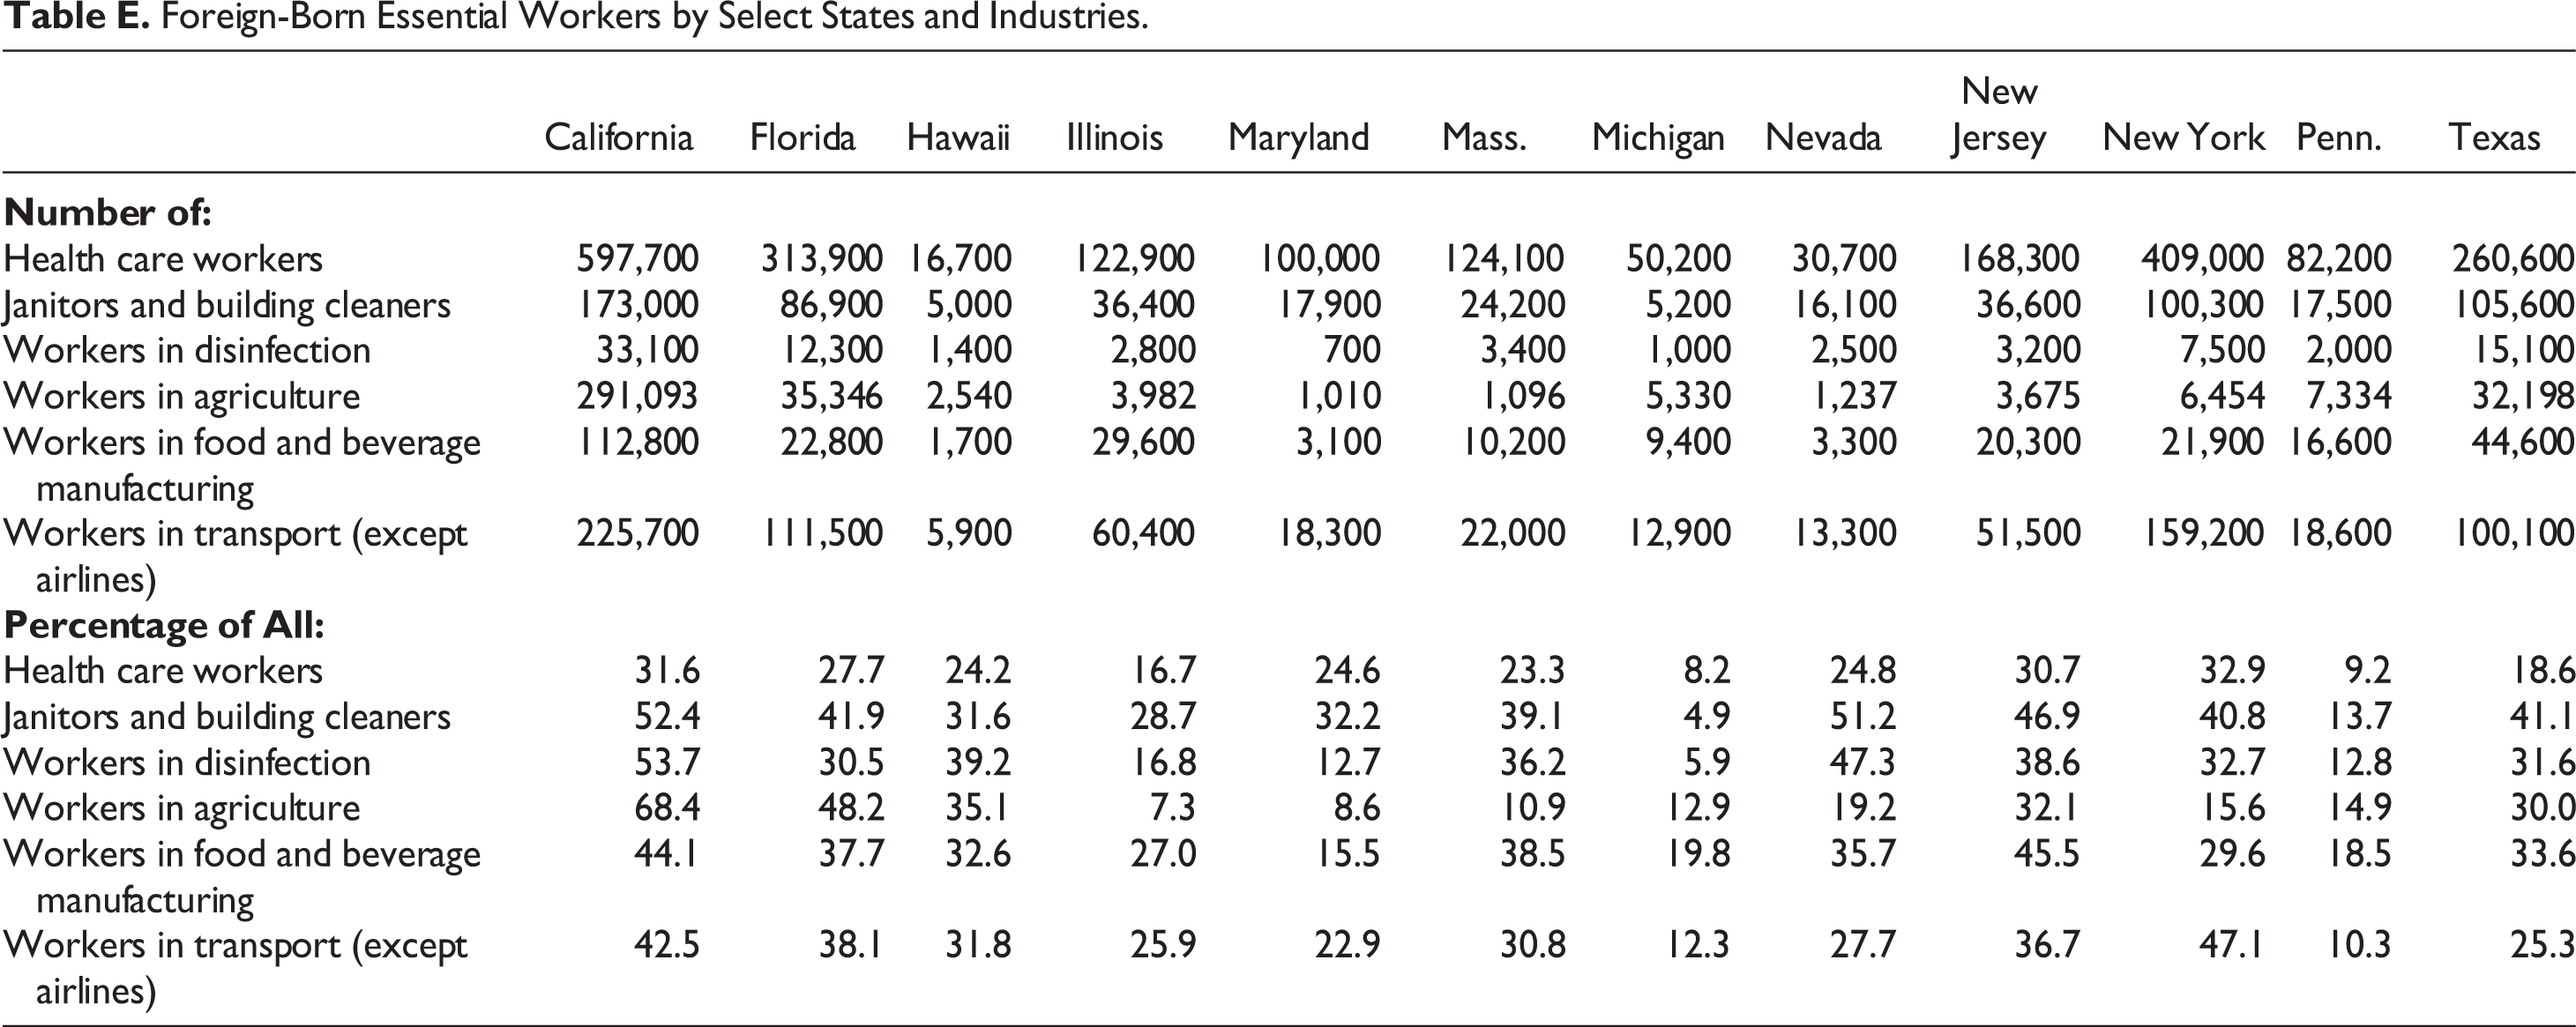
In all but eight states, the foreign-born share of the essential workforce equals or exceeds the overall foreign-born share of state workers, (Appendix, Table A). In California, immigrants comprise 36 percent of essential workers. In New York and New Jersey, they comprise 31 percent of essential workers. In Florida and Nevada, they make up 28 and 27 percent of essential workers, respectively. They also account for more than 20 percent of essential workers in Texas (24 percent), Hawaii (24 percent), Massachusetts (23 percent), and Maryland (21 percent). Foreign-born essential workers work at high rates in several of the states experiencing the most significant percentage increases in new COVID-19 cases as of late-August 2020 (Adeline et al. 2020; CDC 2020), including California (36 percent), Florida (28 percent), and Texas (24 percent).
In the five states with the largest labor force, a relatively higher percentage of naturalized citizens are essential workers, compared to the native-born (Table 1). In California, 66 percent of naturalized workers are essential compared to 61 percent of native-born workers. In New York, 69 percent of naturalized workers are essential, compared to 61 percent of native-born workers.
Percentage of the Labor Force That Are Essential, and Comparisons between Native-Born and Immigrants, by Legal Status: 15 States Ranked by Size of the Labor Force.
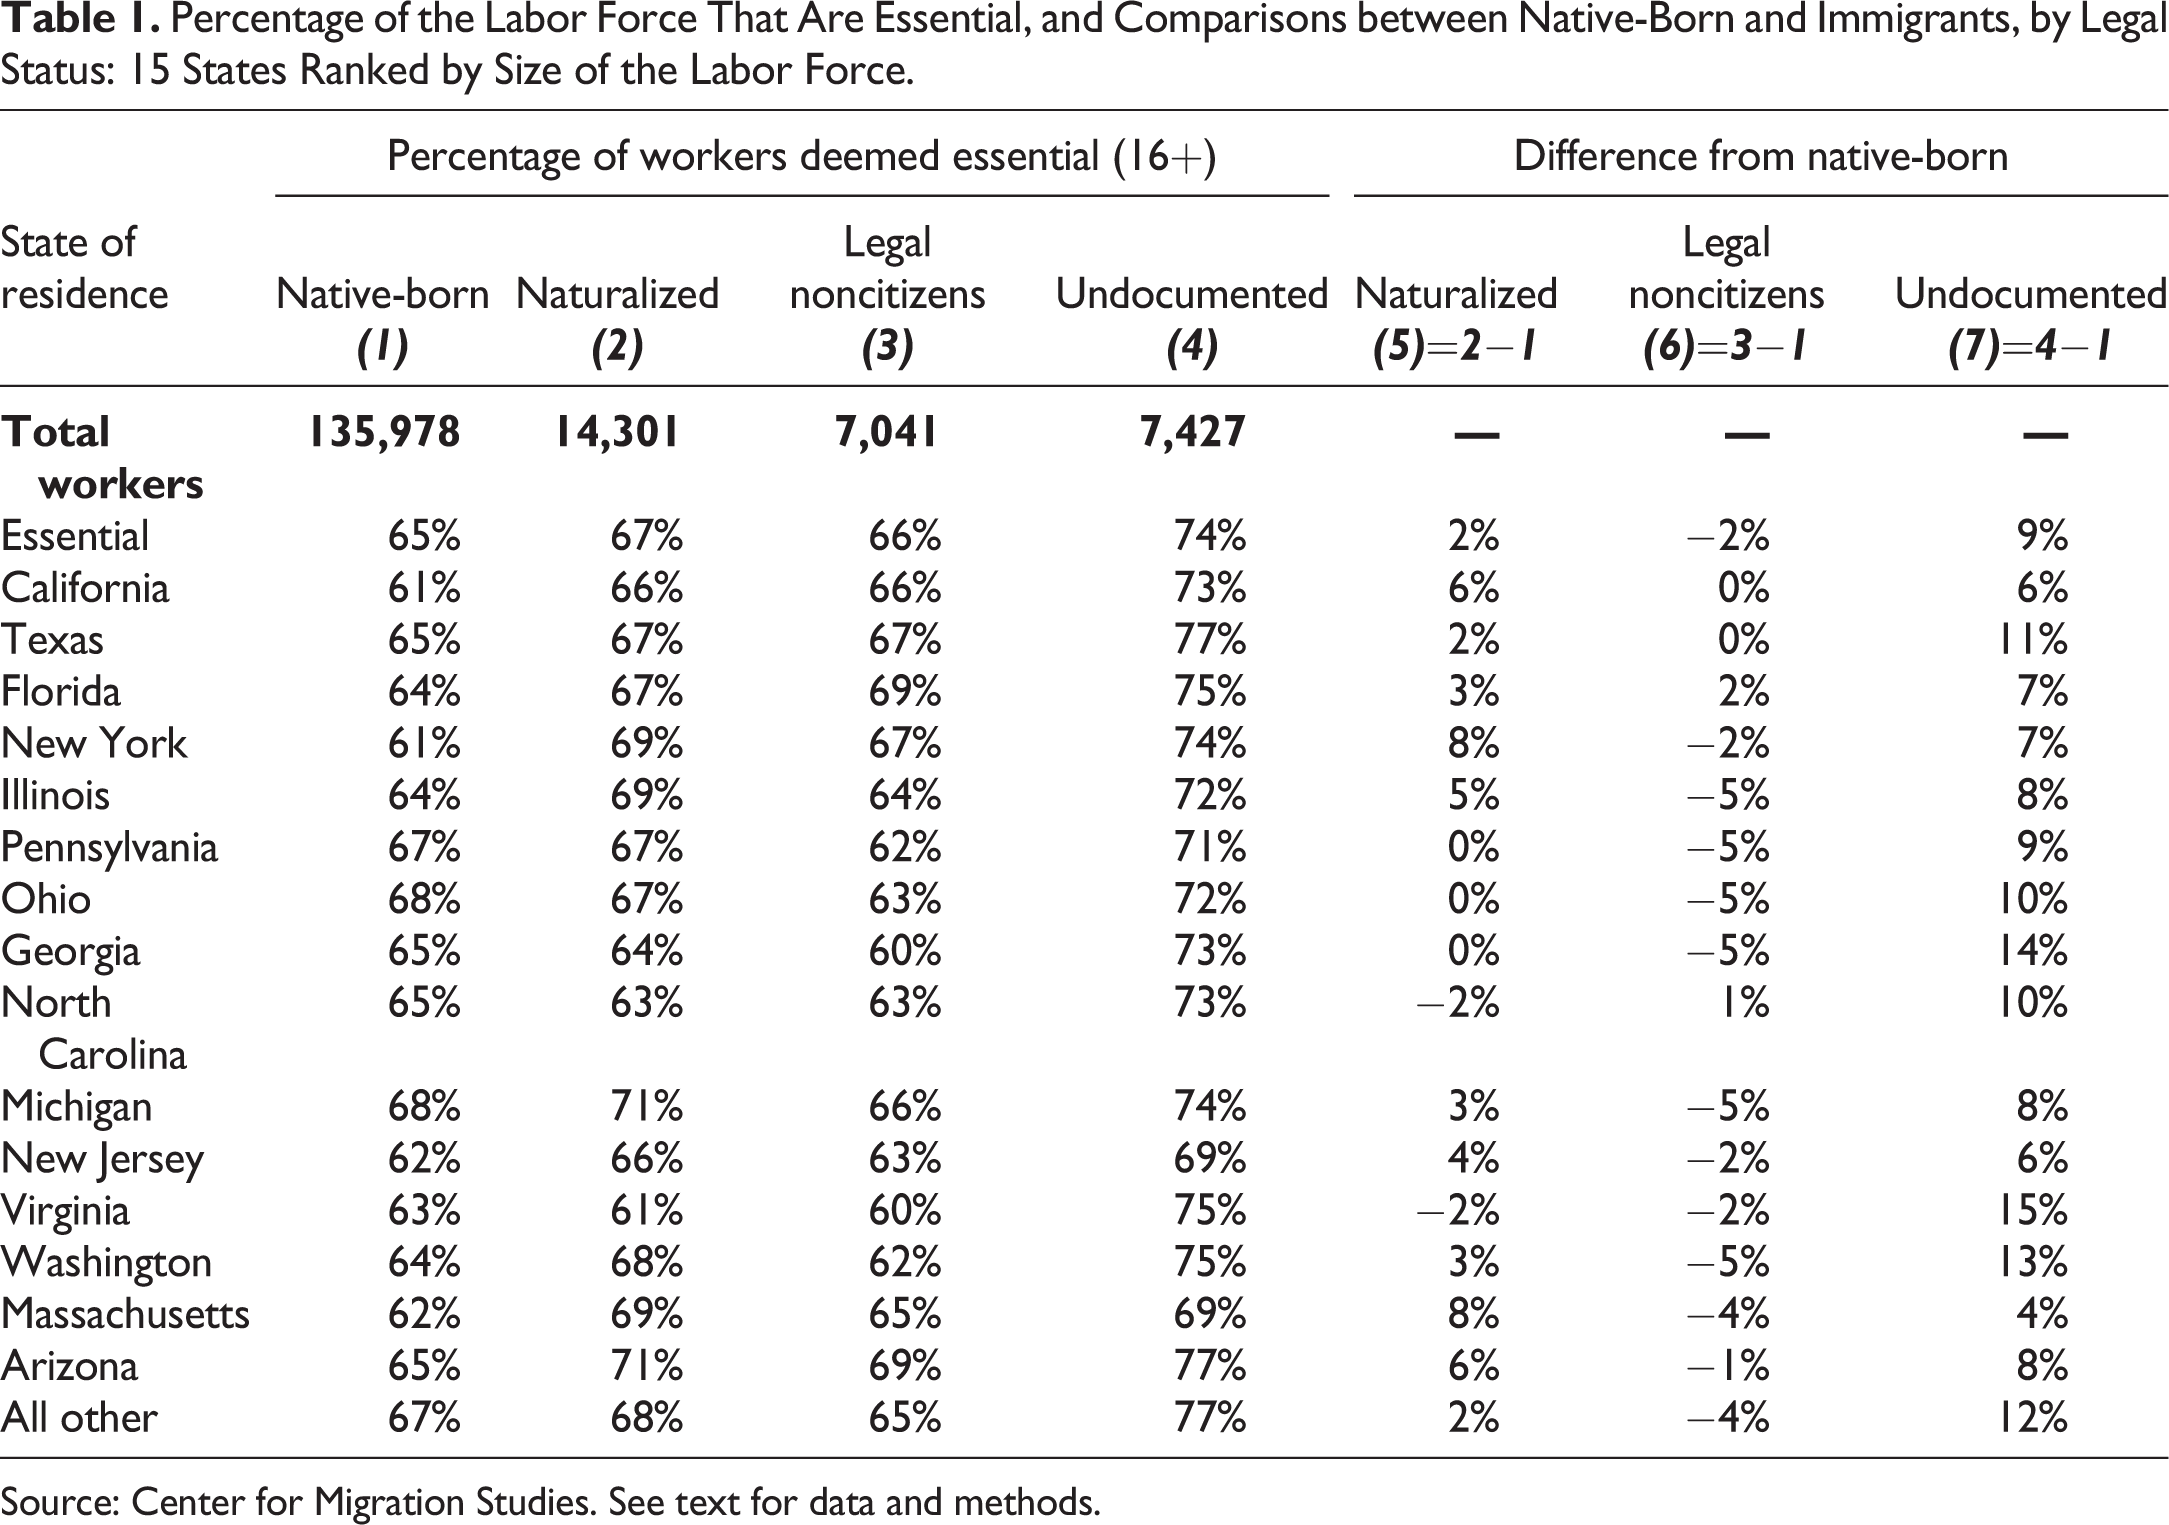
Source: Center for Migration Studies. See text for data and methods.
Table 2 shows the percentages of immigrant essential workers by status in the labor force in the ten largest US metropolitan statistical areas (MSAs). 6 For the United States overall, the naturalized and legally resident populations have about the same percentages of essential workers as native workers. In these MSAs, however, the percentages of undocumented and naturalized essential workers exceed that of the native-born by about 12 and 6 percent, respectively.
Percentage of the Labor Force That Are Essential, by Legal Status: Top 10 Metropolitan Areas by Population (numbers in thousands; ranked by figures in Column 1).
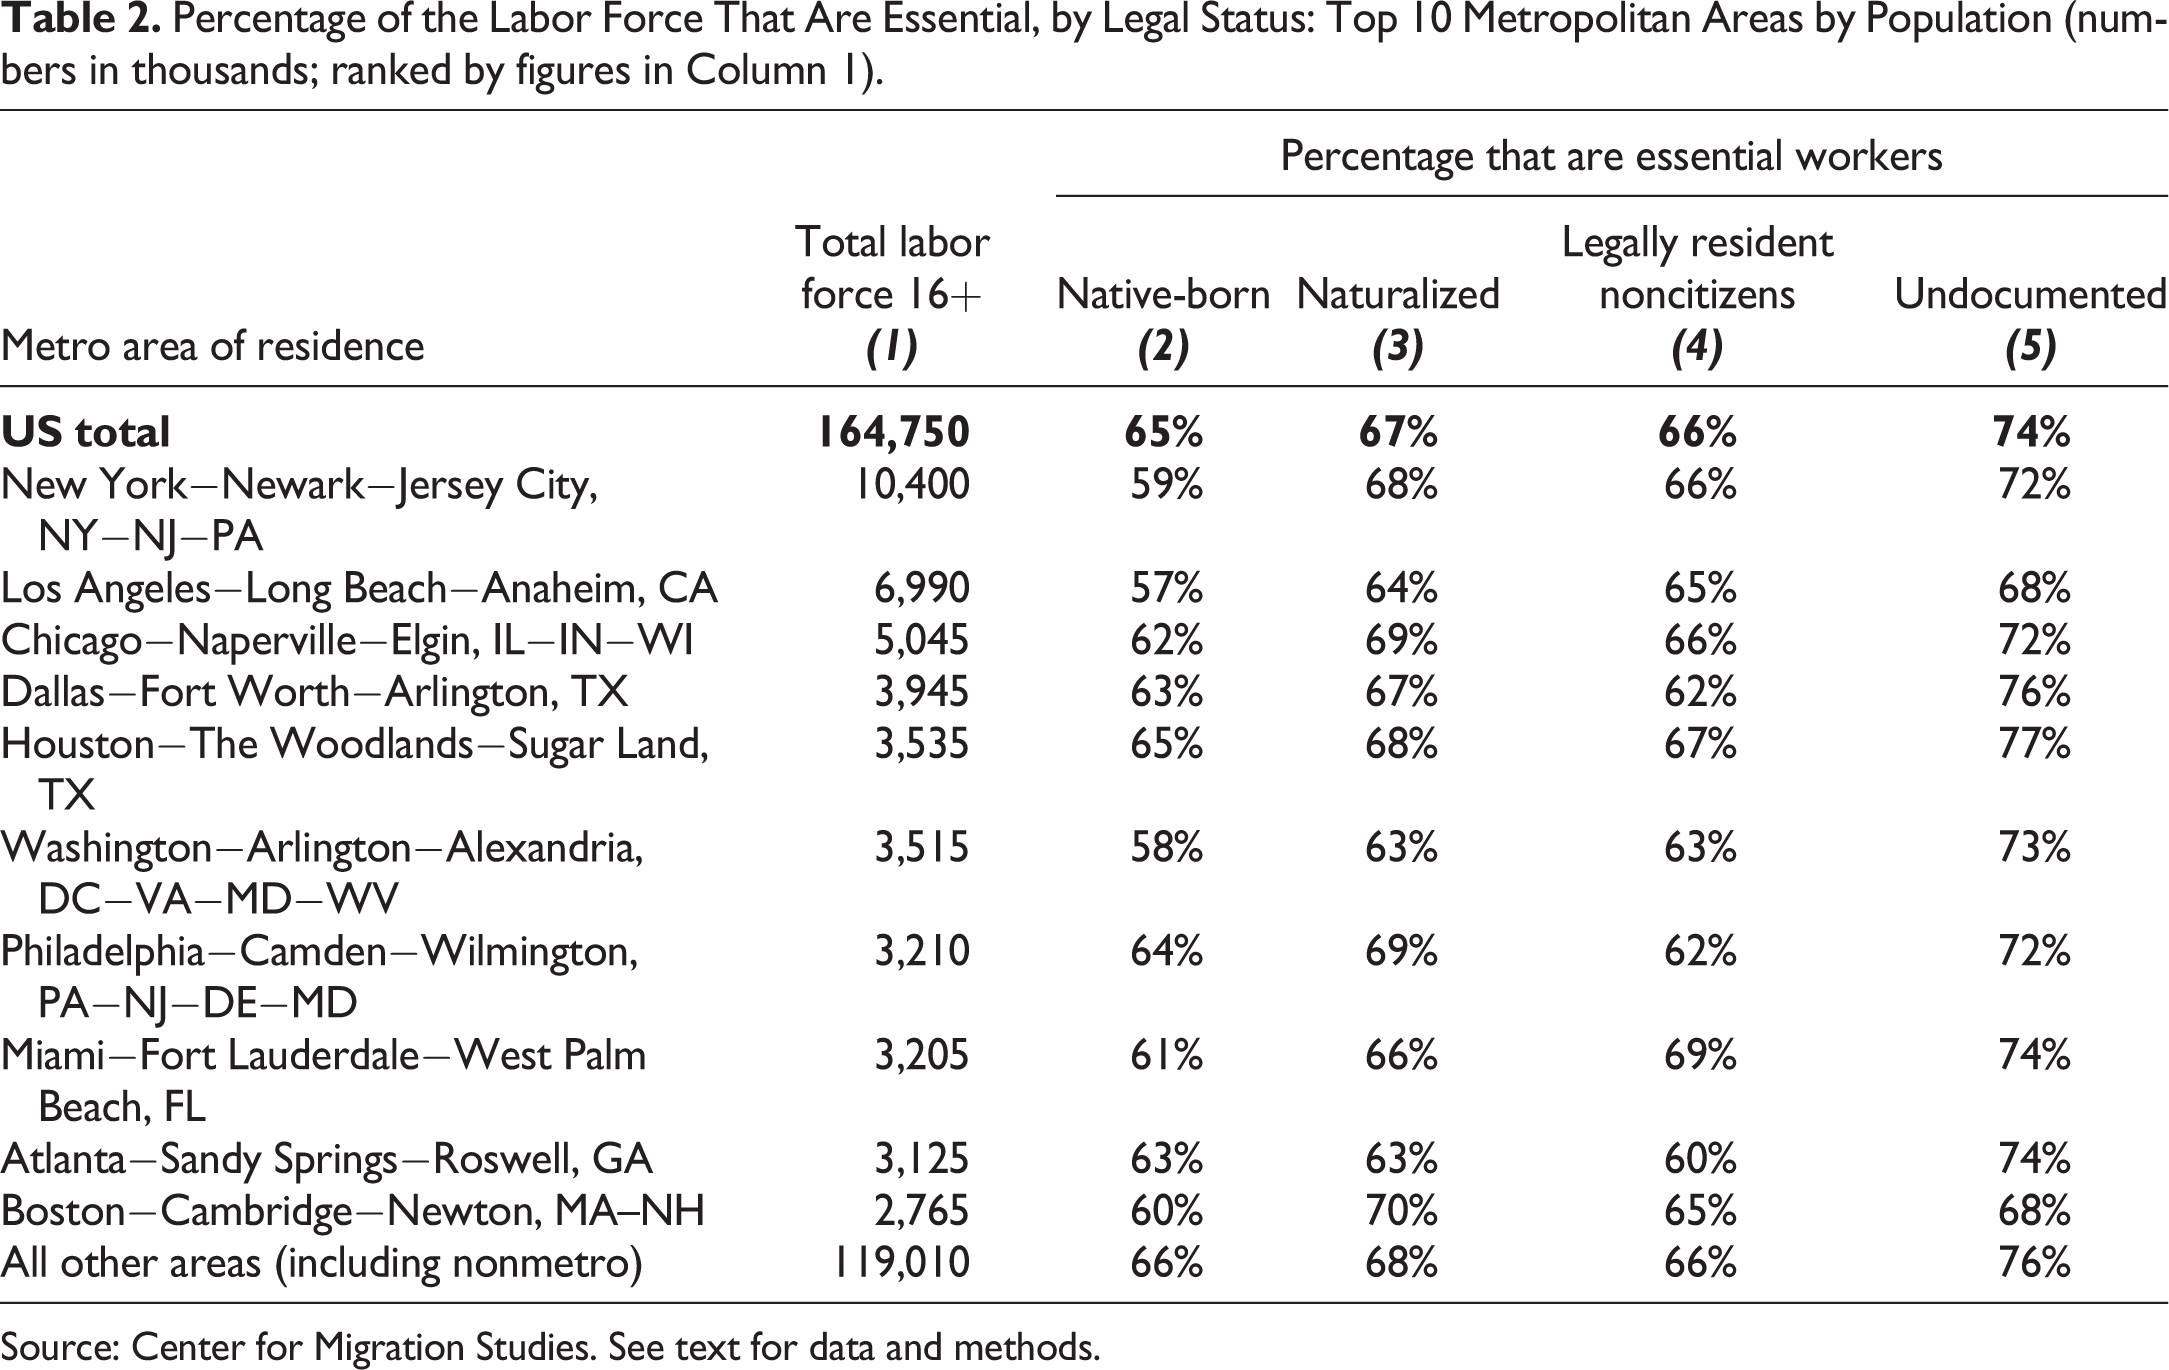
Source: Center for Migration Studies. See text for data and methods.
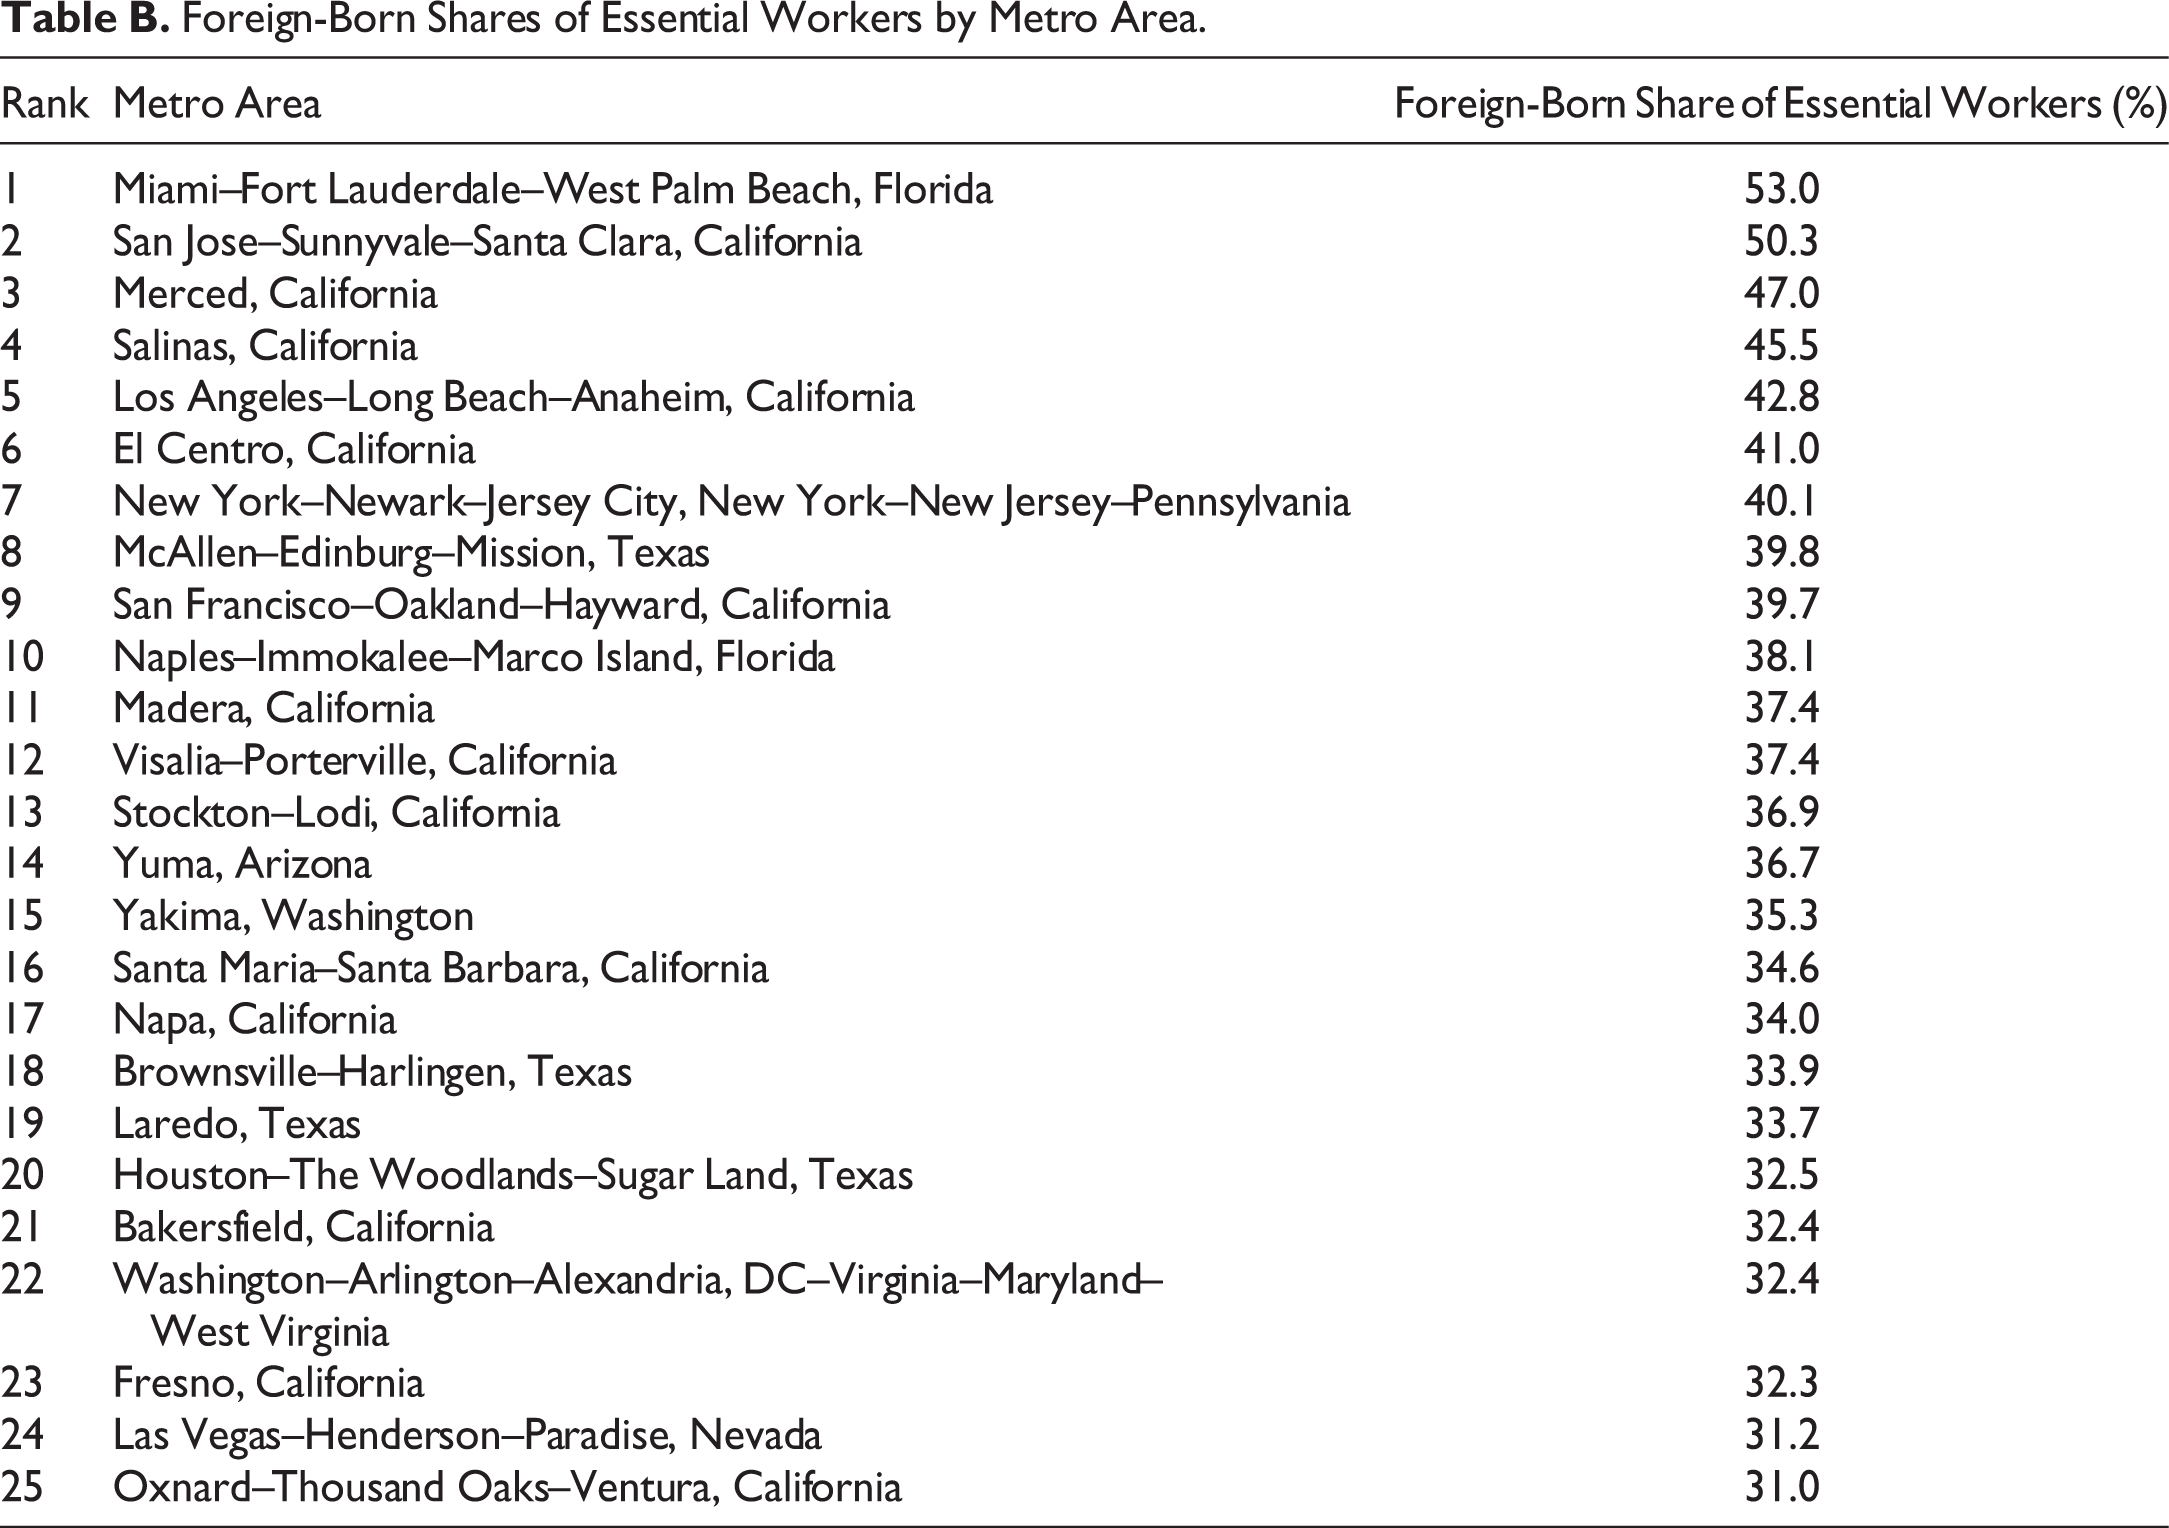
The foreign-born represent more than 50 percent of essential workers in the Miami−Fort Lauderdale−West Palm Beach and the San Jose−Sunnyvale−Santa Clara MSAs, and more than 40 percent in seven MSAs (Appendix, Table B).
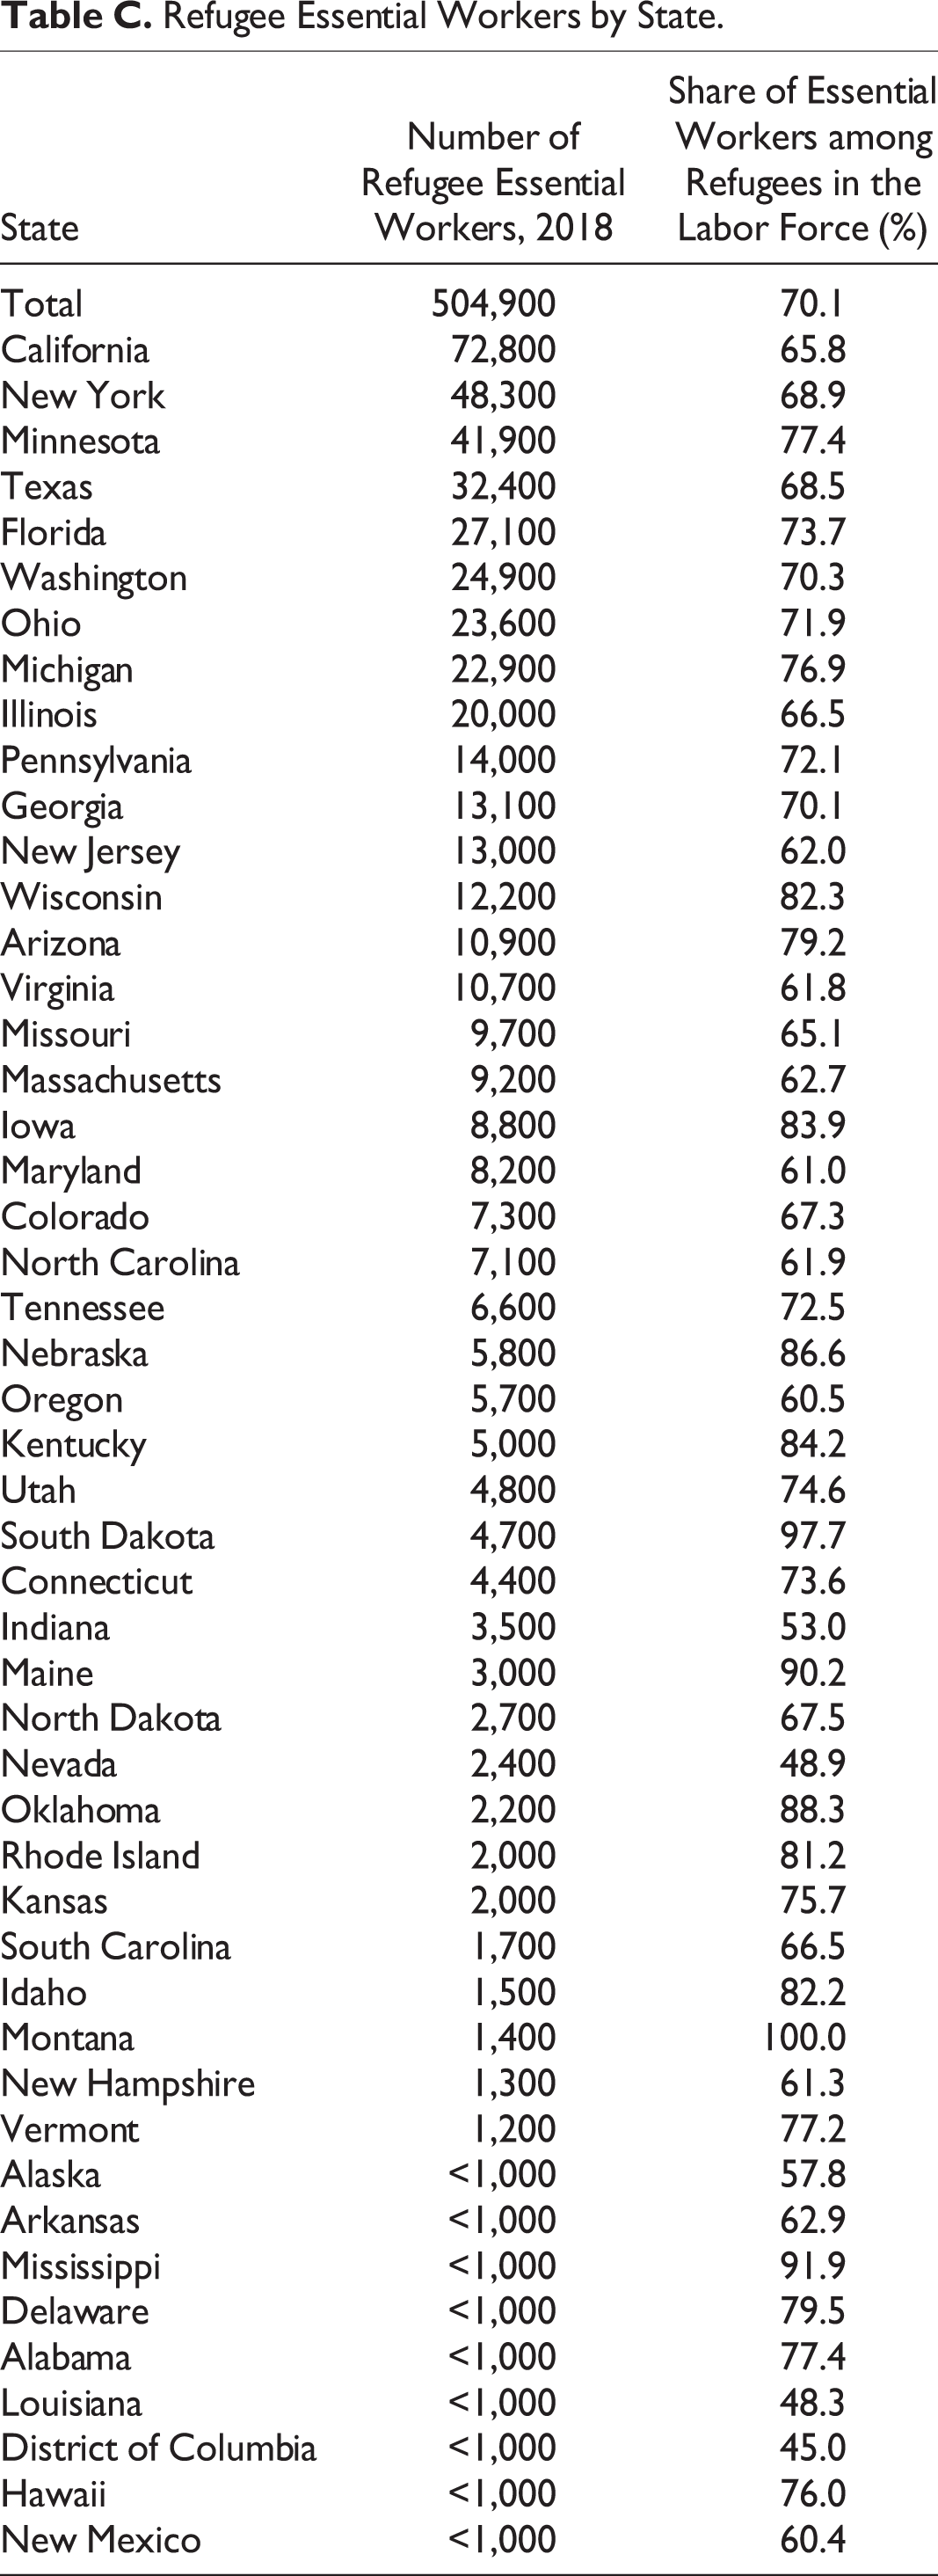
Prior to the pandemic, the Trump administration set the lowest ceiling for US refugee admissions in the program’s 40-year history. Since then, the administration has virtually shut down the program, despite the immense achievements and contributions of refugees to the country (Kerwin 2018). Table 3 shows that 70 percent of persons that entered the United States as refugees 7 are essential workers. The percentages of refugee essential workers that live in rental housing, have incomes lower than the poverty level, and take public transportation surpass those of the native-born. A remarkable 78 percent of Black refugees are essential workers. Table C in the appendix sets forth the number and share of refugee essential workers by state.
Percentage of Refugees That Are Essential Workers Compared to Native-Born and Foreign-Born Workers (ages 16 and older): Selected Characteristics (in thousands).
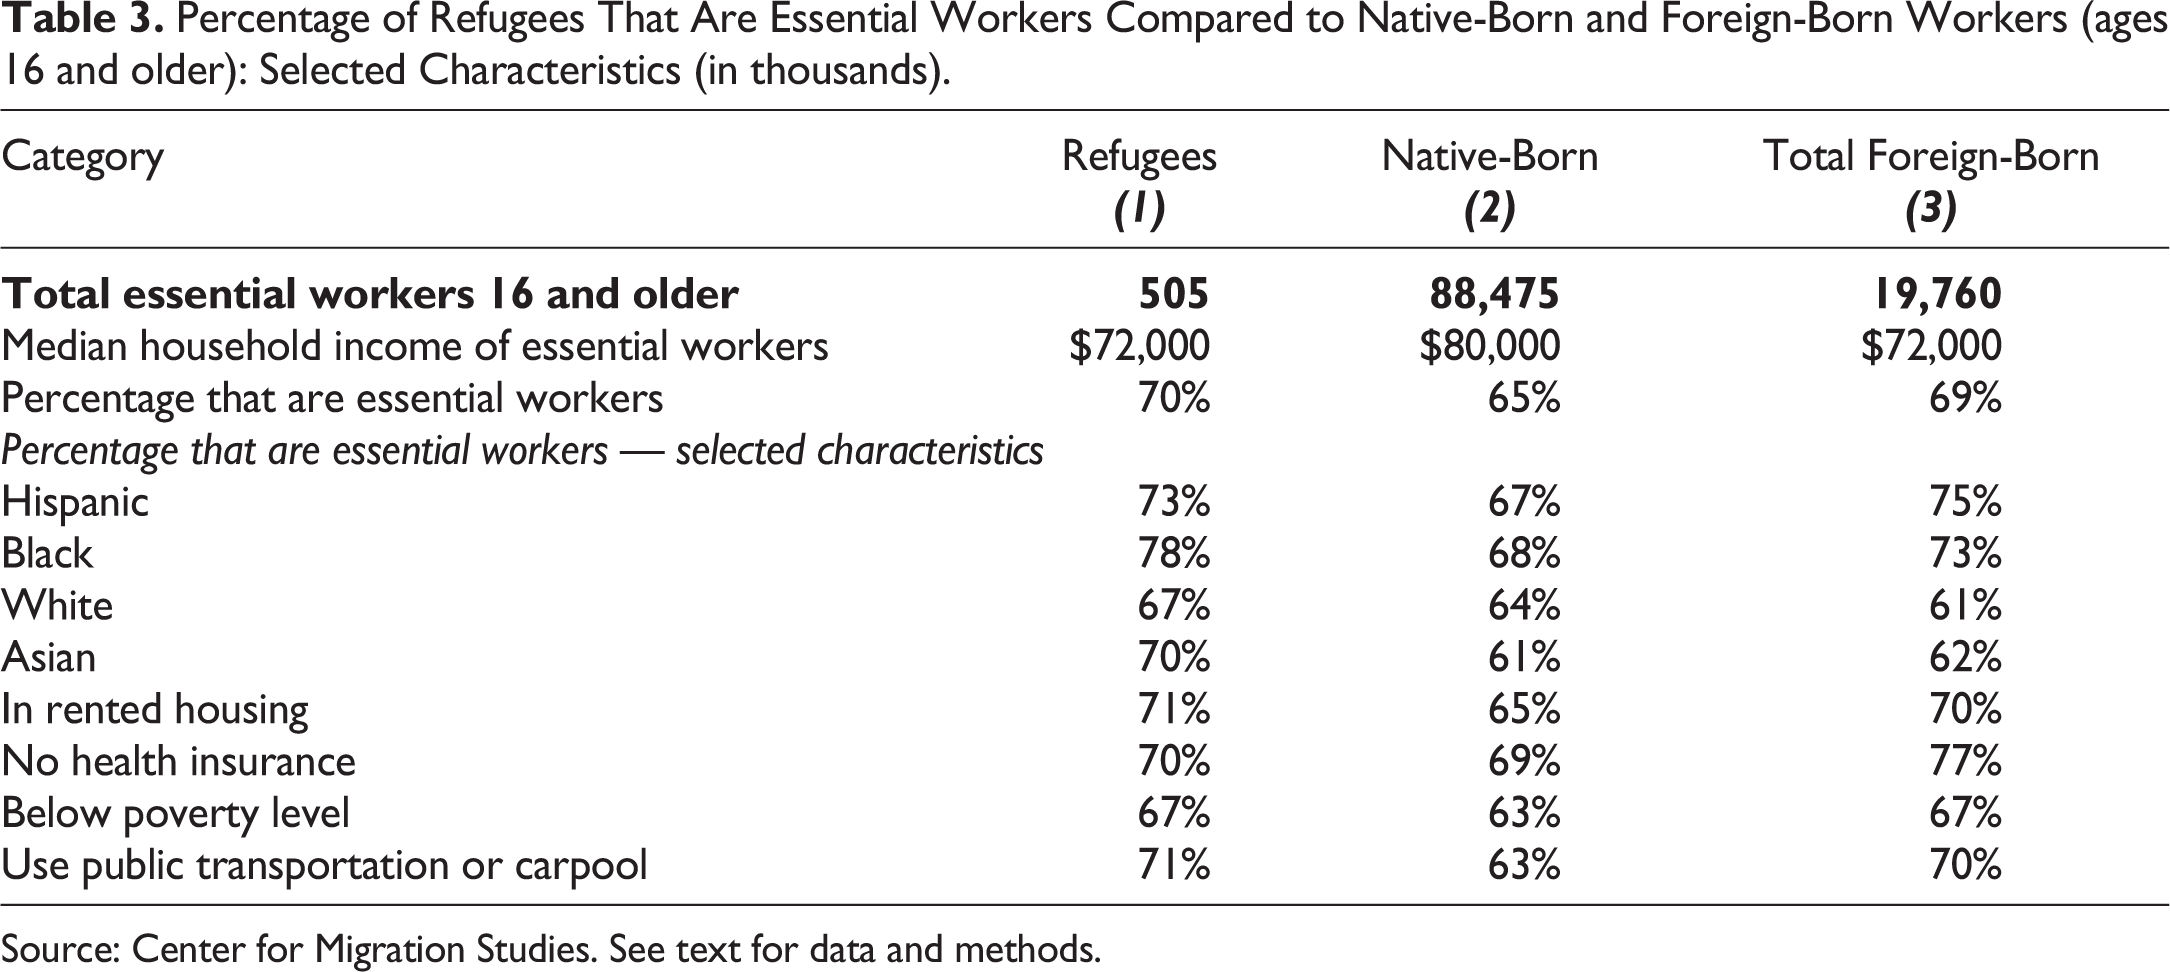
Source: Center for Migration Studies. See text for data and methods.
The CARES Act provided tax rebates of up to $1,200 for adults with incomes of less than $99,000, up to $2,400 for joint filers earning less than $198,000, and $500 per child younger than 17 years old (DOT 2020). The rebate was reduced by $5 for each additional $100 of an adult’s income that exceeded certain thresholds. 8 As stated, the Act requires taxpayers to have filed their returns with a valid Social Security number. Both spouses filing a joint return must have used a valid Social Security number to secure a rebate. If not, the US citizen children in these families could not obtain the $500 in relief. 9 A US citizen with an undocumented spouse, however, could file an individual return and secure benefits for eligible household members. Combined, these requirements mostly excluded members of mixed-status families. In 2018, 18.3 million persons lived in 3.8 million mixed-status households (Kerwin et al. 2020).
Table 4 shows estimates of the number of essential workers (6.2 million) not eligible for payments under the CARES Act. 10 In addition, a total of 3.8 million US citizen children (younger than age 17) of essential workers lived in households with at least one undocumented parent. The data show that these workers and families badly need the financial support. Perhaps the most startling statistic in Table 4 is the 1.2 million US citizens younger than age 17 living in mixed-status households below the poverty level, most of whom did not qualify for relief.
Essential Workers (and US citizen children) Not Eligible for CARES Payment Because of Their Immigration Status or the Immigration Status of a Household Member (numbers in thousands).
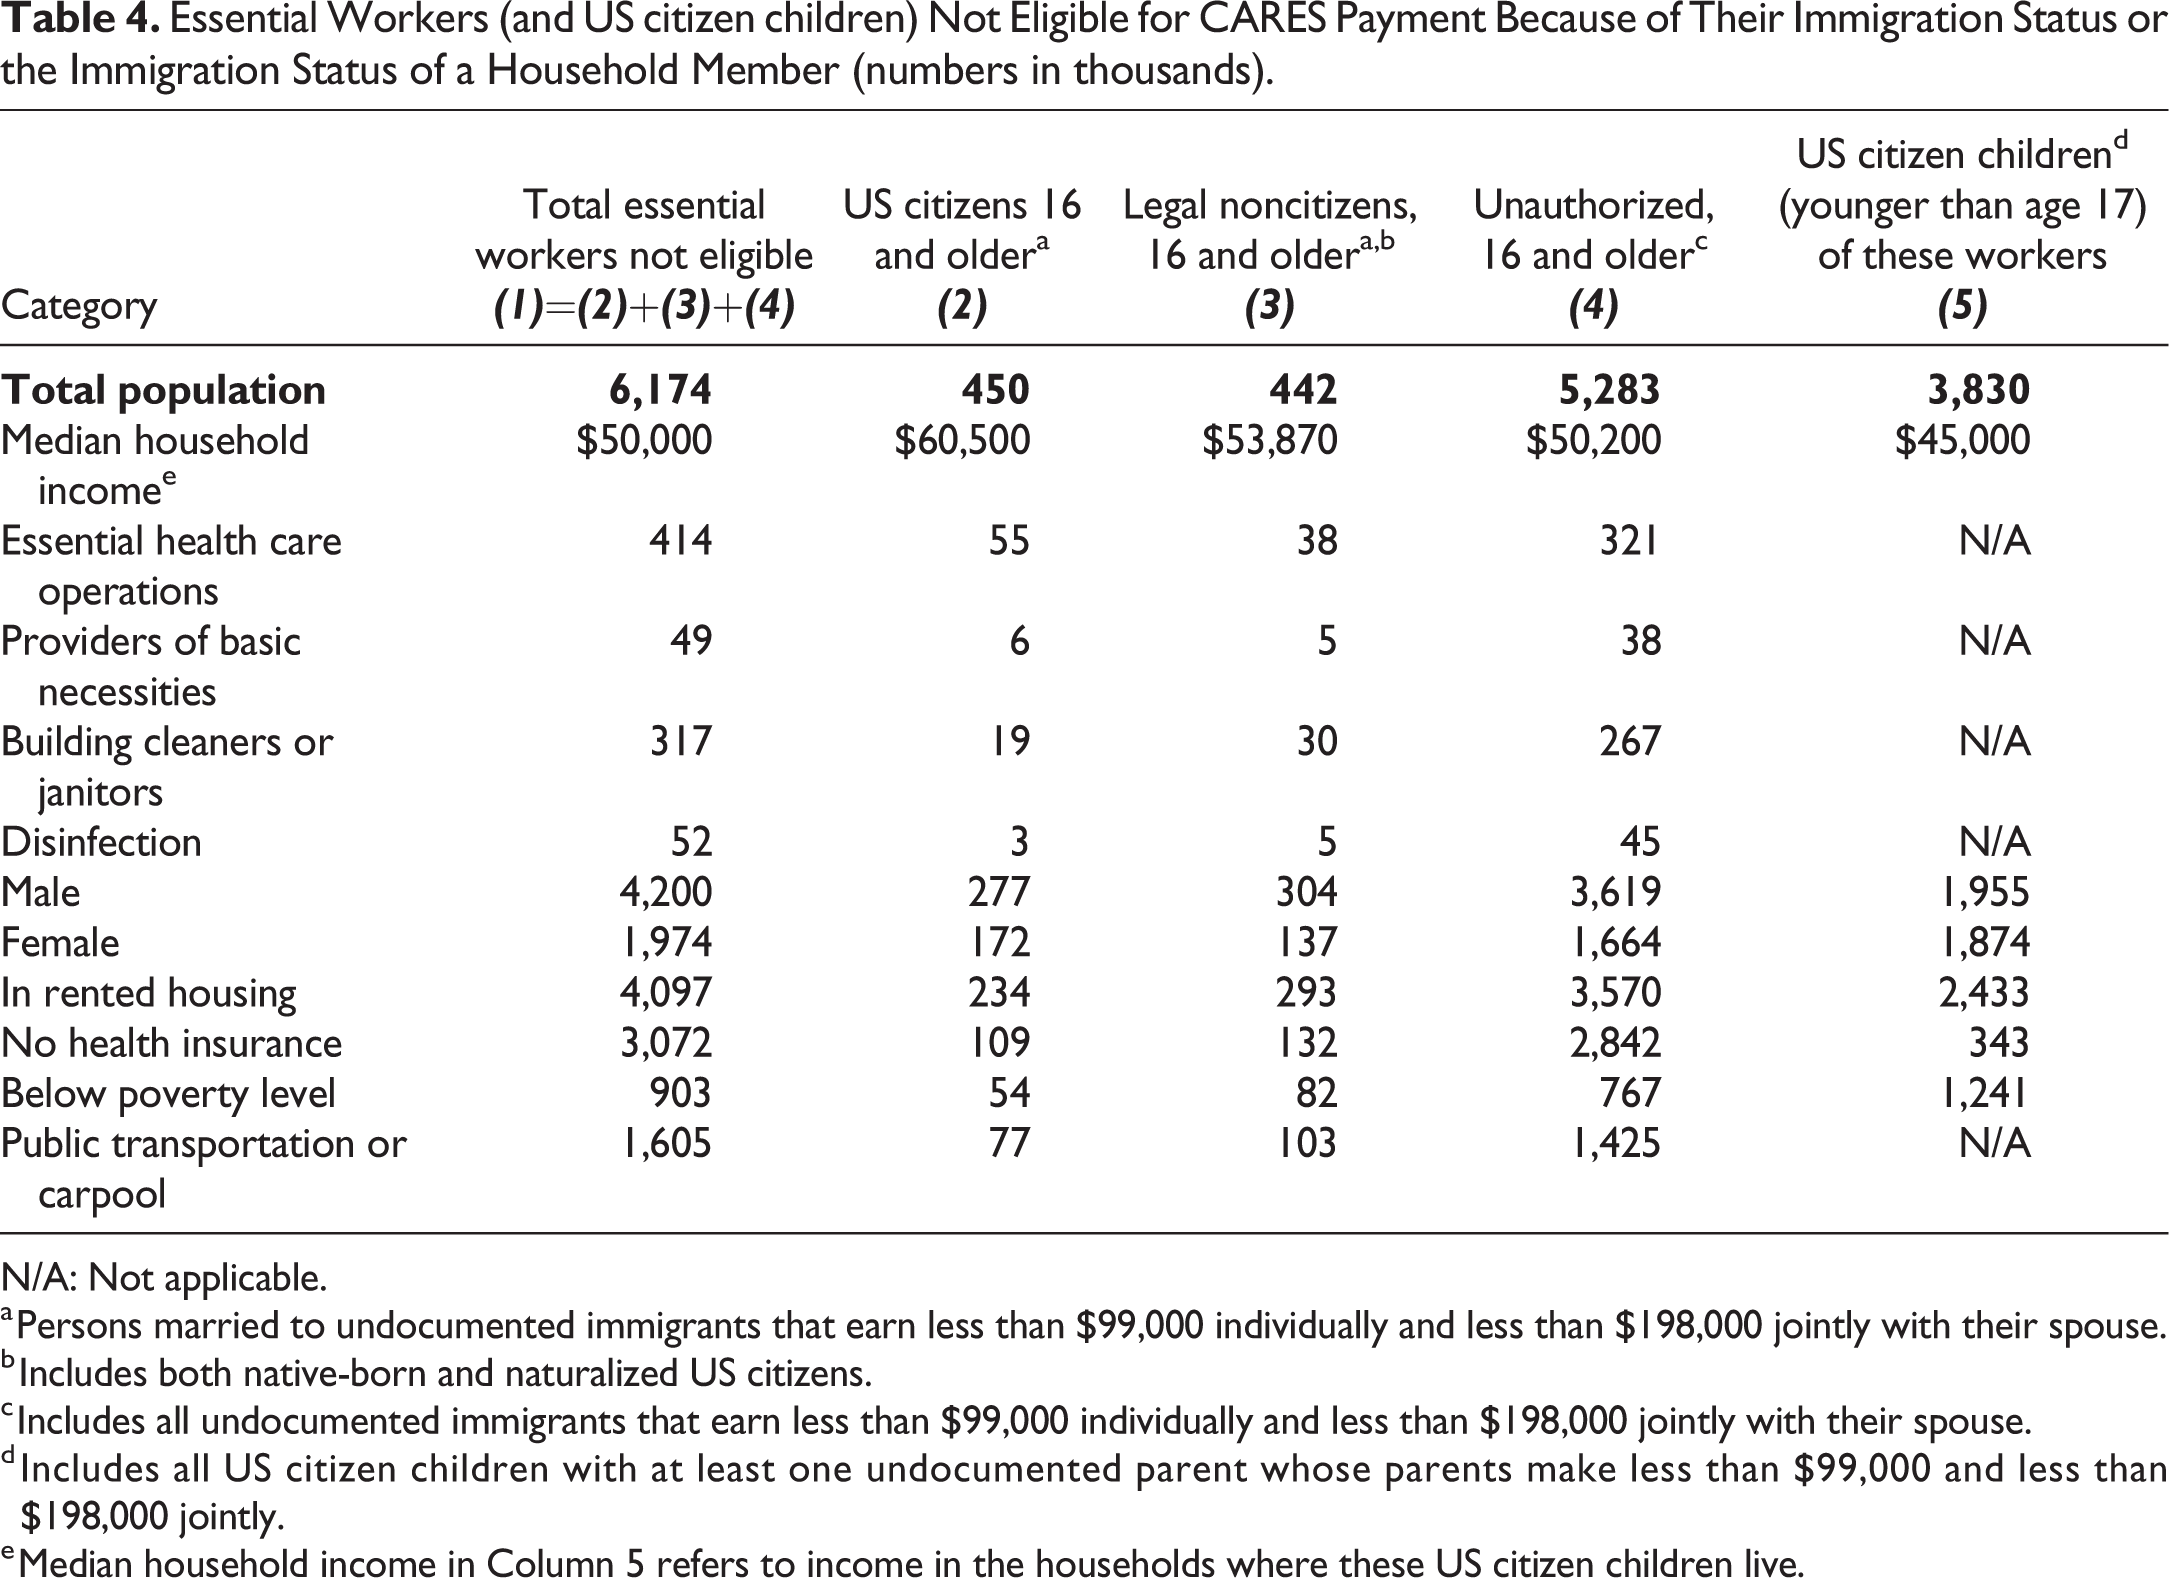
N/A: Not applicable.
a Persons married to undocumented immigrants that earn less than $99,000 individually and less than $198,000 jointly with their spouse.
b Includes both native-born and naturalized US citizens.
c Includes all undocumented immigrants that earn less than $99,000 individually and less than $198,000 jointly with their spouse.
d Includes all US citizen children with at least one undocumented parent whose parents make less than $99,000 and less than $198,000 jointly.
e Median household income in Column 5 refers to income in the households where these US citizen children live.
Many immigrant essential workers face heightened risks. The 4.7 million without health insurance are in a particularly precarious position given the risk of contracting the virus at work. In addition, many of the 9.3 million living in rental units will be subject to eviction when short-term federal, state, and local moratoria on evictions expire (NHLP 2020; NLIHC 2020).
Table 5 shows that immigrant essential workers also must contend with a factor that puts them and their families at greater risk of contracting COVID-19: overcrowding. The percentage of immigrant essential workers that live in overcrowded households is almost three times higher for naturalized workers than for native-born workers. The percentage of legally resident essential workers in overcrowded households is more than four times that of native-born workers, and the percentage of undocumented essential workers in overcrowded households is more than six times that of the native-born. Conversely, the percentage of essential workers living in overcrowded households drops considerably from undocumented, to legally resident, to naturalized workers. 11
Percentage of Essential Workers (ages 16 and older) That Live in Overcrowdeda Households, by Legal Status and Selected Characteristics.
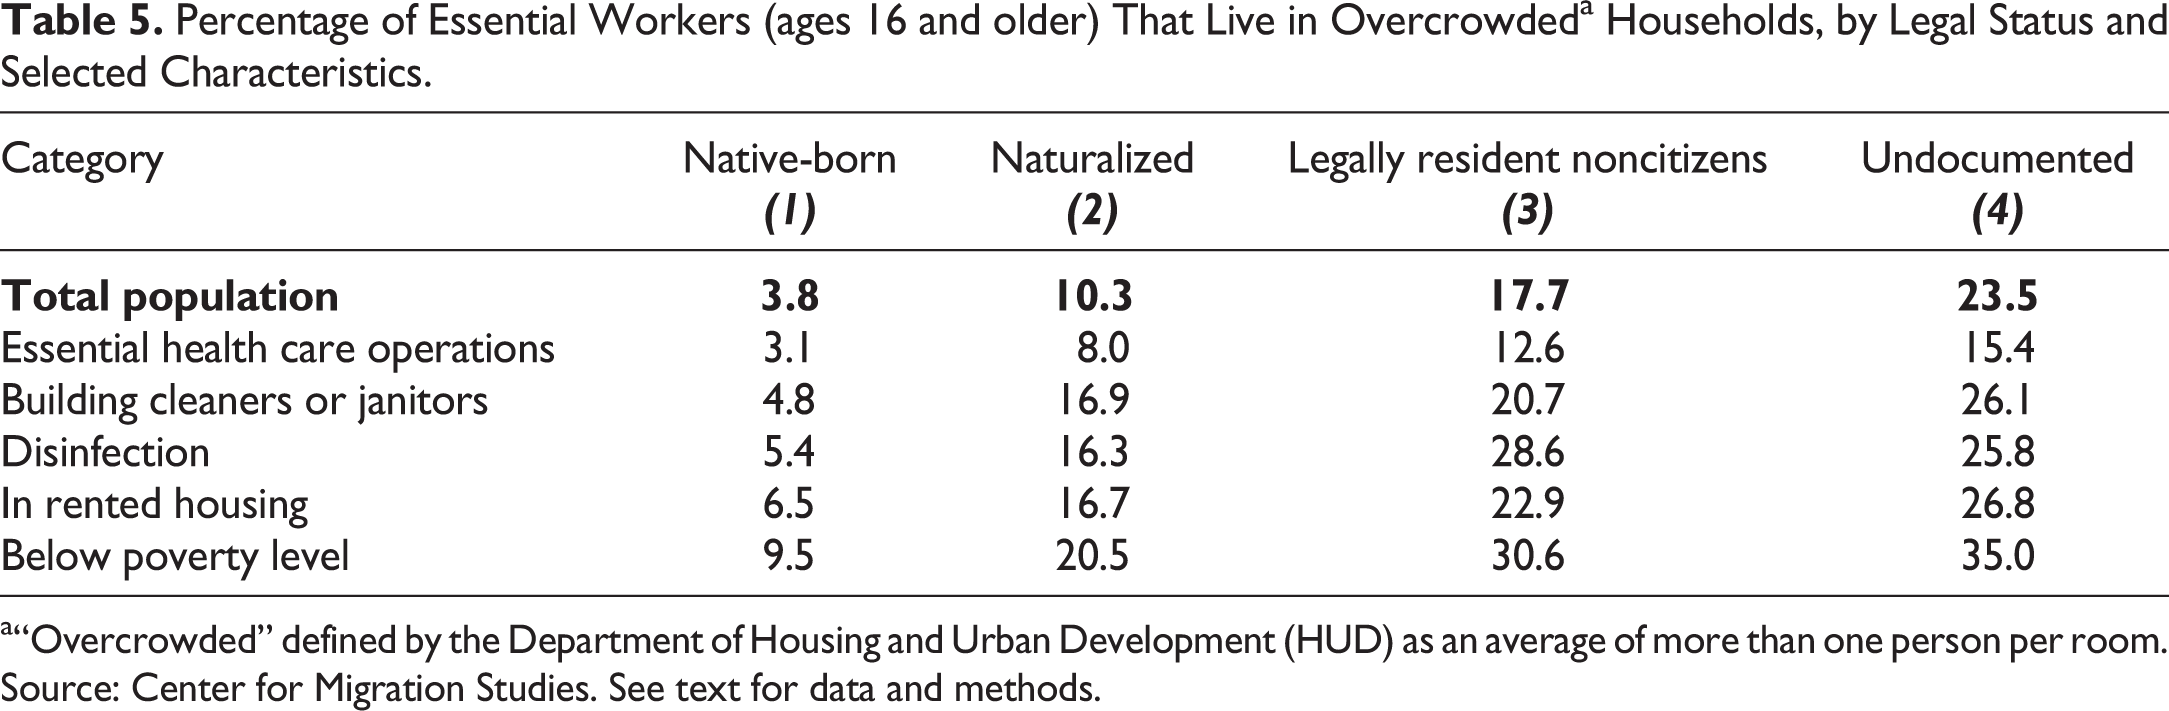
a“Overcrowded” defined by the Department of Housing and Urban Development (HUD) as an average of more than one person per room.
Source: Center for Migration Studies. See text for data and methods.
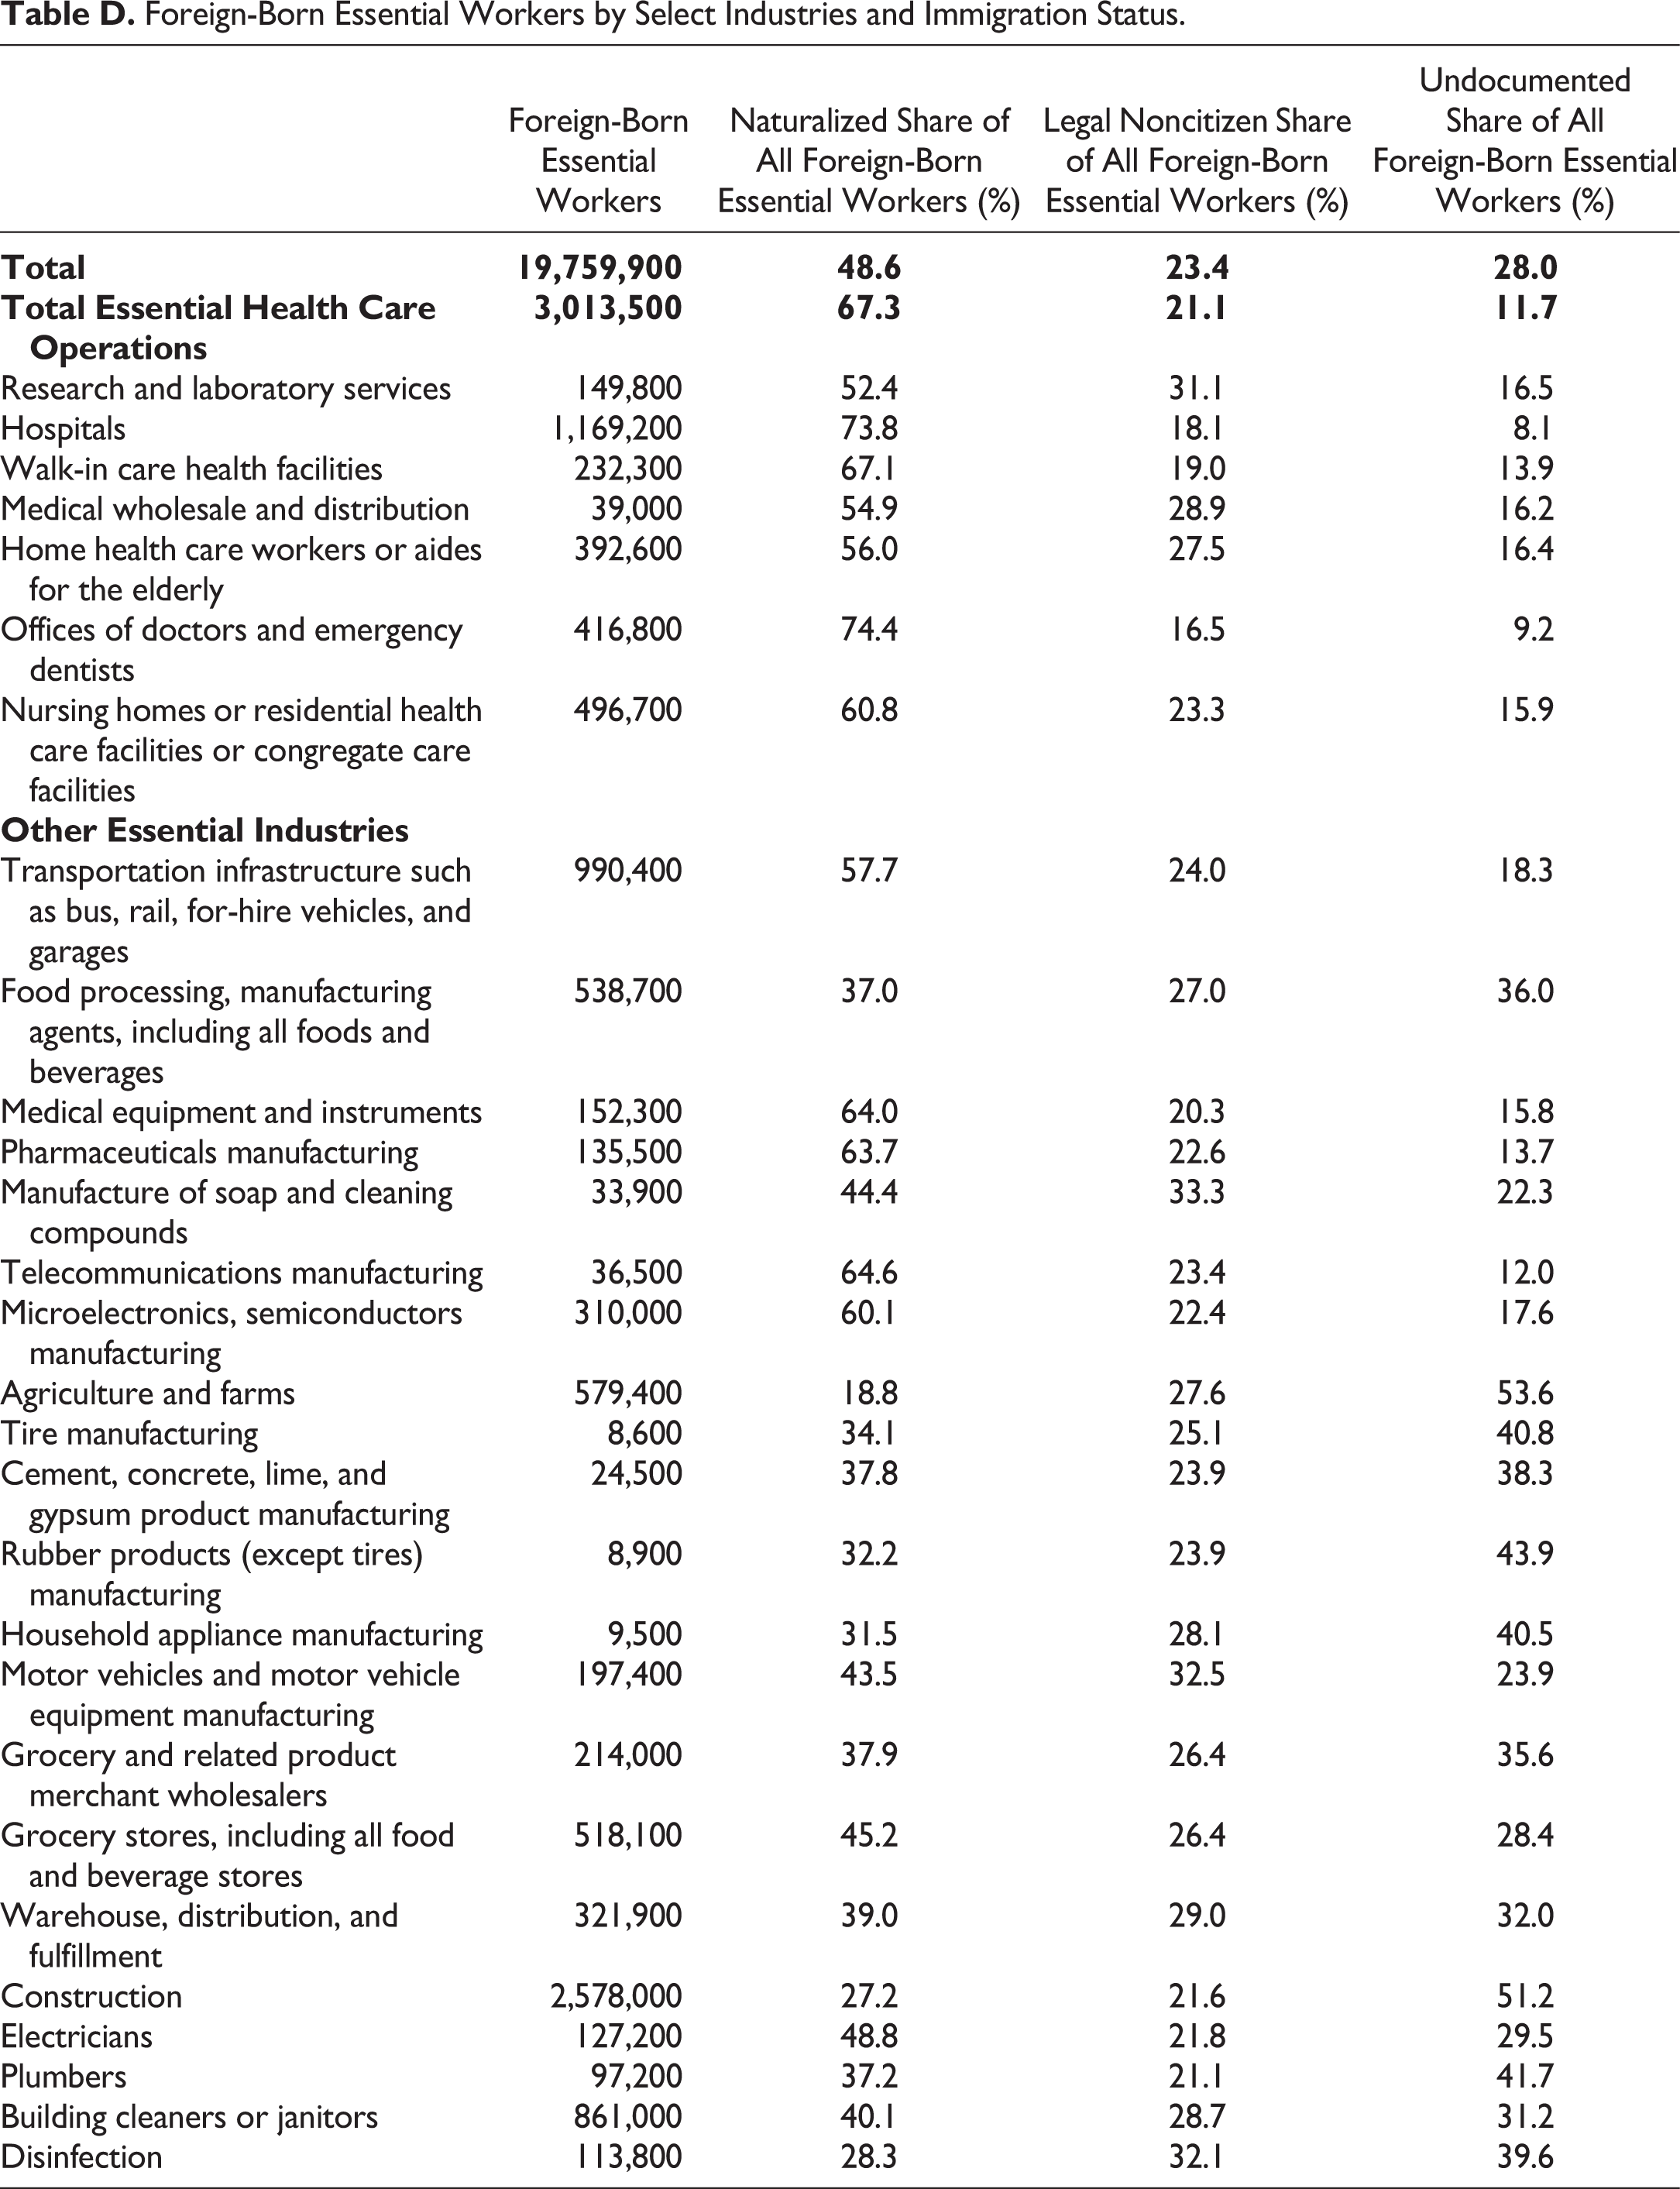
Data on immigrant essential workers by sector put into stark relief the contributions of immigrants to the nation’s critical infrastructure and well-being during the pandemic. Immigrants comprise: 16 percent of US health care sector workers,
12
and 33 percent of health care sector workers in New York State, 32 percent in California, 31 percent in New Jersey, 28 percent in Florida, 25 percent in Nevada and Maryland, 24 percent in Hawaii, 23 percent in Massachusetts, and 19 percent in Texas. 26 percent of home health care workers and aides for the elderly. 22 percent of workers in scientific research and laboratories. 24 percent of workers in medical equipment manufacturing and 25 percent in pharmaceuticals manufacturing (i.e., businesses that supply the health care sector). 28 percent of janitors and building cleaners, 23 percent of workers in disinfection, and 23 percent of those who manufacture soap and cleaning compounds.
13
26 percent of construction workers. 23 percent of US transportation industry workers, including buses, rails, water transport, and vehicles for hire, but excluding airlines. 28 percent of workers in telecommunications equipment manufacturing and 31 percent in computer and microelectronic manufacturing. 14 percent of workers in automobile and automobile parts manufacturing. 21 percent of workers in warehousing, distribution, and fulfillment (i.e., who handle customer orders for e-commerce businesses). 31 percent of US agricultural employees. 26 percent of workers in food and beverage manufacturing and processing. 26 percent of grocery wholesalers, and 17 percent in retail grocery and other food and beverage stores (Appendix, Tables E and F).
The 10 essential industries that employ the highest numbers of naturalized citizens are hospitals (862,400 workers), restaurants (741,700), construction (701,600), transportation (571,300), building cleaners (345,400), government (330,200), banks (325,100), doctors’ and dentists’ offices (309,900), nursing homes (302,100), and real estate (255,900) (Appendix, Table F). Naturalized citizens make up 67 percent of the foreign-born working in health care, including 74 percent of those working in hospitals and 74 percent of those working in doctors’ and dentists’ offices (Appendix, Table D). Many of these essential workers are on the front lines with coronavirus patients.
Undocumented immigrants work — by essential industry — in construction (1,320,500), restaurants (846,100), agriculture and farms (310,800), landscaping (277,600), building cleaners (268,400), food processing and manufacturing (193,900), transportation (181,000), grocery stores (147,300), hotels and other accommodations (137,000), and warehousing, distribution, and fulfillment of online orders (103,000) (Appendix, Table F). Undocumented immigrants comprise 54 percent of foreign-born workers in agriculture and farms, 51 percent of foreign-born workers in construction, and 40 percent in disinfection (Appendix, Table D). All of these workers will be vital to the ability of Americans and the US economy to rebound from the pandemic.
Table 6 shows the numbers of foreign-born essential workers, including the undocumented, in cities with large meatpacking or poultry-processing facilities. As discussed, the workers in these essential industries have been particularly hard hit by COVID-19.
Percentage of Noncitizen Essential Workers in Regions with Meatpacking or Poultry-Processing Facilities with High COVID-19 Infection Rates. 14
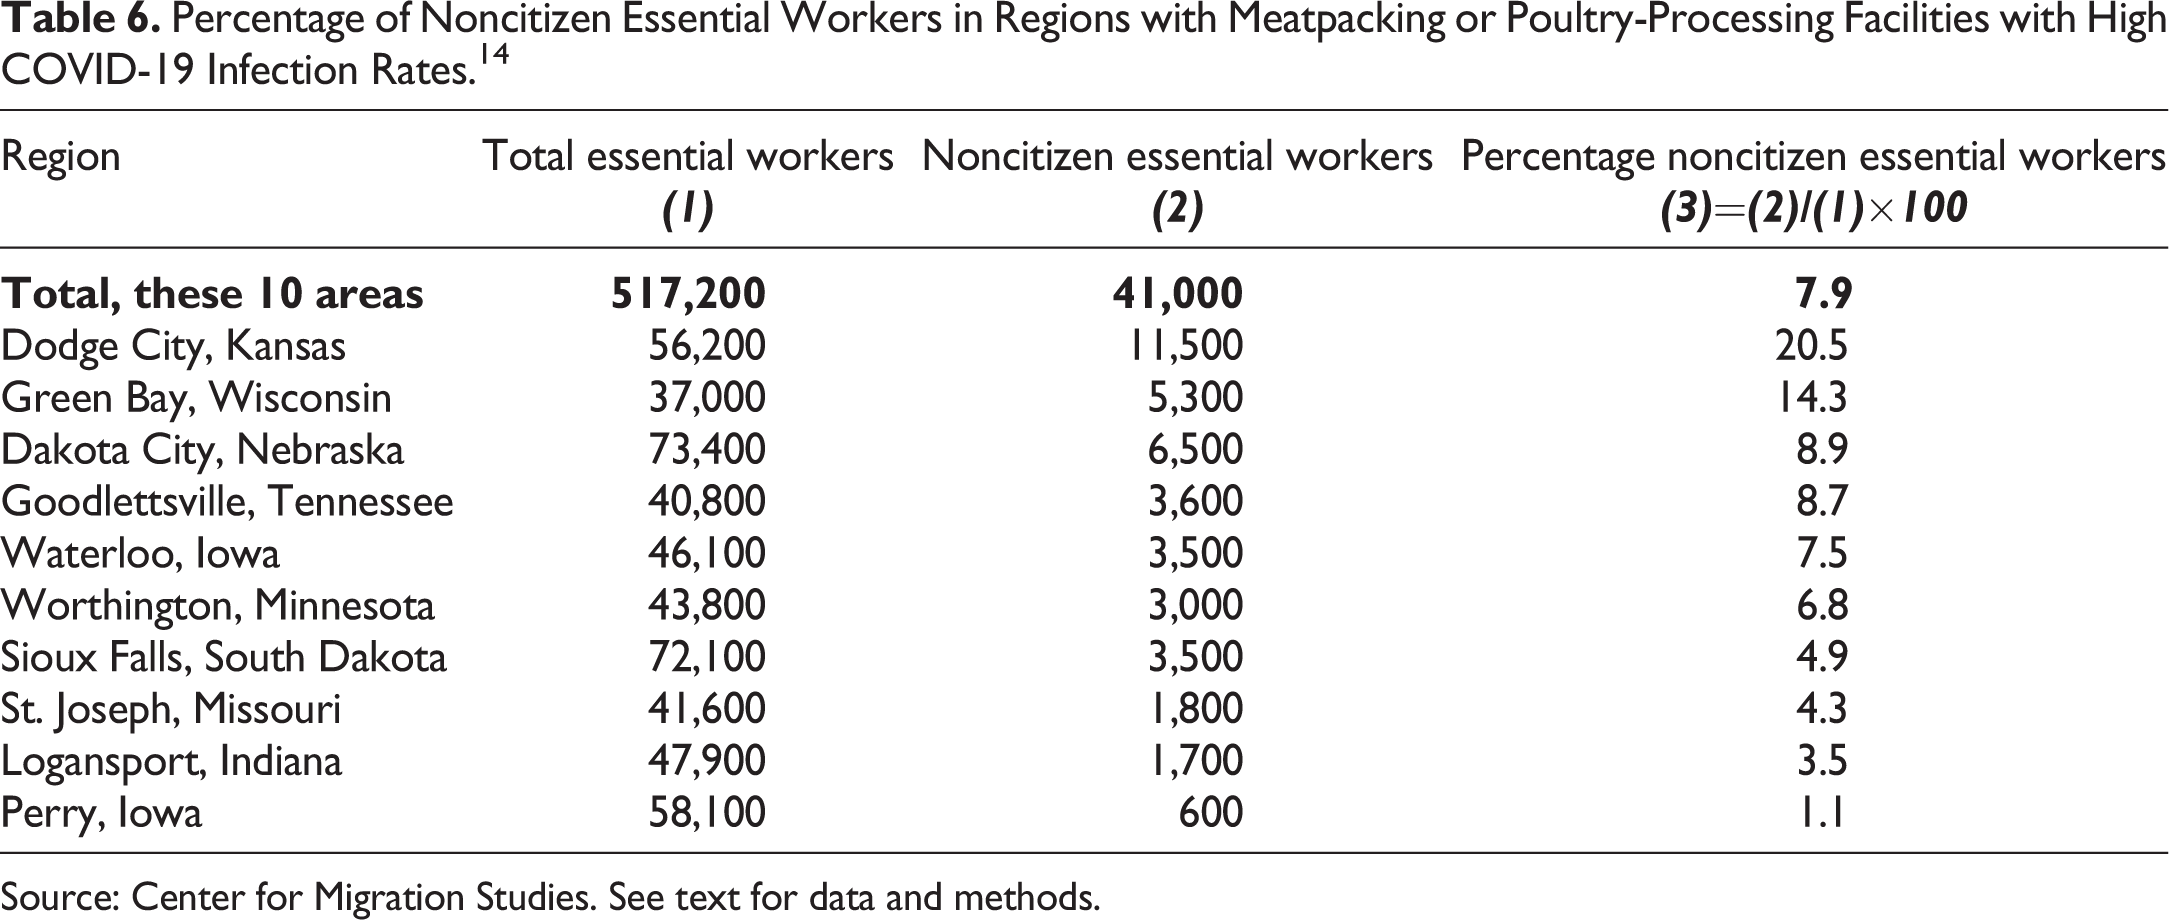
Source: Center for Migration Studies. See text for data and methods.
III. Policy Recommendations
The COVID-19 pandemic has created the clearest, most compelling view to date of the indispensable contributions of immigrants to the nation’s well-being. Immigrants are working — often at great risk to their health and lives — to keep Americans safe, healthy, fed, and poised for economic recovery. Yet, paradoxically, large numbers also remain on the margins of US society. While nearly three-quarters of undocumented immigrants work in sectors officially deemed essential to the nation’s “critical infrastructure,” they can still lose their jobs, 15 and be detained and deported. Foreign-born essential workers face a high risk of infection, but workplace protections have been relaxed during the pandemic. Several million have been denied federal aid and relief, and high numbers opt against seeking health care and benefits for fear that if they do, they or a family member will lose the ability to obtain permanent status under the public charge rule. The “essential” designation, however, also offers a kind of belated recognition of their importance to the country, as well as a level of protection and kind of gray status that allow many undocumented persons to transit to and from work with less fear of deportation.
The pandemic — which will continue to ravage the nation and world in the near future — has exposed and exacerbated a range of social inequalities and injustices that need to be broadly addressed. This article offers a more modest proposal: that Congress and the president align US legal immigration policies with the manifest importance of these workers to the nation’s well-being. To that end, the administration should provide undocumented immigrant essential workers and, as necessary, their family members with temporary status, work authorization, and advanced parole for those who need to return home for a temporary period. The cases of essential workers in removal proceedings — who do not pose a legitimate public safety or national security risk — should be terminated. In addition, all essential workers should receive core protections and benefits from the society to which they are so generously contributing, often at risk of death, including COVID-19 relief payments and rigorously enforced labor and workplace safety standards. The administration should also withdraw the public charge rule in response to the hardship it has already caused to working-class persons, and the disincentive it creates during the pandemic to access public health benefits. In the longer term, Congress should pass legislation to create a path to permanent residence for US undocumented essential workers and their immediate family members.
IV. Methodology
To arrive at these estimates, CMS used the “essential critical infrastructure” categories set forth by DHS’s Cybersecurity and Infrastructure Security Agency (DHS-CISA 2020). DHS sets forth 17 categories of essential critical infrastructure workers. For simplicity and consistency with previous CMS reporting, CMS collapsed these 17 DHS categories into 14 categories that encompass all essential critical infrastructure workers. These 14 categories minimize overlap when matching US Census industry codes to DHS categories. 16
CMS matched each essential category with a 2017 industry code by the Census Bureau. In the few cases when essential infrastructure categories did not correspond to Census Bureau industry codes, CMS matched categories to 2018 Census Bureau occupational codes. 17 It then calculated the number of workers in each essential industry using 2018 1-year data from American Community Survey (ACS) data (in the Integrated Public Use Microdata Series [IPUMS]), weighted using individual weights calculated by the Census Bureau (Ruggles et al. 2020). CMS restricted the universe of employees to all individuals aged 16 and older.
Industry codes reflect the industries in which respondents to the ACS most recently performed their occupation. Likewise, occupation codes reflect most recent occupation. To restrict its estimates to individuals that were likely to be working in 2018, CMS included only individuals that were in the labor force at the time they responded to the ACS. Some individuals may work in more than one industry or occupation. For these individuals, the ACS records the industry or occupation in which they earned the most money.
Some industries (construction, restaurants, and hotels, for example) may include high numbers of workers in essential sectors who are not working during the pandemic. Some workers may be furloughed or may have lost their jobs since 2018. These estimates should, thus, be regarded as an upper bound on the number of workers in essential infrastructure by their immigration status as of 2018.
CMS used both industry and occupational codes from the ACS to derive its estimates. Since industry codes encompass many occupations, CMS corrected its estimates for double count.
To estimate the number of naturalized citizens, legal noncitizens, and undocumented immigrants, CMS used information collected in the ACS. The annual series of CMS estimates of undocumented residents includes all the detailed characteristics collected in the ACS (Ruggles et al. 2020). A description of CMS estimation procedures and a discussion of the plausibility of the estimates are provided in Warren (2020).
Footnotes
Appendix
Foreign-Born Essential Workers by State and Legal Status: 2018.
| State | Naturalized Citizens | Legal Foreign-Born | Undocumented | Foreign-Born Share of All Essential Workers (%) | Foreign-Born Share of Labor Force (%) |
|---|---|---|---|---|---|
| Total | 9,609,000 | 4,619,600 | 5,531,300 | 18.3 | 17.5 |
| Alabama | 23,300 | 14,700 | 30,100 | 4.5 | 4.5 |
| Alaska | 20,500 | 6,800 | 2,700 | 11.4 | 10.6 |
| Arizona | 183,400 | 104,600 | 133,500 | 18.9 | 17.2 |
| Arkansas | 22,900 | 15,000 | 32,300 | 7.5 | 7.3 |
| California | 2,256,200 | 1,076,900 | 1,206,600 | 35.9 | 33.3 |
| Colorado | 108,400 | 61,300 | 84,600 | 12.9 | 12.0 |
| Connecticut | 116,400 | 54,300 | 58,200 | 18.7 | 18.4 |
| Delaware | 21,300 | 8,400 | 14,200 | 13.2 | 12.1 |
| District of Columbia | 16,600 | 14,600 | 10,900 | 18.6 | 16.7 |
| Florida | 1,020,500 | 474,900 | 396,300 | 28.2 | 26.6 |
| Georgia | 210,000 | 91,100 | 173,600 | 14.1 | 13.7 |
| Hawaii | 70,100 | 33,200 | 18,300 | 23.6 | 22.4 |
| Idaho | 21,500 | 10,700 | 26,000 | 10.2 | 8.6 |
| Illinois | 407,000 | 171,800 | 244,000 | 19.2 | 18.1 |
| Indiana | 63,200 | 37,500 | 52,500 | 6.7 | 6.8 |
| Iowa | 35,400 | 28,200 | 29,800 | 8.0 | 7.7 |
| Kansas | 41,600 | 18,200 | 39,700 | 9.8 | 9.5 |
| Kentucky | 32,600 | 19,100 | 26,500 | 5.5 | 5.2 |
| Louisiana | 28,900 | 15,400 | 35,100 | 5.5 | 5.5 |
| Maine | 11,000 | 7,400 | 2,400 | 4.3 | 4.0 |
| Maryland | 237,400 | 90,500 | 118,300 | 21.2 | 20.1 |
| Massachusetts | 291,600 | 149,000 | 88,900 | 22.5 | 20.8 |
| Michigan | 155,400 | 72,400 | 55,400 | 8.4 | 8.2 |
| Minnesota | 118,800 | 61,600 | 48,700 | 11.4 | 10.7 |
| Mississippi | 10,500 | 6,600 | 11,200 | 3.2 | 3.2 |
| Missouri | 60,300 | 27,300 | 24,900 | 5.5 | 5.4 |
| Montana | 5,800 | 2,500 | 1,000 | 2.4 | 2.3 |
| Nebraska | 29,600 | 19,900 | 22,500 | 9.9 | 9.3 |
| Nevada | 127,000 | 51,400 | 84,900 | 27.4 | 25.5 |
| New Hampshire | 21,100 | 7,900 | 2,600 | 6.4 | 6.5 |
| New Jersey | 528,900 | 180,500 | 202,600 | 30.6 | 29.2 |
| New Mexico | 31,000 | 20,700 | 34,400 | 13.5 | 12.1 |
| New York | 1,100,300 | 480,700 | 360,800 | 31.0 | 28.2 |
| North Carolina | 136,100 | 80,500 | 158,600 | 11.2 | 10.9 |
| North Dakota | 7,100 | 6,000 | 5,200 | 6.0 | 6.3 |
| Ohio | 123,700 | 57,100 | 47,900 | 5.7 | 5.8 |
| Oklahoma | 41,900 | 24,900 | 48,100 | 9.0 | 8.1 |
| Oregon | 85,400 | 43,200 | 72,400 | 14.6 | 13.2 |
| Pennsylvania | 213,900 | 91,100 | 92,800 | 9.1 | 9.2 |
| Rhode Island | 34,000 | 11,500 | 12,100 | 16.4 | 16.2 |
| South Carolina | 45,400 | 26,600 | 40,000 | 6.8 | 6.6 |
| South Dakota | 9,900 | 4,900 | 2,100 | 5.2 | 4.7 |
| Tennessee | 64,000 | 41,200 | 66,900 | 7.7 | 7.1 |
| Texas | 820,800 | 515,200 | 918,500 | 24.0 | 22.4 |
| Utah | 44,800 | 32,000 | 49,800 | 12.9 | 11.2 |
| Vermont | 9,000 | 3,100 | 1,100 | 5.8 | 5.5 |
| Virginia | 244,100 | 92,400 | 144,200 | 17.1 | 16.8 |
| Washington | 232,500 | 116,600 | 148,800 | 19.7 | 18.8 |
| West Virginia | 4,900 | 800 | 2,300 | 1.5 | 1.7 |
| Wisconsin | 60,500 | 35,800 | 43,300 | 6.7 | 6.3 |
| Wyoming | 2,600 | 1,800 | 3,500 | 3.6 | 3.9 |
Foreign-Born Shares of Essential Workers by Metro Area.
| Rank | Metro Area | Foreign-Born Share of Essential Workers (%) |
|---|---|---|
| 1 | Miami–Fort Lauderdale–West Palm Beach, Florida | 53.0 |
| 2 | San Jose–Sunnyvale–Santa Clara, California | 50.3 |
| 3 | Merced, California | 47.0 |
| 4 | Salinas, California | 45.5 |
| 5 | Los Angeles–Long Beach–Anaheim, California | 42.8 |
| 6 | El Centro, California | 41.0 |
| 7 | New York–Newark–Jersey City, New York–New Jersey–Pennsylvania | 40.1 |
| 8 | McAllen–Edinburg–Mission, Texas | 39.8 |
| 9 | San Francisco–Oakland–Hayward, California | 39.7 |
| 10 | Naples–Immokalee–Marco Island, Florida | 38.1 |
| 11 | Madera, California | 37.4 |
| 12 | Visalia–Porterville, California | 37.4 |
| 13 | Stockton–Lodi, California | 36.9 |
| 14 | Yuma, Arizona | 36.7 |
| 15 | Yakima, Washington | 35.3 |
| 16 | Santa Maria–Santa Barbara, California | 34.6 |
| 17 | Napa, California | 34.0 |
| 18 | Brownsville–Harlingen, Texas | 33.9 |
| 19 | Laredo, Texas | 33.7 |
| 20 | Houston–The Woodlands–Sugar Land, Texas | 32.5 |
| 21 | Bakersfield, California | 32.4 |
| 22 | Washington–Arlington–Alexandria, DC–Virginia–Maryland–West Virginia | 32.4 |
| 23 | Fresno, California | 32.3 |
| 24 | Las Vegas–Henderson–Paradise, Nevada | 31.2 |
| 25 | Oxnard–Thousand Oaks–Ventura, California | 31.0 |
Refugee Essential Workers by State.
| State | Number of Refugee Essential Workers, 2018 | Share of Essential Workers among Refugees in the Labor Force (%) |
|---|---|---|
| Total | 504,900 | 70.1 |
| California | 72,800 | 65.8 |
| New York | 48,300 | 68.9 |
| Minnesota | 41,900 | 77.4 |
| Texas | 32,400 | 68.5 |
| Florida | 27,100 | 73.7 |
| Washington | 24,900 | 70.3 |
| Ohio | 23,600 | 71.9 |
| Michigan | 22,900 | 76.9 |
| Illinois | 20,000 | 66.5 |
| Pennsylvania | 14,000 | 72.1 |
| Georgia | 13,100 | 70.1 |
| New Jersey | 13,000 | 62.0 |
| Wisconsin | 12,200 | 82.3 |
| Arizona | 10,900 | 79.2 |
| Virginia | 10,700 | 61.8 |
| Missouri | 9,700 | 65.1 |
| Massachusetts | 9,200 | 62.7 |
| Iowa | 8,800 | 83.9 |
| Maryland | 8,200 | 61.0 |
| Colorado | 7,300 | 67.3 |
| North Carolina | 7,100 | 61.9 |
| Tennessee | 6,600 | 72.5 |
| Nebraska | 5,800 | 86.6 |
| Oregon | 5,700 | 60.5 |
| Kentucky | 5,000 | 84.2 |
| Utah | 4,800 | 74.6 |
| South Dakota | 4,700 | 97.7 |
| Connecticut | 4,400 | 73.6 |
| Indiana | 3,500 | 53.0 |
| Maine | 3,000 | 90.2 |
| North Dakota | 2,700 | 67.5 |
| Nevada | 2,400 | 48.9 |
| Oklahoma | 2,200 | 88.3 |
| Rhode Island | 2,000 | 81.2 |
| Kansas | 2,000 | 75.7 |
| South Carolina | 1,700 | 66.5 |
| Idaho | 1,500 | 82.2 |
| Montana | 1,400 | 100.0 |
| New Hampshire | 1,300 | 61.3 |
| Vermont | 1,200 | 77.2 |
| Alaska | <1,000 | 57.8 |
| Arkansas | <1,000 | 62.9 |
| Mississippi | <1,000 | 91.9 |
| Delaware | <1,000 | 79.5 |
| Alabama | <1,000 | 77.4 |
| Louisiana | <1,000 | 48.3 |
| District of Columbia | <1,000 | 45.0 |
| Hawaii | <1,000 | 76.0 |
| New Mexico | <1,000 | 60.4 |
Foreign-Born Essential Workers by Select Industries and Immigration Status.
| Foreign-Born Essential Workers | Naturalized Share of All Foreign-Born Essential Workers (%) | Legal Noncitizen Share of All Foreign-Born Essential Workers (%) | Undocumented Share of All Foreign-Born Essential Workers (%) | |
|---|---|---|---|---|
|
|
|
|
|
|
|
|
|
|
|
|
| Research and laboratory services | 149,800 | 52.4 | 31.1 | 16.5 |
| Hospitals | 1,169,200 | 73.8 | 18.1 | 8.1 |
| Walk-in care health facilities | 232,300 | 67.1 | 19.0 | 13.9 |
| Medical wholesale and distribution | 39,000 | 54.9 | 28.9 | 16.2 |
| Home health care workers or aides for the elderly | 392,600 | 56.0 | 27.5 | 16.4 |
| Offices of doctors and emergency dentists | 416,800 | 74.4 | 16.5 | 9.2 |
| Nursing homes or residential health care facilities or congregate care facilities | 496,700 | 60.8 | 23.3 | 15.9 |
|
|
|
|
|
|
| Transportation infrastructure such as bus, rail, for-hire vehicles, and garages | 990,400 | 57.7 | 24.0 | 18.3 |
| Food processing, manufacturing agents, including all foods and beverages | 538,700 | 37.0 | 27.0 | 36.0 |
| Medical equipment and instruments | 152,300 | 64.0 | 20.3 | 15.8 |
| Pharmaceuticals manufacturing | 135,500 | 63.7 | 22.6 | 13.7 |
| Manufacture of soap and cleaning compounds | 33,900 | 44.4 | 33.3 | 22.3 |
| Telecommunications manufacturing | 36,500 | 64.6 | 23.4 | 12.0 |
| Microelectronics, semiconductors manufacturing | 310,000 | 60.1 | 22.4 | 17.6 |
| Agriculture and farms | 579,400 | 18.8 | 27.6 | 53.6 |
| Tire manufacturing | 8,600 | 34.1 | 25.1 | 40.8 |
| Cement, concrete, lime, and gypsum product manufacturing | 24,500 | 37.8 | 23.9 | 38.3 |
| Rubber products (except tires) manufacturing | 8,900 | 32.2 | 23.9 | 43.9 |
| Household appliance manufacturing | 9,500 | 31.5 | 28.1 | 40.5 |
| Motor vehicles and motor vehicle equipment manufacturing | 197,400 | 43.5 | 32.5 | 23.9 |
| Grocery and related product merchant wholesalers | 214,000 | 37.9 | 26.4 | 35.6 |
| Grocery stores, including all food and beverage stores | 518,100 | 45.2 | 26.4 | 28.4 |
| Warehouse, distribution, and fulfillment | 321,900 | 39.0 | 29.0 | 32.0 |
| Construction | 2,578,000 | 27.2 | 21.6 | 51.2 |
| Electricians | 127,200 | 48.8 | 21.8 | 29.5 |
| Plumbers | 97,200 | 37.2 | 21.1 | 41.7 |
| Building cleaners or janitors | 861,000 | 40.1 | 28.7 | 31.2 |
| Disinfection | 113,800 | 28.3 | 32.1 | 39.6 |
Foreign-Born Essential Workers by Select States and Industries.
| California | Florida | Hawaii | Illinois | Maryland | Mass. | Michigan | Nevada | New Jersey | New York | Penn. | Texas | |
|---|---|---|---|---|---|---|---|---|---|---|---|---|
|
|
|
|
|
|
|
|
|
|
|
|
|
|
| Health care workers | 597,700 | 313,900 | 16,700 | 122,900 | 100,000 | 124,100 | 50,200 | 30,700 | 168,300 | 409,000 | 82,200 | 260,600 |
| Janitors and building cleaners | 173,000 | 86,900 | 5,000 | 36,400 | 17,900 | 24,200 | 5,200 | 16,100 | 36,600 | 100,300 | 17,500 | 105,600 |
| Workers in disinfection | 33,100 | 12,300 | 1,400 | 2,800 | 700 | 3,400 | 1,000 | 2,500 | 3,200 | 7,500 | 2,000 | 15,100 |
| Workers in agriculture | 291,093 | 35,346 | 2,540 | 3,982 | 1,010 | 1,096 | 5,330 | 1,237 | 3,675 | 6,454 | 7,334 | 32,198 |
| Workers in food and beverage manufacturing | 112,800 | 22,800 | 1,700 | 29,600 | 3,100 | 10,200 | 9,400 | 3,300 | 20,300 | 21,900 | 16,600 | 44,600 |
| Workers in transport (except airlines) | 225,700 | 111,500 | 5,900 | 60,400 | 18,300 | 22,000 | 12,900 | 13,300 | 51,500 | 159,200 | 18,600 | 100,100 |
|
|
|
|
|
|
|
|
|
|
|
|
|
|
| Health care workers | 31.6 | 27.7 | 24.2 | 16.7 | 24.6 | 23.3 | 8.2 | 24.8 | 30.7 | 32.9 | 9.2 | 18.6 |
| Janitors and building cleaners | 52.4 | 41.9 | 31.6 | 28.7 | 32.2 | 39.1 | 4.9 | 51.2 | 46.9 | 40.8 | 13.7 | 41.1 |
| Workers in disinfection | 53.7 | 30.5 | 39.2 | 16.8 | 12.7 | 36.2 | 5.9 | 47.3 | 38.6 | 32.7 | 12.8 | 31.6 |
| Workers in agriculture | 68.4 | 48.2 | 35.1 | 7.3 | 8.6 | 10.9 | 12.9 | 19.2 | 32.1 | 15.6 | 14.9 | 30.0 |
| Workers in food and beverage manufacturing | 44.1 | 37.7 | 32.6 | 27.0 | 15.5 | 38.5 | 19.8 | 35.7 | 45.5 | 29.6 | 18.5 | 33.6 |
| Workers in transport (except airlines) | 42.5 | 38.1 | 31.8 | 25.9 | 22.9 | 30.8 | 12.3 | 27.7 | 36.7 | 47.1 | 10.3 | 25.3 |
Foreign-Born Essential Workers in the United States, by Legal Status and Sector: 2018.
| Type of worker or economic activity | Legal status of foreign-born | Foreign-born share of essential workers (%) | ||
|---|---|---|---|---|
| Naturalized | Legally resident | Undocumented | ||
| Total foreign-born essential workers | 9,609,000 | 4,619,600 | 5,531,300 | 18.3 |
|
|
2,026,900 | 635,000 | 351,600 | 16.3 |
| Hospitals | 862,400 | 212,000 | 94,800 | 16.1 |
| Nursing homes or residential health care facilities or congregate care facilities | 302,100 | 115,700 | 78,900 | 16.9 |
| Offices of doctors and emergency dentists | 309,900 | 68,600 | 38,200 | 14.8 |
| Home health care workers or aides for the elderly | 220,000 | 108,000 | 64,600 | 25.7 |
| Walk-in care health facilities | 155,900 | 44,000 | 32,400 | 12.8 |
| Research and laboratory services | 78,400 | 46,600 | 24,800 | 22.2 |
| Medical wholesale and distribution | 21,400 | 11,300 | 6,300 | 16.2 |
| Emergency veterinary and livestock services | 10,500 | 5,800 | 2,800 | 5.1 |
| Other essential health care operations | 66,400 | 22,800 | 8,800 | 11.1 |
|
|
1,045,800 | 424,700 | 376,200 | 21.1 |
| Transportation infrastructure such as bus, rail, for-hire vehicles, and garages | 571,300 | 238,000 | 181,000 | 22.8 |
| Hotels and places of accommodation | 238,400 | 105,200 | 137,000 | 30.7 |
| Telecommunications and data centers | 90,800 | 36,200 | 31,400 | 15.1 |
| Airports and airlines | 77,500 | 25,800 | 15,800 | 18.8 |
| Utilities, including power generation, fuel supply, and transmission | 47,200 | 14,000 | 9,500 | 8.5 |
| Public water and wastewater | 20,600 | 5,500 | 1,500 | 8.6 |
|
|
1,198,800 | 699,400 | 857,000 | 20.8 |
| Agriculture and farms | 108,800 | 159,900 | 310,800 | 31.3 |
| Food processing, manufacturing agents, including all foods and beverages | 199,200 | 145,500 | 193,900 | 26.4 |
| Microelectronics, semiconductors | 186,200 | 69,300 | 54,500 | 30.5 |
| Motor vehicles and motor vehicle equipment manufacturing | 86,000 | 64,200 | 47,200 | 13.6 |
| Medical equipment and instruments | 97,400 | 30,900 | 24,000 | 24.2 |
| Pharmaceuticals | 86,400 | 30,600 | 18,500 | 25.2 |
| Aircraft and parts manufacturing | 83,400 | 20,800 | 13,100 | 16.7 |
| Plastics product manufacturing | 35,300 | 19,600 | 23,900 | 17.5 |
| Electric lighting and electrical equipment manufacturing, and other electrical component manufacturing, national electric code | 42,700 | 16,000 | 14,600 | 20.0 |
| Miscellaneous fabricated metal products manufacturing | 24,800 | 14,500 | 15,100 | 15.6 |
| Chemicals | 26,800 | 13,800 | 12,100 | 12.1 |
| Structural metals, and boiler, tank, and shipping container manufacturing | 22,900 | 12,000 | 17,400 | 13.9 |
| Household paper products | 24,700 | 10,300 | 13,200 | 12.7 |
| Machine shops; turned product; screw, nut, and bolt manufacturing | 22,300 | 11,000 | 12,800 | 14.1 |
| Telecommunications | 23,600 | 8,500 | 4,400 | 28.0 |
| Sanitary products | 15,000 | 11,300 | 7,600 | 23.2 |
| Iron and steel mills and steel product manufacturing | 15,200 | 7,300 | 10,700 | 11.9 |
| Other essential manufacturing | 98,200 | 53,900 | 63,000 | 12.1 |
|
|
203,300 | 112,600 | 137,200 | 17.6 |
| Grocery and related product merchant wholesalers | 81,200 | 56,600 | 76,300 | 26.0 |
| Household appliances and electrical and electronic goods merchant wholesalers | 21,500 | 11,100 | 7,700 | 18.4 |
| Machinery, equipment, and supplies merchant wholesalers | 21,800 | 7,900 | 9,900 | 9.3 |
| Motor vehicle and motor vehicle parts and supplies merchant wholesalers | 21,200 | 9,800 | 8,100 | 16.2 |
| Lumber and other construction materials merchant wholesalers | 11,400 | 4,100 | 9,000 | 14.5 |
| Hardware, and plumbing and heating, equipment and supplies merchant wholesalers | 10,500 | 5,200 | 3,900 | 11.0 |
| Petroleum and petroleum products merchant wholesalers | 5,800 | 3,800 | 2,500 | 12.2 |
| Paper and paper products merchant wholesalers | 4,600 | 1,600 | 2,700 | 15.2 |
| Other essential wholesale | 25,400 | 12,500 | 17,100 | 15.3 |
|
|
53,900 | 31,800 | 30,500 | 12.5 |
| Support activities for mining | 25,600 | 19,100 | 18,100 | 14.2 |
| Petroleum refining | 11,700 | 5,400 | 5,500 | 13.8 |
| Oil and gas extraction | 8,400 | 4,500 | 3,400 | 12.6 |
| Other energy workers | 8,100 | 2,700 | 3,500 | 7.5 |
|
|
1,228,100 | 745,400 | 1,085,200 | 18.4 |
| Restaurants | 741,700 | 516,800 | 846,100 | 20.5 |
| Grocery stores, including all food and beverage stores | 234,000 | 136,800 | 147,300 | 16.7 |
| Pharmacies | 100,100 | 29,100 | 20,500 | 16.1 |
| Hardware and building material stores | 64,200 | 28,300 | 28,900 | 9.3 |
| Gas stations | 56,000 | 22,900 | 26,500 | 18.0 |
| Convenience stores | 28,900 | 10,200 | 13,900 | 15.8 |
| Fuel dealers | 3,300 | 1,300 | 2,200 | 7.3 |
|
|
761,200 | 461,700 | 661,100 | 20.2 |
| Landscapers | 109,900 | 112,200 | 277,600 | 35.3 |
| Warehouse, distribution, and fulfillment | 125,500 | 93,400 | 103,000 | 21.1 |
| Auto repair | 130,600 | 73,000 | 102,200 | 17.0 |
| Child care services | 144,600 | 80,500 | 66,700 | 18.0 |
| Mail and shipping services | 139,000 | 44,700 | 26,800 | 13.5 |
| Laundromats | 42,600 | 21,500 | 42,800 | 37.9 |
| Trash and recycling collection, processing, and disposal | 33,900 | 16,400 | 25,700 | 15.8 |
| Personal and household goods repair | 17,400 | 11,300 | 8,000 | 21.1 |
| Animal shelters | 12,000 | 5,700 | 6,900 | 7.7 |
| Funeral homes, crematoriums, and cemeteries | 6,000 | 3,100 | 1,500 | 7.1 |
|
|
46,700 | 20,600 | 16,600 | 12.2 |
|
|
1,020,900 | 337,100 | 229,300 | 14.4 |
| Banks | 325,100 | 111,900 | 85,000 | 15.8 |
| Real estate | 255,900 | 66,000 | 51,800 | 14.6 |
| Services related to financial markets | 166,100 | 65,300 | 41,600 | 14.2 |
| Insurance | 154,400 | 48,900 | 37,800 | 11.8 |
| Payroll and accounting | 119,400 | 45,000 | 13,000 | 15.0 |
|
|
223,300 | 81,700 | 38,600 | 14.8 |
| Services to individuals and families | 186,000 | 70,700 | 35,500 | 17.8 |
| Food banks and shelters | 11,000 | 4,500 | 2,600 | 11.7 |
| Other providers of basic necessities | 26,300 | 6,600 | 400 | 6.4 |
|
|
799,800 | 604,100 | 1,398,500 | 24.8 |
| Construction | 701,600 | 555,900 | 1,320,500 | 26.0 |
| Electricians | 62,000 | 27,700 | 37,500 | 15.1 |
| Plumbers | 36,200 | 20,500 | 40,500 | 17.2 |
| Defense | 103,700 | 38,500 | 0 | 9.0 |
|
|
539,600 | 336,800 | 342,200 | 19.1 |
| Building cleaners or janitors | 345,400 | 247,300 | 268,400 | 27.9 |
| Security | 80,400 | 33,700 | 24,700 | 13.5 |
| Disinfection | 32,200 | 36,500 | 45,100 | 23.2 |
| Emergency management and response | 9,700 | 2,800 | 3,100 | 5.8 |
| Other essential services necessary to maintain safety, sanitation, and essential operations | 71,900 | 16,500 | 900 | 5.9 |
|
|
357,100 | 90,200 | 7,300 | 9.8 |
Source: Center for Migration Studies. See text for method of estimation.
Declaration of Conflicting Interests
The authors declared no potential conflicts of interest with respect to the research, authorship, and/or publication of this article.
Funding
The authors received no financial support for the research, authorship, and/or publication of this article.