
Abstract
Executive Summary
This report describes estimates of the undocumented population residing in the United States in 2022 compiled by the Center for Migration Studies of New York (CMS). The estimates are based on data collected in the American Community Survey (ACS) conducted by the US Census Bureau (Ruggles et al. 2023). The report finds that the undocumented population grew from 10.3 million in 2021 to 10.9 million in 2022, an increase of 650,000. The increase reverses more than a decade of gradual decline. The undocumented populations from 10 countries increased by a total of 525,000: Mexico, the Dominican Republic, and India; El Salvador, Guatemala, and Honduras in Central America; and Brazil, Colombia, Ecuador, and Venezuela in South America. The undocumented population in Florida increased by about 125,000 in 2022, Texas increased by 60,000, New York by 50,000, and Maryland by 45,000. The report explains why undocumented population growth is much less than the number of apprehensions by DHS. Finally, the Appendix provides a detailed description of the CMS methodology.
Major Findings
• After remaining at or near zero growth from 2010 to 2021 (Warren 2023), the US undocumented population increased by 650,000 in 2022.
• The largest population gains in 2022 were for Central America (205,000), South America (200,000), and Asia (140,000).
• From 2015 to 2022, the undocumented population from Mexico declined by 1.3 million; in the same period, the combined population from Central and South America increased by 1.2 million.
• The undocumented population from Asia declined by 115,000 from 2015 to 2021 and then increased by 140,000 in 2022.
• California, Texas, Florida, New York, and New Jersey had the largest undocumented populations in 2022. The total population in those five states increased by 300,000 in 2022.
• The combined undocumented population from El Salvador, Guatemala, and Honduras was undercounted by almost 400,000 in 2022. Correcting this data accounted for more than half the estimated increase in the undocumented population in 2022.
Background
The rapid increase in annual apprehensions and expulsions of migrants along the U.S.-Mexico border that began in 2019 has dominated media attention on migration for the past four years. That, in turn, has focused attention on the prospect of large annual increases in the undocumented population. Unfortunately, ACS data needed to monitor changes in the population are not available until about a year after the ACS survey is completed. Most organizations require six months or more to compile estimates, which means in most cases estimates of change are about two years out of date. The unique CMS methodology made it possible to derive these estimates less than two months after the release of 2022 ACS data.
This report describes changes in the US undocumented population by country of origin and state of residence since 2018 with special emphasis on changes from 2021 to 2022. The estimates were derived from ACS data by selecting noncitizens that arrived after 1982, 1 removing those determined to be legal residents based on characteristics reported in the survey, and further reducing the number using the techniques detailed in Appendix B.
After estimating the number of undocumented residents counted in the ACS, we made a final adjustment for undercount in the ACS. For most countries of origin, the undercount rate varies from about 7 percent to 10 percent. 2 In 2022, it was necessary to make additional undercount adjustments for El Salvador, Guatemala, and Honduras. The total addition for this extra undercount for these three countries was about 395,000 in 2022.
An important issue to be resolved is whether the relatively low counts of undocumented residents from El Salvador, Guatemala, and Honduras in the ACS in 2020 to 2022 were the result of large-scale emigration or were the result of undercount in the ACS. The methodology described in Appendix A confirms that the relatively low counts for these countries were the result of undercount and that the adjustments we made to derive the estimates are appropriate.
Continent or Area of Origin
The undocumented population declined from 10.6 million in 2018 to10.3 million in 2021 (Table 1). During that period, the population from Mexico declined while the population from Central America increased (Table 1, column 6). In 2022, the population from Central America continued to grow, but the population from Mexico stopped declining, and it increased by 60,000 in 2022. Undocumented immigration from South America increased from an annual average of 30,000 from 2018 to 2021 to an increase of 200,000 in 2022 (Table 1, column 7).
Estimated Undocumented Population by Area of Origin: 2018 to 2022.
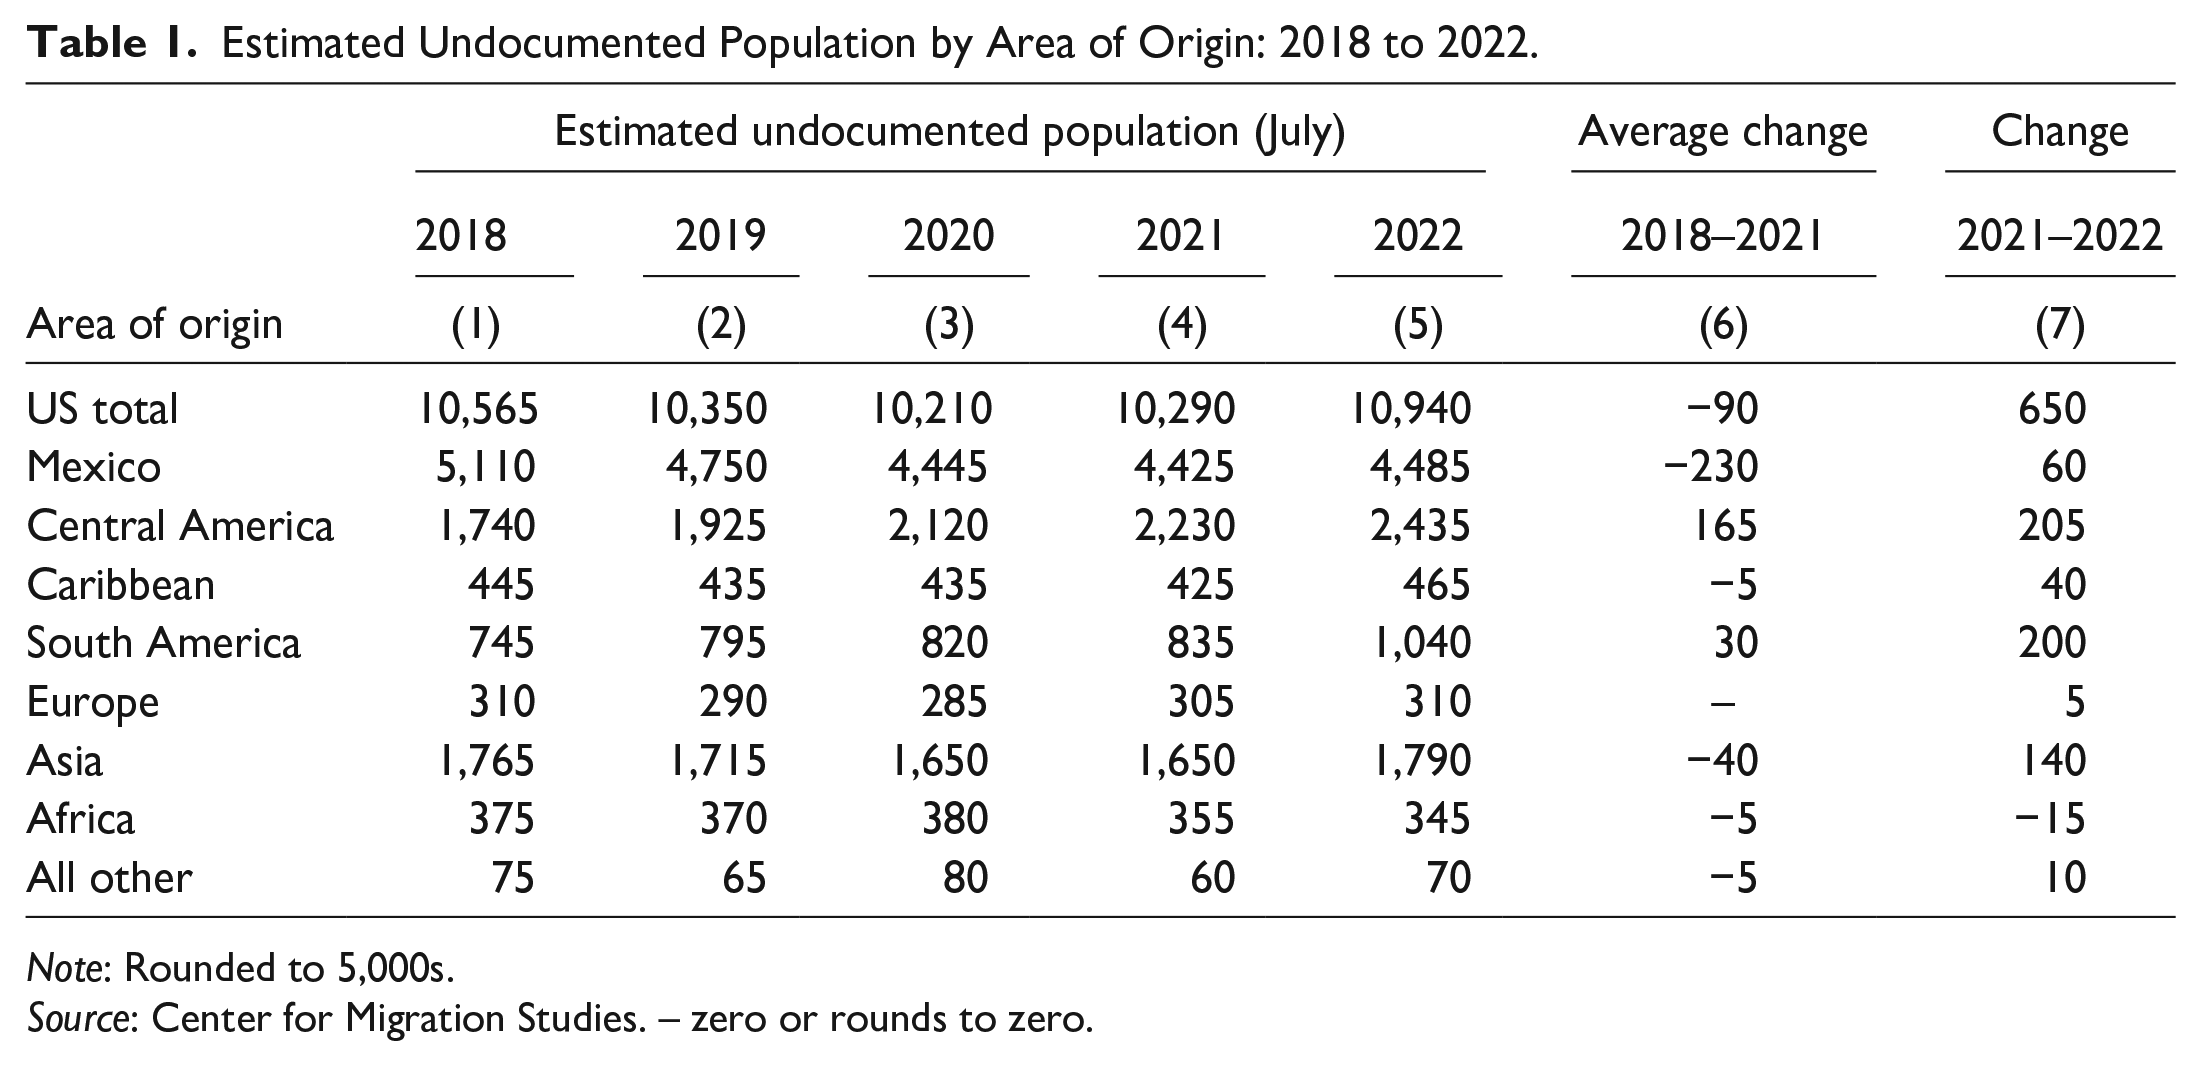
Note: Rounded to 5,000s.
Source: Center for Migration Studies. – zero or rounds to zero.
Figure 1 shows trends in the total undocumented population from 2015 to 2022 and trends for Mexico compared to Central and South America combined. Over that period, the population from Mexico declined by 1.3 million while the population from Central and South America combined increased by 1.2 million.
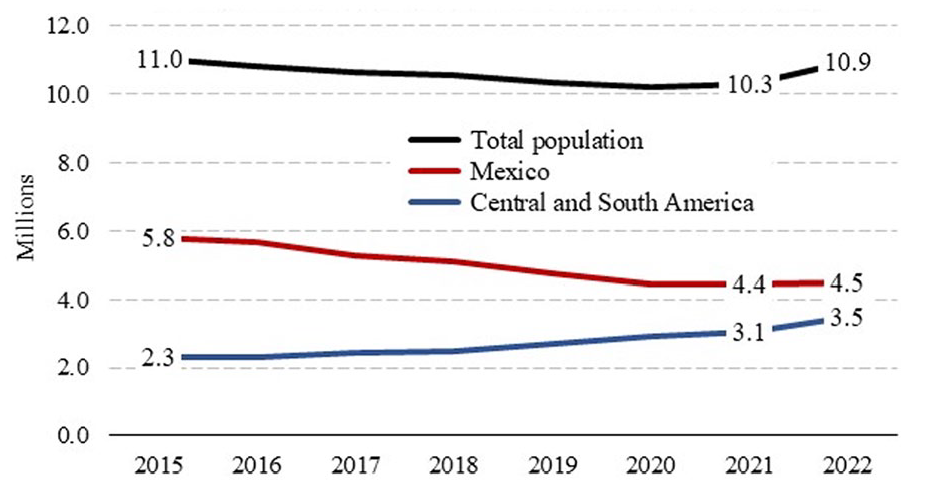
Estimated Undocumented Population, 2015 to 2022: Total, Mexico, and Central and South America.
Country of Origin
Table 2 shows annual estimates of the population from 2018 to 2022 for the top 15 countries of origin. The populations from El Salvador, Guatemala and Honduras increased steadily from 2018 to 2022. The pattern changed for most of the other countries in Table 2, with considerably larger increases in 2022 than in the earlier years. The population from Venezuela increased more in 2022 than it had in the previous three years combined (Table 2). The populations from Brazil, Dominican Republic, and Colombia also increased in 2022.
Estimated Undocumented Population From the Top 15 Countries: 2018 to 2022.
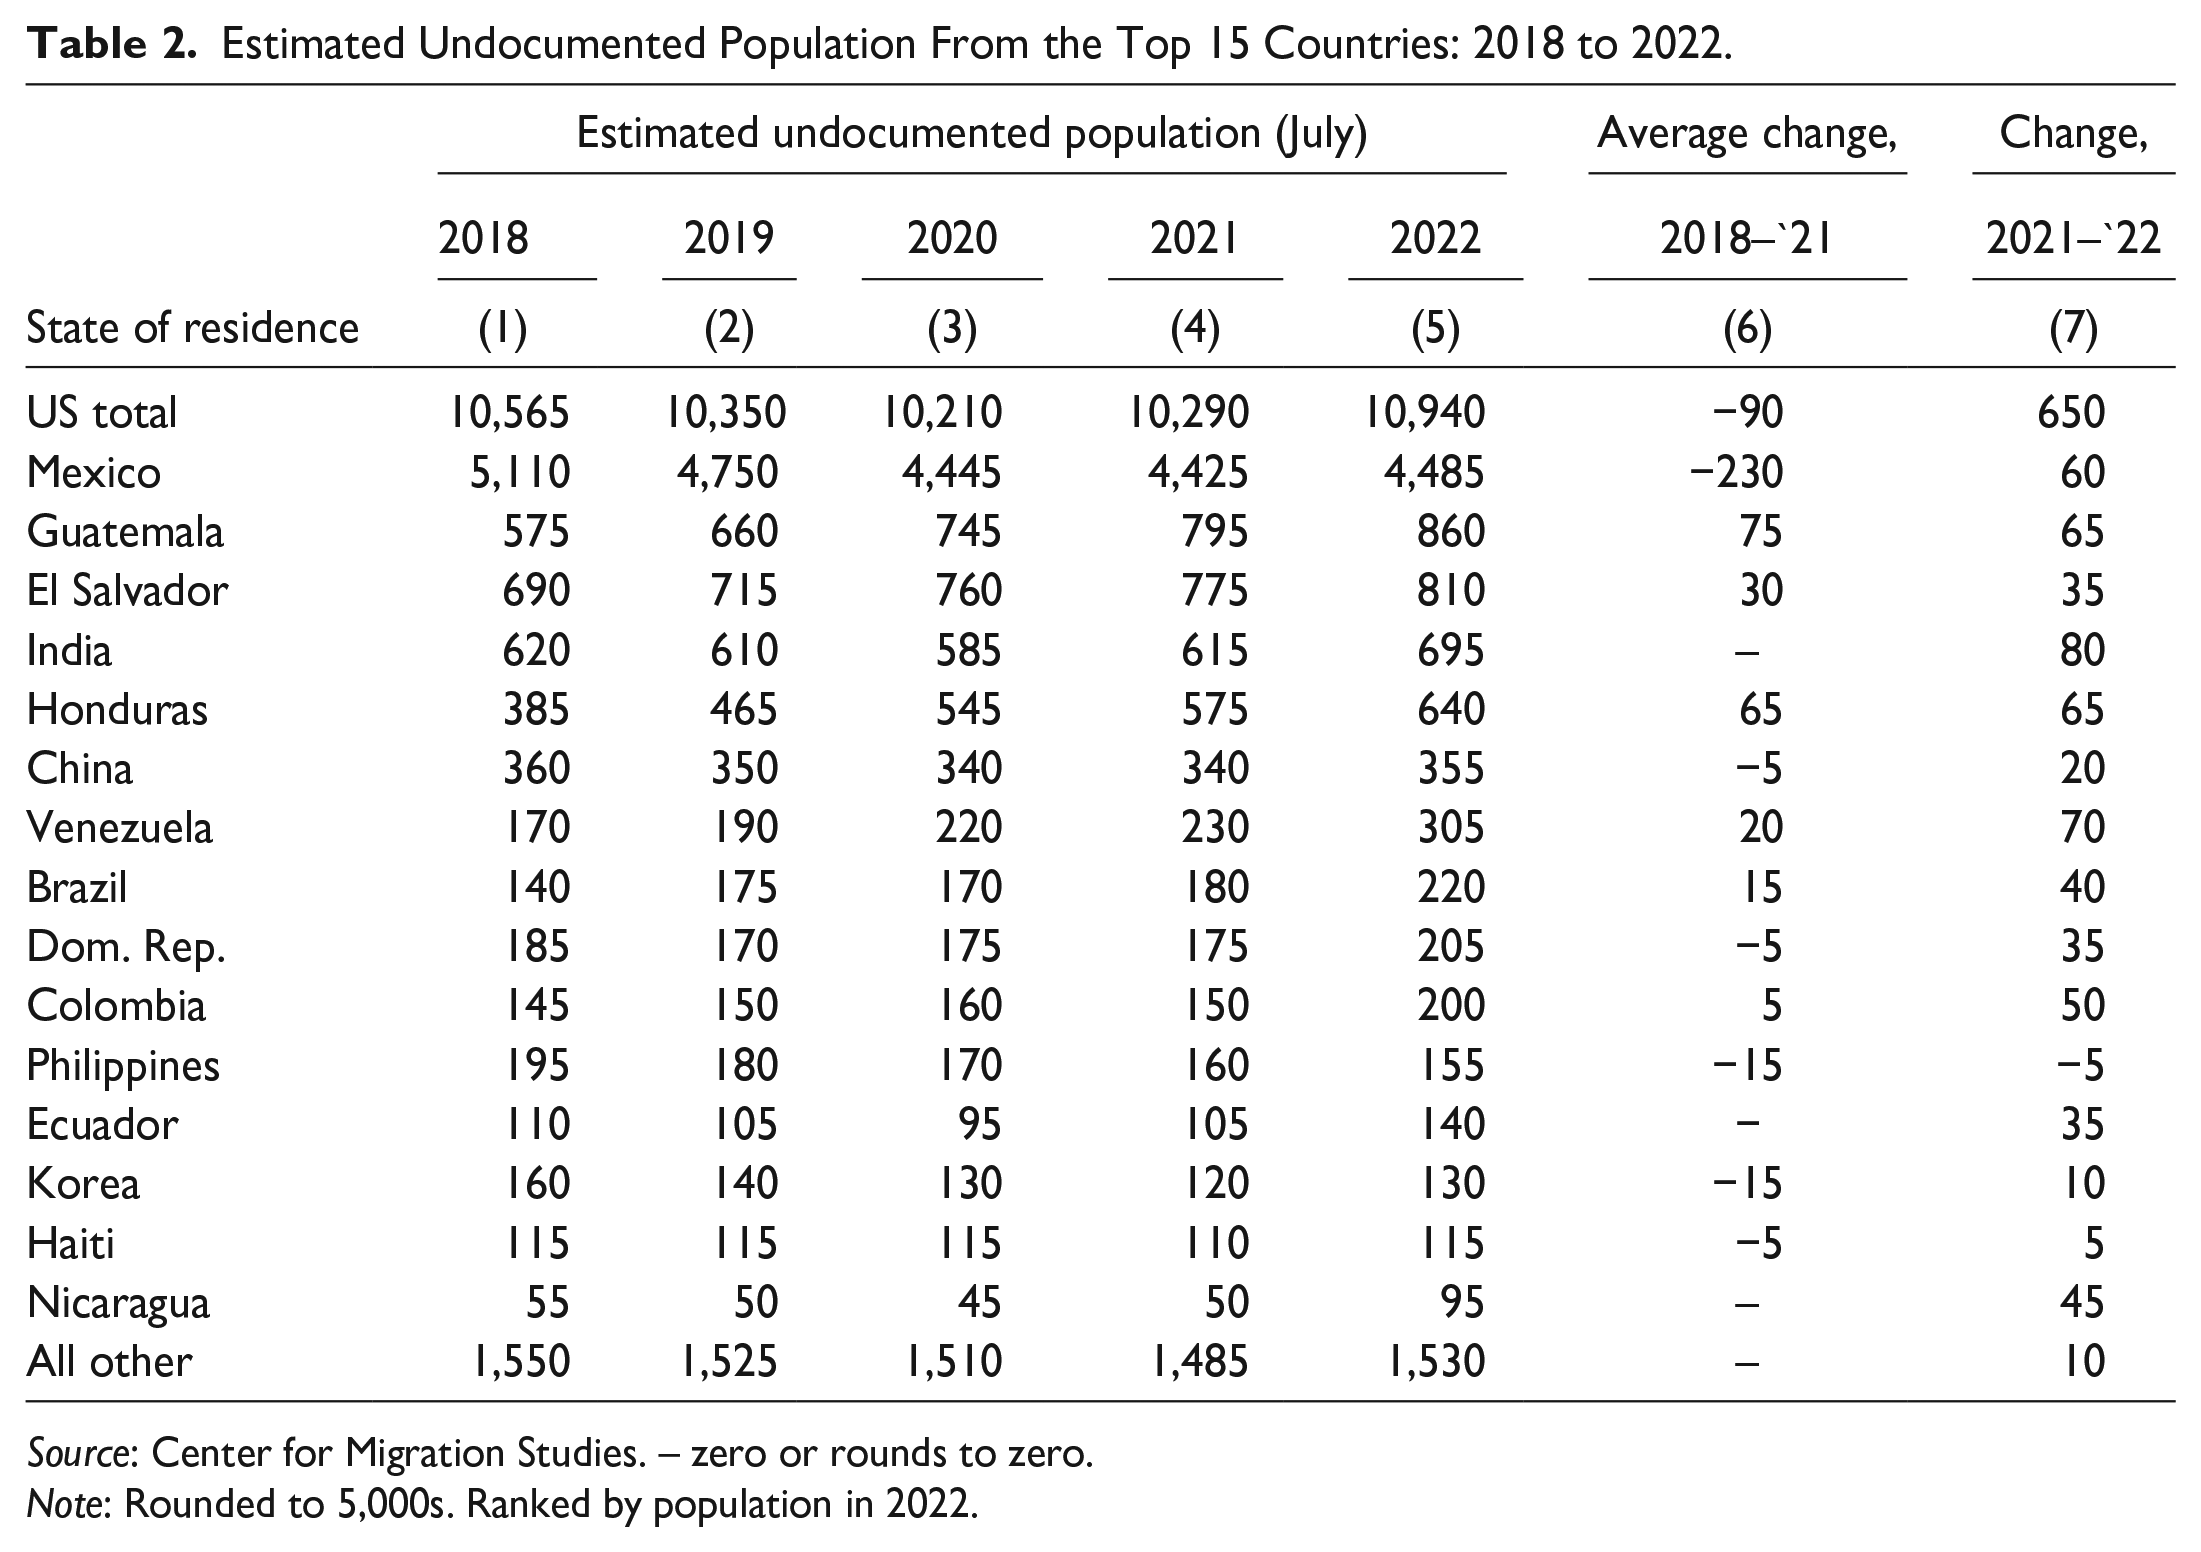
Source: Center for Migration Studies. – zero or rounds to zero.
Note: Rounded to 5,000s. Ranked by population in 2022.
After 2020, Ecuador changed from a country that had 10 years of steady decline in the undocumented population to a country with rapid growth. The undocumented population from Ecuador was 175,000 in 2010, and it declined to 95,000 in 2020, a drop of 80,000 in ten years. As the data in Table 2 show, the population changed course after 2020, increasing by 45,000 from 2020 to 2022.
According to one analysis, the third significant wave of Ecuadorian emigration since the 1980s began in 2019, driven by the devastating economic impact of the COVID-19 pandemic, increased unemployment, poverty, rising crime, extortion, corruption, the growing influence of narcotraffickers, and “the government’s inability to address these issues” (Jokisch 2023). The current era of emigration has been characterized by increased irregular migration, and greater migration by unaccompanied children and family units, based on the belief that migrants with children can enter the United States (ibid.).
The undocumented population from India increased from 460,000 in 2015 to more than 600,000 in 2018 (Figure 2). It held steady from 2018 to 2020 and began to increase again after 2020. The undocumented population from other major Asian sending countries declined or remained stable from 2015 to 2022.
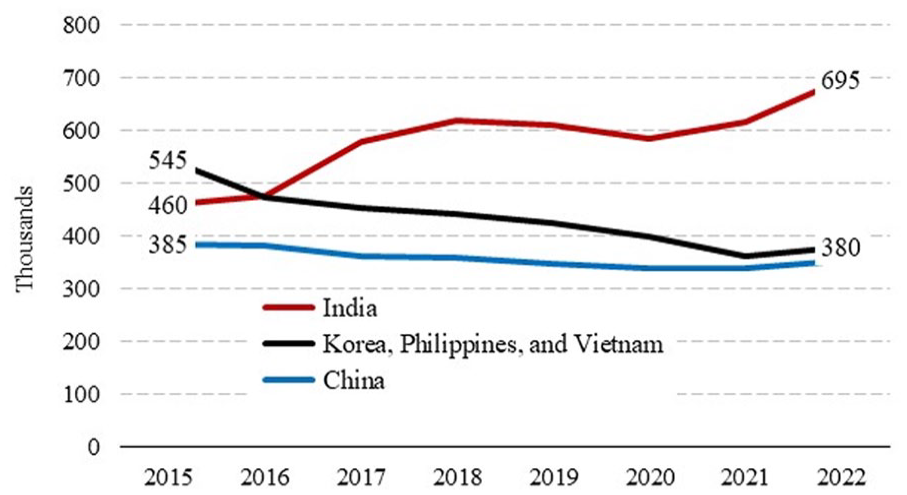
Estimated Undocumented Population From Selected Asian Countries: 2015 to 2023.
State of residence
Some states gained more than others, but the increase in the undocumented population in 2022 affected every state. Table 3 shows the increase in the undocumented population in the top 15 states in 2022. All the numbers in Table 3 have been rounded to 5,000s. The population in each of the 15 states increased by more in 2022 than it did, on average, from 2018 to 2021. The “all other” category – 35 States and DC – lost about 25,000, on average, from 2018 to 2021; those countries increased by 165,000 in 2022 (Table 3).
Estimated Undocumented Population Residing in the Top 15 States: 2018 to 2022.
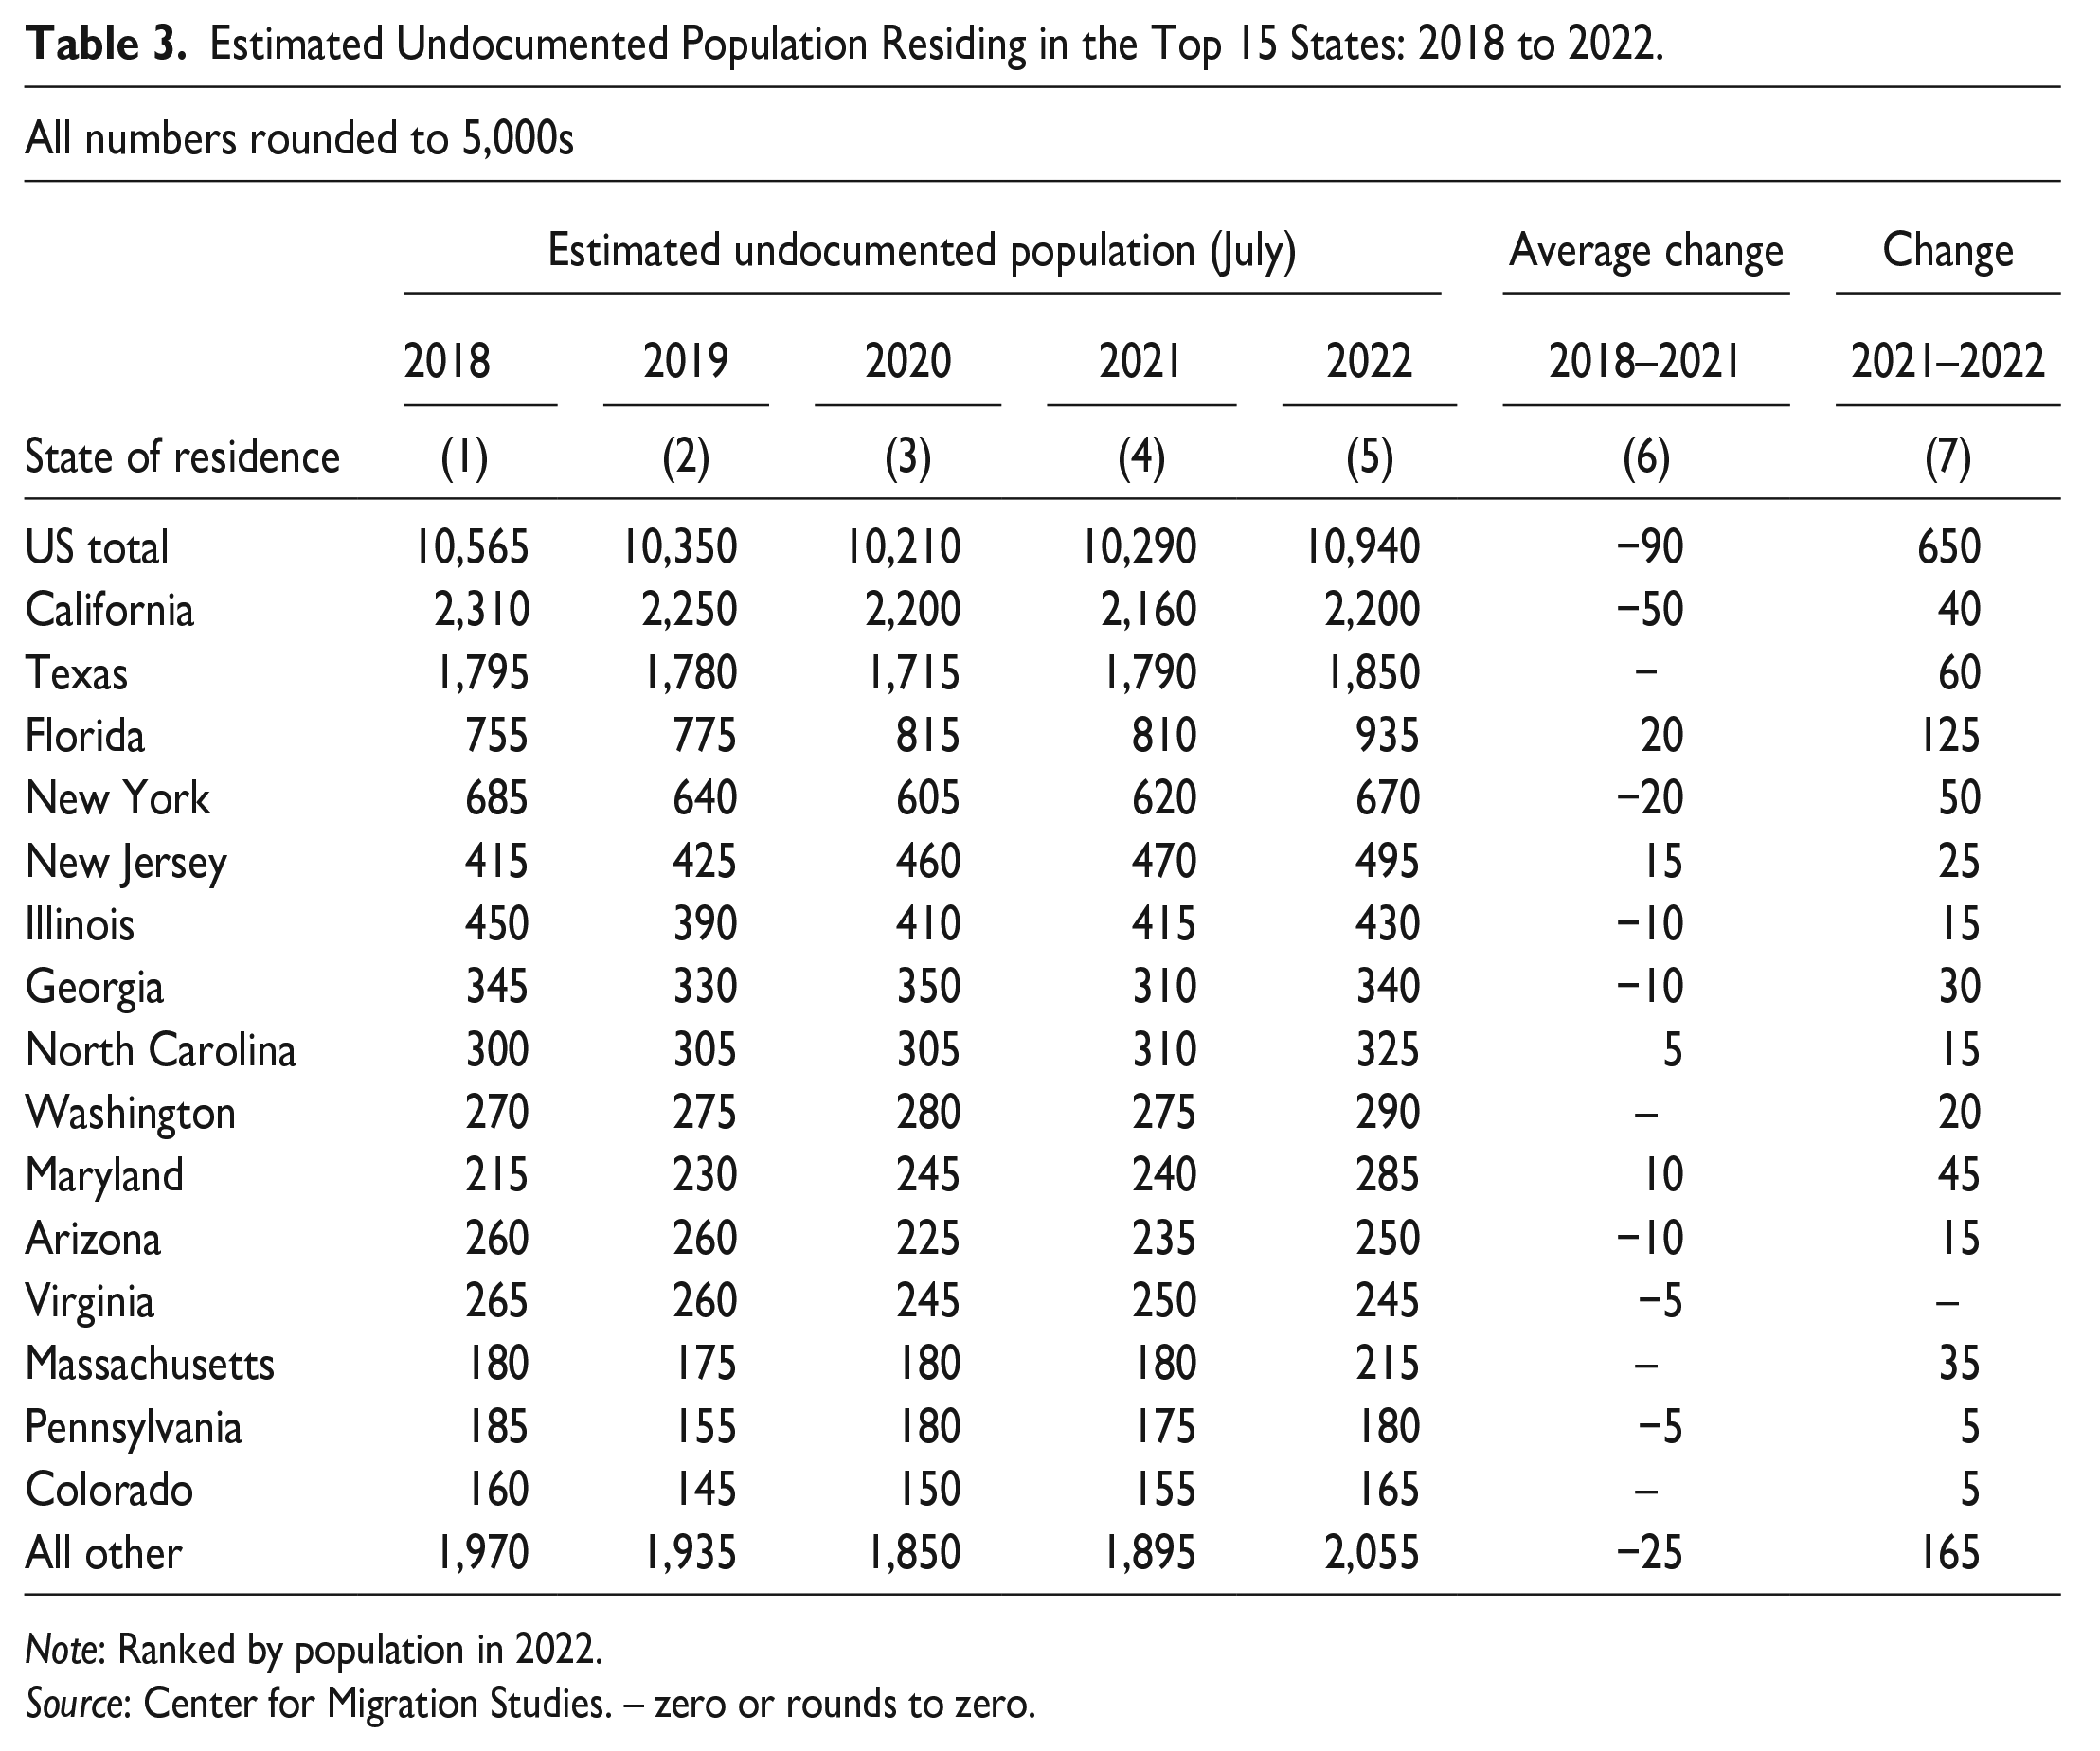
Note: Ranked by population in 2022.
Source: Center for Migration Studies. – zero or rounds to zero.
The undocumented population in Florida increase by 125,000 in 2022 after growing by 20,000 annually from 2018 to 2021 (Table 3). The countries of origin with the largest population growth in Florida in 2022 were Venezuela (45,000), Guatemala (25,000), Nicaragua (20,000), El Salvador (15,000), Columbia (15,000), and Haiti (15,000). The undocumented population from Mexico living in Florida declined by 15,000.
Table 4 shows the top 15 states in 2022 and the country that had the largest increase in undocumented residents in each state. Mexico was the largest contributor in five states — Iowa, Oklahoma, Oregon, Washington, and Arizona (Table 4). Undocumented migrants from Guatemala increased the most in New York, California, and Georgia. Michigan, North Carolina, and Illinois had the largest increases from India.
States With the Largest Increase in Undocumented Residents in 2022.
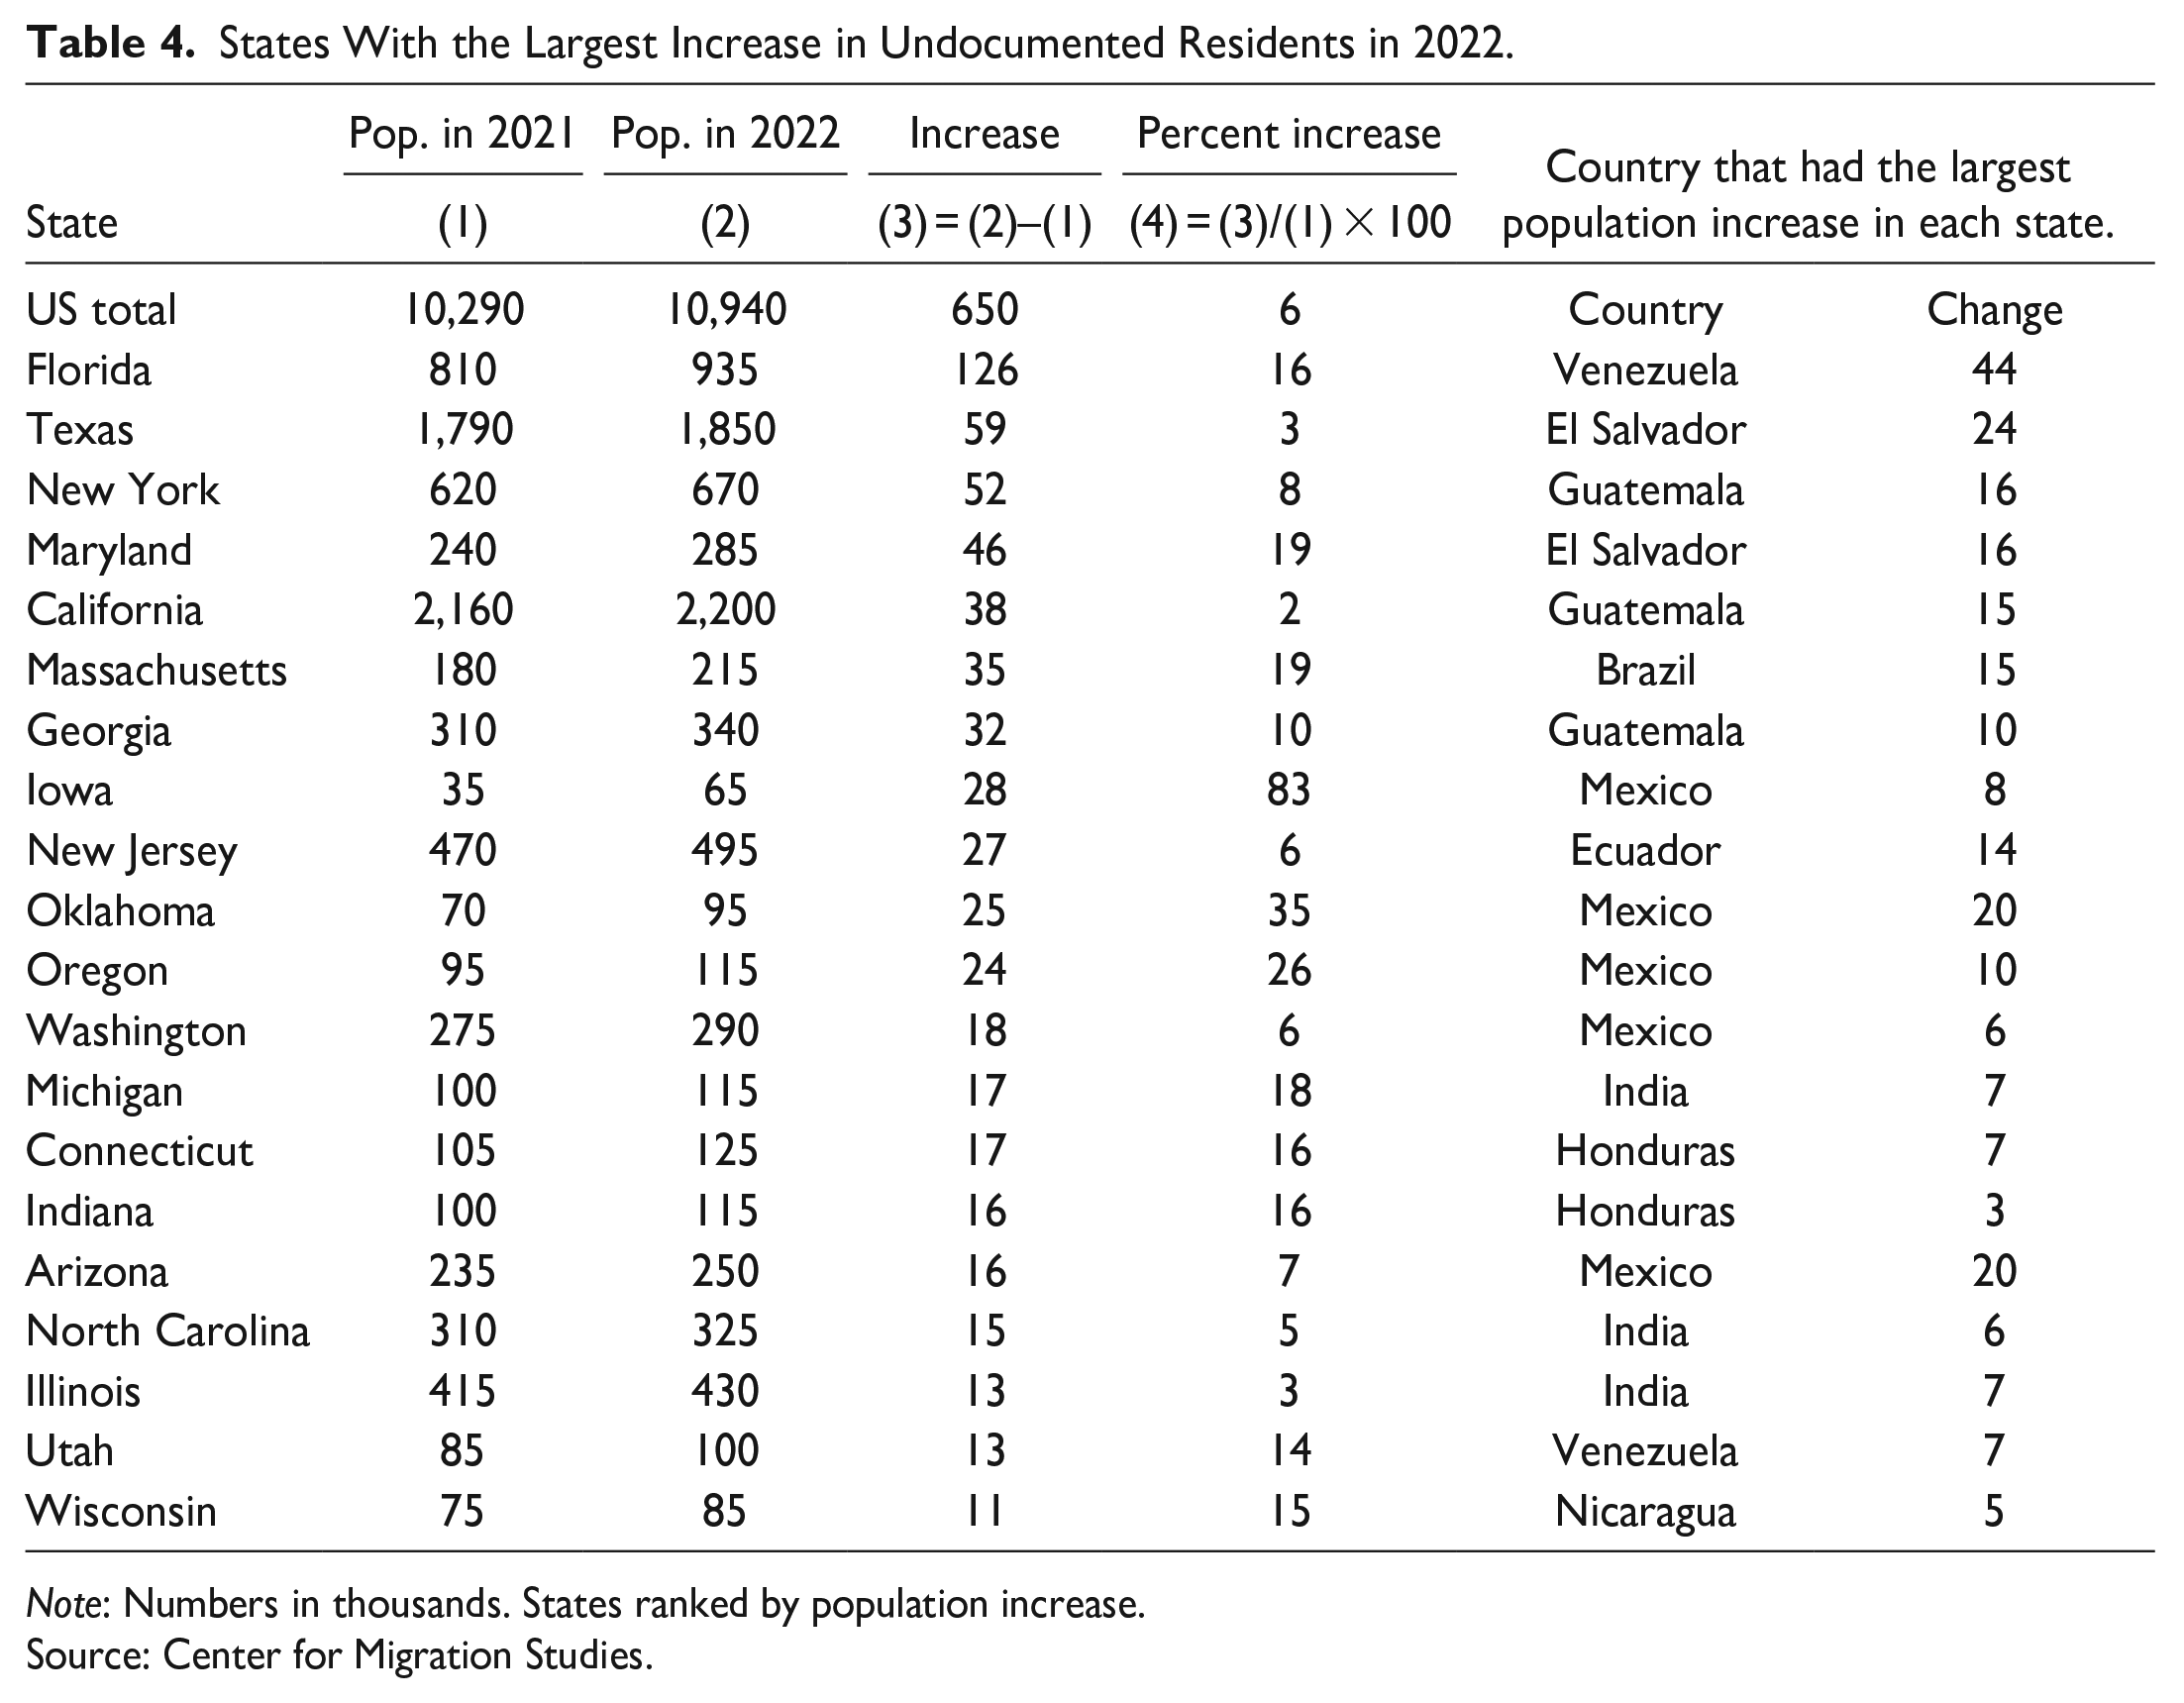
Note: Numbers in thousands. States ranked by population increase.
Source: Center for Migration Studies.
Undocumented Population Growth Versus Apprehensions by DHS
The question might arise: How could the undocumented population grow by “only” 650,000 in 2022 when DHS apprehensions exceeded 2.5 million? The answer is straightforward: Demographically, apprehensions and population growth are very different concepts. Total apprehensions essentially are the sum of failed attempts to enter, while undocumented population growth is the net result of successful entries across the border, overstays of temporary admissions, voluntary emigration, removal by DHS, adjustment to lawful status, and death.
Figure 3 shows annual growth of the undocumented population and DHS apprehensions from 2010 to 2022. Apprehensions were stable at about 750,000 from 2010 to 2018. Beginning in 2019, apprehensions increased annually in stair-step fashion, except in 2020, the peak year of the COVID-19 pandemic (Figure 3). The orange bars show annual change in the size of the undocumented population. The data used to construct Figure 3 show that 6.5 million apprehensions occurred from 2010 to 2018; the undocumented population declined by 1.1 million during that period. As the data on Figure 3 show, any link between the number of apprehensions and population growth is tenuous at best.
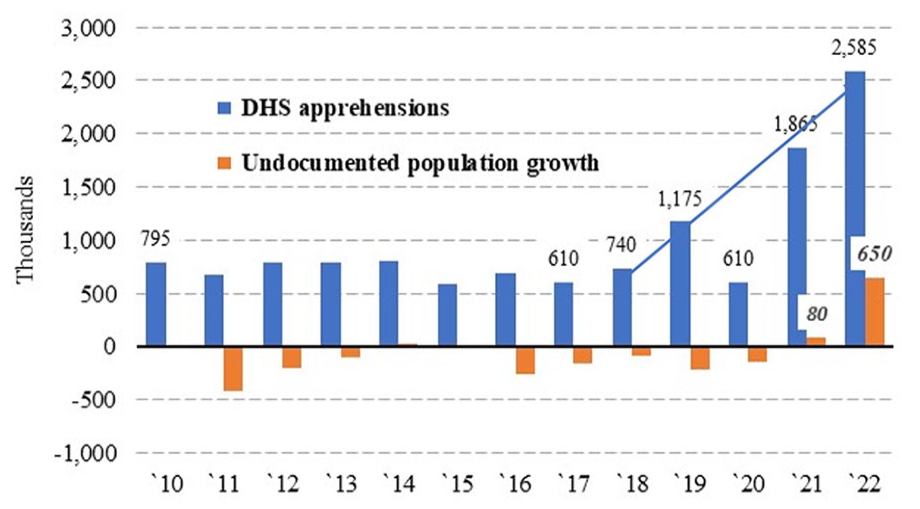
DHS Apprehensions and Undocumented Population Growth: 2010 to 2022.
Kerwin and Warren (2023) summarized the reasons why apprehensions by DHS do not translate directly into undocumented population growth: “[S]ome migrants are apprehended multiple times, some are trying to return to a permanent residence in the United States after a visit to their communities of origin, some are seasonal workers, and some are coming temporarily to visit family. None of these cases would add a new resident to the undocumented population . . .The fact that the Border Patrol prevents most attempted entries has not received wide media coverage. In 2017, DHS estimated that it interdicted 80 percent of attempted entries in the 2014 to 2016 period” (citation omitted).
The numbers arriving illegally across the border and the numbers overstaying temporary visas each year are offset by the numbers leaving the undocumented population. From 2011 to 2021, an annual average of more than 500,000 left the undocumented population through voluntary emigration, removal by DHS, adjustment to legal status, or death (Warren 2023, Table 2).
Summary
In 2022, the undocumented population in the United States increased by 650,000, the largest increase since 2001, when the population increased by slightly more than one million. The population grew rapidly because the population from Mexico stopped declining, undocumented migration from Central America continued to increase, arrivals from South America, particularly Venezuela, were higher than in previous years, and undocumented migration from India continued to grow.
The large population growth that began in 2022 can be expected to continue as long as the US Congress is unable to address the immigration system in a bipartisan manner. The last time the undocumented population had a large growth spurt was in 1999 to 2001; the population increased by 1.8 million in that two-year period. With bipartisan support, the size of the Border Patrol was doubled in the Bush administration and doubled again in the Obama administration. What followed was a dramatic decline in apprehensions and in undocumented population growth (Warren and Warren 2013). From 2010 to 2021, the total undocumented population declined by about 1.4 million (Warren 2023).
Large-scale illegal entries undermine the rule of law. Yet as a recent CMS report illustrates, so does underinvestment in the immigration court system (Kerwin and Millet 2023). As it stands, US immigration courts labor under a backlog of nearly 2.5 million pending cases, following an increase of 672,000 cases in FY 2023 (US Department of Justice, Executive Office for Immigration Review, 2023). Court backlogs delay the adjudication of meritorious asylum cases and the removal of persons with specious claims. The 4.1 million immigrant visa backlog (US Department of State 2021) also undermines the rule of law. It prevents persons from securing visas for which they are eligible — in some cases for decades. Many in the visa backlog languish in the court backlog as well. These backlogs can be easily reversed — from a technical standpoint — through legislative and administrative fixes. Yet the larger need is for an integrated approach to reform of the US immigration system as a whole. Piecemeal and narrow fixes will not suffice.
Footnotes
Appendix
Declaration of Conflicting Interests
The author declared no potential conflicts of interest with respect to the research, authorship, and/or publication of this article.
Funding
The author received no financial support for the research, authorship, and/or publication of this article.
1
Data were selected for noncitizens that arrived after 1981 because undocumented residents that arrived before that date would have acquired legal status under the provisions of the Immigration Reform and Control Act of 1986 (IRCA).
2
Undercount rates vary by country based on year of entry, with more recent arrivals receiving a larger adjustment for undercount. Countries with relatively more recent arrivals have higher overall undercount rates.
3
4
Undercount for these countries increased sharply in 2020 because of the effects of COVID-19 and because of the Trump Administration’s widely publicized efforts to remove undocumented residents from the 2020 census count.
5
The adjusted figure for 2020 minus the ACS data for 2020 is slightly more than 500,000.
6
The term logical edit refers to the process of examining survey data to identify likely legal residents. For example, respondents were assigned to the legal category if they worked in occupations that generally require legal status, had the characteristics of legal temporary migrants, were immediate relatives of US citizens, received public benefits restricted to legal residents, were from countries where most arrivals would be refugees, or were age 60 or older at entry. “Edited population” refers to ACS data for noncitizens that arrived after 1981, minus likely legal residents.
7
The countries and areas are those that (1) are listed in IPUMS, and (2) had residents counted in the ACS in 2010.
8
The population and components for all other countries were so small that any changes in the ratios over time would have only a miniscule effect on the estimates.