
Abstract
Did rising immigration levels change racial and ethnic exogamy patterns for young adults in the United States? Adding local demographics to Qian and Lichter’s national results, the authors examine the relationship between the sizes of the local immigrant populations in urban and rural areas and U.S.-born individuals’ exogamy patterns in heterosexual unions, controlling for the areas’ racial compositions. Using 2000 census race, ethnicity, and nativity data and log-linear models, the authors test hypotheses about the relationship between high levels of immigration from Asia and Latin America and endogamy rates for U.S.-born Latino/as and Asians. They find that U.S.-born Latino/as and Asians are not consistently more endogamous in high-immigrant areas once population composition differences across local areas are controlled. Surprisingly, U.S.-born Blacks and Native Americans are significantly less endogamous in areas with more immigrants.
Is intermarriage less common today for Asian Americans and Latino/as because there are more coethnic peers to choose from? In 2007, Qian and Lichter pointed out the declining percentage of Asians and Latino/as in intermarriages and hypothesized that this resulted from the growing availability of coethnic partners moving to the United States. This is an intuitive explanation; the relative size of racial and ethnic groups has a well-established relationship with marriage patterns. As they pointed out, however, these shifts might instead be the result of other, simultaneous changes occurring in our society, such as increasing rates of cohabitation and changing patterns of mate selection.
To better isolate the relationship between immigration and intermarriage rates, we use the fact that immigrants do not settle evenly across the United States. We test whether U.S.-born Asians and Latino/as have different rates of intermarriage in local communities with larger immigrant populations. If immigration is driving down intermarriage rates for these groups, we should see less intermarriage (i.e., exogamy) and more within-group unions (i.e., endogamy) in local communities with larger immigrant populations relative to the communities’ overall populations. Our models test the relationship between local immigration and endogamy patterns, while controlling for the number of coethnics in the community. We focus on the rates of endogamy among U.S.-born individuals 1 in heterosexual unions and examine how they vary according to the community’s percentage immigrant, percentage Asian immigrant, and percentage Latino/a immigrant. We conclude with some surprising findings for several U.S.-born groups.
Intermarriage Patterns in the United States and Local Variation
Exogamy is a key signal of racial/ethnic integration (Lee and Bean 2004, 2010) because race remains the most powerful division in the marriage market (Rosenfeld 2008). Since the 1960s, rates of White-Asian, White-Latino/a, and White-Black intermarriage have increased (Lee and Bean 2010; Kalmijn 1993). Given these overall increases, the declines in exogamy for Asians and Latino/as during the 1990s were “unprecedented” and surprising (Qian and Lichter 2007). There are also signals that intermarriage rates for Latino/as and Asians are not increasing as rapidly across immigrant generations as they did for European immigrants a century ago. Third-generation Latino/as and Asians today are marrying Whites at a lower rate than third-generation Europeans did in the early twentieth century (Feliciano 2001).
Qian and Lichter (2007) speculated that continued immigration from Asia and Latin America leads to more endogamous pairings among Asians and Latino/as for two reasons. First, continued immigration increases the availability of same-race partners. In fact, once they controlled for the growing diversity in U.S. racial/ethnic composition in their log-linear models, they found that the likelihood of exogamy between Whites and Asians and between Whites and Latino/as actually rose between 1990 and 2000. In other words, the percentage of native-born Asians and Latino/as in exogamous unions declined over the 1990s because of their relative population growth. Second, ongoing immigration can lead to changes in patterns of behavior and contextual changes within the United States that might affect coupling beyond the impact of changing population size.
To further investigate the downturn in exogamy levels among native-born Asians and Latino/as at the end of the 1990s, we examine Qian and Lichter’s (2007) hypotheses and national-level findings using variation in immigration levels across communities. Using the same data as their study, the 2000 census, we explore exogamy patterns in marriage and cohabitation among U.S.-born racial/ethnic groups to understand how immigration from Latin America and Asia to local communities is related to racialized union formation patterns. We hypothesize that local immigration levels not only change the size of particular racial/ethnic groups but also potentially change the amount and quality of intergroup contact, altering exogamy rates above and beyond the simple effect of population size.
If our hypothesis is correct—if immigration does affect racial/ethnic exogamy patterns—then these effects are likely best seen at the local level. First, most marriages and cohabitations are formed locally (Harris and Ono 2005). Second, more than two thirds of immigrants live in one of just six states: California, New York, Texas, Florida, Illinois, and New Jersey (Malone et al. 2003). Yet other states, particularly North Carolina, Georgia, and Nevada, experienced rapid growth in their immigrant populations over the 1990s (Malone et al. 2003). Third, immigrants are not evenly distributed within states; opportunities for unions with immigrants vastly differ across American communities. Places with high levels of immigration also have greater racial/ethnic diversity, which could lead to more exogamous partnerships for all U.S.-born groups.
Most studies of racial and ethnic exogamy examine patterns for the entire United States (e.g., Blackwell and Lichter 2000, 2004; Kalmijn 1991, 1993; Lichter et al. 2011; Qian and Lichter 2007). Those who have examined community-level patterns have included a fixed effect for each community (Harris and Ono 2004), which assumes a unique pattern for each community, or included measures of group size or composition at the state level (Kalmijn and Van Tubergen 2010), the metropolitan level (e.g., Anderson and Saenz 1994; Lee and Bean 2010; Lichter et al. 2007), or the county group level (Cready and Saenz 1997). 2
We make several advances in the study of the relationship between exogamy and local communities’ immigration levels. First, we classify all communities into quintiles according to their percentage immigrant to explore whether exogamy patterns differ from communities with no immigration to those with relatively high levels of immigration. Second, we examine whether U.S.-born groups respond differently to higher concentrations of Asian immigrants and Latino/a immigrants. Third, we explore whether Latino/as’ exogamy patterns differ by their racial identification (i.e., as White, Black, or “other”) because Latino/as’ friendship patterns, segregation patterns, and attitudes toward racism and the United States differ according to their racial identification (Denton and Massey 1989; Dowling 2014; Quillian and Campbell 2003). Fourth, we include nonmetropolitan areas in our study, because a significant portion of the migration to “new” U.S. destinations has been to small towns and rural communities (Massey 2008). Only one previous study of this type included nonmetropolitan areas; those investigators found that Mexican Americans in 1990 were equally likely to be in exogamous relationships in metropolitan and nonmetropolitan county groups (Cready and Saenz 1997). In sum, we document patterns of racial and ethnic exogamy for U.S.-born groups according to local characteristics in this era of greater racial and ethnic diversity.
How Might Immigration Levels Relate to Exogamy?
A simple demographic expectation is that as the sizes of the local Latino/a and Asian populations rise, exogamous unions for these groups will decrease (Kalmijn 1998). Increasing the availability of coethnic partners would decrease exogamy if high past rates of exogamy among Asians and Latino/as were driven by their relatively small group sizes rather than by low social barriers to intergroup contact. Prior research supports this hypothesis. Asian Americans living in cities with larger Asian American populations are less likely to marry across racial lines and more likely to marry across ethnic lines within the Asian American population (Okamoto 2007). Children of immigrants are more likely to marry endogamously in states with more immigrants or people in their groups (Kalmijn and Van Tubergen 2010). 3 This is echoed in Lichter et al.’s (2011) national finding that a higher percentage of second-generation Latino/as were married to coethnic immigrants between 2002 and 2008 relative to 1995 and 2001, after a period of rapid Latino/a immigration.
An influx of immigrants may also increase social barriers for intergroup contact. For example, as cities became more racially diverse because of immigration, residential segregation of Asians and Latino/as increased (Iceland 2004). Growing diversity may reinforce existing ethnic enclaves, and larger ethnic groups may maintain their own community institutions rather than participating in shared ones (Anderson and Saenz 1994), which may reinforce patterns of endogamy. For example, in cities with high Spanish-language maintenance among immigrants, intermarriage between Mexicans and non-Latino/a Whites is lower (Anderson and Saenz 1994). Therefore, our first hypothesis is as follows:
Hypothesis 1: U.S.-born Latino/as and Asians will have higher endogamy rates (and lower exogamy rates) in communities with larger foreign-born populations, net of population size.
This is not inevitable, however. It is possible that increased immigration leads to greater rates of exogamy for U.S.-born Latino/as and Asians. Qian and Lichter (2007) found higher exogamy rates once they controlled for the sizes of the Asian and Latino/a populations. Greater White-Asian and White-Latino/a exogamy could result if these waves of immigration increase Whites’ contact and familiarity with these groups (e.g., Berg 2009), especially if the historically high rates of intermarriage between Whites and Asians or Latino/as were due to low social barriers for intergroup contact.
Furthermore, high rates of immigration may not translate into greater endogamy for Asians and Latino/as if U.S.-born Asians and Latino/as do not see new immigrants as viable partners. First, U.S.-born Asians’ and Latino/as’ demographic characteristics may be sufficiently distinct from their immigrant counterparts to create barriers to forming partnerships (e.g., Suro and Passel 2003). Second, immigrants may overwhelmingly marry other immigrants (as Qian and Lichter 2001 found) or arrive to the United States already in a union (Bean and Stevens 2003). Therefore, our counter hypothesis is as follows:
Hypothesis 2: U.S.-born Latino/as and Asians will have lower endogamy rates (and higher exogamy rates) in communities with larger foreign-born populations, net of population size.
The Present Study
We examine marriages and cohabitations among a young adult cohort in 2000 across local areas. We first focus on the percentage of the community that was foreign-born in 2000 to model how immigration is unevenly changing the racial/ethnic diversity in local areas. Then, we subdivide the immigrant population by ethnic origin and explore patterns according to the percentage of Latino/a or Asian foreign-born persons in 2000. We do this for two reasons. First, we expect Latino/a and Asian immigration to have an important relationship with the partnering patterns of their U.S.-born coethnic groups. Second, this allows us to test whether the relative size of a particular group’s growth matters. The Latino/a population has grown significantly in absolute size, such that its total population now surpasses that of Blacks (Humes, Jones and Ramirez 2011), whereas the Asian population remains much smaller despite its rapid growth. The size of these two groups could lead to different implications for exogamy.
To better explore the potential racial dimension to these unions, we subdivide the panethnic Latino/a population along racial lines. We consider whether U.S.-born individuals who identify as Latino/a-White, Latino/a-Black, or Latino/a-Other (mostly respondents who self-identified as “other race” and Latino/a but also those who self-identified as Latino/a and American Indian, Asian, or more than one race) have different patterns of exogamy. Studies of friendship formation and residential segregation have shown that racial boundaries within the Latino/a population are salient social barriers (Denton and Massey 1989; Quillian and Campbell 2003), so measuring this variation within the Latino/a population is an important contribution because it tests whether this distinction is also important in the context of union formation.
As noted above, another significant contribution of this study is that we examine both metropolitan and nonmetropolitan areas. We operationalize the “local community” using census-defined metropolitan statistical areas (MSAs) for those living in metropolitan areas, and, for everyone else, we classify their local areas using the Census Bureau’s public use microdata areas (PUMAs).
We use the 2000 census data and log-linear models to examine whether, net of the population size and local racial/ethnic composition, high-immigrant-receiving communities demonstrate different patterns of racial endogamy and exogamy. We examine whether differences observed in endogamy across communities are due to variations in their racial/ethnic composition or if they reflect transformations in intergroup contact.
Data and Methods
We use the 2000 Integrated Public Use Microdata Series (IPUMS) census data with the 5 percent sample of the U.S. population to examine relationship endogamy in prevailing relationships, the same data used by Qian and Lichter (2007) to document the decline from 1990 to 2000 in exogamy between Asians and Whites and between Latino/as and Whites. The 2000 census also offers additional benefits. First, it has the largest sample of detailed racial and ethnic groups with information on individuals’ nativity; nativity is not available in the 2010 census. Second, it provides sufficient data collected at one point in time to study nonmetropolitan areas; to study nonmetropolitan areas with the American Community Survey, we would have to pool multiple survey years, introducing additional unexplained variation over time. By matching householders to their spouses or cohabiting partners, we create a sample of heterosexual marital and cohabiting couples. 4
Despite these strengths, there are three notable limitations of using IPUMS census data for studying union exogamy by nativity. First, prior research documents differential patterns of endogamy across first and later relationships (Mare 1991; Qian 1997) and a greater likelihood of union disruption among exogamous relationships (Qian 1997), but decennial census data do not contain respondents’ relationship histories. Without this information, we cannot restrict our sample to recent first cohabitations and first marriages or identify marriages that were preceded by cohabitation with the same partner. From a population perspective, this missing relationship history data poses less of a problem for cohabiting unions than marriages because their relatively higher rates of churning implies that cohabiters’ characteristics are largely constant as new relationships replace disrupted ones (Blackwell and Lichter 2000). This is a well-known challenge in studies of union endogamy; we follow prior research (e.g., Qian 1997; Qian and Lichter 2007) and restrict our analyses to young couples (in which the women are ages 19 to 33 and the men are ages 20 to 34) to minimize the selection effects of union disruption (Blackwell and Lichter 2000; Mare 1991; Qian 1997).
Second, we cannot determine whether immigrants’ unions were formed in the United States or in their home countries. 5 Given our emphasis on local conditions, we focus on the results for U.S.-born residents. We recognize that some U.S.-born individuals form unions abroad, but the relative risk is much lower than for immigrants, so we do not expect these unions to significantly affect our results for native-born groups.
Third, although it is common to sample existing unions to study how people make their partnering decisions, such samples do not capture the full population who might form cohabitations or marriages in the future or have in the past. Studies relying on the prevailing same-race and interracial unions provide an important but not complete indication of the amount of interracial contact occurring in among potential relationship partners.
Variables Measured at the Individual and Couple Levels
Race and ethnicity
We use nine mutually exclusive racial/ethnic categories. The six non-Latino/a categories are White, Black, Native American, Asian/Pacific Islander, “some other race,” and multiracial. Those who self-identified as “Latino/a” are placed into three categories on the basis of their self-identification on the separate “race” question: Latino/a-White, Latino/a-Black, and Latino/a-Other (all Latino/as who did not choose a White or Black racial identification; 88 percent of respondents in this category rejected all the standard U.S. racial categories and identified as “some other race”). In the log-linear models, we omit those who identified as Latino/a-Black (942 women, 944 men) and non-Latino/a “some other race” (643 women, 636 men) because of sample-size limitations. We also omit those who identified as multiracial (7,736 women, 7,374 men) because the heterogeneity within this category (i.e., individuals identified a variety of racial combinations) makes it conceptually difficult to identify exogamous and endogamous couples. This reduces the number of racial/ethnic groups in the log-linear models to six.
We test for differences in exogamy across panethnic groups (e.g., between Whites and Asians), not within a panethnic group (e.g., between Japanese and Chinese Americans). Using these broad categories, we are conservatively estimating the amount of interracial boundary crossing in intimate relationships and focusing only on the most socially salient racial boundaries.
Nativity
Each person is also classified by nativity (foreign-born or native-born). We cross-classify individuals by their race/ethnicity and nativity, omitting non-Latino/a Native American immigrants in the log-linear models because of sample size limitations (64 women, 50 men).
Relationship type
Relationships are classified as either marriages or cohabitations. Prior research has established that racial exogamy is generally greater in cohabiting unions than in marriages (e.g., Blackwell and Lichter 2000, 2004; Qian and Lichter 2011). See Appendix B for our models testing variation across couple type.
We omit couples with any missing data on the female or male partner’s race, ethnicity, or nativity, the type of union (marriage vs. cohabitation), or residential location, leaving us with 411,632 marriages and 86,448 cohabitations.
Variables Measured at the Local Level
Identifying local communities
To assign each couple in our sample to a local “community,” we first assign couples living in a nonmetropolitan area to their PUMA, the geography unit available in the IPUMS data. These nonmetropolitan PUMAs contain between 100,000 and 200,000 people and range in geographic size depending on their population density. 6 Twenty-two percent of the original sample of couples lives in one of the 500 nonmetropolitan PUMAs in our data.
We next assign couples living in a metropolitan area to one of the 294 MSAs represented in the original data. For 43 percent of the total sample, this is straightforward; the official (Office of Management and Budget) MSA boundaries match the census-measured PUMA boundaries, and those areas are considered “fully identified” metropolitan areas. 7
The remaining 35 percent of the total sample live in MSAs that are more difficult to measure because of discrepancies between official boundaries and census-measured PUMA boundaries. Because PUMAs can straddle metropolitan boundaries, 9 percent of the original sample lives in a PUMA that contains (1) both metropolitan and nonmetropolitan areas or (2) two or more different metropolitan areas, making it impossible to assign residents to a single metropolitan area. We drop couples living in one of these 150 PUMAs from our analytic sample, resulting in a final sample of 383,863 marriages and 82,743 cohabitations in 643 local areas.
Twenty-six percent of the total sample lives in partially identified metropolitan areas. For these cases, the observed couple can be assigned to the correct metropolitan area, but some of the other residents in that city cannot be correctly assigned because they live in a PUMA that contains other metropolitan or nonmetropolitan areas. This occurs most often for residents living in the outlying areas of a city. 8 For these partially identified metropolitan areas, we may not adequately measure the area’s racial, ethnic and nativity composition. 9
We tested the sensitivity of our results to the inclusion of couples who live in partially identified metropolitan areas. First, we excluded couples in metropolitan areas (n = 51 PUMAs) with at least 10 percent of their population not identified. Second, we excluded couples living in any of the partially identified metropolitan areas (n = 83 PUMAs). In general, our results are robust to the inclusion or exclusion of couples living in partially identified metropolitan areas. Discrepancies across these different sample specifications are noted in Appendix A.
Local demographics
Using our sample of individuals in each area in the 2000 census, we calculate the percentage of each local area that is foreign-born in 2000 and then categorize local areas according to their percentage foreign-born into quintiles using the “xtile” command within Stata. 10 Similarly, we classify areas into quintiles according to the percentage of their 2000 population who are (1) Latino/a immigrants and (2) Asian immigrants. 11
Models
We use log-linear models to investigate the associations between partners’ races independent of the racial composition of the population. We begin with the same modeling strategy that Qian and Lichter (2007) used to replicate their national results, and then we introduce local variation in community context. Log-linear models examine the observed patterning of partners’ characteristics using multidimensional frequency tables that control for population distributions. The models express the expected cell frequencies in terms of additive effects about the overall distribution of each characteristic and interaction effects about the joint occurrence of partners’ characteristics. The interaction terms indicate how many more partnerships occur in that joint distribution than expected under the null hypothesis of statistical independence of each partner’s race/ethnicity and nativity. The interaction terms can take several forms to indicate (1) uniform patterns throughout all cells of a table; (2) patterns occurring along the diagonal of a table, where partners’ characteristics are identical; or (3) recognizable patterns occurring within portions of a table, such as if particular combinations are more frequent.
To investigate racial endogamy, we estimate variable diagonal models and variable affinity models, choosing the best fitting model on the basis of fit statistics. Variable diagonal models include a separate parameter for each group, allowing endogamy to vary across groups (e.g., dummy variables for White native–White native pairs, White immigrant–White immigrant pairs, Black native–Black native pairs, etc.; Qian 1997). We also include indicators to test whether unions are likely to be racially endogamous when they are exogamous on nativity (e.g., White native–White immigrant pairs; Qian, Glick, and Batson 2012).
Variable affinity models include a separate parameter for the combination of each minority group with Whites (i.e., White-Black, White-Asian, etc.; Qian 1997), because unions with Whites are more common than exogamous unions with two persons of color. We also test whether there are panethnic affinities among Latino/as (e.g. between Latino/a-Whites and Latino/a-Others; see Rosenfeld 2001) and gendered differences in the affinity between Whites and both Blacks and Asians, given the gender asymmetry in partnering patterns. See Appendix A for details about the modeling strategy used and the best fitting models for each way of measuring local areas’ immigrant populations (i.e., percentage total immigrant, percent Latino/a immigrant, and percentage Asian immigrant).
Results
To explore the role of local immigration levels for patterns of exogamy and endogamy among U.S.-born individuals, our analysis proceeds as follows. First, in Table 1, we report the unweighted percentage of women in each racial/ethnic-nativity group in an exogamous, heterosexual union across communities defined by their population’s percent immigrant. 12 In Table 2, we report the unweighted population distribution of their male partners averaged across places within each quintile to see how racial/ethnic composition varies across communities with high and low levels of immigration. Given that we find consistent trends as percentage immigrant increases, we report population compositions only for the first, third, and fifth quintiles for clarity and simplicity. 13 Finally, in Table 3, we present the log-linear modeling results. Our null hypothesis is that the observed exogamy patterns (shown in Table 1) are due simply to differences in the availability of partners across places (shown in Table 2). Alternatively, rates of endogamy and exogamy for U.S.-born Latino/as and Asians could be higher (hypothesis 1) or lower (hypothesis 2) in places with more immigrants, net of the differences in population composition. Because we use three different measures to characterize an area’s immigrant population, we discuss Tables 2 and Table 3 together according to the specific immigration measure under examination.
Percentage of Young Women in Exogamous Marriages or Cohabitations, by Racial Group, Nativity, and Local Area’s Immigrant Composition.
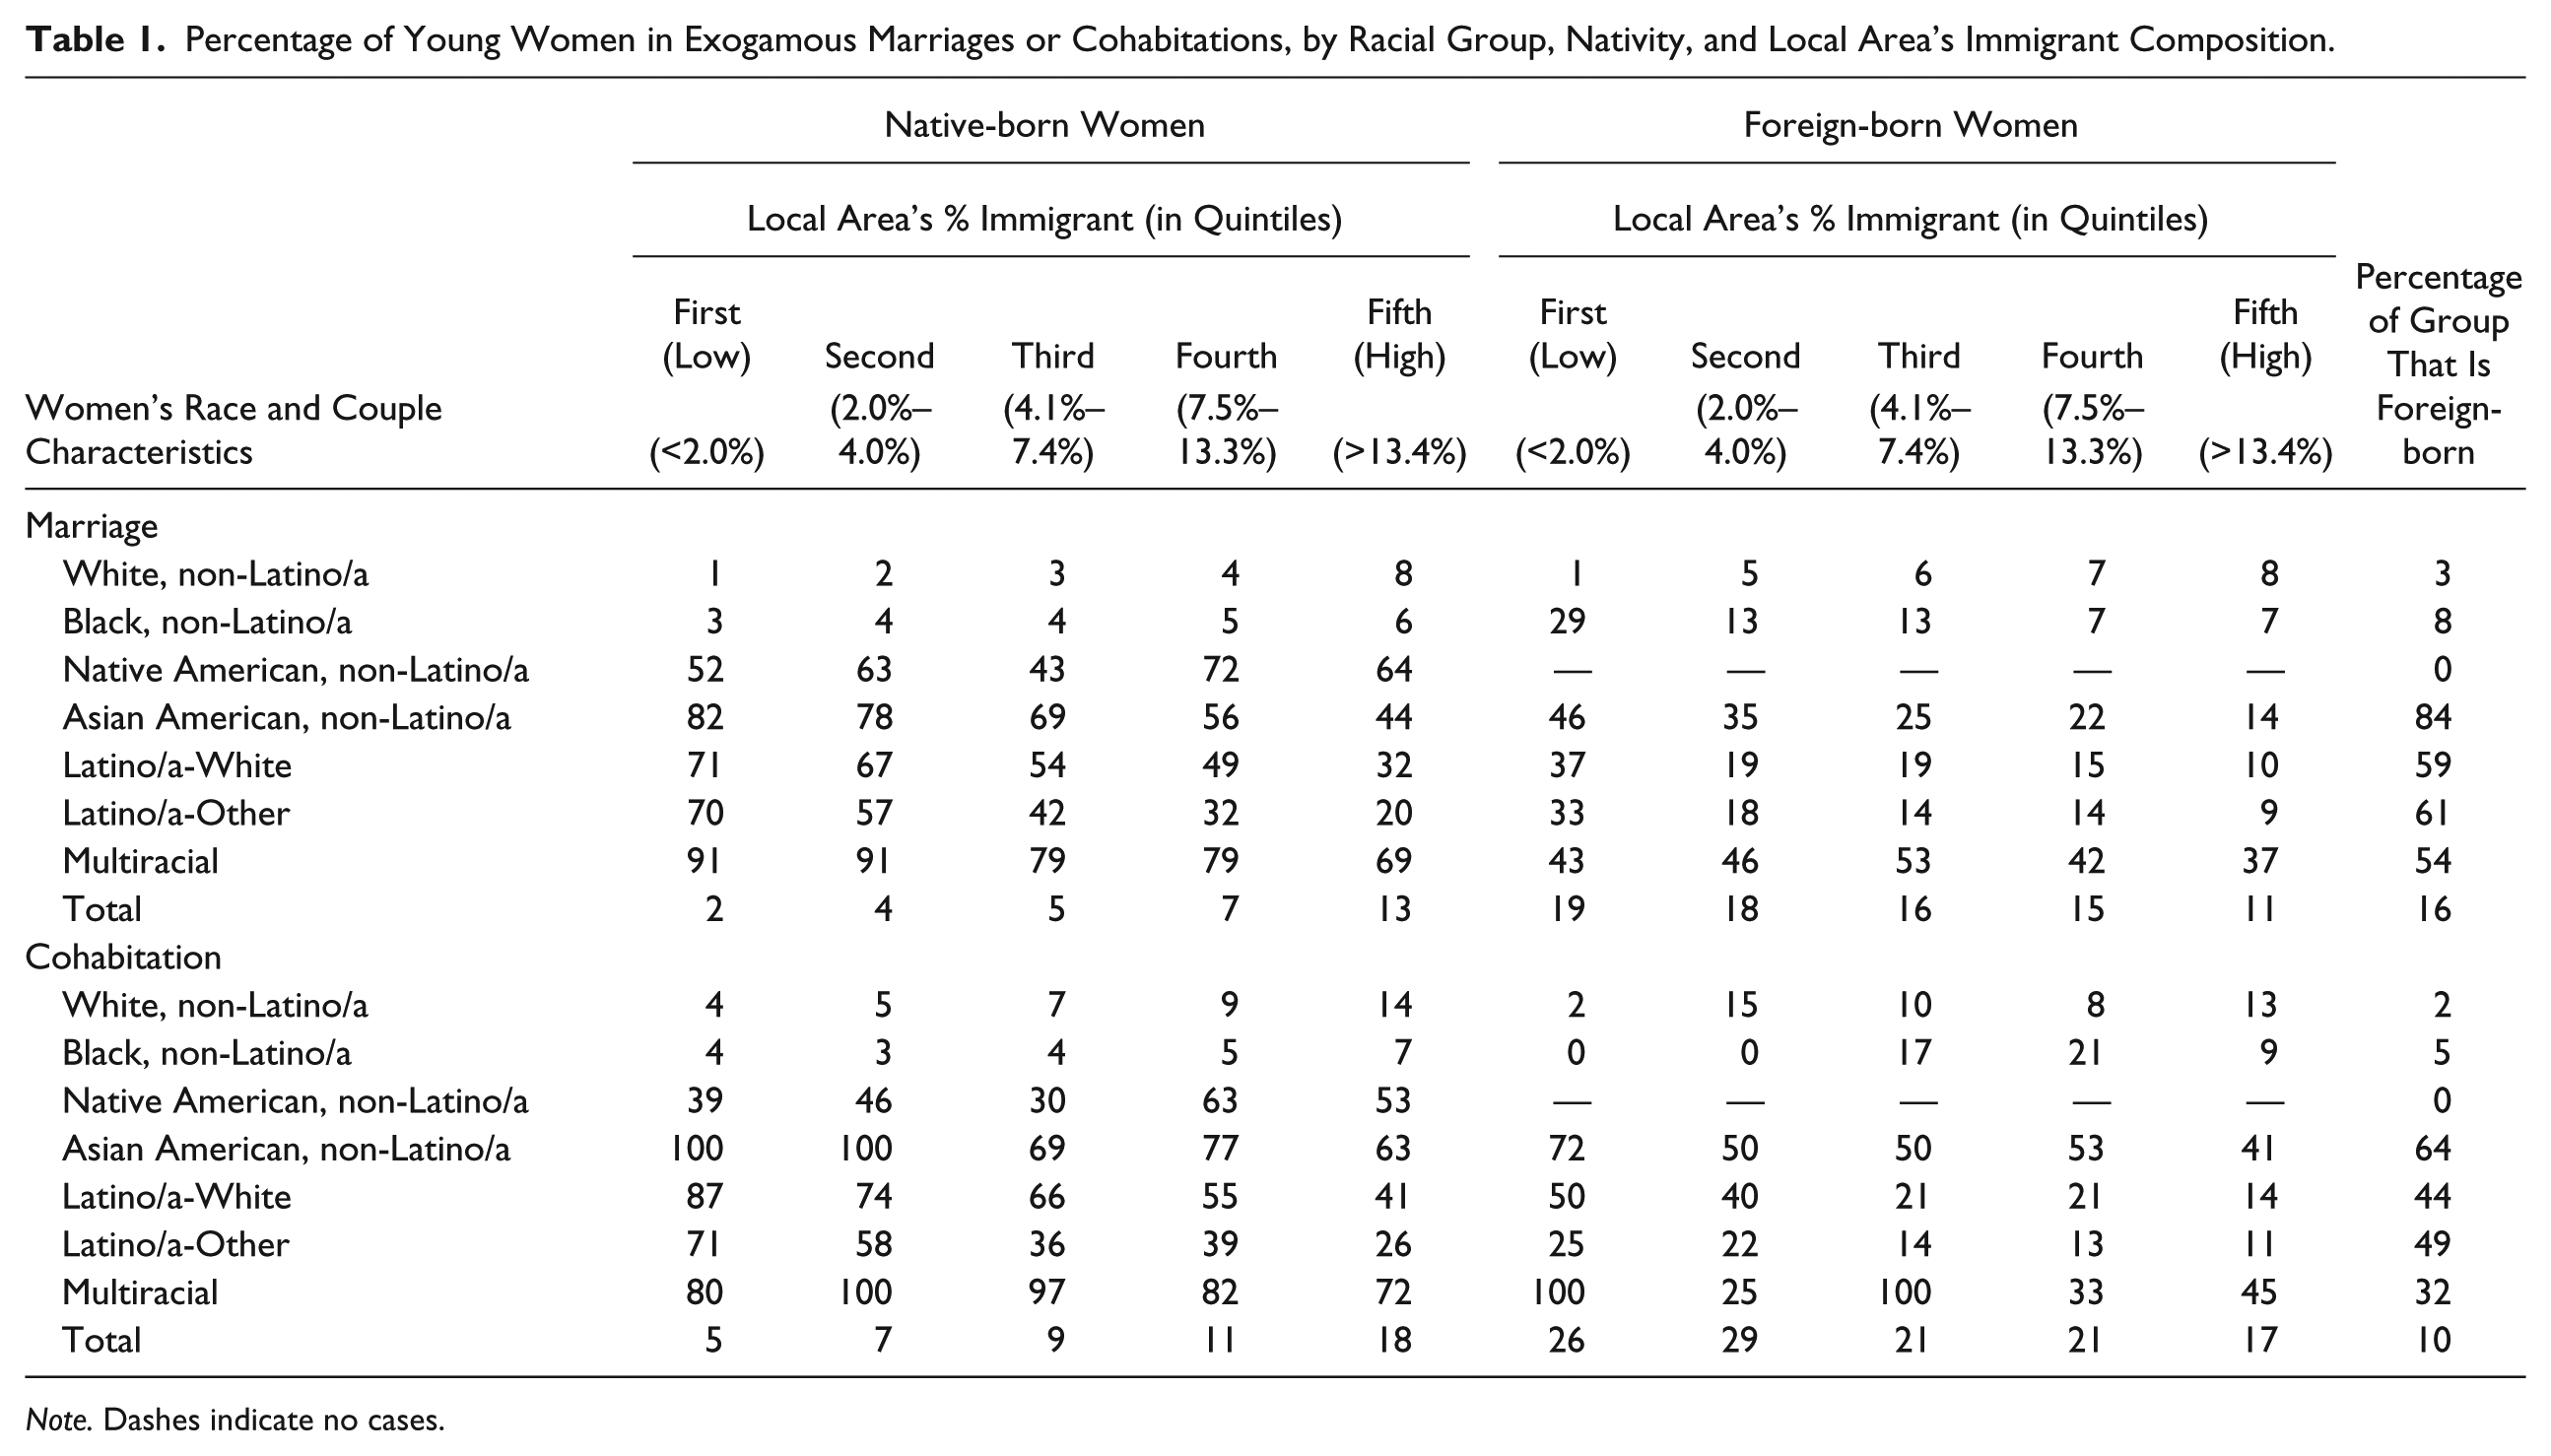
Note. Dashes indicate no cases.
Percentage of the Population in Various Racial/Ethnic and Nativity Groups for Communities Defined by the Sizes of Their Immigrant Population, 2000 Integrated Public Use Microdata Series.
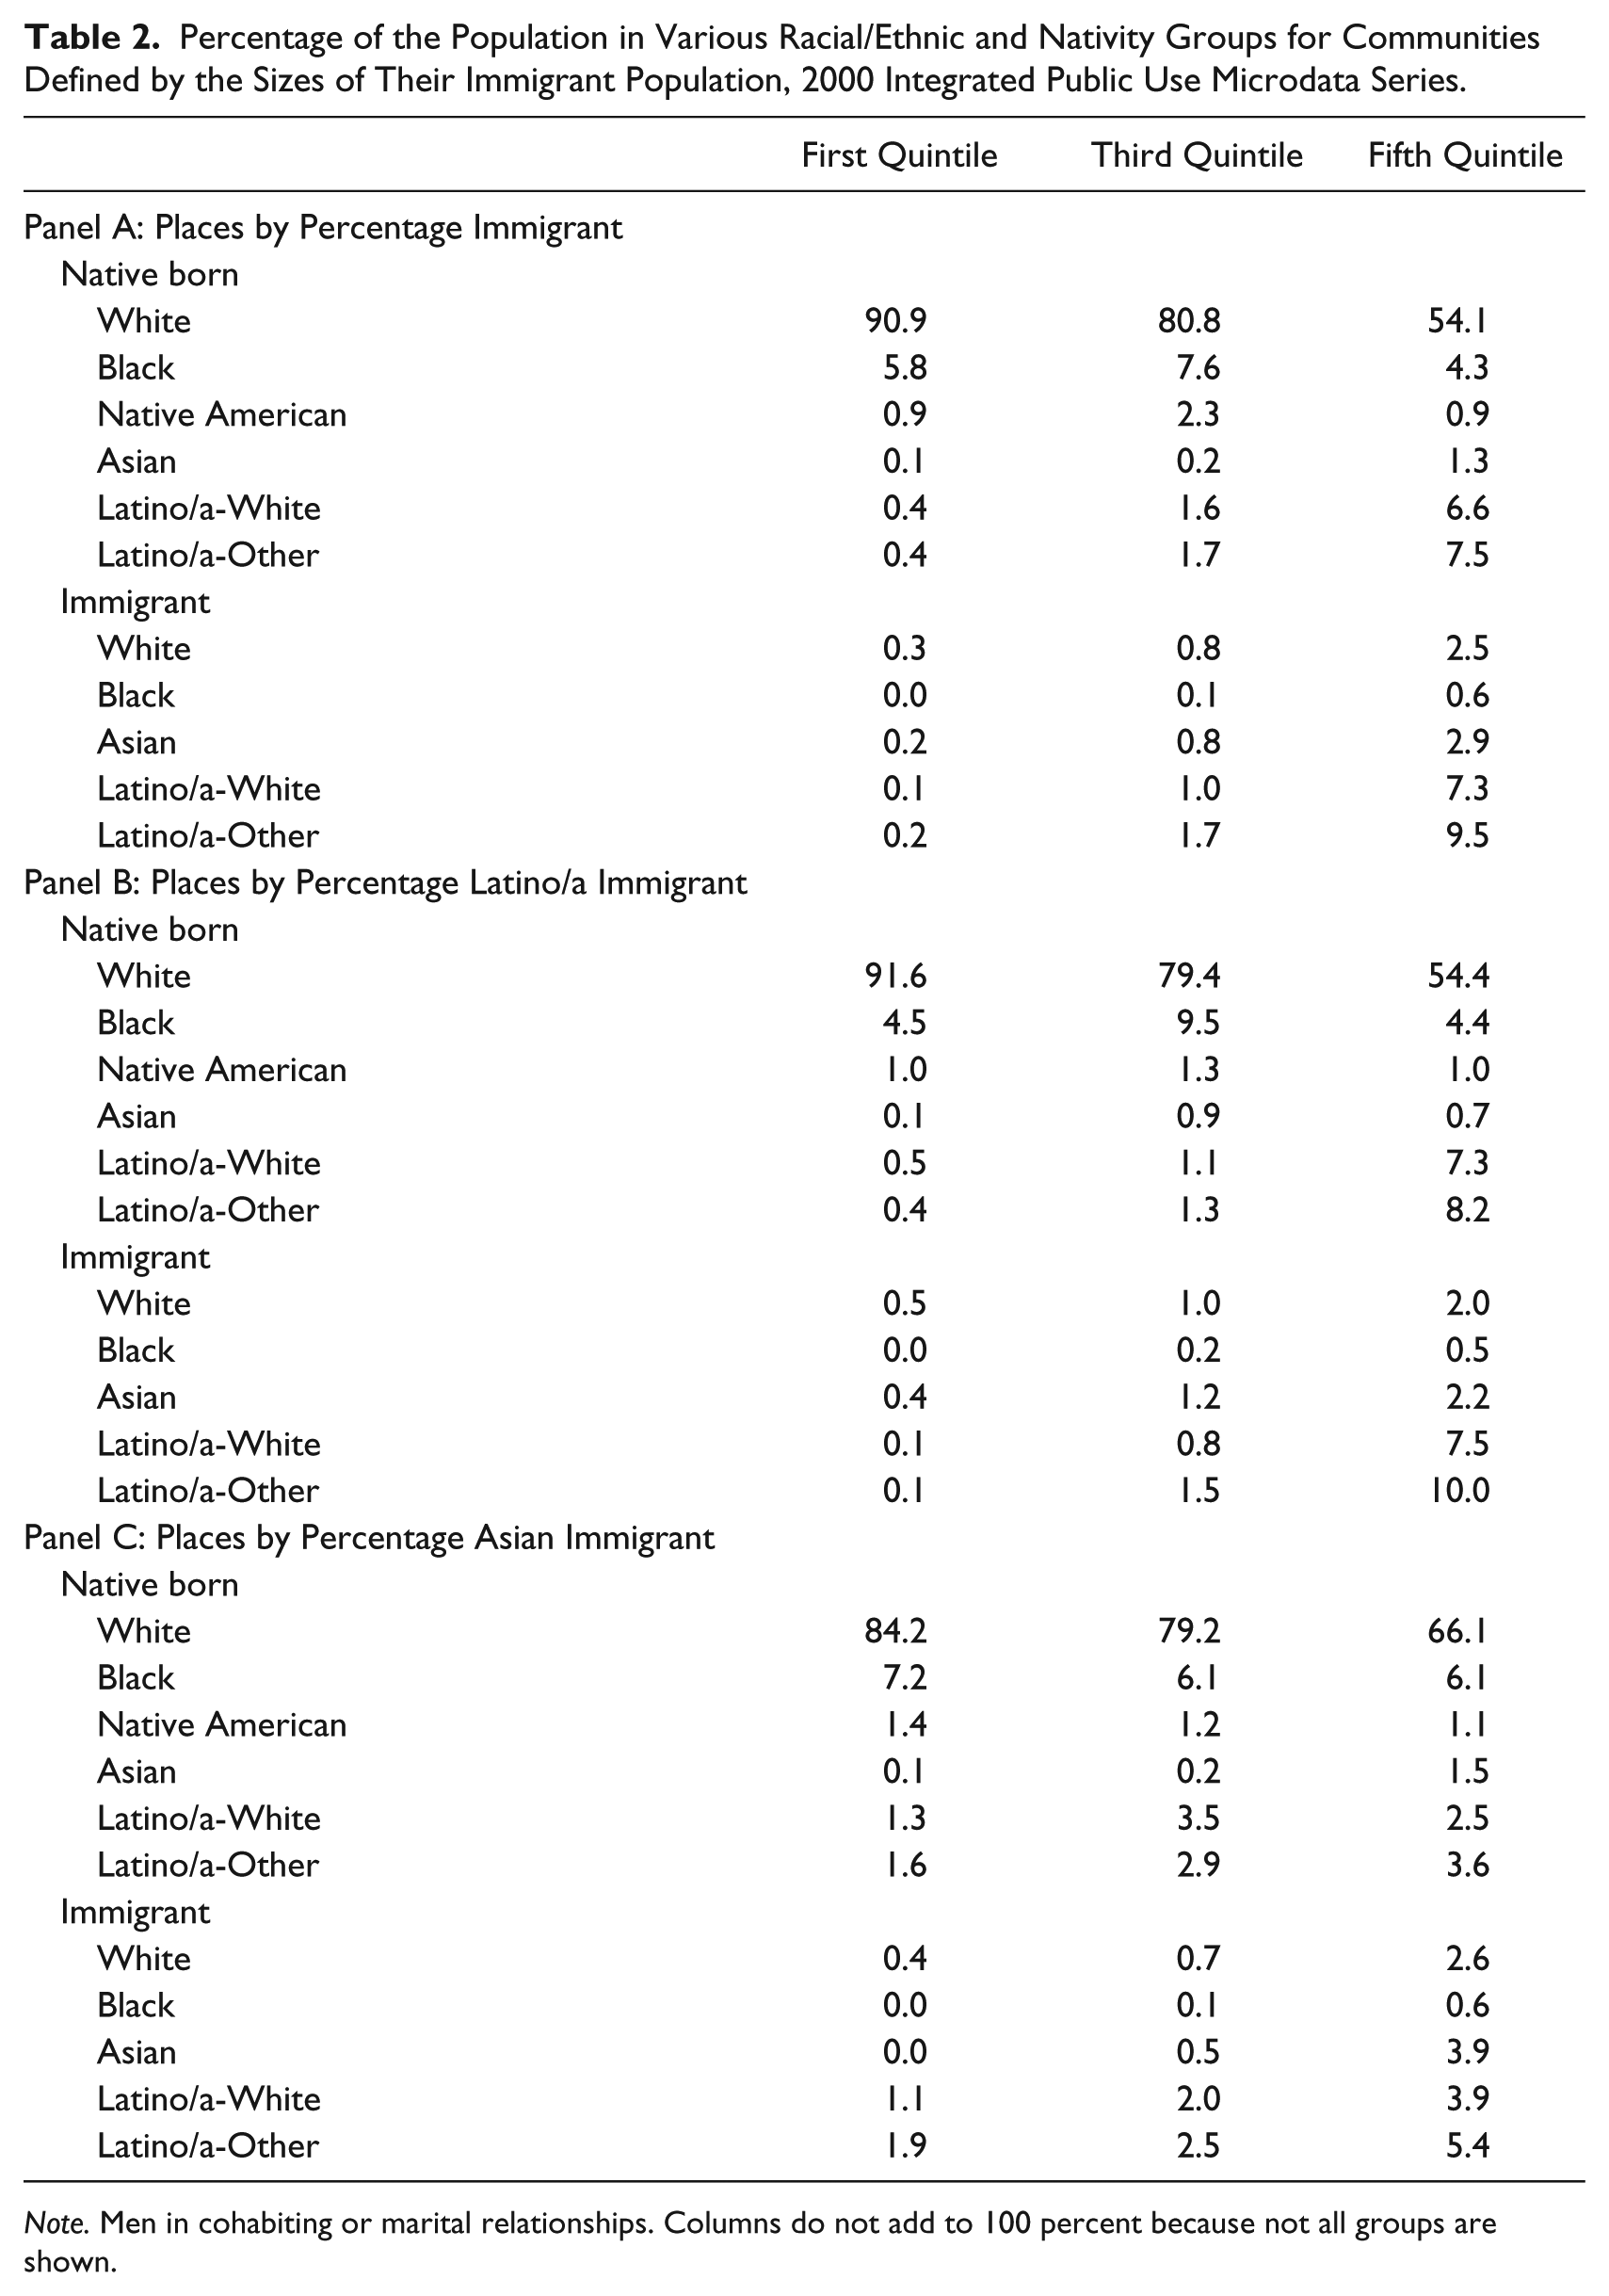
Note. Men in cohabiting or marital relationships. Columns do not add to 100 percent because not all groups are shown.
Differences in the Likelihood of Unions across Local Areas with Varying Proportions of Immigrants (Reference = First Quintile, Lowest Immigrant Areas).
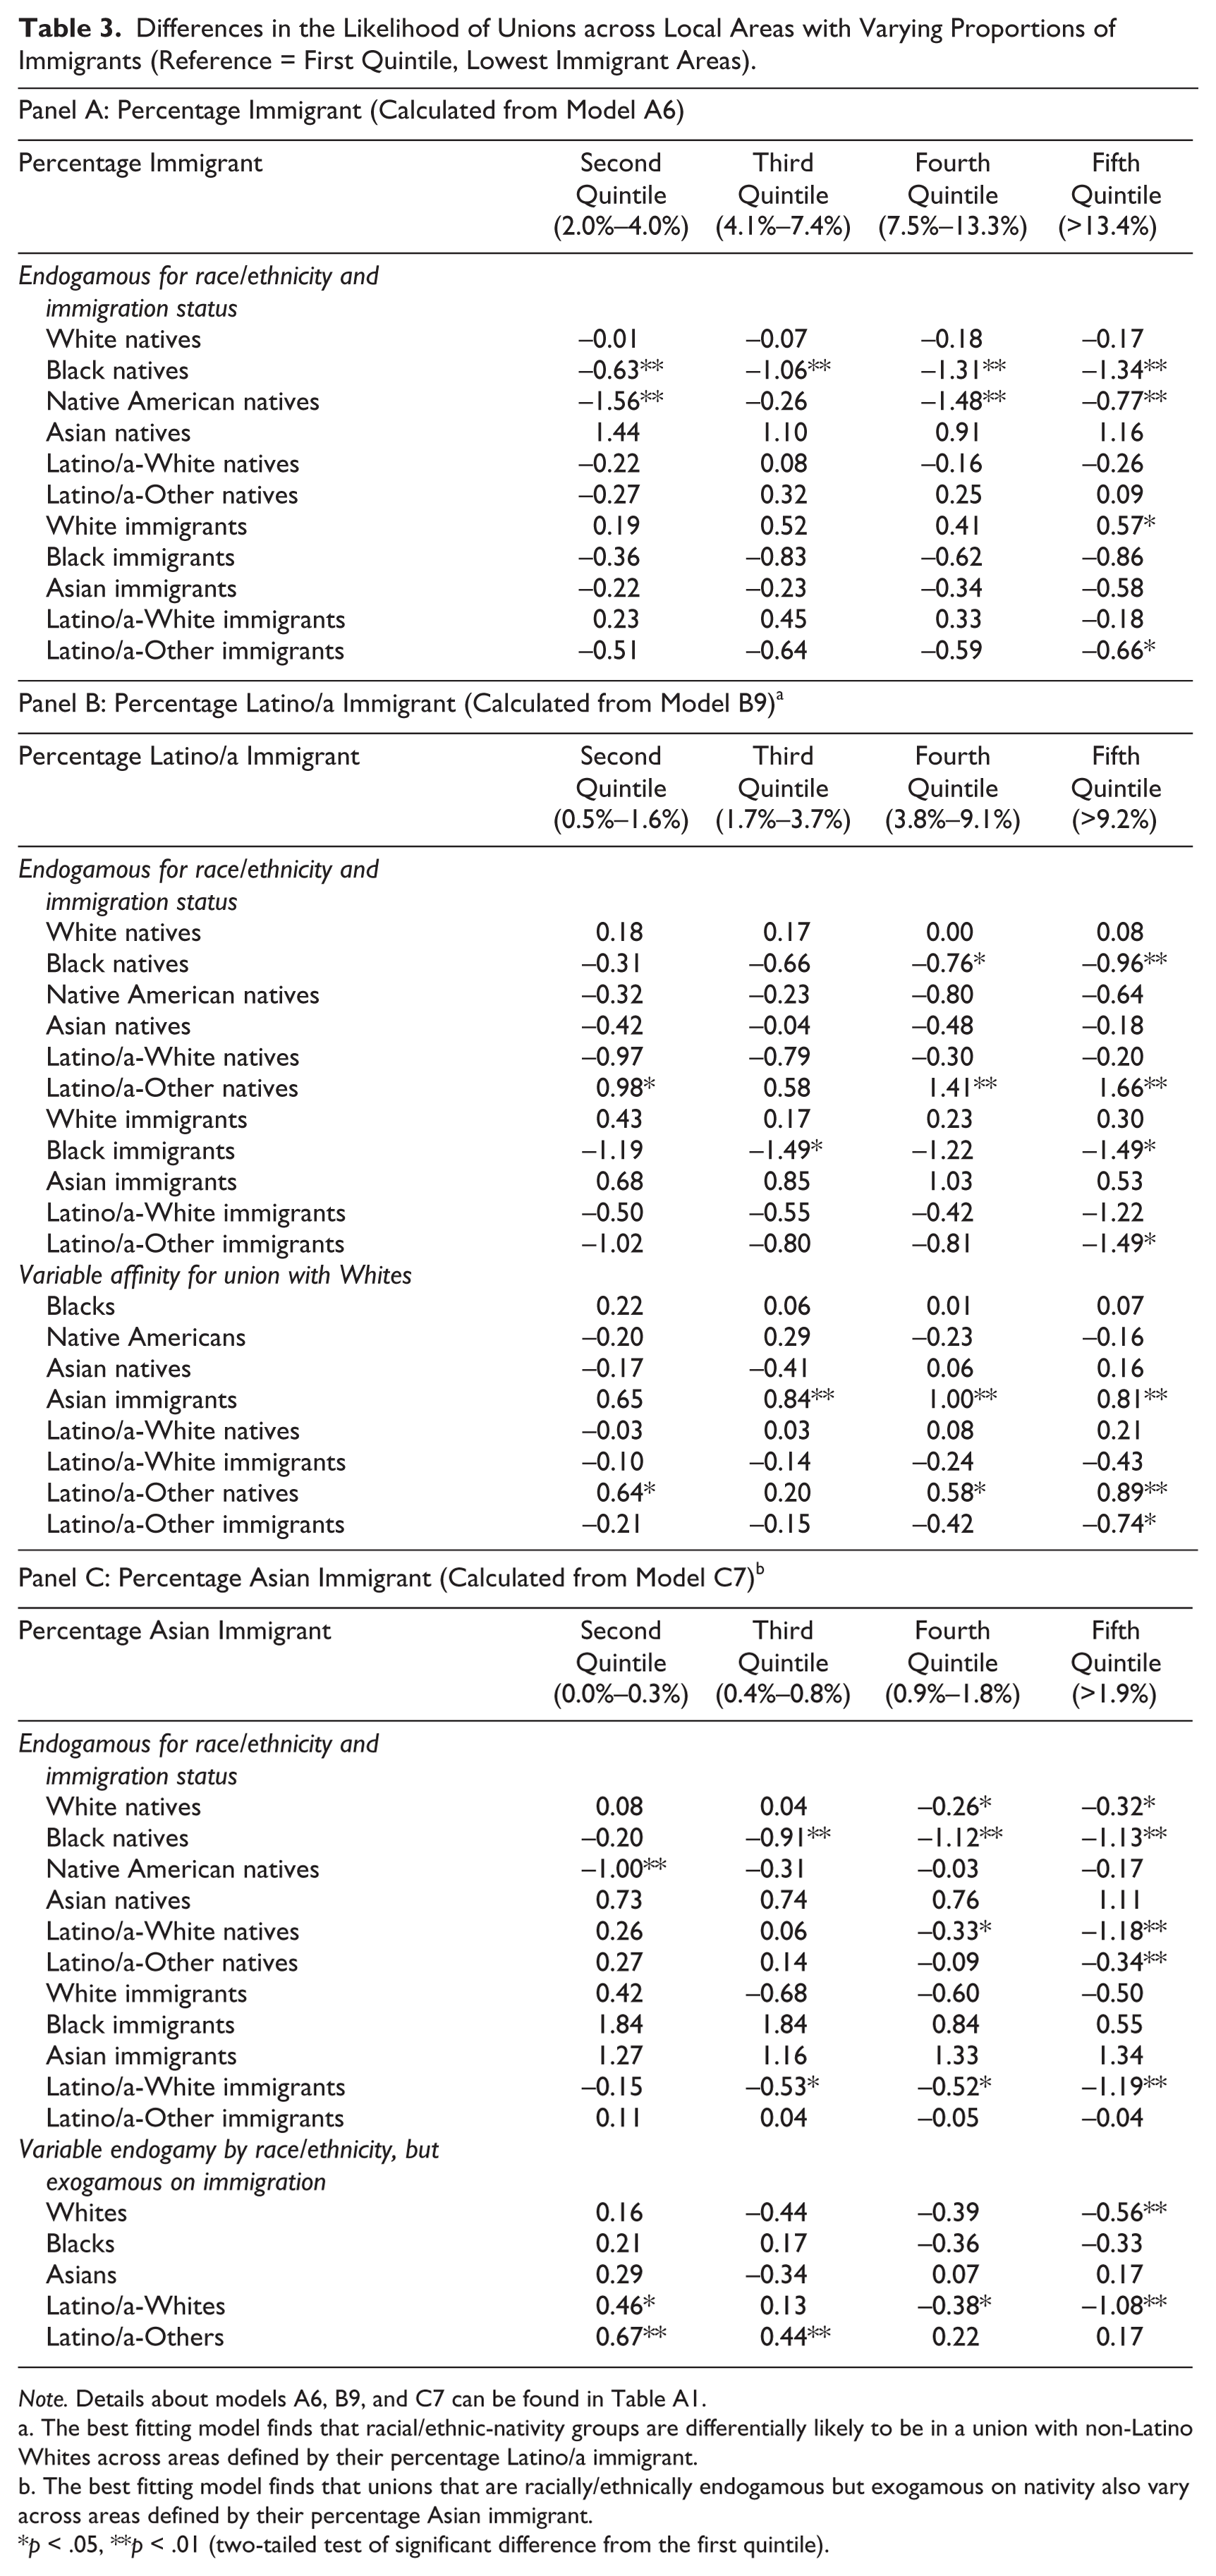
Note. Details about models A6, B9, and C7 can be found in Table A1.
The best fitting model finds that racial/ethnic-nativity groups are differentially likely to be in a union with non-Latino Whites across areas defined by their percentage Latino/a immigrant.
The best fitting model finds that unions that are racially/ethnically endogamous but exogamous on nativity also vary across areas defined by their percentage Asian immigrant.
p < .05, **p < .01 (two-tailed test of significant difference from the first quintile).
Descriptive Frequencies of Exogamy by Individual Nativity and Local Immigration Levels
Smaller percentages of foreign-born Latino/as and Asians are in exogamous unions than their native-born coethnics, as we see in Table 1 (see also Okamoto 2007; Qian and Lichter 2011). Yet regardless of nativity, smaller percentages of Asians, Latino/a-Whites, and Latino/a-Others, are in exogamous cohabitations and marriages if they live in areas with high proportions of immigrants, as expected.
In contrast, larger percentages of foreign-born Whites and Blacks are in exogamous unions than their native-born coethnics. The percentage of U.S.-born, non-Latino/a Whites in exogamous unions steadily increases as the local immigrant population increases. A similar pattern is found among U.S.-born Blacks with regard to marriage, but the pattern is not as linear with regard to cohabitation. Still, the largest percentage of U.S.-born Blacks in exogamous cohabitations occurs in areas with the highest percentage of immigrants (the fifth quintile). For Native Americans, the patterns are nonlinear. The largest percentage of Native Americans in exogamous marriages and cohabitations is found in areas with the second highest levels of percentage foreign-born in their populations (the fourth quintile). Although these percentages are influenced by the size of each group, Table 1 indicates there is important variation in racial endogamy across local areas with different levels of immigration.
Results by Total Percentage Immigrant
Panel A of Table 2 indicates that the foreign-born and native-born Latino/a and Asian populations increase dramatically as percentage immigrant increases. In contrast, the native-born White population monotonically declines as percentage immigrant increases. For native-born Blacks, there is an interesting curvilinear pattern, whereby percentage Black increases between quintiles 1 and 3 but declines thereafter. A similar pattern is observed for Native Americans.
The best fitting log-linear model indicates that endogamy rates vary depending on a community’s percentage immigrant, even after controlling for differences in these communities’ population composition. (Table A1 presents the model-building sequence that identifies this best fitting model.) Panel A of Table 3 provides the coefficients for the likelihood of an endogamous relationship within each racial/ethnic-nativity group across local areas relative to the endogamy rates observed for that group in areas with the fewest immigrants (i.e., the first quintile). Exogamy rates for U.S.-born Asians and Latino/as do not significantly differ according to the percentage of foreign-born persons in their communities. This contradicts hypotheses 1 and 2; immigration does not appear to have altered the likelihood of exogamy for U.S.-born Asians and Latino/as, either positively or negatively. Increases in the sizes of the Asian and Latino/a populations account for the greater frequency of endogamous unions among U.S.-born Asians and Latino/as in places with more immigrants.
Interestingly, Blacks and Native Americans—minority groups with long histories in the United States—are the only native-born groups that differ in their likelihood of being in endogamous unions according to the relative size of the local foreign-born population. For Blacks, we see a monotonic pattern; the more immigrants there are (i.e., the higher the quintile), the less likely native Blacks are to be in endogamous unions. The pattern is less consistent for Native Americans, but this likely reflects the small size of the Native American population and their uneven distribution across places. Because endogamy rates for native-born Whites do not significantly differ, we conclude that the higher prevalence of exogamous unions among native-born Whites in places with more immigrants (in Table 1) is due to differences in the availability of exogamous partners, not a difference in the likelihood of forming an exogamous union net of population size. 14
Results by Percentage Latino/a Immigrant
We now consider how patterns vary according to the concentration of Latino/a immigrants in a community. Panel B in Table 2 demonstrates that there are more native-born Latino/as in places with high percentages of foreign-born Latino/as. In addition, the foreign-born Asian populations are also greater, suggesting these places attract a diversity of immigrants. The native-born Asian American population is greatest, however, in the third quintile for Latino/a immigration. Again, we see that the White native-born population decreases monotonically with increasing Latino/a immigration, while the population patterns for Blacks and Native Americans are curvilinear, with their greatest concentrations in communities in the third quintile.
Our best fitting model defining communities by their percentage Latino/a immigrant finds that endogamy rates for various groups, as well as their rates of forming exogamous unions with Whites, vary according to the size of the local Latino/a immigrant population. (See Table A1 for more details about the model-fitting exercise.) Panel B of Table 3 reports the coefficients from this model. Fitting with hypothesis 1, endogamy rates for Latino/a-Other natives increase as local Latino/a immigration increases, with the greatest endogamy rates found in areas with the highest percentage Latino/a immigrant (the fourth and fifth quintiles). Yet we also find that Latino/a-Other natives are significantly more likely to be in exogamous unions with Whites as Latino/a immigration increases. In sum, it appears that in places with more Latino/a immigration, native-born Latino/a-Others are less likely to form unions with Blacks, Asians and Latino/a immigrants and more likely to be in endogamous relationships or relationships with Whites.
Interestingly, endogamy patterns for Latino/a-White natives (and immigrants) do not vary across communities defined by their percentage Latino/a immigrant. This suggests that Latino/a-White and Latino/a-Other natives experience these contexts differently; Latino/a-Others’ patterns are more sensitive to the local Latino/a immigration context. Dowling (2014) found that those who identified as Latino/a-White often saw that label as emphasizing their Americanness; perhaps individuals who emphasize their connection to America are less influenced by local immigration contexts.
Endogamy rates for native-born Asians, Native Americans, and Whites do not vary with the area’s percentage Latino/a immigrant. Yet, similar to the results in panel A, Black natives’ (and foreign-born Blacks’) endogamy rates decline as the percentage of Latino/a immigrants increases. The declines in Black natives’ endogamy rates are statistically significant only at the highest levels of Latino/a immigration (the fourth and fifth quintiles).
Results by Percentage Asian Immigrant
Panel C of Table 2 shows that native-born Asian American populations are larger in places with the highest levels of Asian immigration. Likewise, the foreign-born Latino/a population also increases monotonically across quintiles. The native-born Latino/a-White population is largest in the third quintile, while the native-born Latino/a-Other population is largest in the fifth quintile. Whites again decrease monotonically across quintiles, as do Native Americans, while the Black population levels off at the third quintile.
When we model communities according to their percentage Asian immigrant, our best fitting model again finds endogamy rates vary across local areas, as does the likelihood of being in a union that is endogamous on race/ethnicity but exogamous on nativity. (See Table A1.) Panel C of Table 3 reports the coefficients from that model. In contrast to hypotheses 1 and 2, endogamy rates for U.S.-born Asians do not vary according to the size of the local Asian immigrant population. Thus, declines in the percentage of U.S.-born Asians in exogamous unions over the 1990s can be explained by the changes in the availability of coethnic partners, not changes in the relative risk of exogamy. In addition, there is no significant variation in the likelihood that Asian relationships will be exogamous on nativity (i.e. Asian native-Asian immigrant pairs) across places.
Instead, exogamy rates vary for non-Asian groups. In areas with the highest levels of Asian immigration, all Latino/a-Whites and Latino/a-Other natives are less likely to be in endogamous unions. The fifth quintile for Asian immigration is, however, disproportionately composed of very large cities (more so than the fifth quintiles for percentage immigrant and Latino/a immigrant). Thus, it also possible that something about large cities (with particular kinds of partnering opportunities, dense living spaces, greater reliance on public transportation, etc.) could encourage Latino/a-Whites and Latino/a-Other natives to be more exogamous. In the highest quintiles for percentage Asian immigrant, Latino/a-Whites are also less likely to form unions that are endogamous on race/ethnicity but exogamous on nativity.
As we saw previously in panels A and B, endogamy rates for Black natives significantly decline as the level of Asian immigration increases, especially for Blacks living in communities in the third quintile or higher. For Native Americans, the patterns are consistently in the same direction, but the differences are largest and only statistically significant for Native Americans in the second quintile. Non-Latino/a White natives living in areas with the highest concentrations of Asian immigrants (i.e., quintiles 4 and 5) are less likely to be in endogamous unions than non-Latino/a Whites natives living in areas without any Asian immigrants (i.e., quintile 1). Yet, as noted earlier, this finding could be driven by differences in union formation in very large cities.
Comparing Findings for Asians and Latino/as across Our Three Measures of Local Immigration
Although we have strong theoretical reasons for characterizing local areas using these three definitions of their immigrant profiles, we find that the best fitting model overall (i.e., between all the measures of immigration used) is model A6 in Table A1, which uses the area’s total percentage immigrant. This gives us greater confidence in the results from that model, which finds no significant differences in endogamy rates for native-born Latino/as or Asians by the area’s percentage immigrant. This contradicts both hypotheses.
Comparing across the three panels of Table 3, we find a consistent pattern whereby endogamy rates for Asian natives are insensitive to the composition of the local area, but inconsistent results for Latino/a natives. Fitting with our second hypothesis, Latino/a-White natives have lower endogamy rates in areas with large Asian immigrant populations. Native-born Latino/a-Others display a complex pattern; they have higher endogamy rates (consistent with our first hypothesis) and higher exogamy rates with Whites in communities with fairly large Latino/a immigrant populations, and lower endogamy rates (consistent with hypothesis 2) in communities with the highest percentages of Asian immigrants.
Discussion and Conclusion
We sought to discover the relationship between the size of a local immigrant community and the endogamy patterns of U.S.-born Latino/as and Asian Americans. The results hinge on how we measure immigration. On one hand, we do not find that a larger percentage immigrant (overall) in a community is related to significantly greater endogamy rates for U.S.-born Latino/as and Asians, once we control for the average size of each ethnicity-nativity group in each quintile. These results align with Qian and Lichter’s (2007) national findings.
On the other hand, we find one significant difference among native-born Latino/a-Others when we use ethnic-specific measures of immigration. In particular, in areas with larger Latino/a immigrant populations, we find greater endogamy rates for native Latino/a-Others combined greater exogamy rates with non-Latino/a Whites. Yet endogamy rates for U.S.-born Latino/a-Whites do not vary according to the size of the Latino/a immigrant population, and U.S.-born Asians’ endogamy rates do not vary according to the size of the Asian immigrant population. This inconsistent pattern suggests that for U.S.-born Latino/a-Whites and Asians, the declines in the prevalence of exogamous unions over the 1990s were driven by a demographic process of increasing group size through immigration. For Latino/a-Others, the size of the Latino/a immigrant population appears to additionally shape behaviors and increase their likelihood of forming endogamous unions and unions with Whites.
Thus, it appears that Latino/a-Others’ union formation patterns are relatively more sensitive to their local community’s immigration context. This could suggest that this group is at the leading edge of changing racial boundaries in the United States. Theorists like Bonilla-Silva (2004) have argued that the United States is changing in ways that make it more like Latin America, with a three-tiered racial system in which Whites, “honorary Whites,” and the “collective Black” develop new boundaries on the basis of socioeconomic characteristics, skin tone, and feelings of collective identity. Latino/a-Others are uniquely situated in this evolving racial system: they reject standard U.S. racial labels, have (on average) lower socioeconomic standing than those who identify as Latino/a-White (Tafoya 2004), and we see here that they engage in union formation patterns that depend to a greater extent on the community context.
Alternatively, the results for Latino/a-Others could reflect a different process, where the social context of a local area shapes how individuals respond to the census question about race. In places with high levels of Latino/a immigration, it is possible that more native-born Latino/as who are married to other Latino/as or who are married to Whites come to believe that the standard racial categories available to them in the census question do not apply and therefore choose “other race.” Research using a different question format demonstrates that respondents who live in metropolitan areas with larger Latino/a populations are less likely to identify as multiracial (e.g., White and Latino/a) and more likely to choose only a Latino/a identification (Campbell and Rogalin 2006). Furthermore, recent research on the racial identification of Latino/as suggests that racial identification (at least for Mexican Americans in Texas) generally does not indicate skin tone but rather attitudes toward race, racism, and the United States. Dowling (2014) found that those who identified as Latino/a-White generally saw that choice as emphasizing their “Americanness.” Yet Latino/as living in communities with many other Latino/as may not feel that the only way to be “American” is to be “White.” Therefore, Latino/as in these contexts in same-race or interracial relationships with Whites may feel that they can choose a Latino/a-Other identity without compromising a U.S. national identity.
In sum, with the notable exception of the findings for Latino/a-Other natives when we examine the level of Latino/a immigration, our findings primarily support Qian and Lichter’s (2007) hypothesis: local increases in the size of the Latino/a and Asian populations led to declines in the percentage of U.S.-born Asians and Latino/as in endogamous unions during the 1990s.
Some of our most unexpected findings are about differences among native-born Blacks and Native Americans. Endogamy rates for native-born Blacks and Native Americans decline and their exogamy rates increase as percentage immigrant increases. Thus, areas with high levels of immigration are associated with a shift in the rigidity of the color line for America’s oldest minority groups, even after controlling for average population composition differences. Our model fit results suggest that Black natives and Native Americans are no more likely to be in unions with non-Latino/a Whites in high immigrant areas. The percentage of native-born Blacks and Native Americans in unions with immigrants of a different race increases as the percentage immigrant in the community increases (statistics available on request). Although we do not have the statistical power to test it in the log-linear models, the implication is that native-born Blacks and Native Americans are more likely to be in unions with other minority groups in communities with high percentage immigrant. If this is indeed occurring, the color line may be shifting among America’s minority groups, but not necessarily relative to native-born Whites.
We are left to speculate about why U.S.-born Blacks and Native Americans are more likely to form exogamous unions in places with high percentages of immigrants. It could be that there are more social opportunities to partner with members of other ethnicities if there is relatively greater integration of organizations, neighborhoods, or social spaces in areas with more immigrants. Alternatively, the findings could instead reflect other characteristics of these places, such as their sizes, cultural milieus, or historical policies and politics. We encourage future research to explore these explanations.
We focus on U.S.-born Americans (while including all groups in the analysis) because we are interested in how their union formation patterns are responding to the influx of immigrants, and we can rest assured that the majority of these unions were formed in the United States. A key limitation of our data, however, is that we cannot know for certain whether these unions for U.S.-born individuals were formed in the communities where we observe them. People may be more likely to form exogamous unions if they live in more diverse communities (Rosenfeld and Kim 2005). Alternatively, exogamous couples may migrate to more diverse communities after forming their unions, seeking diverse communities. We attempt to minimize this risk by focusing on young adults, but young adults also have relatively high rates of residential mobility compared with older age groups (Geist and McManus 2008). These observed patterns are descriptive and cannot adjudicate causality.
We are also mindful that the community’s level of immigration is only one characteristic of that place and that other characteristics likely shape exogamy patterns in important ways. For example, large urban areas are overrepresented in the category of places with the most immigrants and nonurban areas are overrepresented in the category with the fewest immigrants. This disparity is the most extreme when we categorize places by their levels of Asian immigration. Some of what appears to be patterns related to immigrant population size in these analyses could be due at least in part to the social, economic, and political differences between large urban and smaller rural places. (See note 11 for two examples of community-level characteristics we tested.) Similarly, some places with large immigrant populations have long histories of migration, while others are “new destinations,” and these different local areas might perceive the same immigrant population size very differently (Lee and Bean 2010).
Third and finally, we cannot model differences in endogamy by generation among the native-born sample members (i.e., differences between the second and third or higher generations), because census data do not include the birthplace of the respondent’s parents. If members of different generations are affected in opposite ways by the immigrant composition of their local communities (e.g., if the second generation is more endogamous in areas with more immigrants, and the third generation is less endogamous), then these opposing patterns could cancel themselves out in our analysis of all native-born Latino/as and Asians. This is important given Lichter et al.’s (2011) finding that a higher percentage of second-generation Latino/as were married to immigrants relative to third-generation Latino/as. We encourage future research to explore these possibilities with additional data.
Despite these limitations, the present analysis makes several contributions. First, we explore variation in the likelihood of being in an endogamous union across American communities according to the community’s percentage total, Latino/a and Asian immigrant for both cohabitations and marriages, testing hypotheses about the role of immigration in changing the prevalence of exogamous unions for U.S.-born Latino/as and Asians. In addition, nonmetropolitan areas (which make up over half of our sample of communities) are usually not included in prior research focusing on local communities. Our study shows that although the likelihood of endogamy decreases for U.S.-born, non-Latino/a Blacks and Native Americans in high-immigrant-receiving communities, endogamy rates are unchanged for U.S.-born Latino/a-Whites and Asians in communities with relatively high levels of Latino/a or Asian immigrants. Results for U.S.-born Latino/a-Others are complex when we focus on the percentage of Latino/a immigrants in a community, but they exhibit no differences in their endogamy or exogamy rates when we measure the community’s total immigrant stream. Our findings also point to the significance of the community’s immigrant context for the exogamy patterns of Blacks and Native Americans, two groups rarely discussed in the context of immigration. Our results demonstrate that these two long-standing U.S. groups are not only affected by the demographic and attitudinal changes the United States is undergoing but in ways that are distinct from the shifts experienced by native-born, non-Latino/a Whites.
Footnotes
Appendix A: Model Building and Fit Statistics
In the models, let Fij denote the expected number of partnerships between men in racial category i and women in racial category j. Men’s (women’s) racial category is represented by β i MR (β j FR). We begin with the marginal model for race (log Fij = β0 + β i MR + β j FR), to which we add a (diagonal) parameter for racial endogamy (β d R) if i = j. Next we include an affinity parameter for the exogamous coupling between Whites and minorities. Finally, we test variable diagonal models and variable affinity models. To determine which model best describes these data, we use log likelihood and Bayesian information criterion (BIC) statistics. The BIC is a penalized χ2 statistic that adjusts for sample size (Raftery 1995). The more negative the BIC, the better the fit of the model. To compare two models, regardless of whether they are nested, one takes the difference of their BIC values. The model with the smaller BIC is preferred, such that differences in BIC of 2 or more provide positive evidence, 6 or more provide strong evidence, and 10 or more provide very strong evidence (Raftery 1995).
Before developing our models focused on the 643 local areas in our data, we successfully replicated Qian and Lichter’s (2007) national findings (available on request). Panel A of Table A1 summarizes the model fit for 11 × 11 × 5 models in which the areas are divided into quintiles defined by total percentage immigrant and there are 11 racial/ethnic-nativity groups (see Table 3 for the list of the 11 native- and foreign-born groups). The first four models (A1 to A4) build on one another to ultimately recreate the national racial/ethnic-nativity patterns observed when we replicate Qian and Lichter’s (2007) national models.
Model A5 allows the racial/ethnic-nativity composition of places to vary across each immigration quintile (i.e., to account for the average differences in racial/ethnic-nativity composition documented in panel A of Table 2). This addition results in a dramatic improvement in fit. Model A6, the best fitting model of this panel, adds parameters to allow racial/ethnic endogamy patterns to vary depending on the area’s level of immigration. Model A7 tests whether endogamy among couples who share the same race/ethnicity but differ in their nativity also varies across local areas defined by their immigrant population. This leads to a loss of model fit, which implies, interestingly, that the proclivities to be in a relationship of the same race/ethnicity, regardless of nativity, are fairly uniform across communities with few or many immigrants. Model A8 tests our expectation that minorities’ exogamy with Whites (the affinity parameters) also varies across areas with different areas’ immigrant profiles, and model A9 tests whether the gender difference in the likelihood that an Asian individual is in a relationship with a White person also varies by local immigration levels. These additional complexities result in a loss of model fit. These results are robust to the exclusion of couples living in partially identified metropolitan areas.
Models B1 through B9 repeat the modeling sequence described above, with areas now defined by their percentage Latino/a immigrant. For these models, the best fitting model is model B9, which suggests that racial/ethnic-nativity endogamy and each group’s exogamy with Whites varies across communities according to their percentage Latino/a immigrant. These results are robust to the exclusion of couples living in metropolitan areas with 10 percent or more of their population not identified, but if we exclude couples living in all partially identified metropolitan areas, the best fitting model is B6, which parallels A6, the best fitting model using the total percentage immigrant.
Panel C of Table A1 again repeats the model-building sequence, now defining area quintiles by the percentage of the local area who are Asian immigrants. The best fitting model using percentage Asian immigrant is C7, suggesting that racial/ethnic-nativity endogamy varies across local areas defined by their percent Asian immigrant, as does the likelihood of being in a union that is endogamous on race/ethnicity but exogamous on nativity. This result is robust to the exclusion of couples living in any partially identified metropolitan areas.
Appendix B: Log-linear Models by Union Type
We also conduct an additional model sequence to test for differences across union type, addressing possible differences across heterosexual cohabitations and marriages. Cohabiting unions are increasingly important given their growth over the past 40 years (Kennedy and Bumpass 2008). The barriers to exogamy in cohabiting unions are lower than the barriers in marital unions, so we predict that native-born Asians and Latino/as in cohabiting unions will be more likely to be in exogamous relationships than those who are married.
These models explore the intersection of the male partner’s race/ethnicity-nativity, the female partner’s race/ethnicity-nativity, the local area’s percentage immigrant, and whether the couple is in a marital or cohabiting union. The results are presented in Table B1. The first model, A11, begins with model A2 from Table A1 and adds an interaction between individuals’ race/ethnicity-nativity and the relationship type. This results in a significant improvement in fit relative to model A2. Model A12 improves model fit significantly with the addition of parameters that relax the assumption that racial endogamy is the same in cohabitations and marriages. Model A13 improves the fit again with parameters that relax the assumption that unions that are racially endogamous but exogamous on nativity have the same frequency for both types of unions. Finally, model A14, our best fitting model, includes parameters that allow the probability of partnerships between Whites and racial minorities to vary across relationship type. We do not examine whether these patterns differ further across areas’ immigrant composition, because we have no theoretical reason to expect it. Our best fitting model aligns with prior research in finding greater endogamy within marriages than cohabitations for all racial/ethnic-nativity groups. Furthermore, the racial groups with the most endogamous marital patterns (i.e., Black immigrants, Asian immigrants, and Black natives) are also the groups most likely to form endogamous cohabiting relationships. This demonstrates the primacy of racial patterns across union types and suggests that individuals use similar racial/ethnic-nativity decision rules when choosing marital and cohabiting partners.
Acknowledgements
We would like to thank Sanghag Kim and Jason Houle for their research assistance.
Funding
The author(s) disclosed receipt of the following financial support for the research, authorship, and/or publication of this article: Dr. Martin’s work on this project was supported by grants R24-HD041025 (Van Hook, principal investigator) and P01HD062498 (Landale, principal investigator), both funded by the Eunice Kennedy Shriver National Institute of Child Health and Human Development (NICHD).
Notes
Author Biography
References
Supplementary Material
Please find the following supplemental material available below.
For Open Access articles published under a Creative Commons License, all supplemental material carries the same license as the article it is associated with.
For non-Open Access articles published, all supplemental material carries a non-exclusive license, and permission requests for re-use of supplemental material or any part of supplemental material shall be sent directly to the copyright owner as specified in the copyright notice associated with the article.