
Abstract
The history of the U.S. housing market is bound up in systemic, explicit racism. However, little research has investigated whether racial inequality also persists in the contemporary appraisal industry and, if present, how it happens. The present article addresses this gap by centering the appraisal industry as a key housing market player in the reproduction of racial inequality. Using a census of all single-family tax-appraised homes in Harris County (Houston), Texas, the authors examine the influence of neighborhood racial composition on home values independent of home characteristics and quality; neighborhood housing stock, socioeconomic status, and amenities; and consumer housing demand. Noting that substantial neighborhood racial inequality in home values persists even when these variables are accounted for, the authors then use ethnographic and interview data to investigate the appraisal processes that enable this inequality to continue. The findings suggest that variation in appraisal methods coupled with appraisers’ racialized perceptions of neighborhoods perpetuates neighborhood racial disparities in home value. The authors conclude with suggestions for future research and policy interventions aimed at standardizing the appraisal process.
The history of the U.S. housing market is bound up in systemic, explicit racism, particularly with respect to the mortgage lending, real estate brokerage, and residential appraisal industries (Gotham 2014; Jackson 1985; Kahrl 2016; Massey and Denton 1993; Stuart 2003). Despite improvements after the passage of fair housing legislation, recent research has demonstrated persistent racial inequality in the mortgage lending and real estate brokerage industries (Besbris and Faber 2017; Botein 2013; Fisher 2009; Korver-Glenn forthcoming; Oliver and Shapiro 2005; Rugh and Massey 2010; Rugh, Albright, and Massey 2015). However, few scholars have investigated whether racial inequality also persists in the contemporary appraisal industry and, if present, how it happens.
We address this gap in two ways. First, we center the appraisal industry as key to the contemporary housing exchange process. Although the appraisal industry is entwined with both real estate brokerage and mortgage industries, it cannot be reduced to either of them. It is thus important to examine the appraisal industry in its own right, while acknowledging the relations between different housing exchange domains (Stuart 2003). We highlight the appraisal industry’s role in the housing market by outlining how it was institutionalized and systematized by the Federal Housing Administration (FHA) in the mid-twentieth century (Jackson 1985) and trace its influence into the present (Stuart 2003; U.S. Government Accountability Office 2012).
Second, we examine whether inequality across racially distinct neighborhoods characterizes the contemporary appraisal industry and, if so, how. We pursue this line of inquiry because a small body of research examining (largely homeowner-reported) home values in the post–fair housing era demonstrates systematic differences in home values across neighborhoods with different racial landscapes, independent of other important factors such as neighborhood socioeconomic status (Anacker 2010; Coate and Schwester 2011; Flippen 2001, 2004; Harris 1999; Kim 2000; LaCour-Little and Green 1998). Our study builds on this evidence by using a mixed-methods approach with data collected from tax appraisals and appraisers to determine the influence neighborhood racial composition has on home value, independent of other important factors such as home features and quality, neighborhood housing stock, socioeconomic status and amenities, and housing demand. We also examine the process of assessing value and how neighborhood racial composition influences the assessment of home value.
Using data collected in 2015 from Harris County (Houston), Texas, we find systematic differences in home value by neighborhood racial composition, above and beyond measures of individual home features and quality as well as neighborhood housing stock, socioeconomic status, amenities, and housing demand. We also find that despite the institutionalization of the appraisal industry (i.e., home appraisals are required for mortgages), methods for finding data used to assess home value vary across appraisers. This lack of standardization enables appraisers’ racialized assumptions to influence the assessment of home values. We conclude by discussing the implications of our findings for the reproduction of racial inequality in municipal service provision and wealth accumulation, and suggest policy interventions that could help interrupt contemporary, appraisal industry-supported links between neighborhoods, race, and home value.
The Appraisal Industry: A Key Player in the Housing Market
From its origins, the appraisal industry has played a critical role in shaping the landscape of mortgages and homeownership (Stuart 2003). Starting in 1935, the FHA required all home buyers who were applying for federally insured mortgages to receive a home appraisal. By systematizing and institutionalizing the practice of appraising home value, 1 the FHA hoped to ensure that mortgage amounts accurately reflected the market (or exchange) value of the home.
In the 1980s, the U.S. Department of Housing and Urban Development, Fannie Mae, and appraisal societies, including the American Institute of Real Estate Appraisers and the Society of Real Estate Appraisers, further systematized the appraisal process by creating the 1986 Uniform Residential Appraisal Report and 1989 Uniform Standards of Appraisal Practice. These documents ensured that all appraisers complied with a uniform definition of market value that specified that appraisal values should be “the most probable price” in an open and fair sale (Stuart 2003:219). Congress reinforced this institutionalization by passing the Financial Institutions Reform, Recovery, and Enforcement Act in 1989, which required states to adopt licensing standards for appraisers (Stuart 2003).
U.S. mortgage lenders continue to rely on the appraisal industry to assess home value and, subsequently, the value and terms of mortgage loans (Stuart 2003; U.S. Government Accountability Office 2012). In fact, legislation passed in 2010 as a response to the recent housing crisis sought to lessen collusion between the appraisal and mortgage lending industries, increasing the independence and salience of appraisals in the housing market (U.S. Government Accountability Office 2012). Appraisers’ evaluations of home values influence mortgage loan terms (for home buyers) and wealth accumulation (for home sellers) (Stuart 2003). Additionally, appraised home values are used by municipalities to collect property taxes, which fund most municipal services, including public schools and recreational facilities 2 (Lareau and Goyette 2014; Shah 2006; Stuart 2003). The appraisal industry is not a mirror that simply reflects real estate brokerage and consumer demands or a rubber stamp for mortgage lender profit schemes. Rather, we contend that it is a central player in the housing exchange process and should be examined in its own right, particularly with respect to racial segregation and inequality.
Neighborhoods, Racial Inequality, and Home Values
From its inception, the appraisal industry has played a central role in establishing and maintaining residential racial segregation and inequality (Jackson 1985; Kahrl 2016; Massey and Denton 1993; Pattillo 2013; Reskin 2012; Stuart 2003). Neighborhoods were seen as a key indicator of home value and were evaluated on the basis of the Home Owners Loan Corporation’s color-coded maps. Reflecting and enabling White racial biases, these maps and the corresponding criteria set out by the FHA defined White neighborhoods as the most “stable” and assigned them the highest home values and lowest mortgage “risk.” Conversely, communities of color were assumed to be unstable and given lower values, often leading to loan rejection (Carr and Kutty 2008; Jackson 1985; Stuart 2003). This practice, called “redlining,” became shorthand for denoting systematic devaluation of the housing stock in Black neighborhoods through assumptions about risk and, thus, systematic exclusion of Black neighborhoods from mortgage loans (Jackson 1985; Massey and Denton 1993; Stuart 2003). In this pre–fair housing system, the appraisal industry was a key linchpin reifying the links between communities, race, home value, and access to mortgage loans.
In the late 1960s and 1970s, a series of fair housing laws outlawed the appraisal industry’s overt devaluation of communities of color through the use of color-coded maps. 3 Instead, appraisers began using the “sales comparison approach,” which directs them to derive market value by comparing the home they are appraising (the subject home) with previously sold homes with comparable features in similar communities (U.S. Government Accountability Office 2012). This approach, which remains the most common, involves appraisers selecting previously sold homes that are comparable with the subject home. Appraisers then use the “comps” they have selected to determine the value of the subject home. Thus, unlike the historical methods of appraising homes, contemporary practices are not overtly based on neighborhood racial composition.
However, homes in White neighborhoods continue to be valued higher than homes in communities of color (Anacker 2010; Coate and Schwester 2011; Flippen 2001, 2004; Harris 1999; Kim 2000; LaCour-Little and Green 1998). Prior research suggests that the ongoing relationship between home values and neighborhood racial composition could be a consequence of several processes. These include historical housing discrimination (resulting in systematic differences in housing stock across neighborhoods), systemic racial inequality (contributing to neighborhood differences in socioeconomic status), unequal allocation of neighborhood amenities, racialized consumer housing demand, and appraisers’ racialized evaluations of homes in neighborhoods of color. Below, we discuss how each of these processes contributes to neighborhood racial differences in home value.
Neighborhood Housing Stock
Historic real estate steering and discriminatory ordinances concentrated Black and Hispanic residents in densely populated neighborhoods with low-quality and relatively small homes (Anacker 2010; Du Bois [1899] 1996; Jackson 1985; Massey and Denton 1993; Menchik and Jianakoplos 1997). These historical practices play forward as homes are passed down through families (Menchik and Jianakoplos 1997) and individuals select homes on the basis of their preexisting knowledge of communities (Krysan and Bader 2009). Additionally, contemporary racial biases of real estate agents and home buyers and sellers reinforce historic segregation patterns (Korver-Glenn forthcoming; Yinger 1999). Thus, lower home values in communities of color reflect their less desirable housing stock.
Community Socioeconomic Status
The second dominant explanation for the gap in home values between White communities and communities of color is socioeconomic inequality. Since the 1930s, appraisers have valued homes in wealthier neighborhoods higher than similar homes in less wealthy areas (Jackson 1985; Stuart 2003). Thus, persistent racial disparities in income explain some of the ongoing correlation between neighborhood racial composition and housing values.
Neighborhood Amenities
The third explanation for neighborhood racial disparities in home value is that there are systematic differences in neighborhood amenities across racially distinct neighborhoods. Appraisers assign higher values to houses zoned to higher quality public schools (Lareau and Goyette 2014) and are situated in neighborhoods with lower crime, more accessible public parks, and more convenient locations (Troy and Grove 2008). Thus, to the extent that race and inequality in amenities and crime correspond, racial demographics explain the observed inequality in housing values.
Consumer Housing Demand
The fourth explanation for higher value homes in White communities is consumer demand. Research has demonstrated that White residents are more willing to move into White neighborhoods than communities of color, even when holding crime rates and school quality constant (Emerson et al. 2012; Farley et al. 1978; Krysan and Bader 2009; Lewis et al. 2011). Moreover, Blacks and Hispanics demonstrate a willingness to live in various neighborhood types, including White neighborhoods (Farley et al. 1978; Lewis et al. 2011). In other words, the neighborhood preferences literature suggests that demand for housing in White neighborhoods is higher than the demand in communities of color. Because appraisal standards require appraisal values to reflect market demand, higher home values in White communities reflect higher demand.
Appraisal Evaluations
Contemporary appraisals hinge on appraisers’ selection of comparable homes (“comps”) in similar neighborhoods to the subject home. Yet the entities that oversee the appraisal industry (e.g., the Appraisal Foundation) do not provide specific guidelines on how to select comps or similar neighborhoods. This gap in standardization can create opportunities for racialized perceptions of neighborhoods to influence appraiser evaluations. As Sampson (2012) demonstrates, historic and contemporary neighborhood racial composition influenced Black, White, and Hispanic respondents’ contemporary perceptions of neighborhood disorder, even when controlling for observed disorder. Moreover, the perceived attractiveness of neighborhoods is often racialized (Bader and Krysan 2015). Thus, because the industry does not provide specific guidelines for selecting comps, appraisers, no matter their own racial identification, may evaluate neighborhoods on the basis of their implicit racial assumptions and select comps from racially similar communities, even if the neighborhoods are otherwise distinct. If this is the case, the appraisal industry continues to play a direct role in perpetuating racial inequality in housing values.
To our knowledge, no empirical examination of the appraisal industry has examined how neighborhood housing stock, community socioeconomic status, neighborhood amenities, consumer housing demand, and appraisal evaluations together affect persistent racial disparities in home values. In the present article, we thus examine how individual home and neighborhood characteristics affect neighborhood racial differences in home value. Additionally, we examine the processes appraisers use to assess home value to determine whether the selection of comps allows racial bias to affect appraisers’ opinions of value. Using quantitative and qualitative data, we ask the following research questions:
Research Question 1: In 2015, did neighborhood racial composition influence the tax appraisal value of houses above and beyond home features and quality, neighborhood socioeconomic status, neighborhood amenities, and consumer housing demand?
Research Question 2: How are homes appraised and does this process enable neighborhood racial composition to influence the appraised value of homes?
Data and Methods
Research Context and Conceptual Approach
We chose to study appraisals in Harris County (Houston), Texas, for two main reasons. First, relative to other major cities, Houston has a high proportion and number of single-family homes that are appraised yearly, providing ample data to examine the effects of neighborhood racial composition on appraisals. 4 Second, Harris County, embedded in the most racially diverse large metropolitan area in the United States (Emerson et al. 2012), is approximately 40 percent Hispanic, 30 percent non-Hispanic White, 20 percent non-Hispanic Black, and 7 percent non-Hispanic Asian (U.S. Census Bureau 2014). Yet the county is also highly segregated (Emerson et al. 2012). These racial demographics make Harris County an excellent location for assessing how neighborhood racial composition affects home valuations, as it has substantial numbers of majority Black, White, and Hispanic neighborhoods.
We examine Harris County using deductive and inductive methods to highlight both pattern and process (Pearce 2012). We use quantitative models to examine whether neighborhood racial composition influences tax appraisals. Then, noting a strong correlation between tax appraisals and market value, we pull from ethnographic and in-depth interview data collected from residential appraisers (those contracted by mortgage lenders to assess home market value) and other real estate professionals to illuminate how appraisals are conducted and whether this process may contribute to the observed inequalities. Together, our quantitative and qualitative data illuminate the extent of neighborhood racial disparities in home value and how these disparities are reproduced.
Quantitative Data and Methods
The tax appraisal data in this study come from Harris County Appraisal District (HCAD) public records. For our analysis, we use a census, not a sample, of all single-family tax-appraised residences in Harris County in 2015. Using data from a single entity allows us to eliminate possible confounding factors that would be present with data from multiple appraisal entities.
This census consists of 879,372 single-family homes with a mean housing value of $233,221 (see Table 1). 5 In addition to the tax appraisal value, these data also include information on house characteristics and quality. In our models, we operationalize house characteristics as square footage of the home and lot, as well as dichotomous indicators of whether the home has at least one fireplace; garage; patio, porch, or deck; and swimming pool or tennis court. 6 To adjust for the positive skew in home values, square footage, and lot size, we logged these three variables in our models. Additionally, to measure home quality we use date of construction or last major renovation, construction quality, and physical condition. Construction quality is determined by the appraisers using letter grades. We quantified and centered this scale such that the poorest quality construction is assigned a −7 and the highest quality is given a 10. Likewise, physical condition is determined using a categorical scale. We quantified and centered this scale such that it ranges from −3 to 4.
Descriptive Statistics of Housing Appraisals.
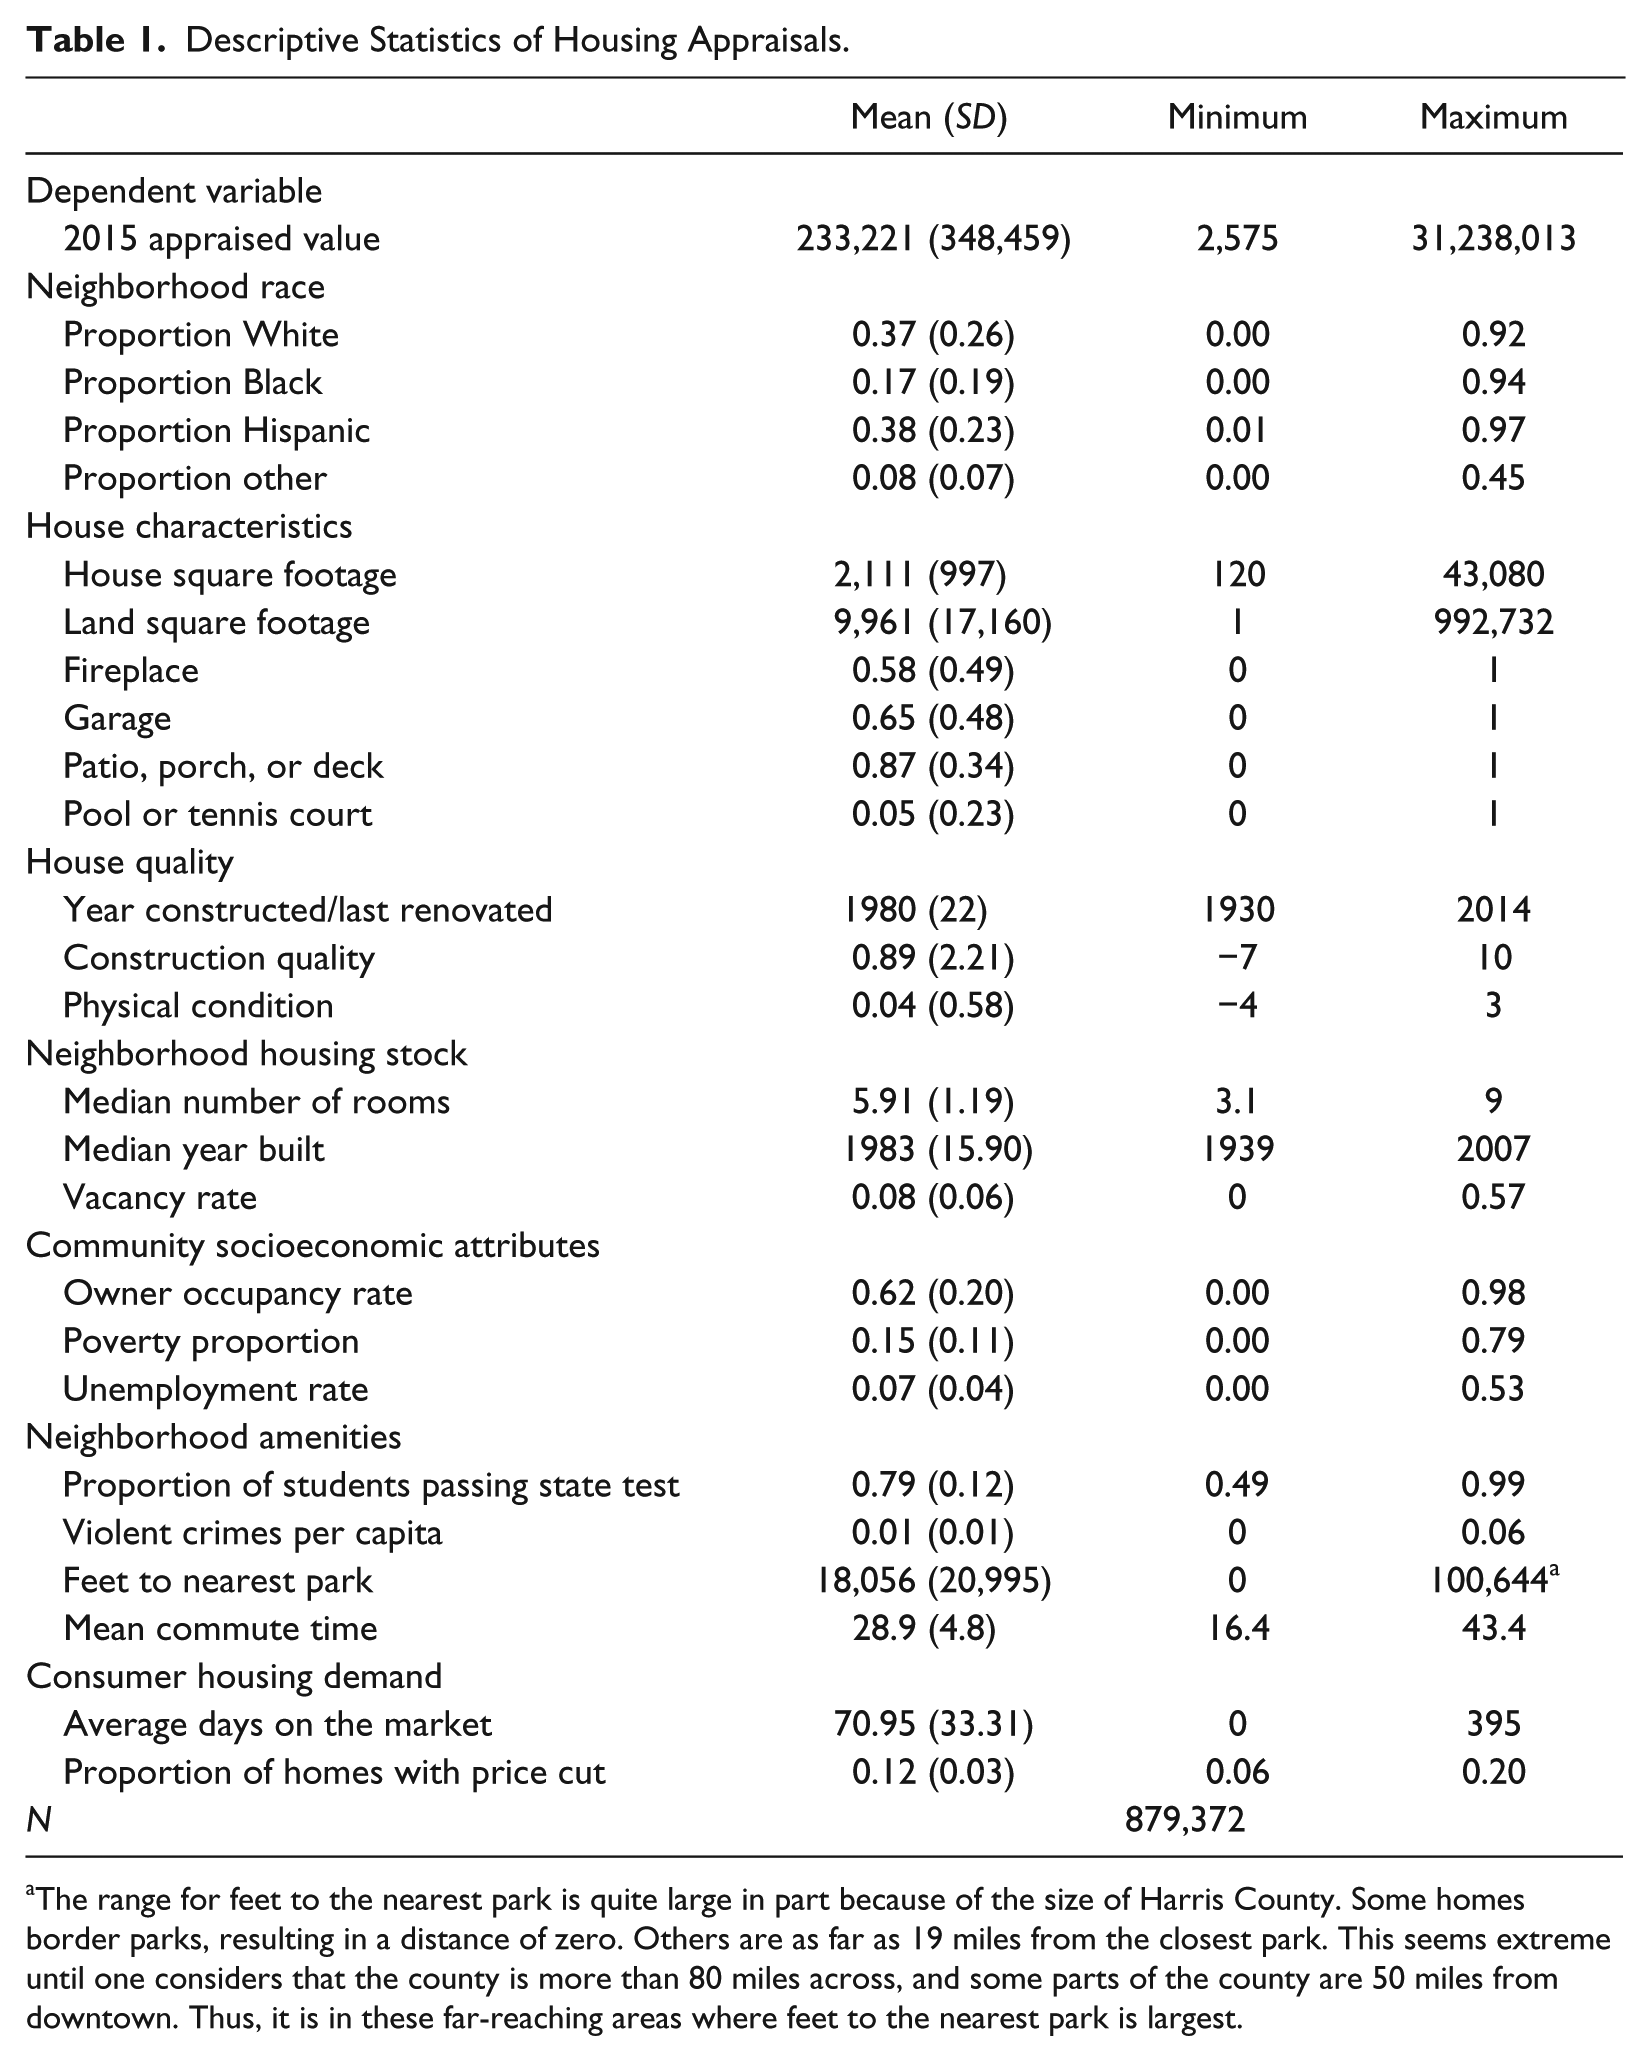
The range for feet to the nearest park is quite large in part because of the size of Harris County. Some homes border parks, resulting in a distance of zero. Others are as far as 19 miles from the closest park. This seems extreme until one considers that the county is more than 80 miles across, and some parts of the county are 50 miles from downtown. Thus, it is in these far-reaching areas where feet to the nearest park is largest.
To answer our question regarding the relationship between neighborhood racial composition and tax appraisal value, we linked HCAD’s geographic information system (GIS) shape file of properties to census tracts. 7 Using the 2011–2015 American Community Survey (ACS), we calculated the proportion of the neighborhood that identified as non-Hispanic Black (hereafter Black), Hispanic, non-Hispanic other (hereafter other), or non-Hispanic White (hereafter White). In our models, we include the neighborhood’s Black proportion, the neighborhood’s Hispanic proportion, and the proportion of the neighborhood that is of another race. Consequently, our reference group is the neighborhood’s White proportion. To account for additional neighborhood factors that could explain the relationship between neighborhood racial composition and housing values, as explored theoretically above, we include a series of additional neighborhood control variables.
Neighborhood Housing Stock
Even if a specific home is of high quality, appraisers assign lower home values to houses in neighborhoods with small, unkempt, or vacant properties. To operationalize the quality of the neighborhood housing stock, we use ACS estimates of census tract median number of rooms per housing unit, median year of home construction, and vacancy rate.
Community Socioeconomic Attributes
Likewise, we use the ACS estimates of census tract owner occupancy rate, poverty rate, and unemployment rate to control for community socioeconomic characteristics. As discussed previously, the literature asserts that higher owner occupancy rates, lower poverty rates, and lower unemployment rates correlate with higher home appraisals.
Neighborhood Amenities
We operationalize neighborhood amenities as school quality, violent crime rate, park accessibility, and location convenience. Using the GIS files made available by the School Attendance Boundary Information System, each house was linked to its corresponding elementary school. School quality was measured as the proportion of the students who passed the state standardized tests in 2014 according to the Texas Education Agency. 8 Violent crime rate was operationalized as the number of violent crimes per capita in the census tract. Using the latitude and longitude coordinates of all crimes reported to the Houston Police Department and the Harris County Sheriff’s Office from January 1, 2014, to December 31, 2014, we compiled the total number of violent crimes 9 in each census tract and divided this by the total population. Park accessibility was operationalized as the distance from each home in the data set to the nearest park (in feet). This variable was calculated using a GIS shape file made available by the City of Houston. Given that the more rural sections of the county are further from parks, this variable has a positive skew and was thus logged in all models. Finally, location convenience was measured as access to employment opportunities, specifically, the census tract’s mean commute time in minutes. Theoretically, higher commute time corresponds with inconvenience and thus lower home values.
Consumer Housing Demand
Following real estate and economics conventions, we measure consumer housing demand as the mean number of days houses remain on the market and the percentage of houses for sale that decrease their asking prices (Bukhari 2017; Huffman 2016). Areas where houses sell quickly and prices are not reduced are considered high-demand areas. We obtained consumer housing demand data from the Houston-area Homes and Rentals multiple listing service and Zillow, both of which are accessible to appraisers when they evaluate property values. From Homes and Rentals, we obtained the average number of days houses remained on the market in each ZIP code for each month (January to December 2015) and then averaged across the year. From Zillow, we gathered the percentage of homes on the market in each ZIP code that experienced a price cut for each month (January to December 2014) and then averaged across the year. Despite their different sources, these two variables are highly correlated, building our confidence in measurement validity. 10
Modeling
To examine the influence of neighborhood racial composition on 2015 tax appraisals, we estimate multilevel models to address the clustering of multiple houses in each census tract. All models were run in Stata using the xtreg command. 11
Qualitative Data and Methods
HCAD relies heavily on estimated market value to arrive at a final valuation. In Texas, sale prices are not publically accessible, so HCAD estimates market value by sending out surveys to both buyers and sellers whenever a home changes hands, asking both parties for what price the home was bought (buyers) or sold (sellers) (see Appendix A, Figure A1, for an example survey). Final sales prices are dependent largely on home valuations calculated by independent, lender-hired market appraisers. Thus, market appraisals and tax appraisals are related. We confirm this link in our supplementary analysis in Appendix A, which demonstrates that tax appraisals in Harris County are extremely correlated with estimated market values provided by the popular real estate Web site Zillow and with mortgage loan amounts provided by the Home Mortgage Disclosure Act (HMDA; both proxies for market appraised value). In sum, to understand the appraisal process, it is imperative to examine both the tax and market appraisal sectors of the appraisal industry.
To examine how appraisers assess home value and whether the selection of comps allows racial bias to influence these assessments, we draw from in-depth interviews with market appraisers in the Houston metropolitan area. These interviews were collected between February 2015 and February 2016 as part of a larger ethnographic and in-depth interview-based study of Houston’s urban real estate market (Korver-Glenn 2017). Appraisers were recruited using a social network sampling approach, in which interviewed mortgage lenders were asked for a list of the appraisal management companies (AMCs) they used most frequently. Then, after contacting the AMCs, individual appraisers were invited to interview. This recruiting strategy resulted in nine in-depth interviews with appraisers working for nine different AMCs across the Houston metropolitan area. Three of the appraisers owned AMCs, demonstrating far-reaching influence in terms of their interactions with and oversight of the hundreds of appraisers and appraising companies that worked through them. Respondents roughly reflected statewide appraiser demographics: all nine were men, seven of the nine were non-Hispanic White, and two were Hispanic. In 2015, 78 percent of Texas appraisers were men; 86 percent were White, 6 percent were Hispanic, and 2 percent were Black (Hobby Center 2015). In fact, one White respondent who owned an AMC reflected that in his 30 years of appraising, he had only encountered one Black appraiser, and that was an appraiser that he had hired.
During in-depth interviews, we asked appraisers how they went about appraising properties, the criteria for the valuation of homes, how they selected comparable (“comp”) homes, and how they began their careers and received training. Secondarily, we also noted when real estate agent informants included in the larger study discussed appraisals and comps when conducting fieldwork. We coded and analyzed the professionally transcribed interviews and relevant fieldwork using an abductive approach, in which we used themes and theory present in previous research to inform our understanding of our data while also looking for ways in which our data departed from or was surprising relative to prior work (Timmermans and Tavory 2012). Furthermore, in our coding, we followed Lareau (2012), focusing on the meaning of appraisers’ responses rather than the number of interviewees or the frequency of responses. Following Small (2009), we analyzed interviews with an eye to saturation of themes and patterns. Because all nine respondents worked for different AMCs, focused on appraisals in different areas of the city, and had different professional histories (e.g., some respondents had appraised homes only in Texas, while others had experience appraising elsewhere), we are confident that our results are reliable given the saturation of patterns across these distinct axes (Small 2009).
All ethnographic and interview-based data collection received institutional review board approval, and participants all received and signed an institutional review board–approved human subjects consent form guaranteeing confidentiality. Respondents were offered a $25 gift card incentive to participate in the study; about half accepted the incentive. To protect the identities of participants, names and other potentially identifying details have been changed.
Results
Neighborhood Racial Composition and Tax Appraisals in 2015
We first examine our census of tax-appraised Harris County residential properties in 2015 to determine to what extent neighborhood racial composition is associated with appraised home value and what factors explain the observed disparities. Beginning with just neighborhood racial composition, we find that higher proportions of Black and Hispanic residents correspond with lower mean housing values (see Table 2). Because we are using a census of all houses in the county and not a sample, we do not use classical statistical significance tests. In other words, p values, which enable researchers to estimate whether differences in a sample are likely to be present in the population, are meaningless when we have information on the full population. However, the overall R2 in Model 1 of Table 2 demonstrates that half of the variation in appraised values is explained by the neighborhood racial composition.
Coefficients from Multilevel Regressions Predicting 2015 Logged Housing Appraisal Value.
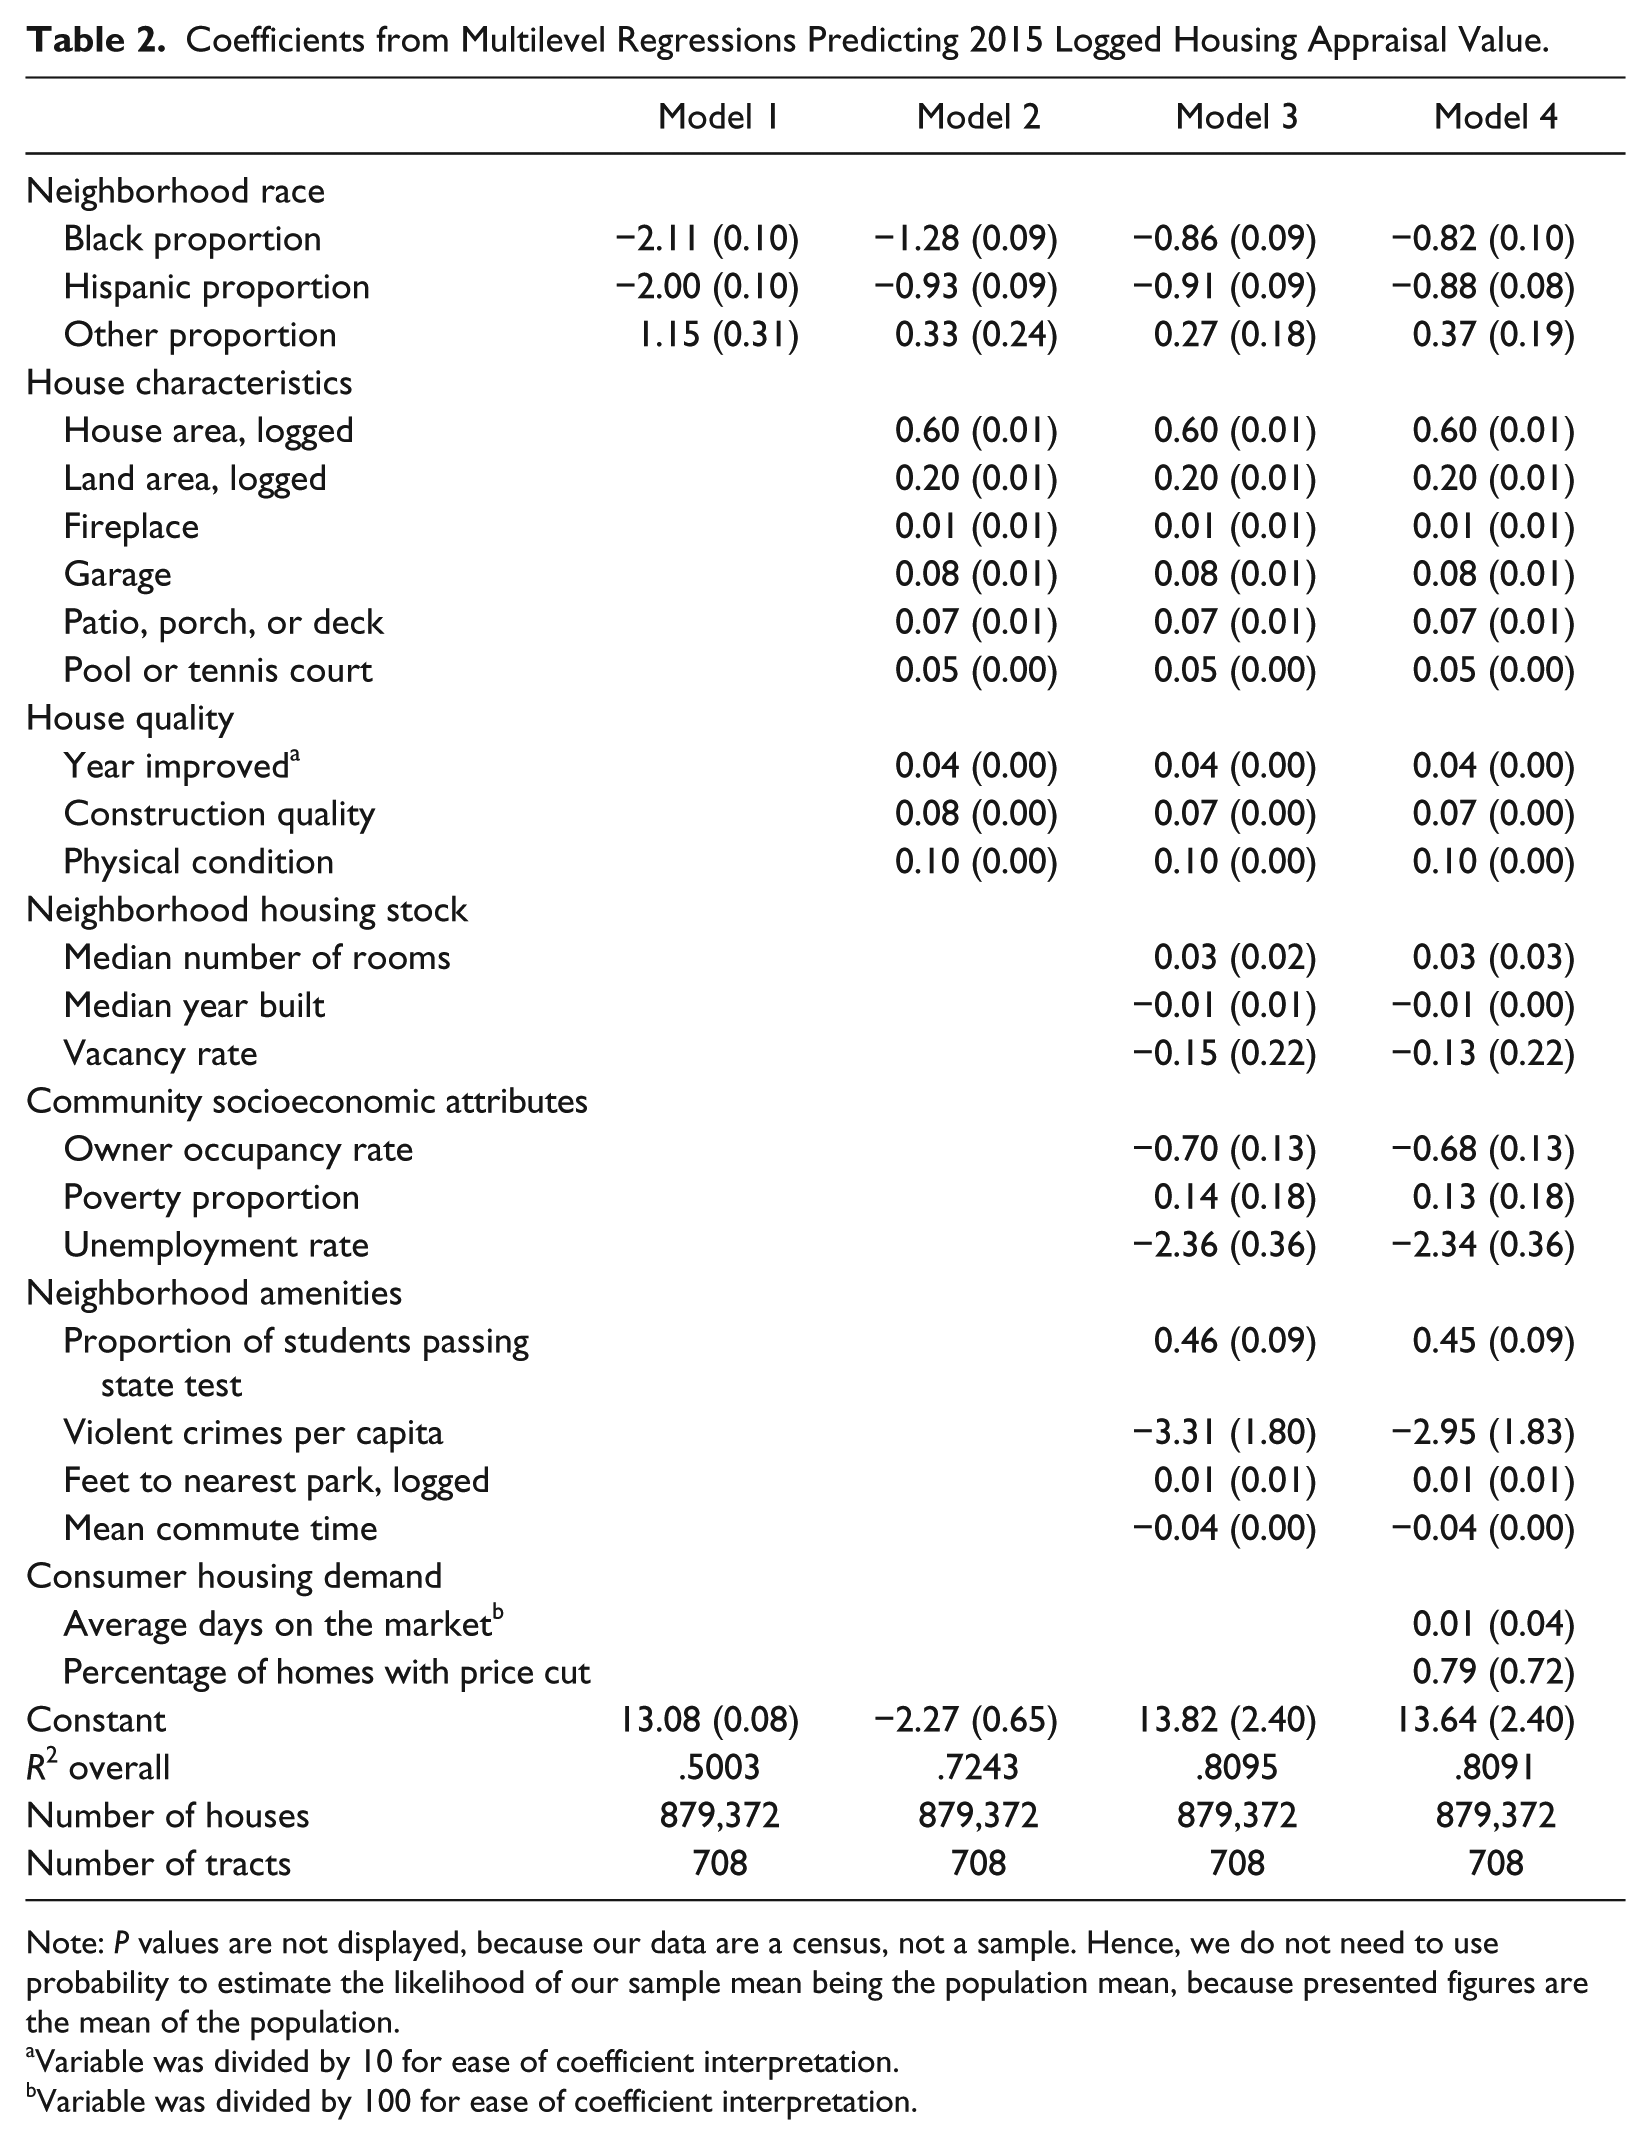
Note: P values are not displayed, because our data are a census, not a sample. Hence, we do not need to use probability to estimate the likelihood of our sample mean being the population mean, because presented figures are the mean of the population.
Variable was divided by 10 for ease of coefficient interpretation.
Variable was divided by 100 for ease of coefficient interpretation.
To understand the real-world implications of these effects, we use predicted values. Predicted values are constructed by assigning a chosen value to each explanatory variable. Throughout this research, when we use predicted values, we set all the control variables to their mean values but alter the racial compositions of the neighborhoods to illuminate how racial proportions are influencing house appraisals. As is often done when comparing predicted values (e.g., Crowder and South 2008), we use ideal types. For example, for Black neighborhoods, we set the Black proportion to 100 percent and the Hispanic and other proportions to zero. 12 Using this method, Model 1 predicts that the value for houses in White neighborhoods is $479,000, while the value of houses in Black neighborhoods is $58,000 and $65,000 in Hispanic neighborhoods. Put another way, the average tax appraisal of homes in White neighborhoods is more than eight times greater than the average tax appraisal of homes in Black communities and more than seven times greater than the average tax appraisal of homes in Hispanic communities. This finding aligns with previous research; however, this model does not include the additional home and neighborhood factors that likely contribute to this inequality. For this we introduce our control variables.
In Model 2, we control for house characteristics and quality. As expected, larger homes with larger plots of land are assessed as more valuable than their smaller counterparts. Likewise, homes with fireplaces, garages, patios, porches, decks, pools, and tennis courts were assigned higher home values than their counterparts without these features. Additionally, more recently built or majorly renovated homes of better construction quality and in better physical condition were appraised at higher values. 13 Controlling for these factors does reduce the disparity in valuations across racially different neighborhoods, suggesting that inequity in home values is due in part to historic and contemporary housing discrimination that clusters Black and Hispanic residents into neighborhoods with smaller, lower quality homes.
Nevertheless, substantial neighborhood racial inequality remains. Results from Model 2 predict that a home of average size and quality in a White neighborhood would be worth $342,000, while a comparable home would be worth $135,000 in a Hispanic neighborhood and $96,000 in a Black neighborhood. Said another way, even when holding home size and quality constant, houses in White neighborhoods are worth 2.5 times more than houses in Hispanic neighborhoods and 3.7 times more than houses in Black neighborhoods.
That neighborhood racial inequality remains after holding house features and quality constant is striking. Yet these inequalities might be due to other neighborhood factors, such as the housing stock, socioeconomic status, or amenities. To account for this possibility, we control for the ten neighborhood factors discussed in the “Data and Methods” section.
As expected, houses in neighborhoods with larger homes, older, more stable housing stock, lower vacancy rates, lower unemployment, high-quality schools, low levels of violent crime, and shorter commute times have higher appraised values than their counterpart houses in neighborhoods without these characteristics. However, contrary to expectations, homes in neighborhoods with lower homeownership rates, higher poverty rates, and fewer parks are appraised higher holding all other neighborhood and housing characteristics constant. By themselves, these variables correlate with appraisal value in the expected directions. That is, neighborhood homeownership positively correlates with home value, while neighborhood poverty negatively correlates. Yet in combination with other neighborhood controls, these relationships flip. Although we are unsure of the exact reasons for these surprising findings, we surmise they are related to the Houston context. For example, in Houston, neighborhoods with small bungalow homes (a common architectural type in older neighborhoods) often have high homeownership rates but are perceived as less valuable than communities such as Montrose or Midtown with higher renting populations housed in luxury multifamily properties. Likewise, previous research on Houston parks has shown that the diffusion of Black and Hispanic populations into formerly White neighborhoods has resulted in these populations’ having increased access to parks (Elliott, Korver-Glenn, and Bolger forthcoming). Despite these few unexpected findings, overall, these neighborhood controls help explain the observed variation in appraisal values.
Yet substantial neighborhood racial inequality persists. Holding all house and neighborhood characteristics constant, Model 3 predicts that an average home in an average White neighborhood is $296,000: more than two times higher than otherwise equal homes in Black and Hispanic neighborhoods (which are valued at $125,000 and $119,000, respectively). Once again, this inequality is striking, but it might be a reflection of contemporary housing demand.
That is, appraisers might be accurately assessing higher consumer housing demand, and thus higher values, in White neighborhoods. Thus, our final model introduces controls for consumer housing demand. 14 Introducing these controls only slightly reduces the observed neighborhood racial inequality. Controlling for consumer housing demand, Model 4 predicts that an average home in an average White neighborhood is valued at $289,000, compared with the value of that same home in a comparable Black or Hispanic neighborhood, at $127,000 and $120,000, respectively. This model controls for individual home characteristics, neighborhood housing stock, community socioeconomic characteristics, neighborhood amenities, and consumer housing demand, and yet neighborhood racial composition still has an enduring and substantial influence on housing values. This finding suggests that appraisers’ evaluations of homes are contributing to the divergent home prices in White compared with Black and Hispanic neighborhoods. To further unpack how this inequality is reproduced, we turn to our qualitative data to examine how market appraisals are derived and how this process might enable neighborhood racial composition to influence assessments of home value.
The Appraisal Process
As noted above, the 1980s legislation and Uniform Standards for Professional Appraisal Practices helped standardize the appraisal industry. Specifically, these efforts require appraisers to be licensed by their state and analyze comparable sales data in their evaluation of the subject property’s value (Appraisal Foundation 2016a). However, these standards do not provide specific guidelines for how appraisers should select comparable homes. In our study, interviewees shared a common method for gathering data on subject home characteristics, but each had a distinct method for selecting comps. Here, we describe the general process used to assess subject home characteristics, then provide examples of appraisers’ varying comp selection strategies.
Appraisers began with an in-person visual inspection of the subject property, which included taking photos of and notes on the home’s internal and external structure, materials (e.g., wood siding), upkeep, size, layout, number of bedrooms, bathrooms, and other rooms, as well as exterior buildings (e.g., a shed). Once the in-person evaluation was complete, they used the local multiple listing service to select previously sold homes they perceive as comparable with the house in question (“comps”). Appraisers then used these “comps” to derive and justify home values. Hence, the houses they selected as comps were critical in determining the final appraised value of the home.
George, a White male appraiser, told us he drew a one-mile radius around the property in question and selected comps from within the resulting circle. Another middle-aged, White male appraiser, Bill, scoffed when we mentioned a one-mile radius for comps: Okay, there is no radius, first of all . . . whatever the best comp is, is the best comp. It doesn’t matter if it’s a mile or five miles or one block. Yeah, I mean, you’re talking about an underwriting guideline. The guidelines that underwriting has . . . talked about, how they think appraisals should get written, doesn’t have a whole lot to do with how appraisals should really get written. . . . I would like for all my comps to be on the same block, that would be great. They never are.
Still another middle-aged, White male appraiser, Carl, said that his approach was to follow the three D’s: dated, dissimilar, and distant, in that order. If he could not find comp homes within the same subdivision in the past six months, he would look for older comps—homes sold within the last 12 months, for example. If he could not find “dated” comps, he would then move to “dissimilar” comps, selecting homes that were different in terms of age, size, and so on. Finally, if he could not find nearby dissimilar comps, he would expand his search for comps geographically.
In addition to variation in appraisers’ methods for selecting comps, other real estate professionals such as real estate agents and lenders influence the comp selection process. How and to what extent this happens varies across individual real estate agents and lenders. Despite post-2008 legislation reducing collusion between appraisers and lenders, real estate agents sometimes show up at a property while it is being appraised. Bill explained, But if they [real estate agents] don’t know the appraiser, or even in my case they’ll want to meet me for whatever reason, usually if they want to meet me, I know something’s up. Usually, if they’re interested, it’s because they’re under a contract at a price they may not have comps to support. . . . They’ll bring comps . . . sometimes they’ll bring a folder and it’ll have a list of 20 comps in it.
Bill’s observation was confirmed through participant observation with top-producing real estate agents as part of the broader ethnographic study. One of these agents, Jay, told us that he attends 99 percent of all the appraisals for his listings to aid the appraisers’ valuations. Lenders, too, still influence appraisers’ decisions. Although lenders can no longer directly select specific appraisers, they can still contact their AMCs or third-party liaisons and communicate with the appraiser indirectly (Appraisal Foundation 2016b).
Variation in the appraisal process is not inherently problematic. Nevertheless, it does suggest that because appraisers do not have a uniform way of selecting comps, there is no mechanism to ensure that comps are not selected on the basis of neighborhood racial demographics. In fact, in our interviews and ethnographic field work, it became clear that appraisers often perceive comparable houses as those in communities with similar racial demographics, even if these comparable communities were further away or had drastically different socioeconomic characteristics.
An example of neighborhood race-based comp selection—made possible by the unstandardized comp selection process—was Carl’s comparison of Lindale Park and the Heights. Lindale Park is a largely middle-class, deed-restricted Hispanic neighborhood near downtown Houston. The Heights, across Interstate 45 from Lindale Park, is equally close to downtown Houston and is a largely deed-restricted middle- and upper-middle-class White community (see Figure 1 for photos of Lindale Park and Heights homes). Overall, Lindale Park has comparable housing stock (in terms of house size and quality) with homes in many areas of the geographically proximate Heights neighborhood; in fact, lot sizes tend to be larger in Lindale Park than in the Heights.
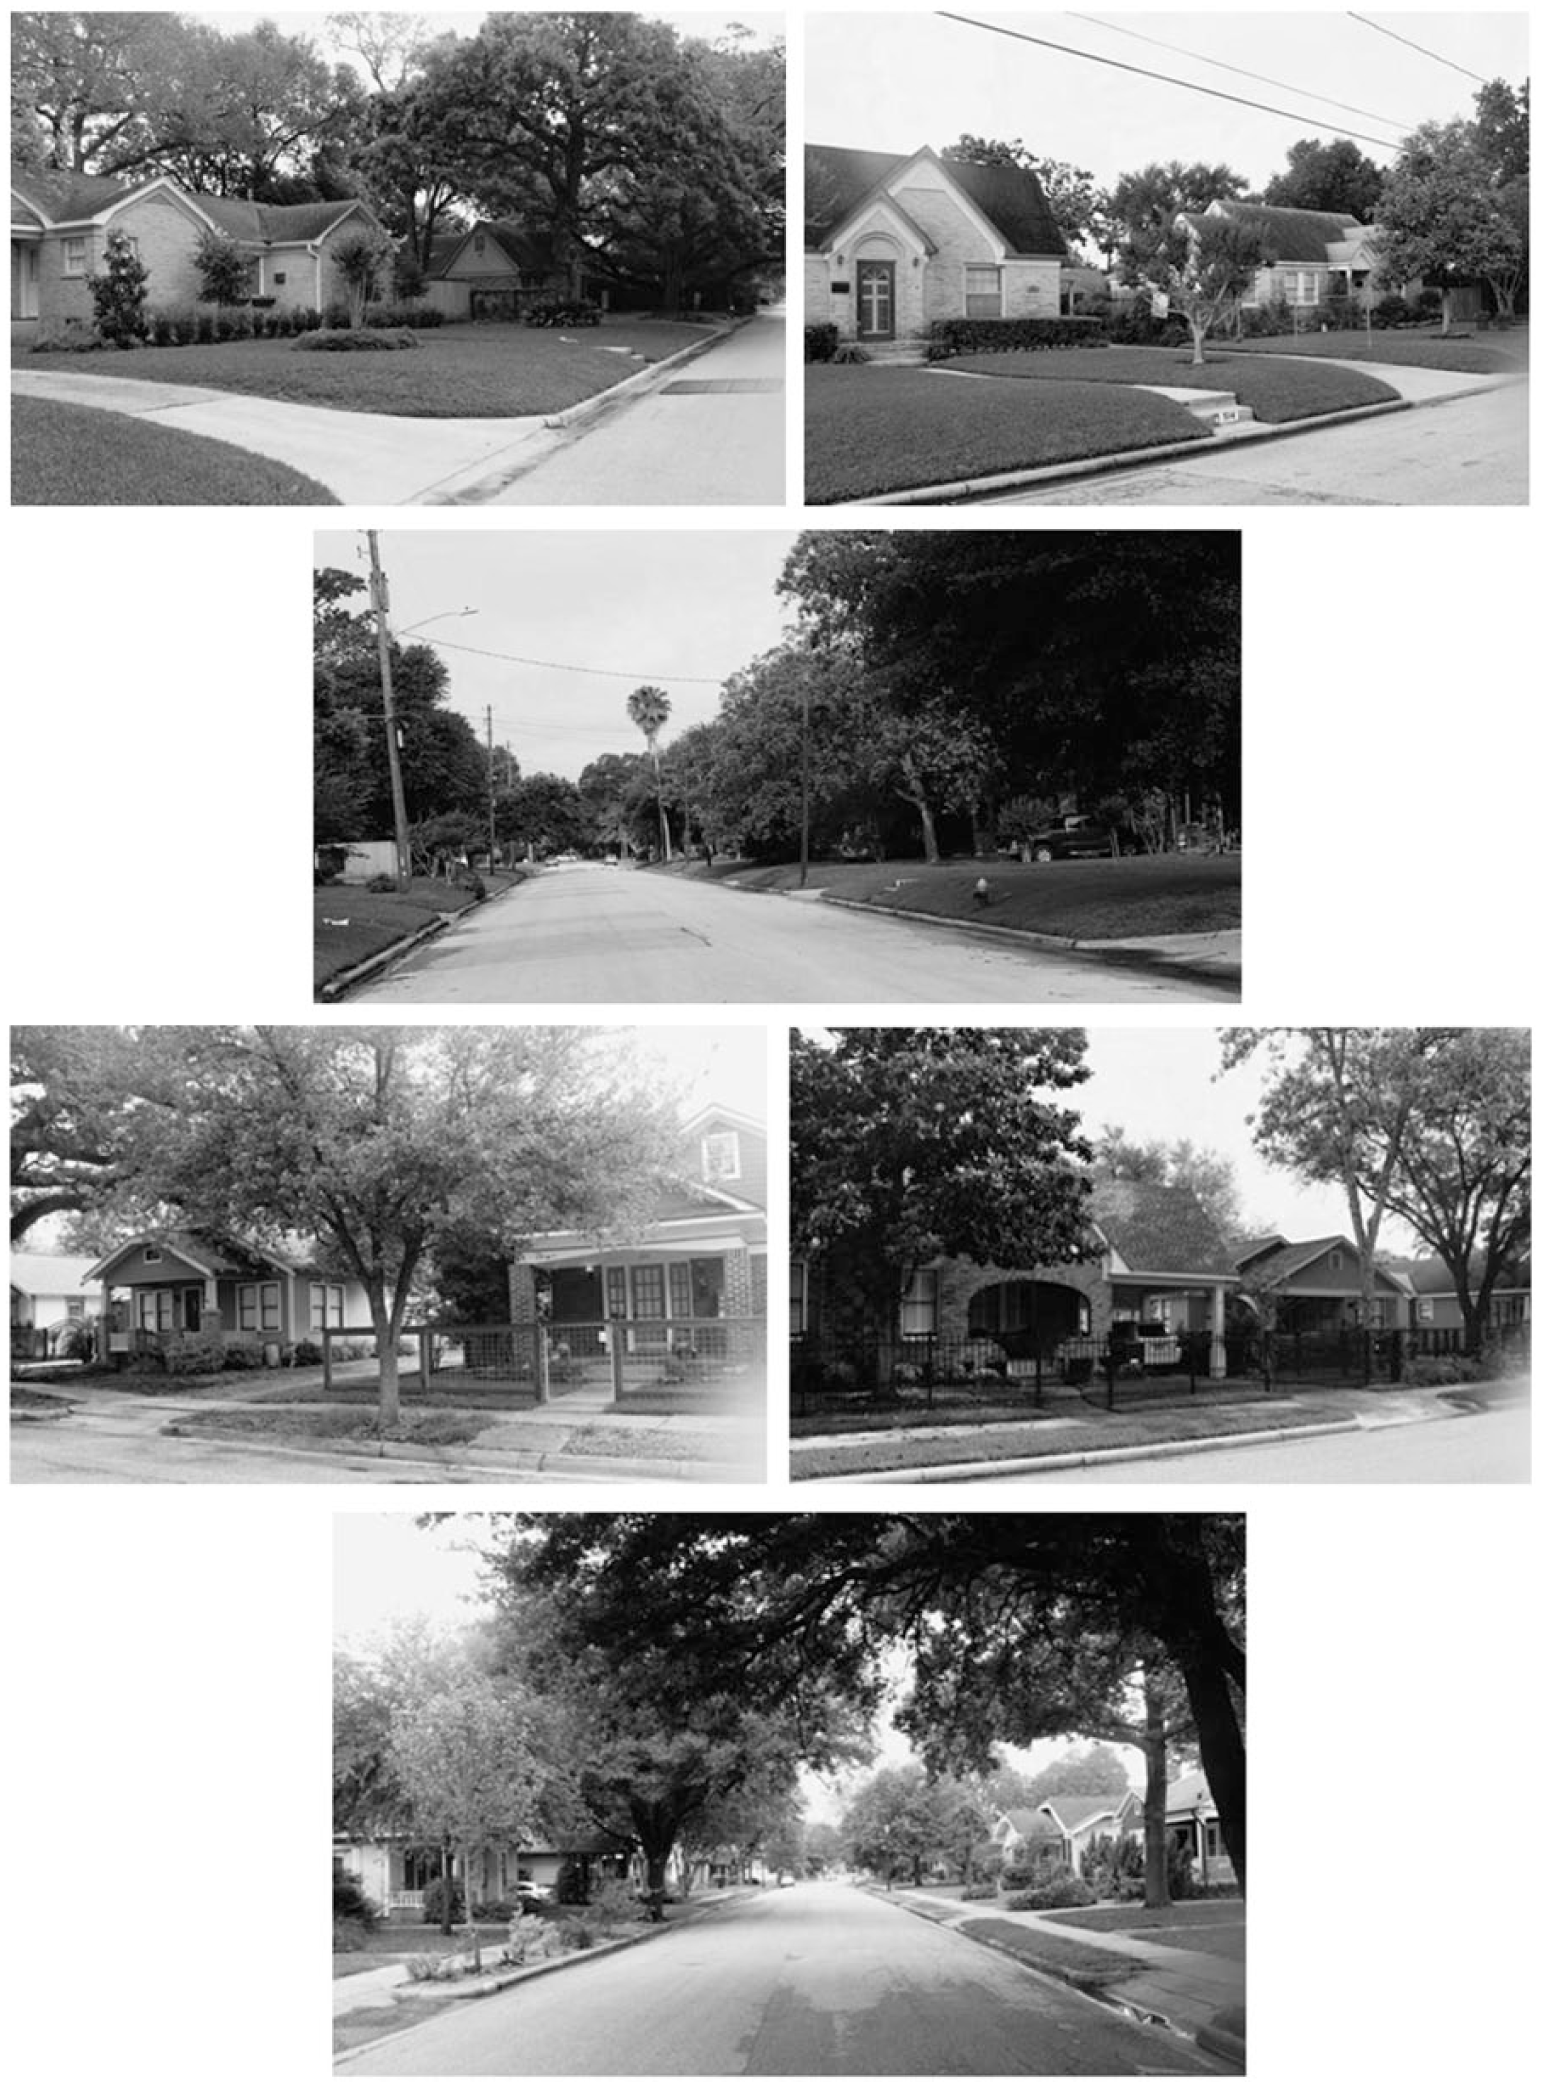
Comparing Lindale Park and Heights Neighborhood Housing Stock.
Given its geographic, socioeconomic, and housing stock comparability with the Heights, it would be reasonable for comps to be pulled from the Heights when appraising a house in Lindale Park. Nevertheless, for Carl, the racial composition of Lindale Park signified low housing quality and crime. His racialized perception then influenced his comp selection process. In fact, Carl compared Lindale Park with Quail Valley, a subdivision in a suburb approximately 30 miles away; in his mind, Lindale Park and Quail Valley were similar because of their racial demographics. Likewise, he compared the Heights with West University (“West U”), an individual municipality completely surrounded by the City of Houston that, like the Heights, is majority White: As an appraiser, we run into stuff as far as racial stuff. Lindale Park, being on the east side [of Interstate 45]. . . . I’ll just use Quail Valley as an example. . . . The west part of Quail Valley, they’re very nice homes, the highest homes over there get to be about $400,[000], uh, but you go to Quail Valley east, and they’re all the one-story, it’s a largely Black and Hispanic population, lot of rental houses, the homes are not maintained, and so they suffer. It’s the same thing with Lindale Park. . . . The Heights has always been great, because it’s the Heights. It’s like, “Oh, I’m living in West U.” You know, and Lindale Park, it’s like, “I’m over there in the ghetto.” It’s kinda scary . . . ’cause if I go by to appraise a house over there, um, I’m kinda looking around . . . as for the Heights, I’m driving right up to the house, I have no worries, I go right up there, you know.
During his interview, Carl conflated neighborhoods of color with poorly maintained homes and expressed racialized fears of these spaces as an appraiser. Yet more important for the purposes of our study, Carl perceived all communities of color as comparable despite numerous data (e.g., housing size and quality, neighborhood socioeconomic status, location centrality) indicating otherwise.
Another example of appraisers selecting comps on the basis of neighborhood racial composition emerged during an interview with Juan, a Hispanic appraiser. In explaining his process for selecting comps, Juan listed various communities around Houston and classified them as comparable on the basis of their racial composition rather than their geographic proximity to downtown, socioeconomic characteristics, or school quality (for example). Juan and other appraisers justified their racial classification of neighborhoods by asserting that these boundaries aligned with housing demand. In his interview, Juan stated, So if a person is going to be interested in buying in Fifth Ward, would that same person go to Denver Harbor to buy? Would that person go to Second Ward to buy? . . . I think that ethnicity has something to do with it. So a person who’s buying for that market group is buying in Second Ward, they probably aren’t going to go to Fifth Ward and buy a house.
Similarly, Larry, a White appraiser, explained how neighborhood racial dynamics and demand were associated with home values. He stated that an “influx of minorities” to a neighborhood would be perceived by White homeowners as having a “negative impact,” which would in turn lead to the departure of Whites from the area. He explained this would lower home values in the area through decreased demand and assumed that minorities moving in would be lower income, thus lowering the socioeconomic status of the neighborhood.
However, appraisers did not supplement these assumptions with data on listing versus sales price, how long properties stayed on the market, or any other quantitative measure of demand. In fact, Larry seemed to ignore that an increasing presence of minorities in a neighborhood could signal greater demand for that area. In his view, it also did not seem possible that minority home buyers could have equal or greater socioeconomic status than their White counterparts. From Juan’s perspective, it was very unlikely that buyers would want to purchase homes in neighborhoods that did not match their race. Consonant with prior research on residents’ racialized perceptions and attraction to or avoidance of neighborhoods (Bader and Krysan 2015; Sampson 2012), it was appraisers’ racialized, assumed opinions concerning demand and buyer characteristics, not observed measures of demand or buyer characteristics, that determined community “comparability.”
Our data suggest that the variation in comp selection results in appraisers selecting comps from racially comparable communities and not necessarily from areas that are similar in terms of housing stock, geography, socioeconomic status, amenities, or demand. In turn, neighborhood racial composition can influence appraised home values. Our data does not demonstrate—nor are we trying to insinuate—that the individual appraisers we interviewed and observed were “racist” or were, in several cases, making race-conscious decisions in their appraisals. Instead, our data illuminates that variation in comp selection provides ample room for neighborhood racial composition to become entangled in home value, in part through the (unconscious) racialized assumptions of appraisers and numerous other real estate stakeholders who attempt to influence home valuations. Thus, it is the system of appraisals that enables the stark racial inequality we observed in our quantitative data to persist.
Discussion and Conclusion
Sociohistorical studies illuminate how neighborhood racial composition became inextricably linked to the housing appraisal industry. What the present study demonstrates is that this is not merely an artifact of the past. Our quantitative data demonstrate that comparable Harris County houses zoned with comparable schools and located within neighborhoods with equitable housing stock, housing demand, distances to parks, commute times, and crime, homeownership, poverty, and unemployment rates were valued systematically lower in Black and Hispanic neighborhoods. They were valued $162,000 (2.3 times) less if they were in Black compared with White neighborhoods and $169,000 (2.4 times) less in Hispanic neighborhoods compared with White neighborhoods. Because municipal services such as education and infrastructure maintenance rely on local property taxes, these large differences translate into inequalities in educational and infrastructural budgets and outcomes.
Our qualitative data provide preliminary insight into how racial disparities in home value can persist despite legislative interventions. Specifically, we highlighted how the inconsistency in comp selection strategies enables appraisers to select comps on the basis of their racialized assumptions about the comparability of communities, which in turn devalues communities of color, irrespective of actual demand.
So that we could conduct an in-depth examination of the appraisal industry in a racially diverse county, our study is limited to the Houston area. However, given the substantive significance of our statistical findings, the potential mechanisms reproducing these findings in the appraisal process, and the substantial implications of our findings for wealth accumulation and socioeconomic mobility, we presume similar patterns exist across the United States. Thus, we strongly recommend further probing of this topic across other cities.
Even without these future studies, what the present research illuminates is a form of systemic racial discrimination that has yet to be addressed. Policies prohibiting racial discrimination against individual home buyers have been enacted (though they are unevenly enforced), yet very few policies, proposed or legally enacted, protect Black and Hispanic communities against systematic discrimination. We suggest that adjustments need to be made to the appraisal system to ensure that contemporary appraisers do not evaluate houses and neighborhoods by the same “color” system devised by the FHA in the 1930s.
As a first step, we suggest standardizing the comp selection process. For example, the Appraisal Foundation could institutionalize automated software that decouples homes from their neighborhood racial context by showing appraisers comparable homes (in terms of home quality and size, schools, commute times, vacancy, poverty rates, and so on) across the metropolitan area. Simultaneous to this adjustment, property tax values should be allowed to increase or decrease by only 2 percent per year (currently, tax-appraised value can change by up to 10 percent a year in Harris County). Property owners would thus not be financially “shocked” by rises in tax value, and cities would not see disproportionate decreases in revenue.
Recent scholarly and public attention to the value of Black and Brown lives is a reminder that large gaps in racial equity still characterize U.S. society. Our research suggests that a major step toward valuing Black and Brown lives is to value Black and Brown communities by removing the racially coded “map” that influences home appraisals and to value them as equally good and desirable places to reside, raise families, and accumulate wealth.
Footnotes
Appendix A: Market Compared with Tax Appraisals
HCAD uses market appraisals as a baseline for their tax appraisals. Specifically, HCAD mails a survey to both the seller and buyer after each property sale (see Figure A1). On this survey, detailed questions are asked about the property and sale price. Moreover, market values are influenced by tax appraisals. When evaluating housing prices, housing market stakeholders use Web sites like the popular real estate Web site Zillow. Zillow creates estimates of almost every house in the United States by examining recent house sales in the area, prior transactions of that particular property, features of the individual dwelling, and tax appraisals. (To see more about Zillow’s methodology and data, see Zillow Research 2014.) Thus, there is an implicit feedback loop between market and tax appraisals.
Given the relationship between market and tax appraisals, we assume the two are highly correlated. Although Zillow does not provide downloadable spreadsheets of its estimates for each house, it does provide the median value of its estimates by different geographic scales. Thus, we compared Zillow’s estimates for Harris County ZIP codes (their smallest available geographic unit) with the median tax appraisal value within each ZIP code. Results suggest that the Zillow estimates are extremely comparable with HCAD’s median tax appraisals (r = .99). Specifically, in 2015, the average market value was $220,000, while the average tax appraisal was $214,000 (see Figure A2).
To adjudicate the possibility that these correlations are the result of Zillow’s estimation formula and not home sale price (a proxy for market value), we also compared the tax appraisal values with mortgage data from the HMDA, which provides loan amounts for homes purchased with a mortgage. We use these amounts as rough approximations for market values. For both the HCAD and HMDA data, we calculated the census tract median house value of homes that sold in 2013 (the most recent available HMDA data) and found that the correlation between the HCAD and HMDA data was 0.96. The strong correlations among HCAD, Zillow, and HMDA data provide support for our claim of the comparability of and relationship between tax and market appraisals.
Acknowledgements
We wish to thank Michael O. Emerson, James R. Elliott, David Ponton III, and three anonymous reviewers for helpful feedback on previous versions of this manuscript. The research reported in this paper was supported in part by grant U50364 from the Rice University Social Sciences Research Institute.
Authors’ Note
The authors’ names are listed alphabetically by last name to demonstrate equal authorship.