
Abstract
In this era of growing immigration and debates about the U.S.-Mexico Border, the authors tackle a question that is growing in importance as the Border is at the forefront of national debate: Do people (White or Latinx) who believe that they are seen as Latinx experience more community division on the basis of proximity to the Border? The authors use data from the 2015 Texas Diversity Survey to examine the experience of racialization for people living in different social environments. The authors find that Latinxs who live closer the U.S.-Mexico Border are more likely to believe that they are perceived by others as Latinx, demonstrating how racialization is contextual and variable across space. The authors show that these differences are consequential for a sense of community division: Latinxs feel more community division when they live closer to the Border and believe that strangers see them as Latinx, even after controlling for socioeconomic characteristics, gender, age, and characteristics of the place where respondents live. In sum, the authors find important relationships between reflected race, proximity to the Border, and the construction of community division.
The daily experience of racialization varies across social contexts within the United States. For example, Cuban immigrants living in Miami are perceived by others differently than Cuban immigrants living in the Southwest, which in turn shapes how they see themselves (e.g., Newby and Dowling 2007). Although theoretical work on race often argues that racialized experiences vary by space, rarely is this measured or tested within a country. In this article, we consider the U.S.-Mexico Border 1 region because it is a social space with distinctive characteristics that set it apart from the rest of the United States. This Border is a key site of international and national contestation, has a long history of established Latinx communities who have not migrated but rather are geographically stable, and is an area where immigration is high and policing is particularly extensive (Doty 2007; Goldsmith et al. 2009; Heyman 2011; Massey 2009; Provine and Doty 2011; Rodriguez 1997). All of these characteristics are likely to shape the racialized experiences of people living there, especially those who identify as Latinx, because they are the target of much of the nationalist rhetoric and policing (Goldsmith et al. 2009; Goldsmith and Romero 2008; Provine and Doty 2011; Romero 2006). As immigration continues to alter the demography of the country and reshape how we think about ethnoracial categories, the Border becomes an increasingly important site for understanding the future of the United States at large.
Race is also often treated as a unidimensional feature of social stratification, even though theoretical and empirical work has demonstrated that it is a multidimensional social construct (Bailey, Loveman, and Muniz 2013; Irizarry 2015; Jones et al. 2008; Roth 2010, 2016; Saperstein and Penner 2012; Vargas 2015; Vargas and Stainback 2016). Racial self-identification (expressed race) is not always the same as how people believe that they are racially perceived by strangers (reflected race), an occurrence that is often referred to as racial mismatch (Roth 2010). How one believes one is racially and ethnically perceived can have social consequences across domains such as police interaction and health inequities (Campbell and Troyer 2007; Dowling 2014; Roth 2010). Our work unpacks the contemporary continuation of racial formation and meaning-making in U.S. society (Omi and Winant 2014), demonstrating how racialized experiences are not fully captured by a single racial measure (Roth 2010, 2016; Vargas and Stainback 2016).
Despite growing literature examining social context and racial mismatch, there is little empirical analysis of the links between the two factors. We ask how social context (Border or non-Border) and experiences with match and mismatch shape the social experience of community bonds. To test these relationships, we use the Texas Diversity Survey (TDS; Keith and Campbell 2015) to compare mismatch and community division (an indicator of distrust) among White and Latinx residents of Texas who live within the U.S.-Mexico Border region with that among those who live outside the region. With measures of racialization, skin tone, socioeconomic status, and discrimination not often captured in surveys, this survey allows us to more thoroughly assess the social inequalities associated with varying racialized experiences.
The Border Region
The U.S.-Mexico Border has a history of being a politically contested region (Hernández 2001). Under the Treaty of Guadalupe Hidalgo, the United States acquired the Borderlands from Mexico in 1848 (Del Castillo 1992; Hernández 2001). Anglos living on newly ceded territory treated Mexican Americans as inferior, stripping them of their land and racializing them as “indolent, ignorant, and debased” (Alonso 2008:34; Hernández 2001). Today’s racialization of Mexicans and Mexican Americans on the Border carries reminders of this early essentialism.
Today, many Border residents are residentially segregated into colonias, communities marked by substandard housing (Barton et al. 2015; Davies and Holz 1992; Mier et al. 2008; Sharkey, Dean, and Johnson 2011) and high poverty rates, including the second, third, and fourth poorest counties in Texas (Ura 2016). More than 5 million people, most of them Mexican immigrants, reside in the colonias (Barton et al. 2015).
Current research on demographics near the Border is limited. In Table 1 we use data from the 2010–2014 American Community Survey (ACS) to compute descriptive statistics for Texas areas inside and outside the Border region. We define the Border region as all of the ZIP code tabulation areas (ZCTAs) within 100 miles of the U.S.-Mexico Border, because by law the jurisdiction of U.S. Customs and Border Protection stretches 100 miles inland from the U.S.-Mexico Border, shaping residents’ experiences with law enforcement and local institutions throughout that region. Not surprisingly, Border area residents are more likely to not be U.S. citizens (17 percent vs. 10 percent), more likely to be Latinx (85 percent vs. 32 percent), and more likely to live in households with limited English spoken at home (6 percent vs. 2 percent) compared with other Texas residents. The median income gap between non-Latinx Whites and Latinxs inside ($18,000) and outside ($13,000) the Border region is large.
Five-year 2014 ACS Weighted Descriptive Statistics of Texas ZIP Code Areas Inside and Outside the Texas-Mexico Border Region.
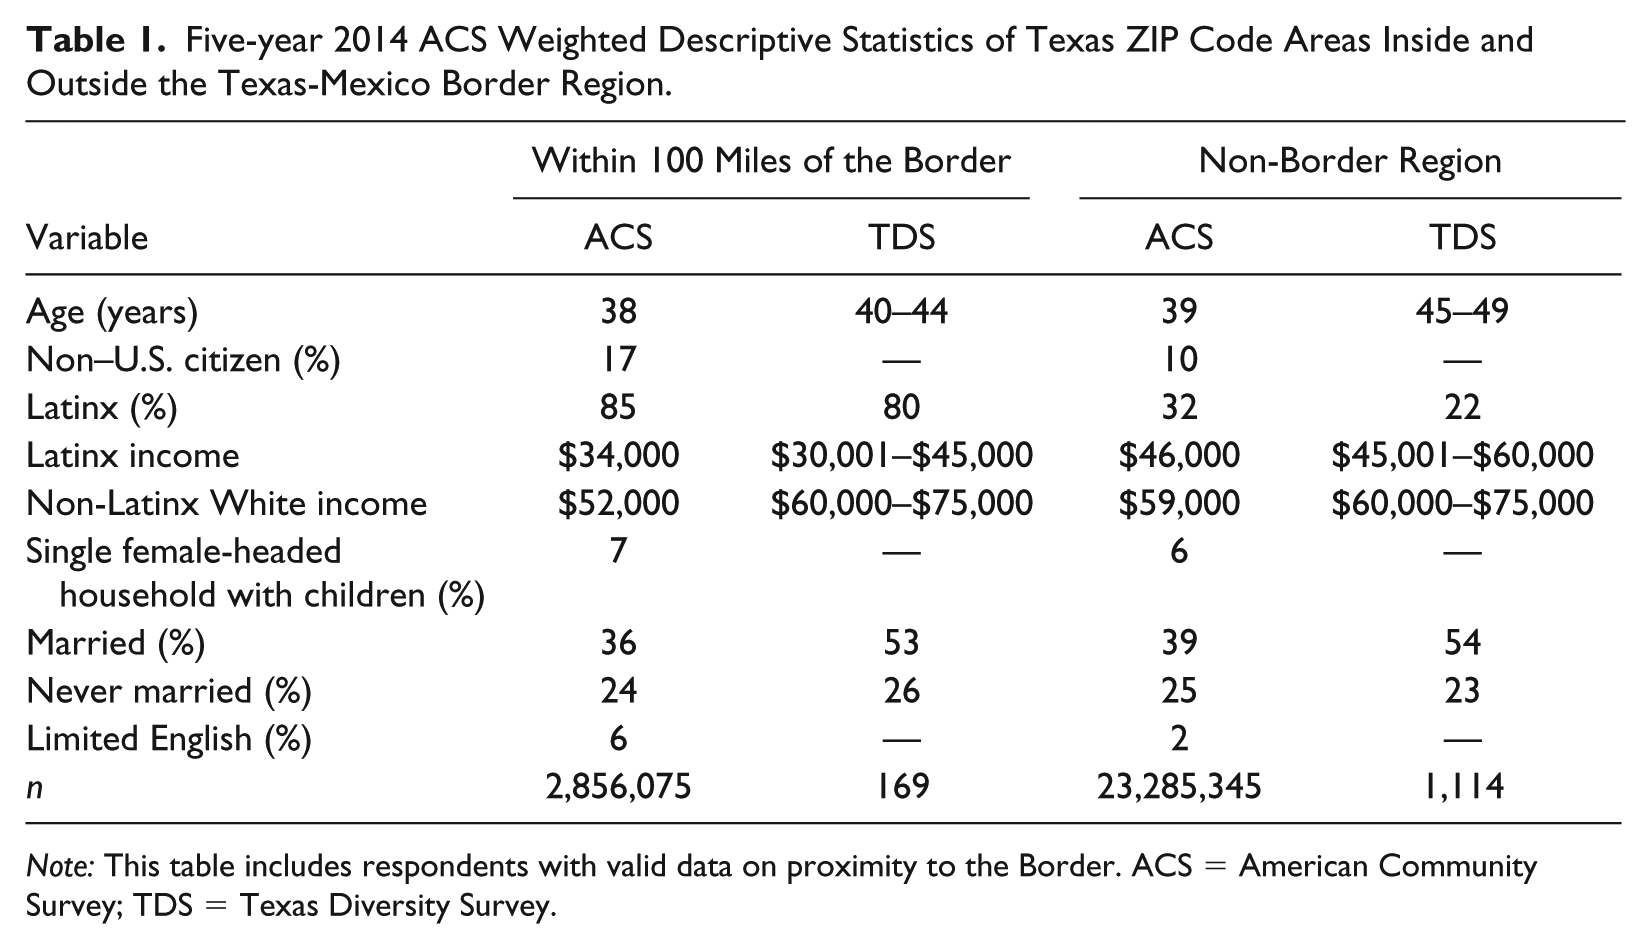
Note: This table includes respondents with valid data on proximity to the Border. ACS = American Community Survey; TDS = Texas Diversity Survey.
These historical, social, and demographic differences lead us to ask if the experience of race is different in this disproportionately impoverished, heavily Latinx, and politically charged space than in other regions of the state.
Racial Identity Mismatch
Measures of race can elicit self-identity (Roth 2010), self-identification (i.e., how an individual expresses his or her identity; Roth 2010; Saperstein 2006; Saperstein and Penner 2012, 2014), phenotypical characteristics (Gullickson 2005; Keith and Herring 1991; Monk 2016; Vargas 2015), ancestry (Gullickson 2016; Gullickson and Morning 2011), designation by others (Campbell and Troyer 2007; Harris 2002), and reflection (i.e., what the individual thinks others think; Cooley 1902; López et al. 2018; Jones et al. 2008; Roth 2016; Vargas and Stainback 2016). These dimensions often align with one another, but a growing body of literature demonstrates that these measures are less likely to match for Latinxs than Whites or Blacks (Campbell and Troyer 2011; López et al. 2018; Vargas and Stainback 2016). Campbell and Troyer (2011) found that 86 percent of their sample who identified as Latinx believed that others saw them as Latinx; the rest were most likely to report being perceived as White. In the same survey, 99 percent of Whites believed that they were correctly classified (Campbell and Troyer 2011). Vargas and Stainback (2016) similarly found, in a separate national study, that 87 percent of Latinxs and 97 percent of Whites believed that they were correctly racially identified by other Americans.
Existing literature concerning the nature of mismatch between expressed and reflected race is limited (Campbell and Troyer 2011; López et al. 2018; Porter, Liebler, and Noon 2016; Vargas 2015; Vargas and Stainback 2016). Self-identified Latinxs with light phenotypical characteristics and high socioeconomic status (SES) have a high probability to report being seen as White by others compared with their low-SES counterparts (Vargas 2015). Even self-identified Latinxs with dark phenotypical characteristics have a high probability to report being seen as White by others if they have a much higher SES (Vargas 2015), aligning with other findings showing that SES shapes racial perceptions (Saperstein and Penner 2012; Telles 2004). Race and ethnicity may also be inferred from context clues, such as the racial composition of the area. Observers are more likely to categorize people as part of a group if that group predominates in the local area (Porter et al. 2016). Similarly, interviewers are more likely to classify people as Black when they live in the inner city (Saperstein and Penner 2012). Here, we ask if proximity to the Border increases the likelihood that respondents think that others see them as Latinx, given the high percentages of Latinxs in Border communities.
What consequences might experiences with mismatch have for Latinxs? Although it is a rare experience for Whites, believing that they are misclassified is associated with poorer health (Campbell and Troyer 2011; Stepanikova 2010). It is a more common experience for people of color, for whom mismatch is associated with feeling more distant from the racial group and lower racial identity salience (Vargas and Stainback 2016) and, for some groups, more emotional distress (Campbell and Troyer 2007). In this study, we test whether it is also associated with feelings about their community. We do not include the experiences of Blacks in this study, because there are too few (n = 2) respondents with valid data who self-identify as Black and live within 100 miles of the Border.
Mismatch Terminology
Terminology used to describe racial identity and mismatch is not consistent (Roth 2010; Saperstein and Penner 2014; Vargas and Kingsbury 2016). We introduce six terms to refer to the identity categories tested in this paper: acknowledged Latinx, acknowledged White, unacknowledged Latinx, unacknowledged White, perceived Latinx, and perceived White. Although some of our terms share similar meanings to prior studies (i.e., acknowledged Latinx/White and concordance; see Saperstein and Penner 2014), we also use terms that measure different aspects of racial mismatch and do not align with previous work. Acknowledged Latinxs and Whites are respondents who believe that strangers’ perception of their race matches their own racial self-identification (i.e., a matched identity). Unacknowledged Latinxs identify as Latinx but believe that strangers do not acknowledge them as Latinx; unacknowledged Whites identify as White but believe that strangers do not acknowledge them as White (i.e., mismatched identity). Finally, perceived Latinxs do not identify as Latinx but believe that they are perceived as Latinx; perceived Whites do not identify as White but believe that they are perceived as White (i.e., mismatched identity). See Figure 1 for a summary of definitions. Note that individuals can be both unacknowledged Whites and perceived Latinxs, for example, but not all individuals who are in one category are in the other (and the same is true for unacknowledged Latinxs and perceived Whites), because some unacknowledged Whites believe that they are perceived as part of a third group.
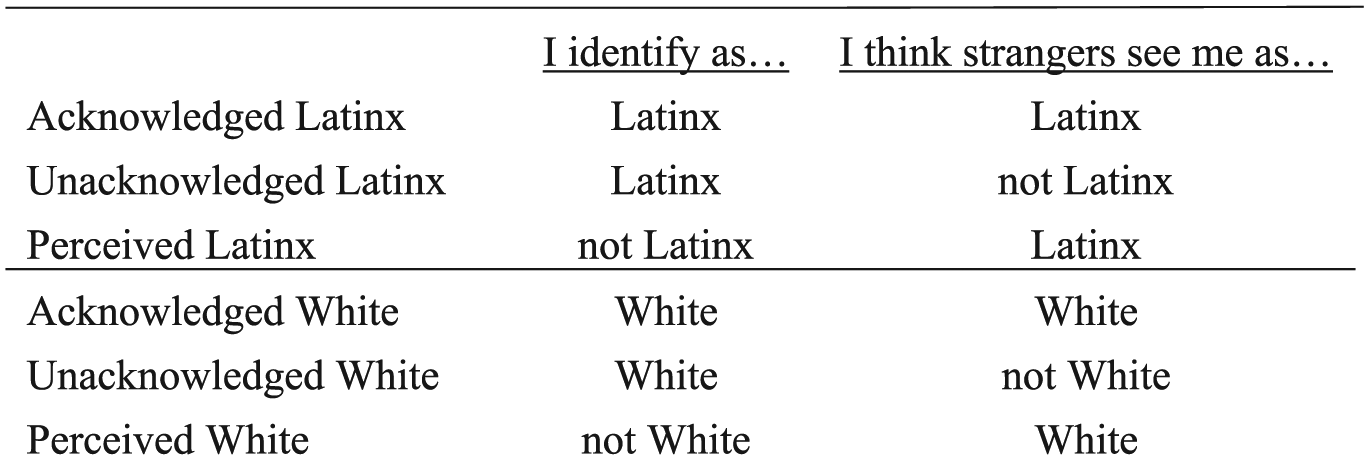
Racial identity mismatch terms.
We speculate that Latinxs may experience less mismatch in the Border context (which has both large Latinx communities and strong social connections with Mexico) compared with other areas. Those who self-identify as White may experience more mismatch in the Border region, because the White group is a numerical minority in many of the communities and the area is so strongly associated with Latinx communities. 2 On this basis, we hypothesize as follows:
Hypothesis 1: Latinxs who live near the Border are more likely to believe that strangers see them as Latinx (“acknowledged Latinx”) than Latinxs who live far from the Border (i.e., they will experience less mismatch).
In addition, we expect that this relationship will not be completely explained by the percentage of the ZCTA that is Latinx, because the characteristics of the space are not limited to demographics, but also include the political and institutional characteristics of the space.
Community Division, Context and Race
What are the consequences of these different experiences of race? We test the implications for community division, or a lack of neighborhood social cohesion and solidarity. Our work uses Sampson, Raudenbush, and Earls’s (1997) definition of neighborhood social cohesion as neighbors’ collective “willingness to intervene on behalf of the common good” (p. 918), as their definition is the basis for the measures in our data set. Numerous studies examine the relationship between Latinxs and social disorganization (Lee, Martinez, and Rosenfeld 2001; Olson et al. 2009; Sampson 2008), disproving the stereotype that a greater Latinx presence in an area increases criminality (Lee et al. 2001; Olson et al. 2009; Sampson 2008). Perceptions of Latinx criminality are often associated with undocumented status, particularly on the Texas-Mexico Border (Dowling 2014; Goldsmith et al. 2009; Heyman 2014; Romero 2006). To distance oneself from this perception, it is common for Mexican Americans on the Border to identify as “White” compared with other parts of the state (Dowling 2014).
Although little work has examined the connection between community division and racialization, we posit that community division is exacerbated by social context (Chanley 2002; De Genova 2004; Mizrachi, Drori, and Anspach 2007; Vila 2003). For instance, previous studies examining community trust found that increased neighborhood diversity is associated with reduced levels of trust (even among members of the same racial and ethnic group; see Putnam 2007:148) (Alesina and La Ferrara 2002; Stolle, Soroka, and Johnston 2008). Focusing on the Border, this context has been and continues to be a site of social, political, cultural, and economic conflict (e.g., construction of the Border wall, militarization of police, and strict enforcement; Heyman 2011; Massey 2009; Provine and Doty 2011; Rodriguez 1997). The Border is a context where Latinx residents are often subjected to police mistreatment, surveillance, and racial profiling (Doty 2007; Goldsmith et al. 2009; Romero 2006; Sabo et al. 2014). For instance, Heyman (2008) reported that predominately Latinx social locations on the Border (i.e., neighborhoods, flea markets, and transportation hubs) are frequently patrolled by Border law enforcement. As a result, it is common for foreign-born Latinxs to avoid communal spaces (i.e. schools, hospitals, parks) and not interact with neighbors out of fear of being deported (De Genova 2004; Hagan, Rodriguez, and Castro 2011; Talavera, Núñez-Mchiri, and Heyman 2010).
Compared with the non-Border areas, we anticipate that as a whole, the Border is a context that fosters higher levels of community division (regardless of racial match or mismatch) because of the racialization of Latinxs, intensified by geographic (i.e., close proximity to Mexico; see Dowling 2014; Goldsmith et al. 2009) and demographic (i.e., higher proportion of foreign-born Latinxs compared with other parts of the state) characteristics. Therefore, we hypothesize as follows:
Hypothesis 2: Self-identified Latinxs (acknowledged and unacknowledged Latinxs) who live near the Border will report higher levels of community division compared with Latinxs who do not live near the Border.
We also hypothesize that the amount of community division will vary on the basis of racial mismatch. Similar to Dowling’s (2014) finding that “White” categorization is used as a tool to assert citizenship and reduce discrimination, we argue that Border residents who are perceived White (who believe that they are seen as “White” by strangers but self-identify as “not White”) or who are acknowledged White will report lower community division because of their ability to avoid the stigma attached to Latinxs in this area. 3 Acknowledged Latinxs, in contrast, will report more community division, as they are more susceptible to discrimination. We think that both how individuals think others see them and how they self-identify will matter for feelings about community division.
Hypothesis 3: Self-identified Latinxs who believe that they are seen as Latinx (acknowledged Latinxs) and live near the Border will report higher levels of community division than Latinxs who believe that they are not seen as Latinx (unacknowledged Latinxs) and live close to the Border.
In creating these hypotheses, we rely on a social constructionist perspective. We take seriously the claims social construction makes: that race is not fixed but rather socially created in specific social spaces and contexts, and therefore the experience of it will vary depending on place, individual, and group characteristics (Campbell 2007; Cornell and Hartmann 2007; Omi and Winant 2014; Roth 2010).
Data and Methods
We use the 2015 TDS, a representative telephone survey designed to measure the racial attitudes and experiences of Black, Latinx, and White Texas residents aged 18 years and older. Texas is an ideal context to test questions such as these, because it has a large Border region, a large region far from the Border, and a lot of contextual variation within the state, from some of the largest cities in the United States to very remote rural areas (see Figure A1 in the Appendix for the geographical dispersion of TDS respondents). The survey was conducted in both English and Spanish by the Public Policy Research Institute at Texas A&M University, with a sampling strategy stratified by race to ensure adequate sample sizes for Whites, Blacks, and Latinxs. 4 Ninety-eight percent of the completed surveys were conducted on cell phones. Of the 1,322 completed surveys, 1,306 had residential ZIP codes successfully matched to ZCTAs, as described below. The responses were weighted in Stata using the “svy” commands, using weights constructed from the 2014 ACS population estimates by age, race, and sex.
We included only respondents who had valid data on all of the variables included in the descriptive statistics in Table 2 (n = 877), using listwise deletion for all respondents with missing data, and our analysis is based primarily on the subsample who identified or believed that they were perceived as White or Latinx. We used metadata from the 2010–2014 ACS and ZCTA data from the Missouri Census Data Center (2013) to construct area-level variables such as percentage Latinx in the ZCTA, median household income in the ZCTA, and urban ZCTAs. All our ordinary least squares regression models are run as two-tailed tests.
Weighted Descriptive Statistics of Latinx and Whites in the Texas Diversity Survey (n = 877).
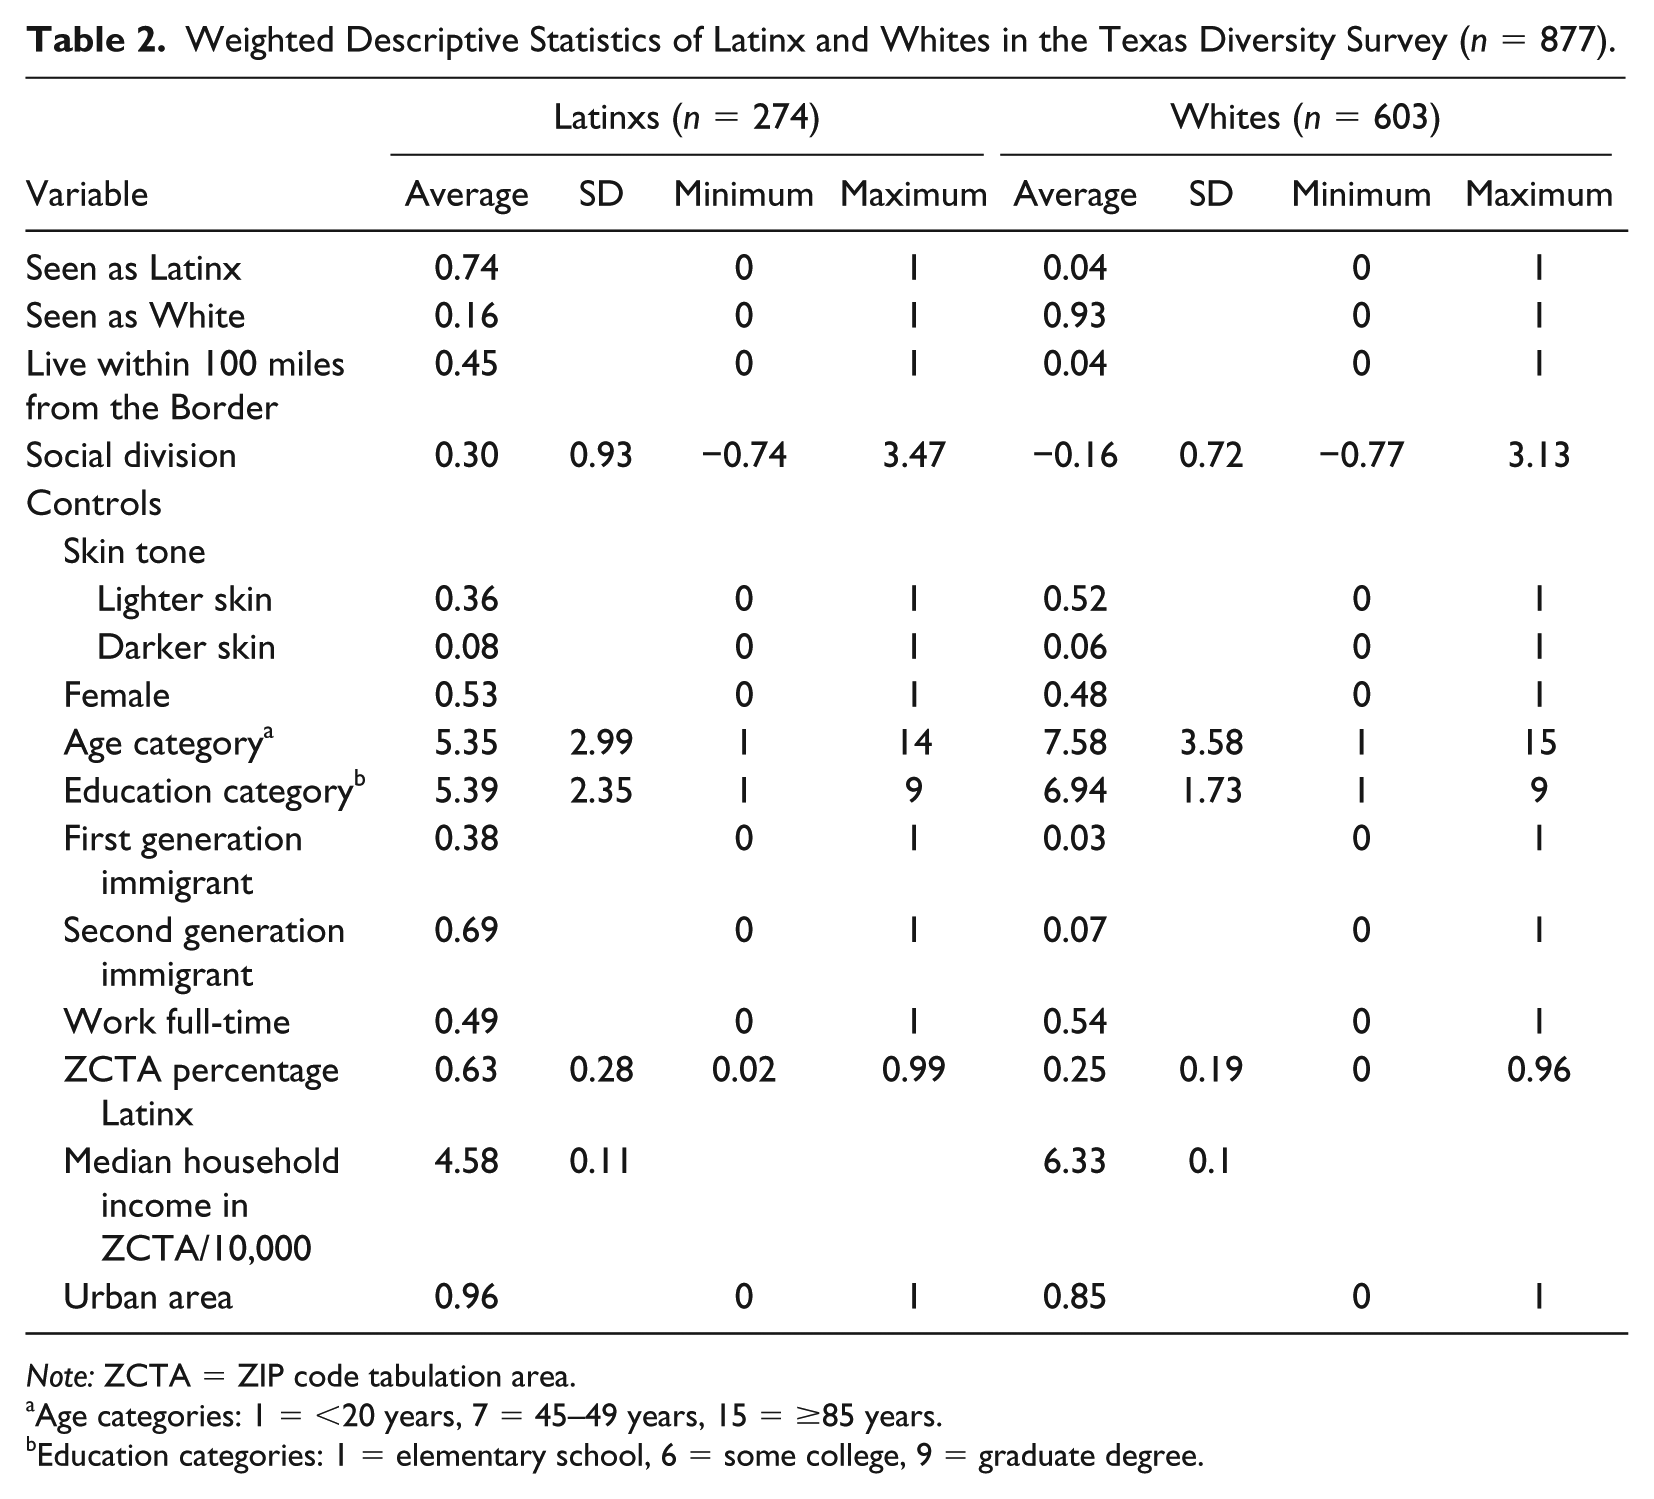
Note: ZCTA = ZIP code tabulation area.
Age categories: 1 = <20 years, 7 = 45–49 years, 15 = ≥85 years.
Education categories: 1 = elementary school, 6 = some college, 9 = graduate degree.
Key Variables
Self-identified Racial Background
This survey asked respondents a combined race/ethnicity question: “What is your racial or ethnic background? Please choose
Reflected Race
Later in the survey, respondents were asked “What race or ethnicity do
Skin Color
Respondents were asked to describe their own skin color 7 : “Compared to most people in your racial or ethnic group, do you believe your skin color is very light, light, medium, dark, or very dark?” We combined very light and light into one category and dark and very dark into another category, making a trichotomous skin tone variable (1 = lightest skin tone, 3 = darkest skin tone). We include skin tone because of its clear relationship with reflected race (i.e., lighter skinned people are more likely to believe that others perceive them as White). We also test a model without skin tone, to examine the full relationship between reflected race and community connection, which may be in part shaped by the skin tone differences.
Community Division
Four variables in the TDS (inspired by the National Latino and Asian American Study; Alegria et al. 2004) measure community division. Respondents were asked if they believed it to be very true, somewhat true, not very true, or not at all true that people in their neighborhood or community “get along well,” “can be trusted,” “help out in emergencies,” and “look out for each other.” Combining items into a single scale is common in previous work (Alegria et al. 2004; Walton 2012; Yi et al. 2016) and sensitivity testing showed it was appropriate here. Therefore, we proceeded with a standardized index (α = 0.81) of community division as our dependent variable. In the TDS, each of the four variables ranges from 1 = very true to 4 = not at all true; we standardized these variables to have a mean of 0 and a variance of 1 before averaging.
Geography
We matched the ZIP codes where respondents lived to ZCTAs created by the U.S. Census Bureau. ZCTAs were created by assigning census blocks to the residential ZIP code that occurs most frequently within that block; the geographic boundaries are therefore not exactly the same as ZIP codes but are an approximation of local community information. ZIP codes vary in land area and population; sparsely populated areas have much more land area in a ZIP code than densely populated areas, for example, so rural ZCTAs encompass more land area than urban ones (Grubesic and Matisziw 2006). Our key geographic variable is whether at least 50 percent of the land area in the ZCTA lies within 100 miles of the U.S.-Mexico Border. 8 We use a dummy variable to compare respondents living within 100 miles of the Border and farther than 100 miles from the Border. We chose 100 miles as the cutoff because Customs and Border Protection has authority throughout this zone, and their activities can affect the daily lives of residents in a way that may shape attitudes and experiences (e.g., by maintaining regular checkpoints on highways that stop travelers driving within the United States) (Osete 2016). Thus, in Border states, living within 100 miles of the U.S.-Mexico Border is a salient distinction for daily life.
We also measure the percentage of residents of the ZCTA who self-identified as Latinx, using ACS data. Including this variable allows us to test whether the mechanism connecting geography to community attitudes is a difference in demographic composition.
Controls
Our control variables consist of gender, age, education, generation in the United States, full-time employment, urban, and median household income. Gender was coded with female as 1 and male as 0. To measure age, we grouped open-ended responses into 5-year age categories (e.g., 45–49 years) to accommodate both respondents who named a specific age and those who mentioned a range. Education refers to the highest grade in school the respondent completed, with those with a high school degree or GED or less as the reference category and all respondents with more education than a high school degree or GED coded as 1. Generation in the United States was based on questions about the birthplace of participants, participants’ mothers, and participants’ fathers. We include data on 108 first-generation Latinxs, 86 second-generation Latinxs, 17 first-generation Whites, and 29 second-generation Latinxs. Because of the small sample size of first- and second-generation Whites, we combine first- and second-generation respondents into a single category of respondents with close family histories of immigration (i.e., respondents born abroad or with a parent born abroad) Full-time employment is a binary variable for which 1 equals working full-time. We derived the urban data from the ZCTA metadata (Missouri Census Data Center 2013), recoding the percentage urban into a binary variable, where 1 indicates that more than 50 percent of the ZCTA is urban. Median household income in the ZCTA comes from the ACS data.
Results
Racial Identity Mismatch
Reflected race varies among TDS respondents by self-reported race, as shown in Table 3. Most Whites (93 percent) and Blacks (86 percent) believe that strangers see them as their self-identified race, while 74 percent of Latinxs believe that strangers identify them as Latinx. Sixteen percent of Latinxs in our sample believe that strangers see them as White, 7 percent as other, and 2 percent as Black. Thus, Latinxs have higher rates of racial identity mismatch than Whites or Blacks, and when Latinxs think they are misidentified, they most often believe that they are seen as White.
Descriptive Statistics of Self-reported versus Reflected Race (Full Sample n = 1,226).
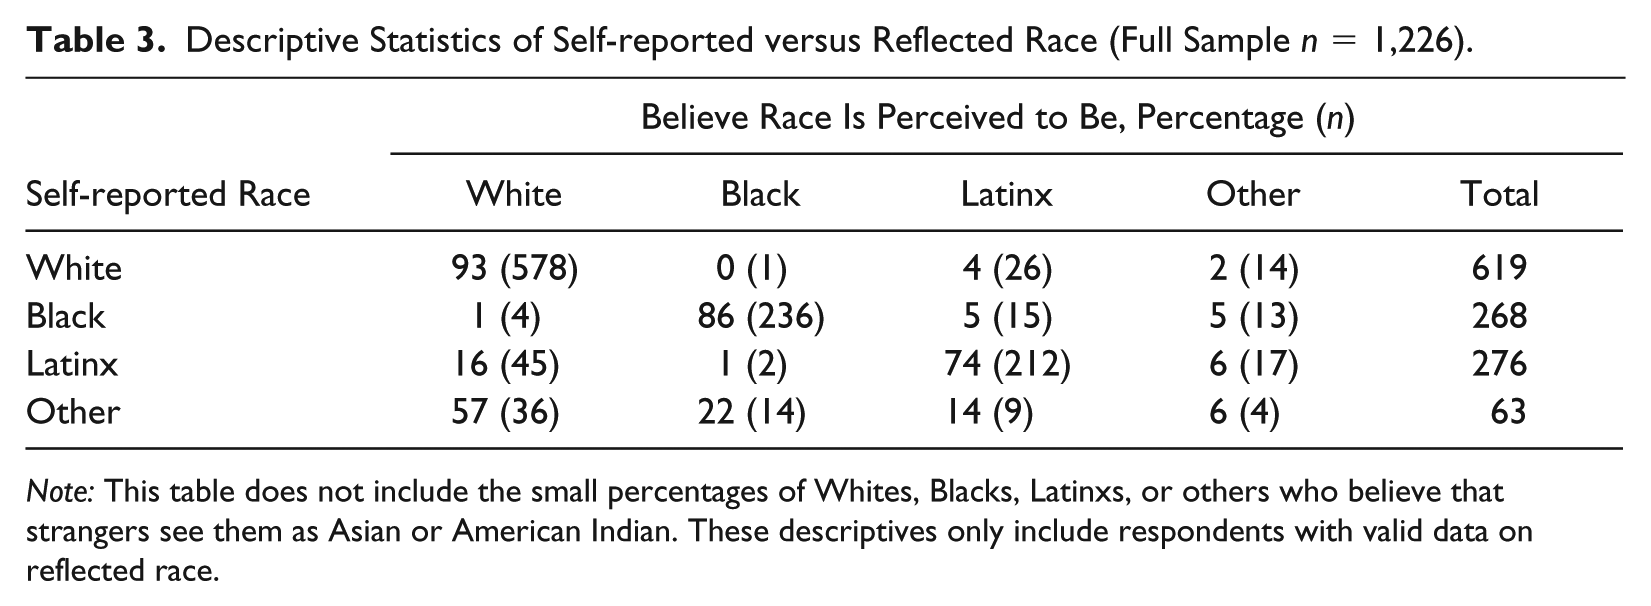
Note: This table does not include the small percentages of Whites, Blacks, Latinxs, or others who believe that strangers see them as Asian or American Indian. These descriptives only include respondents with valid data on reflected race.
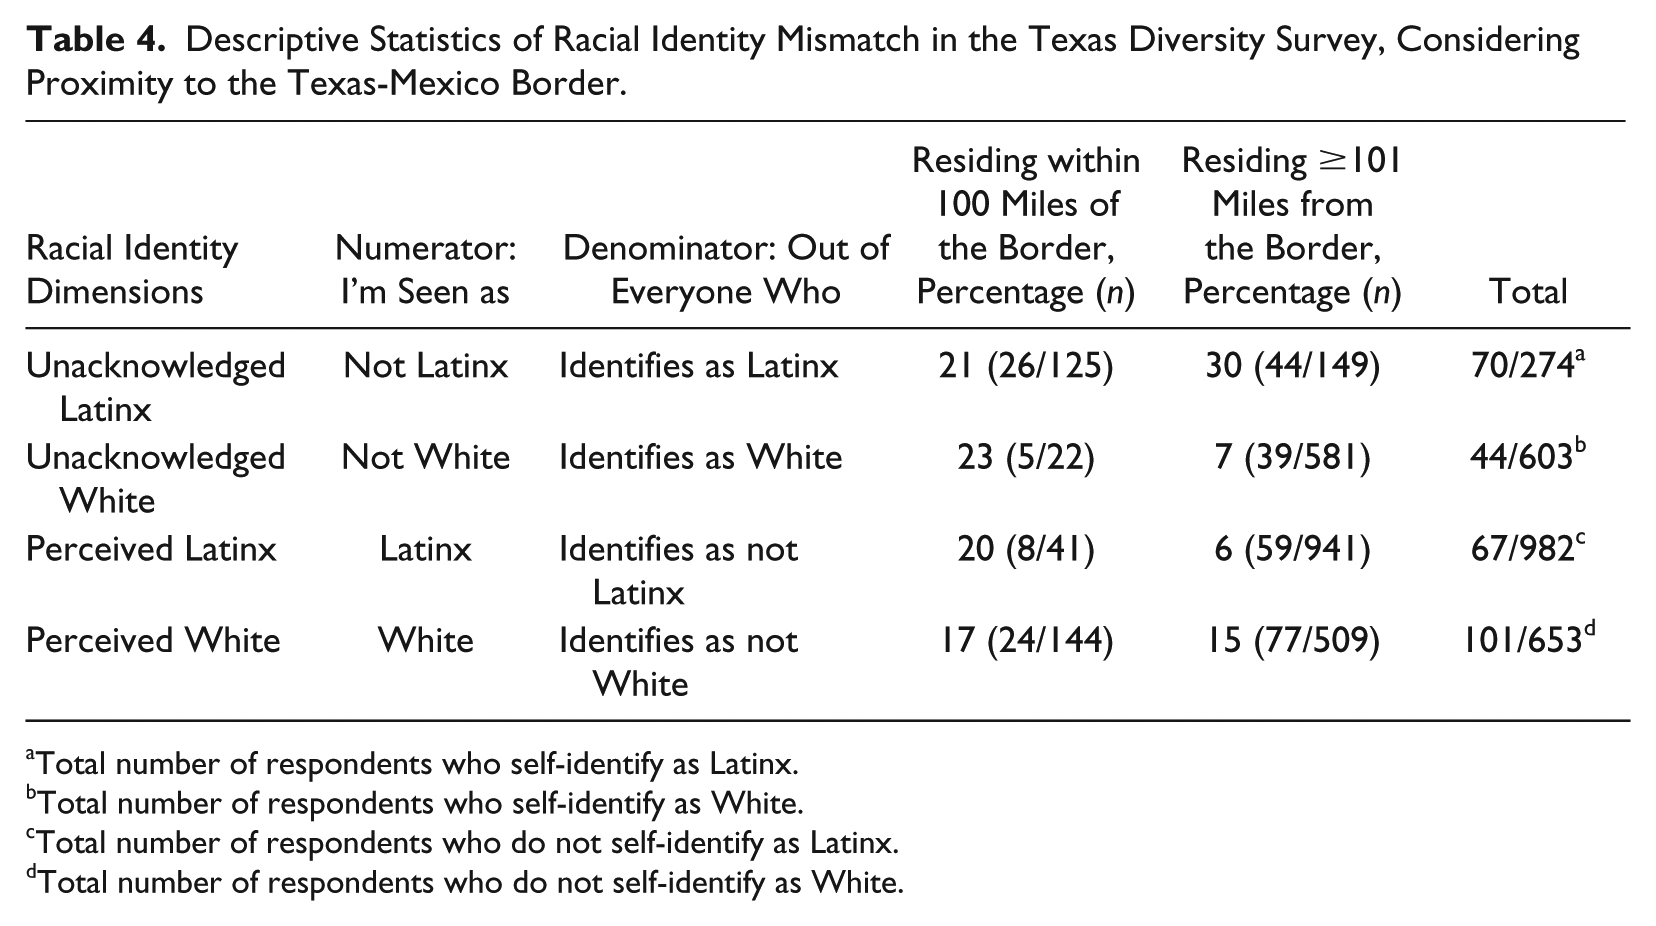
Table 4 focuses on descriptive statistics of racial identity mismatch among Latinxs and Whites within and outside the Border region. 9 Table 4 shows the four possible mismatch categories: unacknowledged Latinx and White and perceived Latinx and White. Our two other racial identity categories, acknowledged Latinx and White, are not included in Table 4, because these categories indicate racial identity matching.
Descriptive Statistics of Racial Identity Mismatch in the Texas Diversity Survey, Considering Proximity to the Texas-Mexico Border.
Total number of respondents who self-identify as Latinx.
Total number of respondents who self-identify as White.
Total number of respondents who do not self-identify as Latinx.
Total number of respondents who do not self-identify as White.
As predicted, Texas Latinxs living more than 100 miles from the U.S.-Mexico Border are more likely to have racial identity mismatch than their coethnics living in the Border region. Within the Border region, 21 percent (n = 26) of Latinxs are unacknowledged, while 30 percent (n = 44) of Latinxs living more than 100 miles from the Border are unacknowledged. Recall from Table 3 that when Latinxs believe that they are racially identified as another race, they are most likely to believe that they are perceived to be White, followed by other race and then Black. Regarding the other possible form of racial mismatch, we find that 6 percent of people who do not identify as Latinx and reside more than 100 miles from the Border believe that strangers see them as Latinx (n = 59). The sample size for perceived Latinxs living in the Border region (n = 8) is too small for reliable analysis.
Unacknowledged Whites make up a much smaller share of the population. Only 7 percent (n = 39) of Whites living more than 100 miles from the Border are unacknowledged. Because of the small sample size near the border (n = 5 unacknowledged Whites), we do not have statistical power to compare by Border proximity. We find that 17 percent (n = 24) of people who do not identify as White and live near the Border believe that they are perceived as White, compared with 15 percent (n = 77) of those who live farther from the Border, contradicting our expectation. That is, racial identity mismatch is about the same for perceived Whites closer to and farther from the Border. Recall that when Whites believe that they are racially identified as another race, they are most likely to believe that others see them as Latinx, followed by other race and then Black.
In Table 5, we model the relationship between the control variables, geography, and whether Latinxs and Whites believe that their racial identity is acknowledged. We find statistically significant variations by skin tone, age, education, immigrant status, and racial composition of the ZCTA. Light-skinned Latinxs are less likely to believe that strangers view them as Latinx (–0.21; p < .01) than medium-skinned Latinxs, while having darker skin is not significantly associated with identity match. Some groups of Latinxs younger than 50 years and Latinxs older than 75 years experience significantly more identity match than 50- to 55-year-old Latinxs. Finally, Latinxs who are first-generation immigrants are more likely than those who have resided in the United States for three generations or more (0.26; p < .01) to believe that strangers acknowledge them as Latinx.
Logit Model of Acknowledged Race (Identity Match) among Latinxs and Whites (Subsample n = 877).
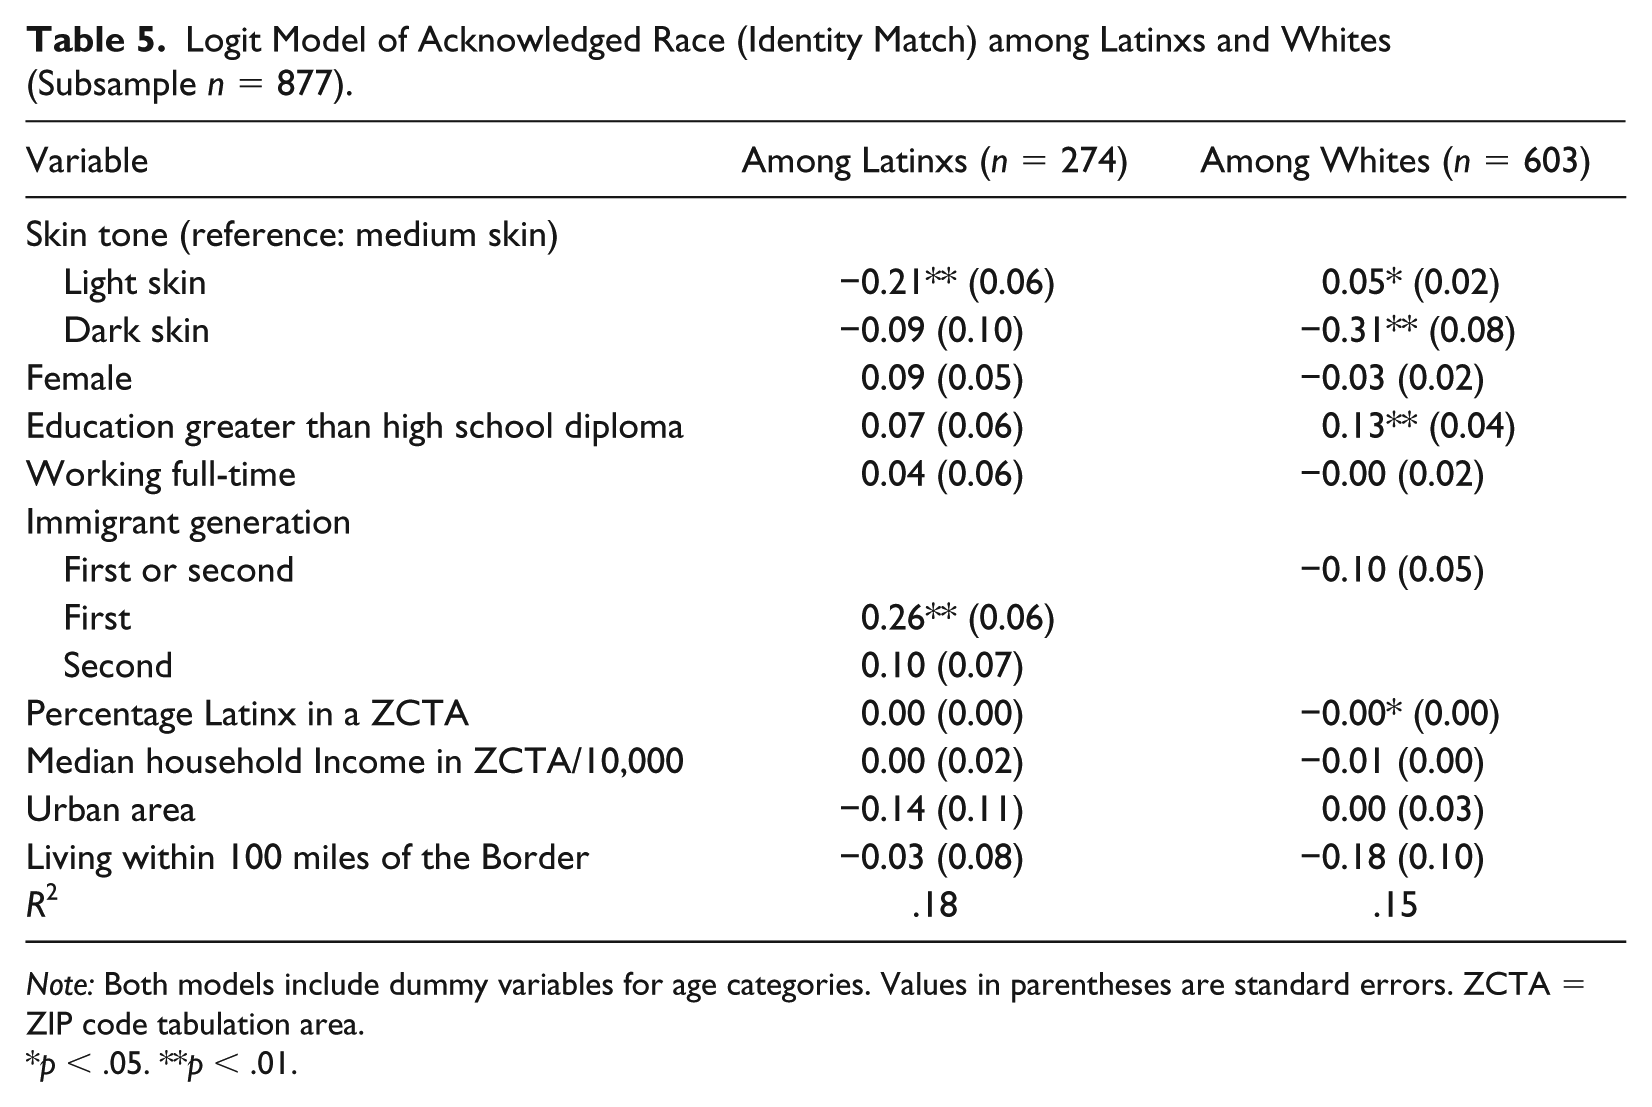
Note: Both models include dummy variables for age categories. Values in parentheses are standard errors. ZCTA = ZIP code tabulation area.
p < .05. **p < .01.
For Whites, as skin tone lightens they are more likely (0.05; p < .05), and as skin tone darkens they are less likely (–0.31; p < .01), to believe that strangers see them as White. As education increases, Whites are more likely to believe that strangers see them as White (0.13; p < .01). Last, Whites are less likely to believe that strangers see them as White if they live in a ZCTA with a large Latinx population (–0.00; p < .05).
These patterns show us that, as expected, those with lighter skin believe that they are not seen as Latinx and believe that they are seen as White. We also see how social characteristics matter: immigrant status is related to being perceived as Latinx, and education is related to being perceived as White. Clearly, then, stereotypes are shaping patterns of mismatch. Context matters as well, as we see for Whites who perceive more mismatch in heavily Latinx areas. Contrary to our hypotheses, however, living in the Border region is not associated with mismatch after controlling for individual and community characteristics.
Community Division
Do these patterns of mismatch have consequences for feelings about community? We find important descriptive differences in community division by racial identity match and mismatch among Latinxs, shown in Figure 2. Acknowledged Latinxs living near the Border and unacknowledged Latinxs living far from the Border report feel the most community division. This suggests that believing that one is seen as Latinx near the Border and not being acknowledged as Latinx far from the Border are negatively related to community integration. Overall, our expectation that acknowledged Latinxs would report higher community division closer to the Border is supported, but the differences shown in Figure 2 are very small (<1 standard deviation for comparisons between acknowledged Latinxs near and far from the Border).
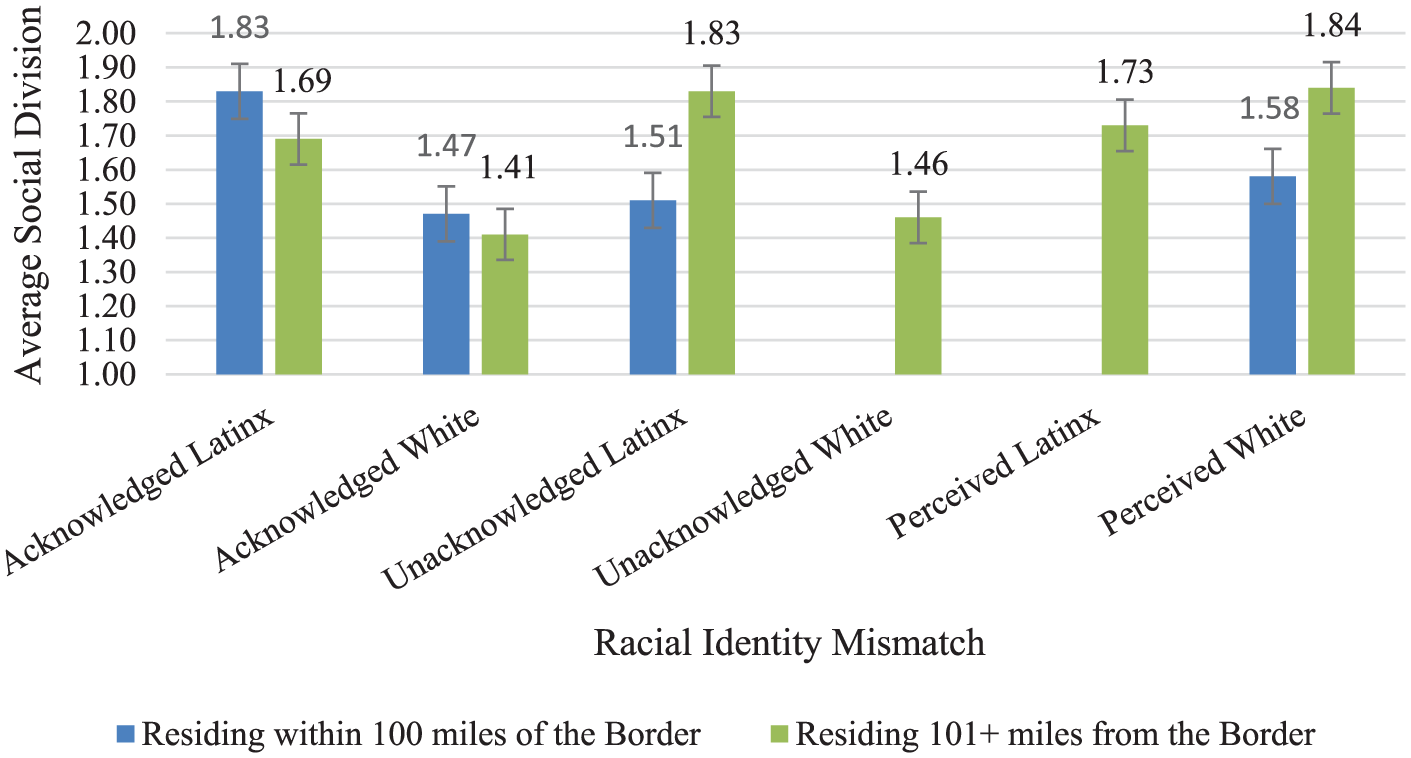
Social division, by racial identity dimensions and proximity to the U.S.-Mexico Border.
Acknowledged Whites report relatively similar (low) average levels of community division regardless of proximity to the Border, as do unacknowledged Whites living more than 100 miles from the Border. This finding indicates that proximity to the Border and having racial identity match are not connected to community division for Whites.
Our regression model shown in Table 6 indicates that living within 100 miles of the Border is associated with decreased community division among Latinxs (–0.61; p < .05). Yet when Latinxs live close to the Border and believe that strangers acknowledge them as Latinx, they report increased community division (0.54; p < .05). Among Whites, racial identity match is not significantly connected to community division regardless of social context.
Models of Community Division with 100-mile Definition of the Border (Subsample n = 877).
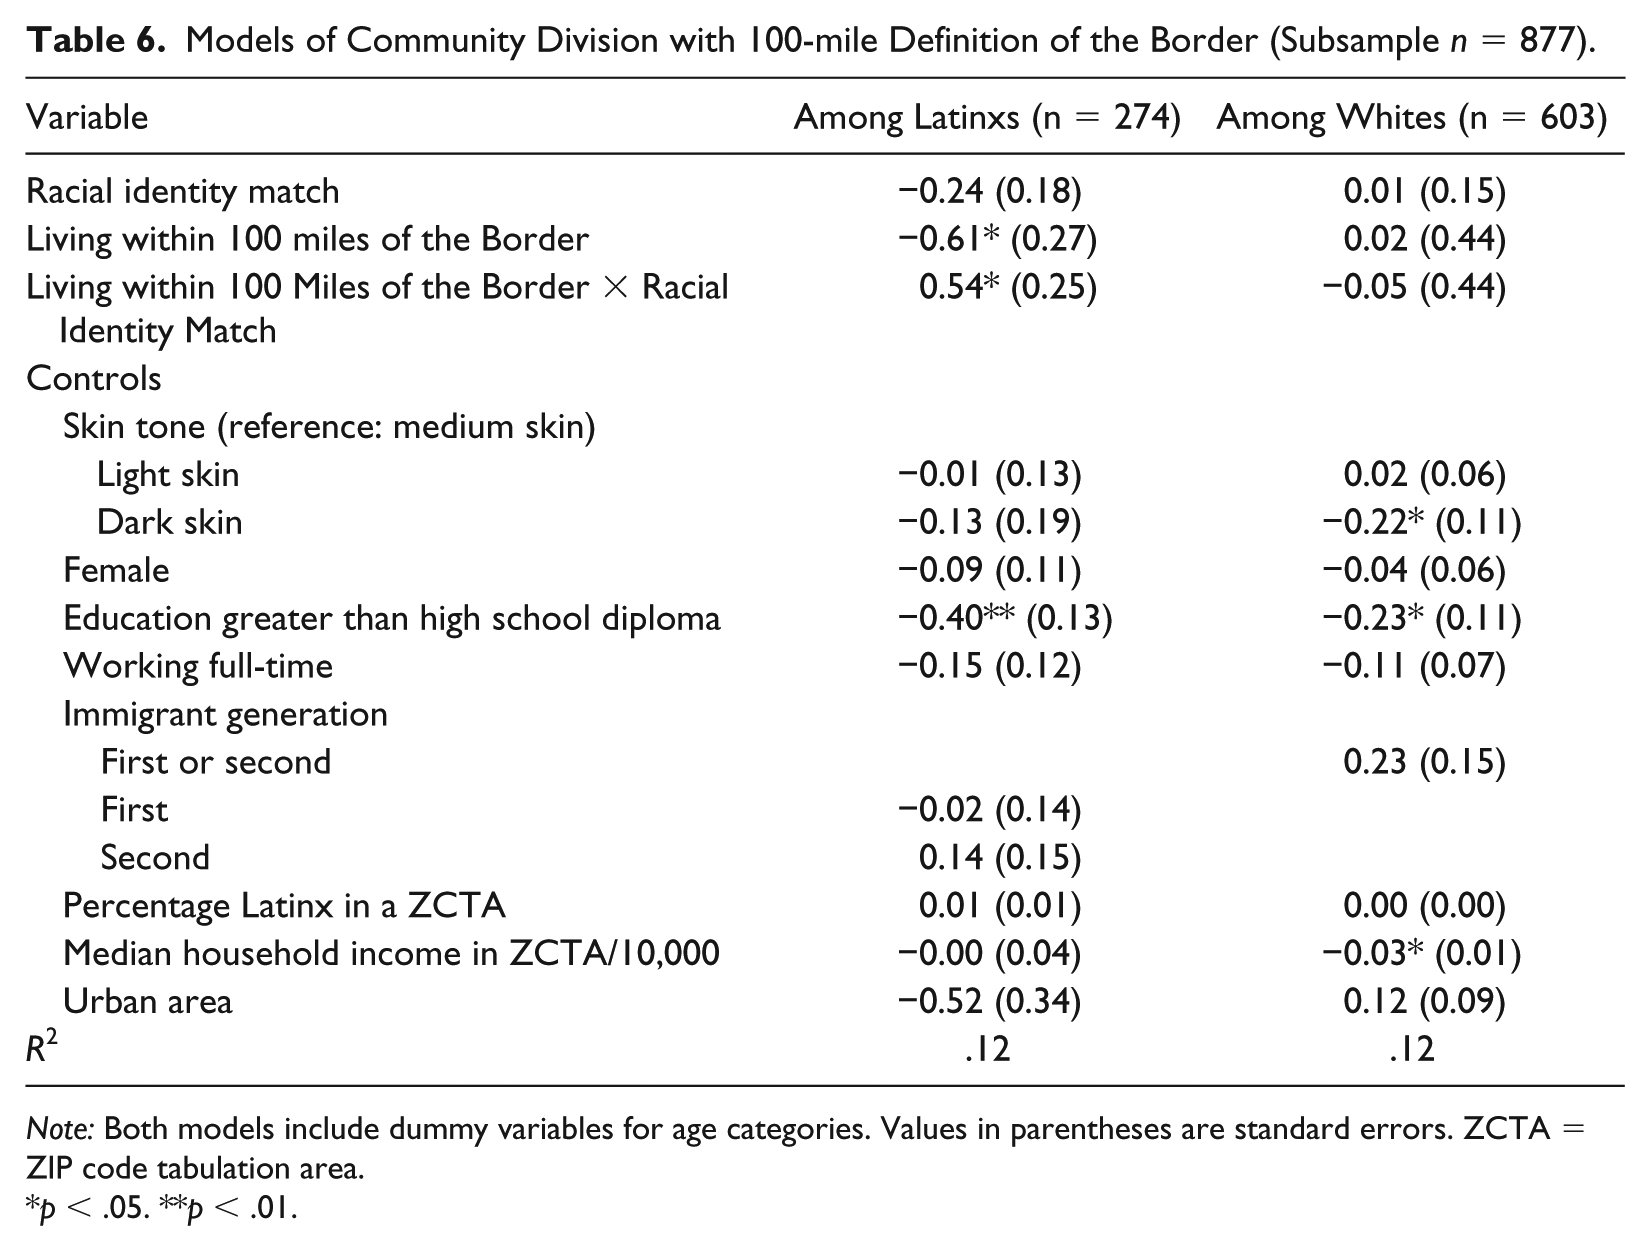
Note: Both models include dummy variables for age categories. Values in parentheses are standard errors. ZCTA = ZIP code tabulation area.
p < .05. **p < .01.
The relationships between other variables in these models also vary by race. Darker skinned Whites are less likely to feel community division compared with their medium-skinned coethnics (–0.22; p < .05). As age increases, Latinxs are significantly more likely and Whites are significantly less likely to experience community division. Advantage is associated with less division: both Latinxs (–0.40; p < .01) and Whites (–0.23; p < .05) with more than a high school degree report significantly less community division, and as median household income increases, Whites feel less community division (–0.03; p < .05). These findings highlight that the Border context is connected to feelings of community division for Latinxs but not Whites and that skin tone, age, education, and median household income are significantly associated with community division as well.
Sensitivity Tests
Although we include racial match and skin color in our full model, we recognize that racial match is correlated with skin tone. We estimated the above model without skin color, in order to examine the full relationship between mismatch and community division, and found that the majority of the effects that were significant in the full model remain significant, and all effects are in the same direction. Refer to Table A1 in the Appendix to see this model without skin tone. We also tested for interaction effects between proximity to the Border and several control variables; this model is available upon request. 10
In addition, we tested other ways of operationalizing distance from the Border. Using a 50-mile boundary instead of a 100-mile boundary yields virtually the same results (available upon request). 11 We also tested models using linear distance (miles) from the Border. Mileage from the center of the ZCTA to the Border is significantly connected to higher levels of community division for Latinxs (0.23; p < .05), and the interaction between mileage from the Border and racial identity match remains negative (–0.19; p < .05). See Table A2 in the Appendix.
Limitations
The greatest limitation to this work is the limited sample size, which required choices such as collapsing first-generation (n = 17) and second-generation (n = 29) White immigrants into one group and collapsing skin tone into fewer categories. Variations in immigrant experiences may be better teased out by future research with larger sample sizes of these populations. Relatedly, the TDS does not ask respondents to indicate their national origin, preventing us from being able to distinguish between Mexicans and other ethnic origin groups. The TDS also does not include a measure of levels of English fluency. Most respondents chose to take the survey in English (93 percent of all respondents) rather than Spanish (7 percent), which is similar to the rates of limited English ability found in the ACS data in Table 1, suggesting that our study represents the language diversity of the state well, but we cannot test how levels of comfort with English relates to these patterns of mismatch or community division.
In addition, the TDS has one question that combines race/ethnicity, rather than two separate questions. This prevents us from comparing White and Black Latinxs, unless they identify as multiracial (i.e., choose both categories). Most important, this survey includes only measures from the respondent’s perspective (self-reported skin tone, reflected race, etc.). It is important for future research to continue to investigate how these measures differ from outsiders’ reports of the individuals’ observed race and skin tone. These measures may be less important for mechanisms that focus on the individuals’ perceptions (such as how integrated they feel into their community) but will be essential for outcomes like discrimination and housing segregation (Roth 2016).
Discussion and Conclusion
The U.S.-Mexico Border is a space with different racialization experiences than the rest of the state of Texas, as recent theorizing on variations in how race is lived in daily life would predict (Campbell, Bratter, and Roth 2016). Individuals who live near the Border are more likely to self-identify as Latinx, but they are also more likely believe that they are perceived as Latinx even if they do not identify as Latinx. This evidence, found in Table 4, supports our first hypothesis: Latinxs who live near the U.S.-Mexico Border are more likely to believe that strangers see them as Latinx (i.e., they will experience less mismatch). The implication of this mismatch is a popular belief that the Border is even more populated by Latinxs than it really is; there are high rates of Latinx self-identification, but even higher rates of perceived Latinxs. Homogenous spaces, then, are perceived as more homogeneous than they really are. Table 5 shows that the Border does not have significantly different rates of mismatch once we introduce all of our controls but that living in a ZIP code with more Latinxs still makes self-identified Whites less likely to believe that they are seen as White.
Our second hypothesis (self-identified Latinxs who live near the Border will report higher levels of community division compared to Latinxs who do not live near the Border) was supported for acknowledged Latinxs but not for unacknowledged Latinxs (Table 6). We noted earlier that previous studies indicate increased neighborhood diversity is associated with reduced levels of trust (Alesina and La Ferrara 2002; Stolle et al. 2008) and that our work reveals that community division is lower among Latinxs and not significantly associated with Whites living closer to the Border. These findings align with the literature on community trust and diversity. Furthermore, we find support for our third hypothesis: self-identified Latinxs who believe that they are seen as Latinx (acknowledged Latinxs) and live near the Border are more likely to report higher levels of community division than Latinxs who believe that they are not seen as Latinx (unacknowledged Latinxs) and live close to the Border. Among Latinxs who live closer to the Border, acknowledged Latinxs experience more community division, highlighting the negative consequences of believing that one is seen as part of the stigmatized group in a highly policed context such as the Border region.
When we consider how the Border context is connected to reflected race among Whites, we find that Whites who live near the U.S.-Mexico Border are more likely to believe that strangers see them as Latinxs than Whites who live far from the Border (e.g., they will experience more mismatch), although the small sample makes us cautious about this interpretation. We also find that darker skin decreases Whites’ reported community division. Darker skinned Whites might feel more included in diverse or minority-dominated settings, decreasing potential feelings of rejection or division. We encourage further research to delve into the phenomenon of racial identity mismatch among Whites in majority-minority, politically charged spaces.
These findings demonstrate the importance of considering how people experience race and space when we consider experiences of community support. Unacknowledged Latinxs may report less community division when they live closer to the Border because they feel less visible and therefore more protected from discrimination in their community. Hence, being perceived as not Latinx becomes more of a benefit closer to the Border. Unacknowledged Latinxs may receive other benefits from the dominant White group that they would not experience further from the Border, such as benefits associated with hiring, policing, or housing practices in the more hostile Border context. Acknowledged Latinxs reporting more community division when they live closer to the Border may indicate higher levels of stress, which may be related to the increased Border security and heightened surveillance of Latinxs who also believe others see them as Latinx in this particular social context.
In addition, we consider the potential ramifications of Latinxs’ believing that strangers identify them as Latinx closer to the Border and in areas with larger Latinx population shares. Latinxs’ feeling of belonging to the community may decrease because of racial profiling and discrimination. Dowling (2014) found that Mexican Americans living in Texas who experience discrimination either minimize their experiences in order to feel like part of a larger “American” community or assert that their experiences of discrimination remind them that Latinxs are different from White Americans. Asad and Rosen (2018) found that Hispanic immigrants in Dallas believed that their ethnicity triggered suspicion. Novak (2017) reported preliminary findings that Latinxs who live in homogenous spaces do not feel as close to their community because a larger number of coethnics leads Latinxs to be more visible and believe that they are more likely to be targets of discrimination. Further exploration of the social and everyday experiences of individuals who do and do not believe that they are perceived as Latinx would help illuminate the mechanisms by which this occurs.
The outcomes of Texans living near to and far from the Border allow us to anticipate the future impact of demographic changes nationwide as more of the country comes to resemble the demographic makeup of Texas today. It also demonstrates that social context shapes the experience of inhabiting an ethnoracial category; being perceived as Latinx has a different social meaning and set of consequences near the U.S.-Mexico Border than it does in other areas, even in other areas with large Latinx populations. What we see in these results—especially the gaps between how respondents self-identify and how they think they are perceived by strangers—is a likely future for the rest of the United States, as intermarriage and immigration blur the rigid boundaries that the United States historically tried to place around racial categories. This work demonstrates that racial categories are already being experienced differently in different parts of the same state, showing that we need to carefully consider social context when we conceptualize how racial and ethnic categories are created, inhabited and transformed over time (Omi and Winant 2014).
Footnotes
Appendix
Models of Community Division, with Mileage from the Border.
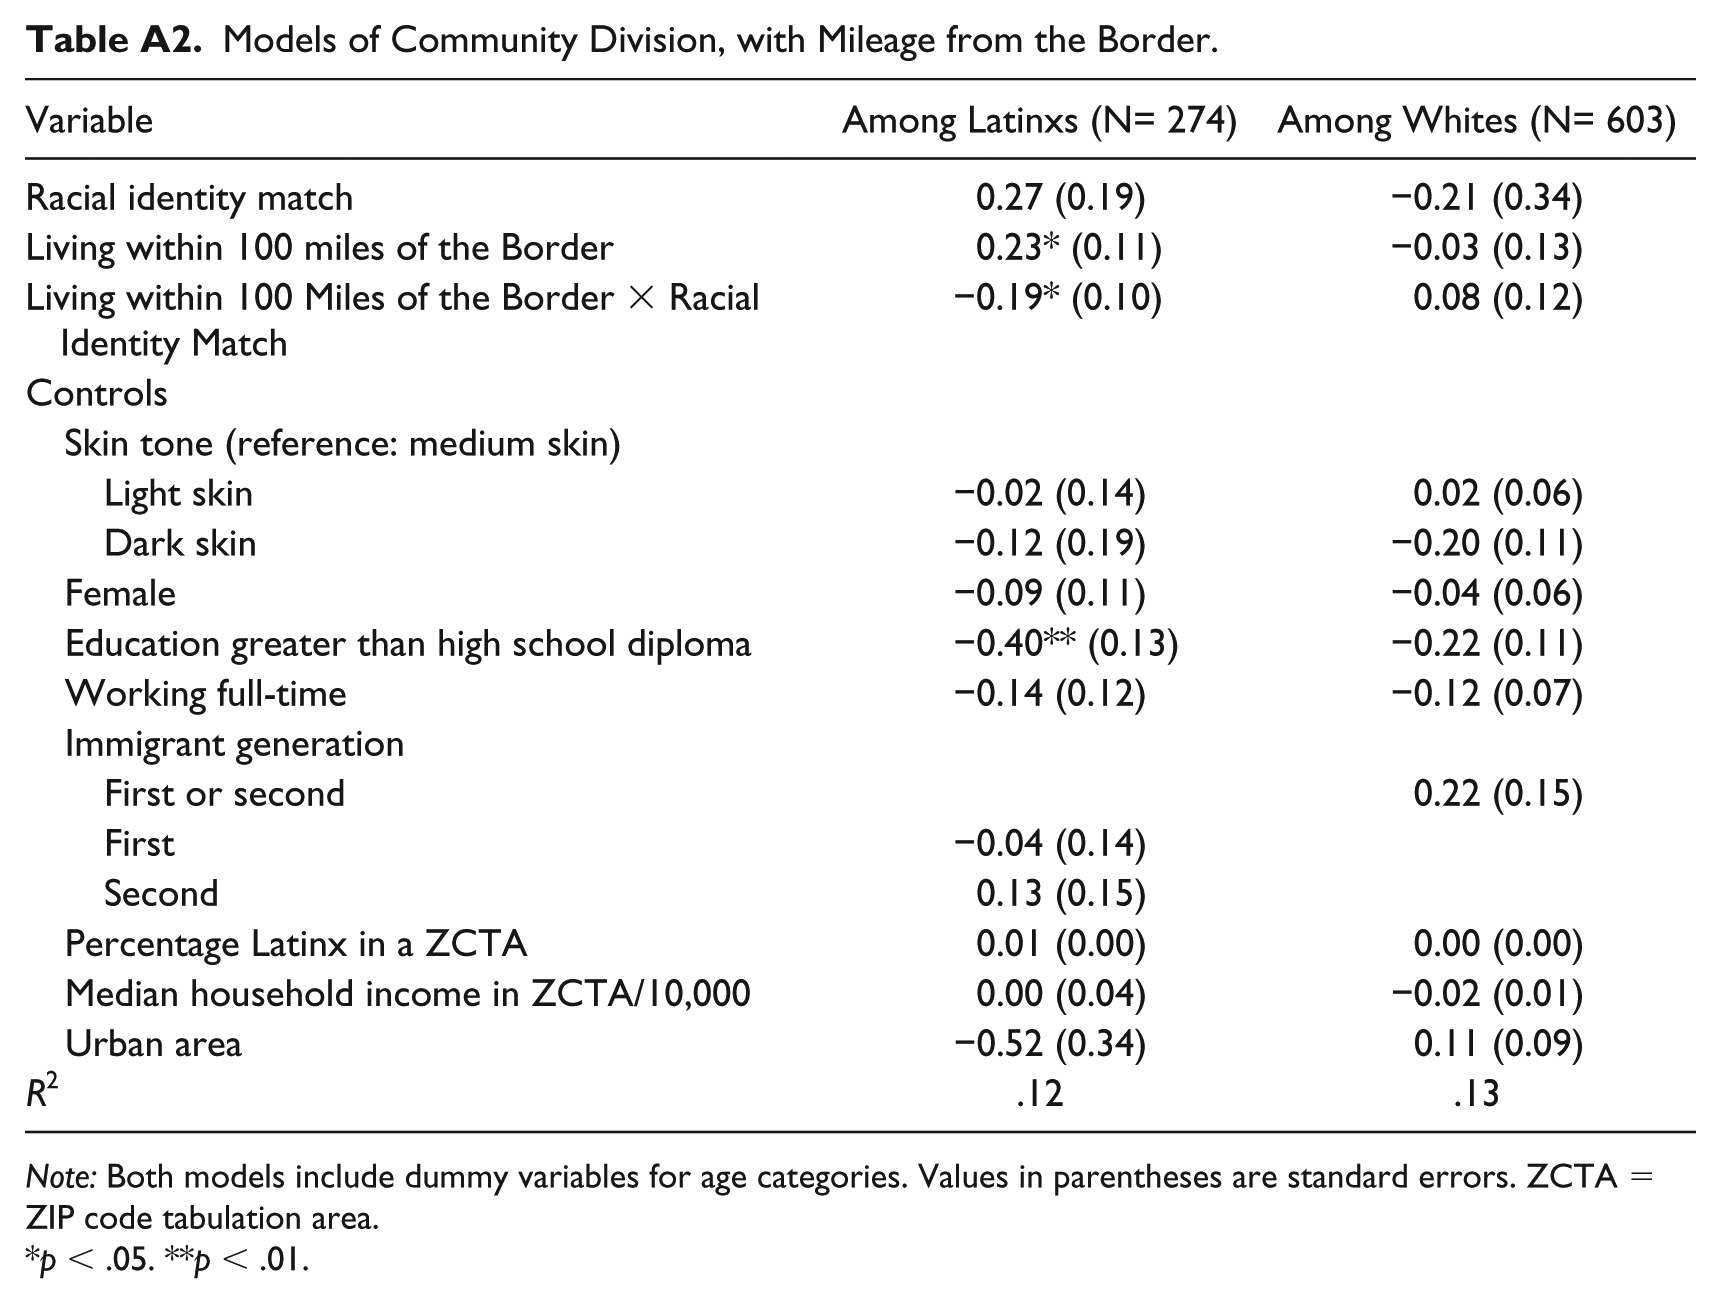
| Variable | Among Latinxs (N= 274) | Among Whites (N= 603) |
|---|---|---|
| Racial identity match | 0.27 (0.19) | −0.21 (0.34) |
| Living within 100 miles of the Border | 0.23* (0.11) | −0.03 (0.13) |
| Living within 100 Miles of the Border × Racial Identity Match | −0.19* (0.10) | 0.08 (0.12) |
| Controls | ||
| Skin tone (reference: medium skin) | ||
| Light skin | −0.02 (0.14) | 0.02 (0.06) |
| Dark skin | −0.12 (0.19) | −0.20 (0.11) |
| Female | −0.09 (0.11) | −0.04 (0.06) |
| Education greater than high school diploma | −0.40** (0.13) | −0.22 (0.11) |
| Working full-time | −0.14 (0.12) | −0.12 (0.07) |
| Immigrant generation | ||
| First or second | 0.22 (0.15) | |
| First | −0.04 (0.14) | |
| Second | 0.13 (0.15) | |
| Percentage Latinx in a ZCTA | 0.01 (0.00) | 0.00 (0.00) |
| Median household income in ZCTA/10,000 | 0.00 (0.04) | −0.02 (0.01) |
| Urban area | −0.52 (0.34) | 0.11 (0.09) |
| R 2 | .12 | .13 |
Note: Both models include dummy variables for age categories. Values in parentheses are standard errors. ZCTA = ZIP code tabulation area.
p < .05. **p < .01.
Acknowledgements
We would like to thank Verna Keith, Texas A&M University’s Race and Ethnic Studies Institute, and Erik Luna for research support and data collection and Pat Rubio Goldsmith and Andrew Francis-Tan for their thoughtful comments.