
Abstract
While a growing literature has documented vast ethnoracial inequalities tied to the occurrence and outcomes of police contact, less research has examined the patterning of perceived unfair police stops among Latino populations. The present study relies on insights from tri-racial stratification theory to examine associations between perceived unfair police stops and skin tone, ethnic origin, and citizenship status among Latino adults. Data come from the Pew Research Center’s nationally representative 2021 National Survey of Latinos (n = 3,019). We regress whether a respondent perceived being stopped unfairly by police in the past year on the Yadon-Ostfeld Skin Color Scale (i.e., 1–10, 10 = Darkest), ethnic origin (i.e., Puerto Rican, Cuban, Dominican, Salvadoran, Spaniard, Central American, South American, or other), and citizenship status (i.e., U.S. citizen or not). Results showed that having a darker skin tone and U.S. citizenship were associated with higher odds of experiencing a police stop perceived as unfair. Latinos with the darkest skin tones had nearly a one in five chance of a perceived unfair police stop. Average probabilities of a perceived unfair stop were higher for Puerto Ricans, Cubans, and Salvadorans than others followed by Mexicans/Chicanos. Dominicans’ probability was lower than five of the eight other groups. Findings identify heterogeneity among Latino populations such that variation in skin tone, citizenship status, and ethnic origin independently factor into self-reported unfair police stops. Research examining ethnoracial disparities in criminal legal contact and its consequences would benefit from more fully disaggregating panethnic groups.
U.S. police officers interact with more than 50 million people annually (Tapp and Davis 2022). Despite police stops representing the most common form of criminal legal contact, inequities persist in their perceived legal necessity, fairness, and enforcement outcomes (Braga, Brunson, and Drakulich 2019; Dennison and Finkeldey 2021; Epp, Maynard-Moody, and Haider-Markel 2014). While a smaller number (7.2 million) and percentage (16 percent) of people of Hispanic, Latino, or Spanish descent (hereafter, Latino) experience contact with police compared to Whites, officers are more likely to threaten, use force, pepper spray, and point a weapon at Latinos than Whites. Recent data indicate that police are also more likely to ticket and less likely to issue a warning to Latinos compared to Whites (Tapp and Davis 2022). Moreover, seemingly benign stops (e.g., due to a broken taillight) can turn deadly such that Latinos experience higher mortality at the hands of police, and police are more likely to kill a Latino person when unarmed relative to Whites (GBD 2019 Police Violence US Subnational Collaborators 2021). While studies have documented vast ethnoracial inequalities tied to the occurrence and outcomes of police stops (Avdija 2014; Turney 2021, 2022), less research has examined the patterning of unfair police stops for Latino populations (recent exceptions, e.g., Finkeldey, Dennison, and Cui 2023; Rengifo and McCallin 2017; Santana 2018; White 2015). Building from this gap in the literature, this study examines associations between perceived unfair police stops and skin tone, ethnic origin, and citizenship status among Latino adults.
The present study offers a series of innovations to the research literature. First, this study extends a growing literature focused on consequences of policing. Police stops are more common contemporarily than historically in part because policing practices shifted to preemptive policing, which provided law enforcement with greater latitude, agency, and legal justification to curb deviance and petty crimes, in theory, to prevent worse crimes in the future. Proactive policing included stopping, searching, and detaining civilians to deter potential wrongdoing (Baumgartner, Epp, and Shoub 2018; Epp et al. 2014). Growing civilian-police contact also increased the use of harsh language, expression of threats, and deployment of force toward marginalized populations (Geller 2021; Jones-Brown, Gill, and Trone 2010; Turney and Wakefield 2019; Voigt et al. 2017). The present study focuses on variation in self-reports of police stops perceived as unfair in the past year. Our focus on perceived unfairness in police contact is important because research has demonstrated wide ethnoracial disparities in how police interact with civilians, and a litany of studies have documented the consequences extending from these unique exposures. Studies show that Latinos, on average, perceive more instances of unfair treatment by police than Whites (Bjornstrom 2015; Dennison and Finkeldey 2021; Testa and Jackson 2022). However, we know less of whether and how self-reported unfair police stops vary intraethnoracially among Latinos. Such research is important considering the extensive psychological, criminogenic, socioeconomic, and health consequences tied to police contact (Hirschtick et al. 2020; Kalinowski et al. 2022; Turney 2021; Vélez and Peguero 2023). Furthermore, the present research adds to a litany of studies that identify the significance of policing is amplified when policing is perceived as unjust (Dennison and Finkeldey 2021; Finkeldey et al. 2023; Geller et al. 2014; McFarland, Geller, and McFarland 2019; McFarland et al. 2018; Santana 2018).
Second, this study extends existing literature by considering three forms of heterogeneity among Latino populations—skin tone, ethnic origin, and citizenship status. In doing so, we focus on variation within an often homogenized, panethnic population (Gómez Cervantes 2021; Okamoto and Mora 2014). Recent data indicate that nearly 63 million Latinos reside in the United States, comprising 19 percent of the total population. Most Latinos do not select single race categories when asked to report their identification in questionnaires (e.g., White); rather, most identify as two or more races or as some other race, but do so differently across ethnic subgroup (Lopez, Krogstad, and Passel 2022). Part of the difficulty in self-identifying among Latinos on the Census is that questions about ethnicity are asked separately from race. Notwithstanding, how people identify ethnoracially may differ from how they are identified by others. In other words, some Latinos may be socially identified by others as White, Latino, or Black depending on context, location, and other cues such as linguistic capital, attire, or adorning symbols (Golash-Boza and Darity 2008; Irizarry, Monk, and Cobb 2023). We anticipate that broad panethnic classifications such as Latino may conceal important differences in how police identify and interact with civilians, and thus, the odds that a person experiences a police stop perceived as unfair (Santana 2018).
Insights from tri-racial stratification theory inform the conceptualization and design of the present study. Tri-racial stratification theory purports that the changing U.S. ethnoracial composition has expanded stratification beyond a Black-White division to a three-tiered hierarchy loosely based on phenotype and socioeconomic standing (Bonilla-Silva 2004, 2021). The present study addresses whether unfair police stops map onto the tri-racial thesis. Tri-racial stratification proposes a heuristic of the social order. Whites sit atop the socially constructed hierarchy, and collective Blacks occupy the bottom. Germane to this study, Latinos with darker skin tones and lower status, which generally includes Dominicans, Puerto Ricans, and Mexicans, occupy the collective Black strata. Honorary Whites are situated between the two groups and include most lighter skin South and Central Americans, and Cubans (Bonilla-Silva 2004, 2021). Grouping into one of these three strata is associated with variation in access to valued societal resources and opportunities as well as exposure to risk and stress. In addition, the present study innovates by using a newly developed, self-assessed skin tone measure (Ostfeld and Yadon 2022a), and identifies ethnic origin based on whether respondents or their ancestors are from Puerto Rico, Cuba, the Dominican Republic, El Salvador, Spain, Central America, South America, or another country. Existing research is more limited by examining links between skin tone and legal contact among Latinos often using a text-based-category, interviewer-rated skin tone measures with uneven spacing between color options (e.g., very light, light, very dark) (Dennison and Finkeldey 2021; Finkeldey et al. 2023; White 2015; Yadon and Ostfeld 2024).
Third, this study adds to the literature by using nationally representative survey data, which enables generalization to noninstitutionalized Latino adults in the United States. Prior work has typically utilized local, age-stratified, or otherwise nonrepresentative samples to assess variation in self-reported unfair police stops. The present research extends beyond foregoing research’s examination of police stops among select populations such as adolescents (Jackson et al. 2019; Testa and Jackson 2022), Black adults (Bowleg et al. 2020; Kalinowski et al. 2022; Oh, DeVylder, and Hunt 2017), or ethnoracially diverse but nonrepresentative samples (Alcalá and Montoya 2018; McFarland et al. 2018, 2019; Thompson et al. 2021; Turney 2021). For the purposes of this study, adults are included in analyses if they self-report being of Hispanic, Latino, or Spanish descent. The novel data used here allow us to extend beyond past studies such that it includes a new measure of skin tone, multiple ethnic origin groups, and a representative sample of Latino adults.
Background and Theory
Tri-racial Stratification Theory
Tri-racial stratification theory specifies that the U.S. socially created ethnoracial hierarchy is growing in similarity to Latin America where stratification is largely based on phenotype. Positioning in the social hierarchy is important because it grants or restricts access to valued resources and opportunities including education, healthcare, and housing. Tri-racial stratification theory’s heuristic organizes ethnoracial groups into three categories: Whites, honorary Whites, and collective Blacks. Whites include fair skinned Americans of European descent, assimilated White Latinos, and some multiracials (e.g., Spaniards). Honorary Whites include fair skinned Latinos with higher socioeconomic status (e.g., Argentine, Chilean, Costa Rican, and Cuban). Collective Blacks include darker complexioned Latinos and lower status groups (e.g., Dominicans, Puerto Ricans, and some Mexicans).
Support for the theory has focused on differences in indicators of socioeconomic status, racial attitudes, and social distance. Research has identified tri-racial variation in income, education, poverty, and occupational prestige (Bonilla-Silva 2004, 2021). Latinos with lighter skin self-report that they have more in common with Whites and less in common with Blacks than those having darker skin (Wilkinson and Earle 2013). Eduardo Bonilla-Silva (2021) also points out that social and intimate contact varies greatly by strata such that Cubans, Mexicans, and South Americans have higher rates of interracial marriage than Puerto Ricans and Dominicans. Researchers have also shown that Dominicans and Puerto Ricans experience rates of segregation similar to Black folks. That is to say, the social distance between Latino groups maps onto a tri-racial order such that honorary Whites have closer proximity to the systematic advantages conferred by whiteness, whereas members of the collective Black strata experience myriad disadvantages and exclusion in housing, marriage markets, and prejudice.
Perceived Unfair Police Stops
This study focuses on variation in perceived unfair police stops, which we also refer to as self-reported unfair police stops, consistent with the literature (Dennison and Finkeldey 2021; Finkeldey et al. 2023). Our measure is one form of discrimination and is often used in research (Finkeldey et al. 2023; Kessler, Mickelson, and Williams 1999; Schmitt et al. 2014). Discrimination is a behavioral extension of systemic racism and can involve an array of hostile encounters including being called offensive names, being criticized for speaking one’s native language in public, or being told to go back to one’s ancestral home country (Santana 2018). We focus on one measure of perceived discrimination, which occurs when a person believes they have been treated unfairly on the basis of their social identities. In line with existing research, the potential ambiguity between perceived and actual unfairness in police stops is why we carefully identify these subjective experiences as perceived, rather than simply, unfair police stops (Kessler et al. 1999; Santana 2018). An important point is that although our measure captures self-reported unfair police treatment rather than a more objective measure, even if an officer is following proper protocol, and an interaction is perceived by the civilian as unfair, then the civilian will experience similar deleterious outcomes as if the interaction was indeed unfair. In other words, the perception of the stop as unfair, regardless of validity, is real in its consequences (Dennison and Finkeldey 2021; Finkeldey et al. 2023; Santana 2018).
We focus on perceived discriminatory experiences because they are relatively common among Latinos with more than half reporting an experience of ethnoracial discrimination (Pew Research Center 2021a). Our focus is also motivated by research that has identified innumerable consequences of perceived discrimination including poorer mental health, physical health, and quality of life (Kessler et al. 1999; Pérez, Fortuna, and Alegría 2008). Similarly, our focus on perceived unfair police treatment is important because such stops implicate a host of negative outcomes (e.g., injury, arrest, criminal record) and the mental toll of navigating a stressful encounter (Santana 2018). Fewer studies have interrogated self-reported unfair police stops among Latino adults across multiple attributes (e.g., skin tone).
Our measure of self-reported unfair police stops aligns with existing research. For instance, past work has constructed measures of self-reported unfair police stops based on survey questions with similar language as the present study such as, (1) Have you ever been unfairly stopped, searched, or questioned by the police (Dennison and Finkeldey 2021; Finkeldey et al. 2023; Testa and Jackson 2022); (2) Have you been unfairly stopped, searched, questioned, physically threatened or verbally abused by the police (Bjornstrom 2015; Kalinowski et al. 2022); (3) Have you ever been physically threatened or abused by the police (Thompson et al. 2021). Finally, our measure’s language aligns perfectly with recent conceptualization of perceived unfair police treatment (McFarland et al. 2018; Santana 2018). A common thread linking all of these survey items is the person’s perception that police are treating them unjustly.
Patterns of self-reported unfair police stops align with national data that find Latino residents in the United States aged 16-or-over have greater likelihoods of facing a threat or use of nonfatal force (Tapp and Davis 2022). Between 2018 and 2020, Latino drivers were less likely to receive a warning, more likely to receive a ticket, and most likely to be searched and arrested than their White counterparts. Latinos are also more likely to experience lethal use of force by police than Whites (Tapp and Davis 2022), and research contends that Latinos are treated more poorly than Whites by police. For example, nearly half of Latino youth reported being treated disrespectfully by an officer (Lurigio, Greenleaf, and Flexon 2009). At least one study showed that Latinos were most likely to perceive unfair treatment by police compared to Whites and Blacks (Schuck and Martin 2013). Such unfair treatment may consist of being treated as criminal when no wrongdoing has occurred, subjected to unreasonable use of force, or experiencing unjustified stops. A study in New York City found that Latino residents overwhelmingly felt harmed, injured, and disregarded after police encounters (Rengifo and McCallin 2017). Some research suggests that people are more likely to perceive police stops as unfair if they are stopped for discretionary reasons (e.g., broken taillight) rather than what are perceived as legitimate reasons (e.g., speeding) (Bradford, Jackson, and Stanko 2009). Dated scholarship also argues that people can perceive stops as fair and legitimate even if the outcome is not favorable to them (Boydstun 1975).
The potential for encountering unfair treatment also shows up in ethnographic studies. Victor M. Rios et al. (2020) conducted police ride-alongs to observe police interactions with young Latino men, and the researchers observed contradictory policing practices. Officers often expressed an interest in developing trusting relationships with the young men to gather information about activity in the area and to support them in desisting from crime. Yet, officers relied on aggressive and racialized stop-and-frisk, surveillance, and information gathering approaches to initiate contact with the young men, which ultimately undermined their original goals of developing trusting relationships. That is to say, police were able to shift the blame for their own harassment, mistreatment, and excessive force (e.g., stop-and-frisk) to the young men when polite overtures were rejected and little, if any, wrongdoing had occurred (Rios et al. 2020). While the present study does not focus on specific policing practices, we rely on insights from existing research to focus on variation self-reported unfair police treatment across skin tone, ethnic origin, and citizenship status, which less research has studied.
Skin Tone and Policing
Across Latin America, there is a long and embedded history of skin-color-based labels that reflect a person’s access to power and privilege (Ostfeld and Yadon 2022b). The link between skin tone and socioeconomic status in some Latin American countries is so strong that skin tone–based identification can change when one’s socioeconomic position changes. In the United States, research shows that people’s perception of others’ racial identification can be affected by whether they have been incarcerated, unemployed, or on welfare (Saperstein and Penner 2012). Latinos are a unique group in the United States considering that the federal government identifies them as an ethnic rather than a racial group. Mara C. Ostfeld and Nicole D. Yadon (2022b) argue that the unique position of Latinos in the U.S. ethnoracial hierarchy means that skin tone receives additional weight relative to other ethnoracial groups as a means of locating oneself and being located by others within social, political, and economic dynamics. The range of skin tone among Latinos means that some are more likely to experience skin tone–based racial profiling than others (Hunter 2007). Nearly two-thirds of Latinos with darker skin report experiencing discrimination (Pew Research Center 2021a). People with darker skin tones typically face increased discrimination regardless of how they identify (Rengifo and Slocum 2020). Consequently, darker skin tones are associated with higher incarceration rates, poorer health, lower wages, and fewer years of education, on average (Golash-Boza and Darity 2008; Monk 2021; Telles and Murguia 1990). Latino folks with darker skin tones are more likely to be labeled as less intelligent and perceived as less able to comprehend survey questions regardless of their level of education and knowledge test scores (Ostfeld and Yadon 2022b). Some studies show that darker complexion Latinos live in more racially segregated neighborhoods with fewer opportunities for upward social mobility compared with their lighter skin counterparts (White and Sassler 2000).
Lighter skin Latinos might be less likely to encounter and report unfair police treatment in part because they tend to be more politically conservative and rate police officers more favorably (Ostfeld and Yadon 2022b). Specifically, lighter skin Latinos are more likely to say that police do a good job and use an appropriate level of force (Ostfeld and Yadon 2022a). An important contribution of Mara C. Ostfeld and Nicole D. Yadon (2022a) is that Latinos who overestimate the lightness of their skin tone take more conservative positions on contemporarily racialized political issues. Latinos with lighter skin tones were more likely to support Trump in 2016. Darker skin Latinos were more likely to take a distinctively negative view of Trump and police (Ostfeld and Yadon 2022a). Latinos who identify as racially White are more likely to identify as politically conservative and to embrace the idea of the United States as a meritocracy even when accounting for skin color (Vargas 2014). In other words, self-assessed skin tone operates as a signifier for many Latinos’ political views. Thus, it is important to incorporate a measure of political affiliation into the present study.
Latino drivers and pedestrians may experience racial profiling by police officers based on skin tone. In cases of racial profiling, law enforcement may look for characteristics deemed suspicious enough to warrant stopping a person (Rengifo and Slocum 2020). For some, skin color may be enough to arouse suspicion, disproportionately leading to negative encounters (Brown, Dane, and Durham 1998; Rengifo and Slocum 2020). In other words, officers may knowingly or unknowingly attribute suspicion, wrongdoing, or make assumptions about Latinos, which can lead to less dignified, more negative, and possible violent interactions between police and civilians. Inequitable treatment of civilians is also a reflection of institutional racism present within policing, crime policy, and the built environment (e.g., neighborhoods). Researchers have proposed that Latino drivers experience what is called “Driving while Brown,” or disproportionate traffic stops due to racial profiling (Romero 2000; Russell-Brown 2021; Torres 2015). Importantly, research attests to skin tone playing a key role in how people racially identify others (Brown et al. 1998).
Police stops represent an entry point into the criminal legal system, and arrest is one possible outcome of a police stop. There is some evidence that officers are more likely to arrest people with darker skin (Alcalá and Montoya 2018; Branigan et al. 2017; Finkeldey and Demuth 2021; Monk 2019). Research also shows that darker complexion is associated with greater likelihood of imprisonment, longer sentences, and the death penalty, an end point of the criminal legal system (Burch 2015; Eberhardt et al. 2006; Monk 2019). Importantly, much research focuses on Black-White disparities rather than Latinos, which we focus on here. Karletta M. White (2015) found that darker skin Latinos experienced more police stops on average relative to lighter skin Latinos, and that skin tone predicts arrest among women but not men. Recent work by Jessica G. Finkeldey et al. (2023) showed that darker skin was consequential for perceiving unfair police treatment among Latinos. Another study showed that darker skin color was associated with higher odds of arrest, but only for second-generation immigrants (Alcalá and Montoya 2018).
Skin tone is understood as a form of bodily capital, which becomes salient and consequential depending on the social context people find themselves operating in (Monk 2015). To this end, Emilce Santana’s (2018) key study identified that the context within which an encounter occurs factors into whether a person perceives discrimination. Latinos with darker skin were more likely to perceive discrimination in consumer and real estate settings while there were no significant skin tone differences in perceiving discrimination from police (Santana 2018). Discrepant findings between skin tone and policing may be the result of less reliable means of assessing skin tone.
Foregoing research has measured skin tone in multiple ways, but many scales have been critiqued for their (1) subjective text-based categories, (2) lack of reliability, (3) necessary condition that interviewer-interviewee status characteristics match, (4) inconsistent spacing between each point of visual palettes from which interviewers can rate interviewees’ skin tone, and (5) differences in scale appearance based on the medium on which skin tone options are presented (e.g., paper, image quality, differences in computer screen coloring) (Yadon and Ostfeld 2024). As others have pointed out, when text-based skin tone assessments are used, which often range from 1 to 5 or 1 to 7, they do not include a visual anchor for people to rate skin tone; rather, text options include very light to very dark (Yadon and Ostfeld 2024). Such measures are limited because there is inherent subjectivity associated with what constitutes light versus dark skin coloring (Ostfeld and Yadon 2022b).
Two common measures, the Project on Ethnicity and Race in Latin America (PERLA) and the Massey-Martin scales, improved upon text-based categorization by providing anchored reference points. Interviewers rate respondents’ face skin color on a 1 to 11 scale based on Internet photographs of a color palette in the PERLA metric to determine respondents’ skin tone (Telles and Paschel 2014). Likewise, ranging from 1 to 10, the Massey-Martin (2003) scale incorporates a professionally designed color chart to anchor interviewer judgments. Interviewers record a respondent’s skin color after an interview is complete and is disallowed to directly compare the color palette to the respondent’s skin. Moreover, when using the Massey-Martin measure, interviewers factored contextual symbols such as a person’s neighborhood, education, and income into determining their skin tone (Ostfeld and Yadon 2022b). Likewise, the Massey-Martin palette does not reflect an equal distribution of skin shades. For instance, the 11-unit light-reflectance gap between 3 and 4 on the scale is wider than the three-to-four unit difference between 8 and 9 (Hannon and DeFina 2016; Ostfeld and Yadon 2022b). Consequently, these measures remain limited due to inconsistent scaling and poor reliability (Ostfeld and Yadon 2022b).
Much research that examines associations between skin tone and social outcomes assesses skin tone via interviewers’ or interviewees’ interpretation (Stokes-Brown 2012). Self-assessed scores experience the same limitations as interviewer-assessed scores; estimates reflect a combination of physiological and social cues such that self-assessed skin tone does not strongly correlate with machine-based readings (Ostfeld and Yadon 2022b). Despite self-assessed skin tone measures representing an improvement in many ways relative to interviewer-rated ones, they remain limited such that they are influenced by people’s values, social identities, and aspirations. How a person identifies their skin tone is linked to how they aspire to be seen rather than how they are actually seen. However, this limitation could be beneficial for the present study because the inherent subjectivity in self-rated skin tone reflects respondents’ views about their social location within a skin tone spectrum relative to others who are similarly racialized (Monk 2015; Santana 2018; Yadon and Ostfeld 2024). The present study innovates by using a newly developed skin tone scale to clarify the association between skin tone and self-reported unfair police stops (Ostfeld and Yadon 2022a). The scale is similar to the PERLA and Massey-Martin measures that depict colors gradually increasing in darkness (Massey and Martin 2003; Telles 2014), but represents an improvement upon past work by offering the first spectrophotometer-validated interval-level scale, which moves evenly from 1 (i.e., lighter) to 10 (i.e., darker) (Yadon and Ostfeld 2024). The spacing of skin tone options are approximately six light-reflectance units between each hand on the 10-point scale (Ostfeld and Yadon 2022a).
Ethnic Origin, Citizenship, and Perceived Unfair Stops
We build on existing research by focusing on nine ethnoracial groups including Mexicans/Chicanos, Puerto Ricans, Cubans, Dominicans, Salvadorans, Spaniards, other Central Americans, South Americans, or Latinos with origins from another country. Research conducted in Bolivia, Colombia, Ecuador, Guatemala, Mexico, and Peru found that darker skin tone was associated with greater odds of reporting discrimination on the basis of one’s skin tone (Canache et al. 2014). Moreover, at least one study showed that darker skin tone was linked to greater reports of discrimination for Mexican Americans (Telles and Ortiz 2008). Another study found that Mexican and Cuban adults with darker skin have jobs that are of a lower occupational prestige than their lighter skin counterparts, while no effect was found for Puerto Ricans (Espino and Franz 2002). Existing research has also identified ethnic differences in perceived unfair police treatment (Santana 2018). We rely on existing research as well as our theoretical framework to anticipate that ethnic origin factors into perceived police stops in addition to skin tone.
A third characteristic we examine is citizenship status. For the purposes of this study, citizenship status identifies whether respondents are a U.S. citizen. Research proposes that categorization of some immigrants as legal or not is socially constructed. People ascribe legal status to others based on national origin, occupation, and symbolic attributes (Flores and Schachter 2018). Regardless of one’s legal status, some Latinos, particularly those with lower status, must navigate the stigma, suspicion, and stereotypes associated with being an undocumented immigrant even if they are legal citizens (Romero 2006; Solis, Portillos, and Brunson 2009). For instance, Puerto Ricans are U.S. citizens regardless of whether they were born in Puerto Rico or the continental United States. Yet, one study showed that Puerto Rican New Yorkers felt that the police were unreasonably suspicious of their citizenship (Solis et al. 2009). Extending this line of thinking, scholars have argued that legal authorities may associate undocumented status with darker skin and Spanish-speaking abilities among U.S. residents of Mexican descent, which makes the group more likely to experience police harassment (Romero 2006). Such experiences of discrimination affect whether people from Latin America and their descendants will choose to identify as Black, White, or Latino. As Latino immigrants acculturate into U.S. society, they also learn how to interpret racial codes, and they learn how they are categorized by people in the United States (Golash-Boza and Darity 2008).
We anticipate that non-U.S. citizens will experience poorer interactions with police in part because of the patchwork of laws, policies, and practices that govern legal interactions with undocumented populations (Coleman 2012). In other words, even when law enforcement agencies aspire to treat immigrants well, unauthorized immigrants are vulnerable to fines, tickets, and arrest because they must violate rules in order to make a living, support themselves, and obtain basic necessities (e.g., working without documentation) (Lewis and Ramakrishnan 2007; Menjívar and Abrego 2012). Some research contends that additional factors—socioeconomic status, age, region, and gender—complicate associations with perceived unfair police stops; thus, we include these other components that may be important for clarifying patterns by skin tone, ethnic origin, and citizenship (Hirschtick et al. 2020; Turney 2021).
Summary and Hypotheses
This study examines the association between self-reported unfair police stops and skin tone, ethnic origin, and citizenship status among Latino adults. We rely on elements of tri-racial stratification theory and build on prior work to offer three innovations to the literature, including (1) examination of intraethnoracial variation in perceived unfair police stops, (2) an analysis of three dimensions of heterogeneity, and (3) and the utilization of nationally representative data. Based on background research and extensions of our theoretical framework, we anticipate that people with darker skin tones will be more likely to experience a self-reported, unfair police stop (Hypothesis 1). Hypothesis 2a–f anticipates that members of the collective Black strata including Puerto Ricans, Dominicans, and Mexicans will experience higher odds of perceiving unfair police treatment than honorary Whites including (a) Cuban, (b) Salvadoran, (c) Spaniard, (d) Other Central Americans, (e) South Americans, and (f) Another country. We assess Hypothesis 2a–f separately for Puerto Ricans, Dominicans, and Mexicans. The third hypothesis expects that U.S. citizens will be less likely to experience self-reported unfair police stops than their non-citizen counterparts (Hypothesis 3).
Data and Methods
This study utilizes nationally representative data from the Pew Research Center’s (2021b) National Survey of Latinos (NSL). The NSL was collected from March 15 to March 28, 2021, as Wave 86 of the American Trends Panel (ATP). The ATP is a panel study of randomly sampled U.S. adults that complete self-administered web surveys in English and Spanish. The ATP was created in 2014 with two additional recruitments conducted in 2015 and 2017. Panelists who did not have home Internet access were provided with a tablet and wireless Internet connection. All respondents were offered a post-paid incentive for their participation. The NSL’s target population was noninstitutionalized, self-identifying adults of Hispanic origin living in the United States. The NSL included all current ATP members that self-identified as Hispanic in addition to a supplementary oversample of Hispanics who were of Mexican or Central American ancestry or had a high school education or less. The overall response rate was 50 percent. All analyses are weighted to account for the sampling design, survey nonresponse, and poststratification. We examine Latinos with complete information on all study variables, which provides us with 86 percent of the original sample (2,899 out of 3,375). We examined whether results from multiply imputed data would alter our results and found that they were substantively similar to the results we present here.
Dependent Variable
Unfair police stops
Our dependent variable comes from a survey question that states: “Here are a few things that some Hispanics in the United States have experienced. Please indicate whether or not each of the following has happened to you in the past 12 months: Been unfairly stopped by police” (yes = 1).
Key Independent Variables
Skin tone
To assess skin tone, the survey asked respondents to identify a skin color ranging from fair (fair = 1) to dark (dark = 10) that best resembled their own even if none matched perfectly (Ostfeld and Yadon 2022a).
Ethnic origin
After answering affirmatively to being of Hispanic, Latino, or Spanish descent, respondents were asked: “Thinking about your family’s heritage, are you Mexican, Puerto Rican, Cuban, Dominican, Salvadoran, or are you and your ancestors from another country?” If respondents selected multiple heritages, then they were asked to select the one they most closely identify with. Respondents were categorized into one of nine groups: (a) Mexican/Chicano, (b) Puerto Rican, (c) Cuban, (d) Dominican, (e) Salvadoran, (f) Spaniard, (g) Central American country, (h) South American country, or (i) Another country.
Citizenship status
Citizenship status assessed whether respondents were a U.S. citizen or not (yes = 1).
Covariates
The present study incorporates multiple measures that are often associated with police contact including age, family income, educational attainment, region, and gender. Age was categorized into 18 to 29 years old, 30 to 49 years old, 50 to 64 years old, or 65+. Family income ranged from 1 to 9, 9 = $100,000+. We coded educational attainment into three groups including college graduate-or-more, some college, or high school degree-or-less. Region included Northeast, Midwest, South, and West. Gender was coded as female = 1. We also controlled for whether respondents resided in a metropolitan area (yes = 1), political affiliation (i.e., Republican, Democrat, Independent, or something else), English proficiency (i.e., speaks English very well, pretty well, just a little, or not at all), and whether at least one of the respondents’ parents was born outside the continental United States (yes = 1).
Analytic Technique
Our primary analyses began by examining associations between our dependent variable and three key variables of interest without covariates. Models 1 to 3 utilized separate binary logistic models to regress perceived unfair police stops on skin tone, ethnic origin, and citizenship status, respectively. Model 4 incorporated all three key measures into a single regression (Long and Freese 2014). The final model, Model 5, introduced all covariates. For ease of interpretation, we present exponentiated coefficients and graphically illustrate adjusted predictions for skin tone and ethnic origin to aid comparison of multiple groups (Mize 2019; Williams 2012). Adjusted predictions clarify findings because they calculate probabilities of experiencing perceived unfair police contact for all respondents using the coefficients from the regression equation, and then combine them into one average probability per group, which we present.
Results
Table 1 reports descriptive statistics for all study variables. For parsimony’s sake, we only report findings for key study measures. Nearly one-tenth of respondents experienced a self-reported, unfair police stop in the last year (9.63 percent). Skin tone averaged 3.07 on the 1 to 10 scale, and on average, respondents that experienced a self-reported, unfair police stop had a darker skin tone (mean = 3.50). The composition by ethnic origin included (a) Mexican/Chicano (59.31 percent), (b) Puerto Rican (9.21 percent), (c) Cuban (5.26 percent), (d) Dominican (3.32 percent), (e) Salvadoran (3.90 percent), (f) Spaniard (2.97 percent), (g) Central American country (6.64 percent), (h) South American country (6.29 percent), or (i) other (3.10 percent). A smaller percentage of Dominicans and South American adults comprised the unfairly stopped category. In contrast, Puerto Ricans made up a larger share of those who perceived an unfair stop. Nearly 73 percent of respondents were U.S. citizens. A larger percentage of unfairly stopped respondents were citizens than not.
Descriptive Statistics of Study Variables for Adults of Self-identified Hispanic, Latino, or Spanish Descent in the National Survey of Latinos, 2021 (n = 2,899).
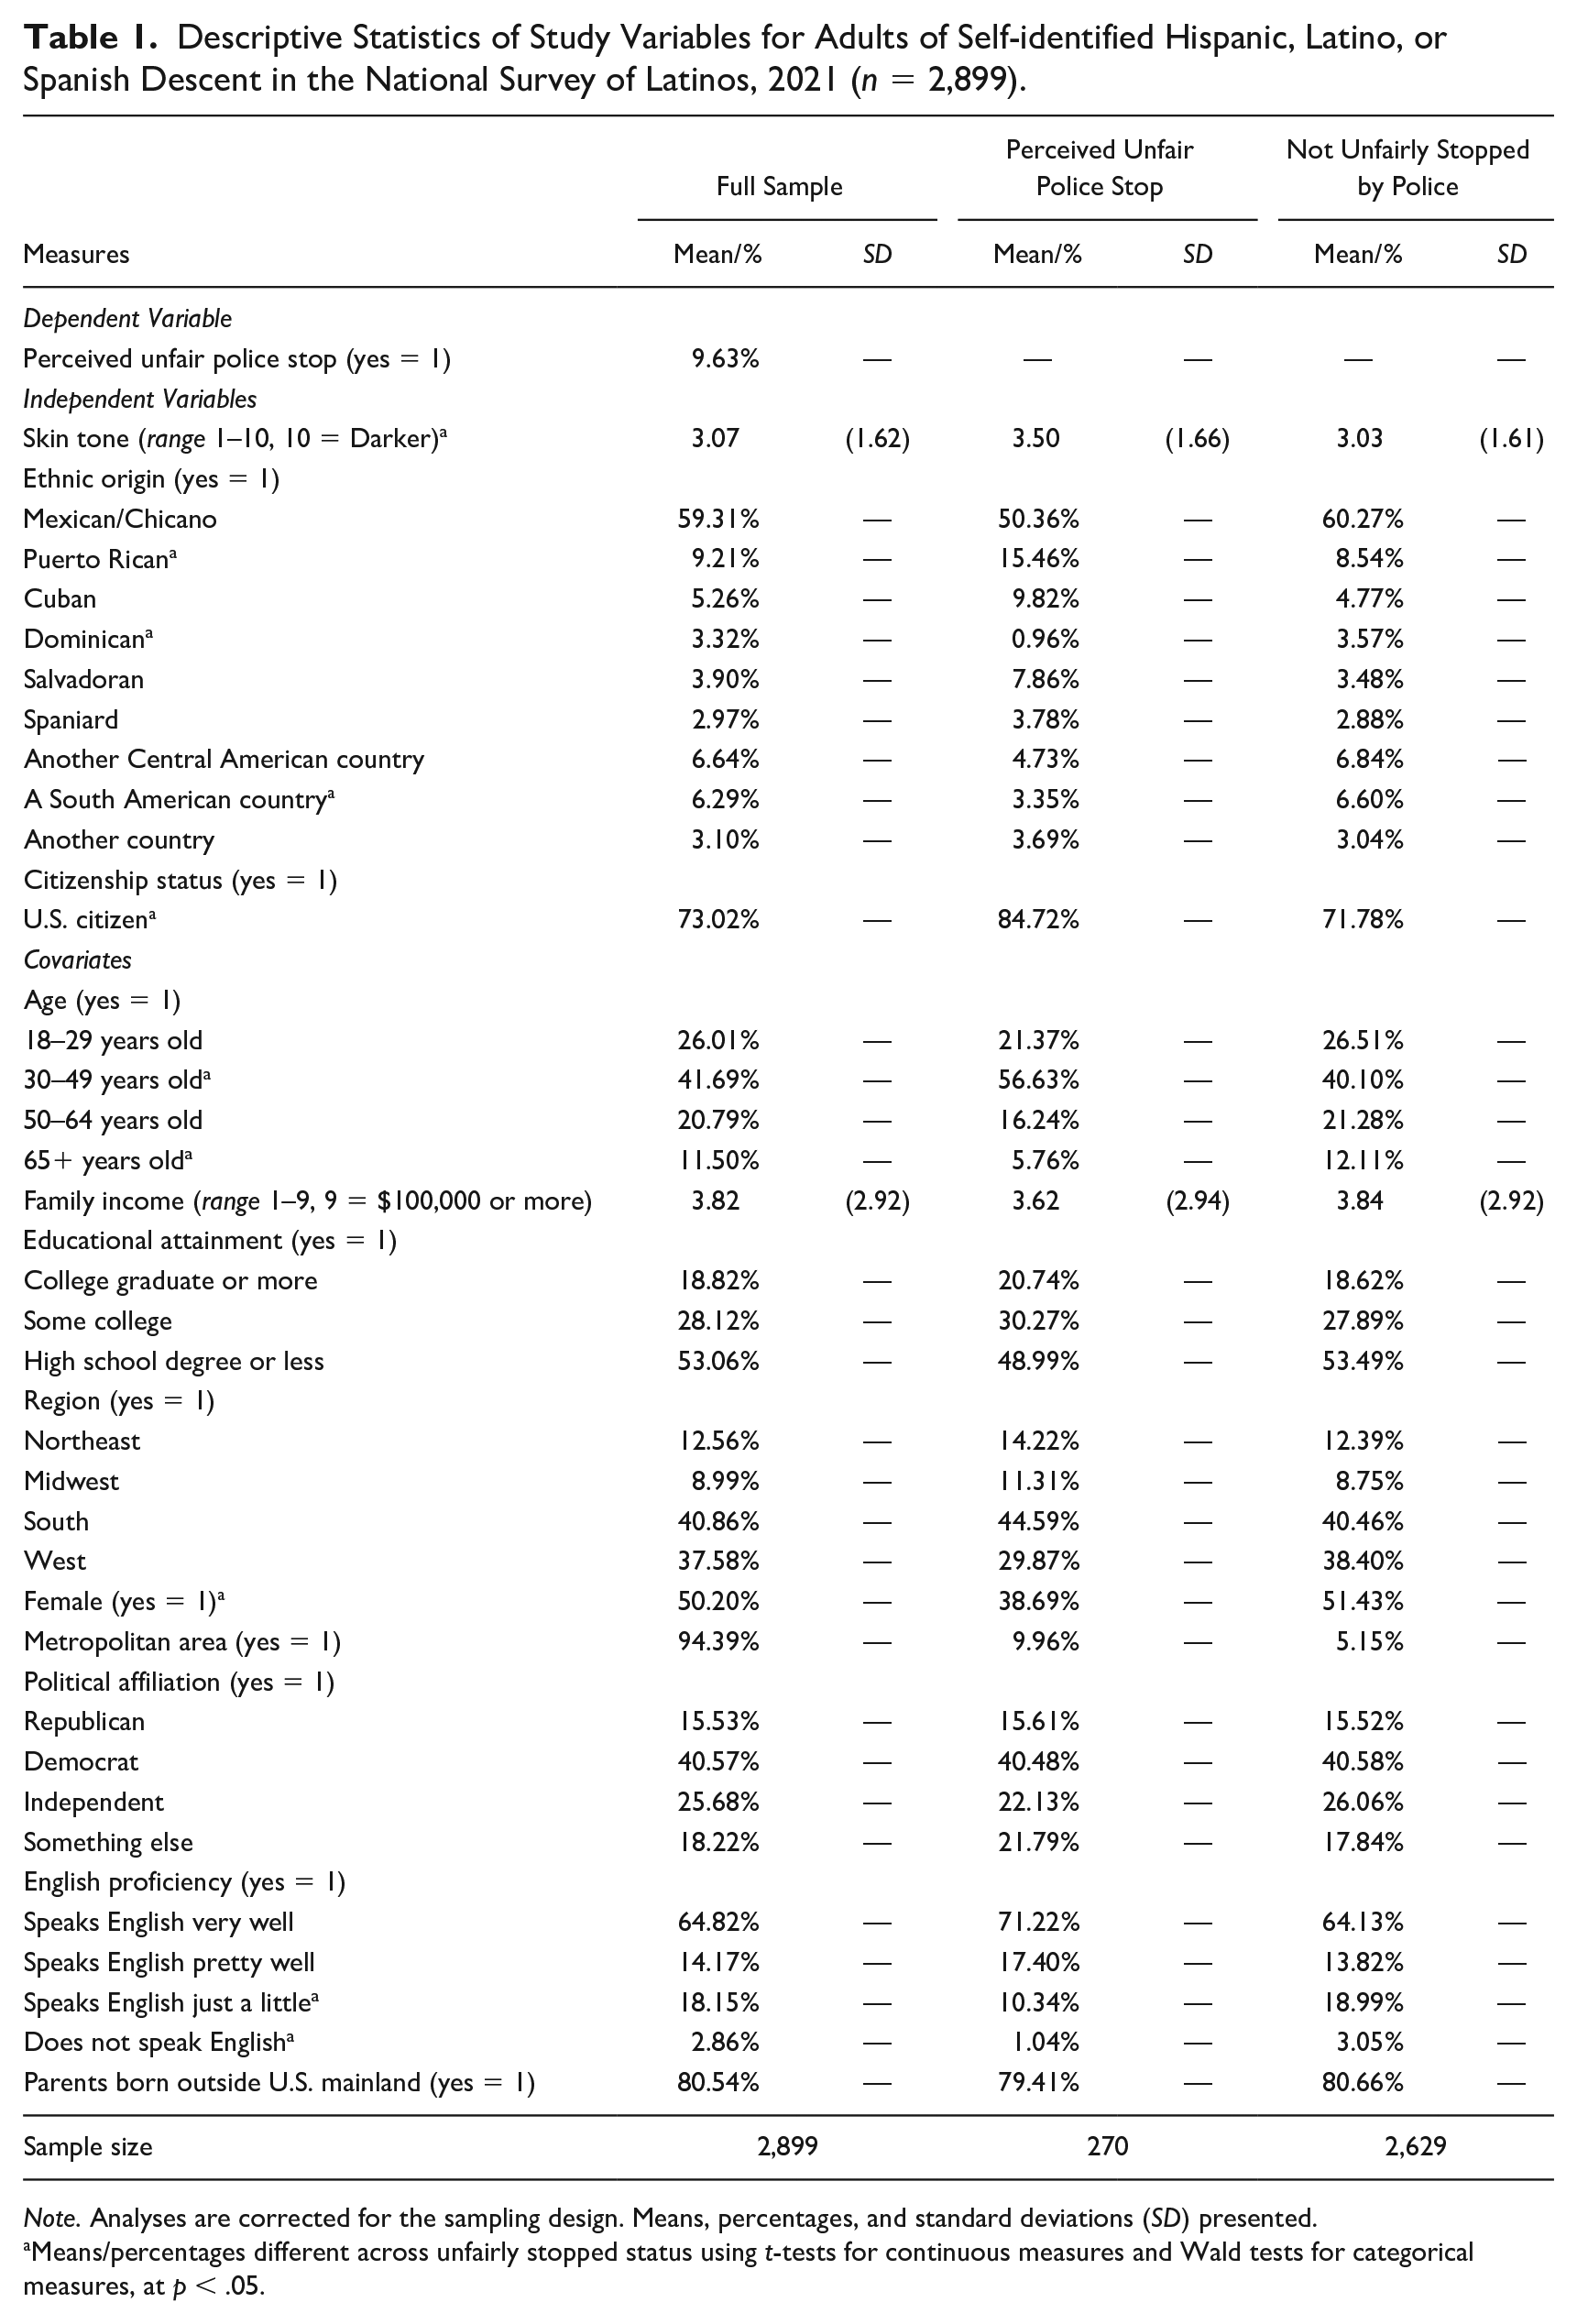
Note. Analyses are corrected for the sampling design. Means, percentages, and standard deviations (SD) presented.
Means/percentages different across unfairly stopped status using t-tests for continuous measures and Wald tests for categorical measures, at p < .05.
Table 2 presents results from models predicting self-reported unfair police stops. Model 1 identified that a one unit change in the skin tone gradient was associated with increased odds of self-reporting being unfairly stopped by a factor of 1.19. In other words, as skin tone darkened, the likelihood of a perceived unfair police stop increased. Model 2 found that Puerto Rican (odds ratio [OR] = 2.17), Cuban (OR = 2.46), and Salvadoran adults (OR = 2.70) had higher odds than Mexicans of self-reporting an unfair police stop. Dominicans showed marginally lower odds than Mexicans (OR = .32; p < .10). The final key variable, U.S. citizenship, was positively associated with unfair police stops in Model 3 (OR = 2.18). Associations identified in Models 1 to 3 were similar in Model 4 such that people with darker skin tones had greater odds of perceiving an unfair police stop (OR = 1.19). Likewise, Puerto Rican (OR = 1.75; p < .10), Cuban (OR = 2.47), and Salvadoran adults (OR = 2.70) had greater odds of a self-reported unfair stop than Mexican adults. Dominicans showed lower odds than Mexicans/Chicanos (OR = .28). U.S. citizens were more likely to experience perceived unfair police stops (OR = 1.97).
Binary Logistic Regressions of Being Unfairly Stopped by Police for Adults of Self-identified Hispanic, Latino, or Spanish Descent in the National Survey of Latinos, 2021 (n = 2,899).
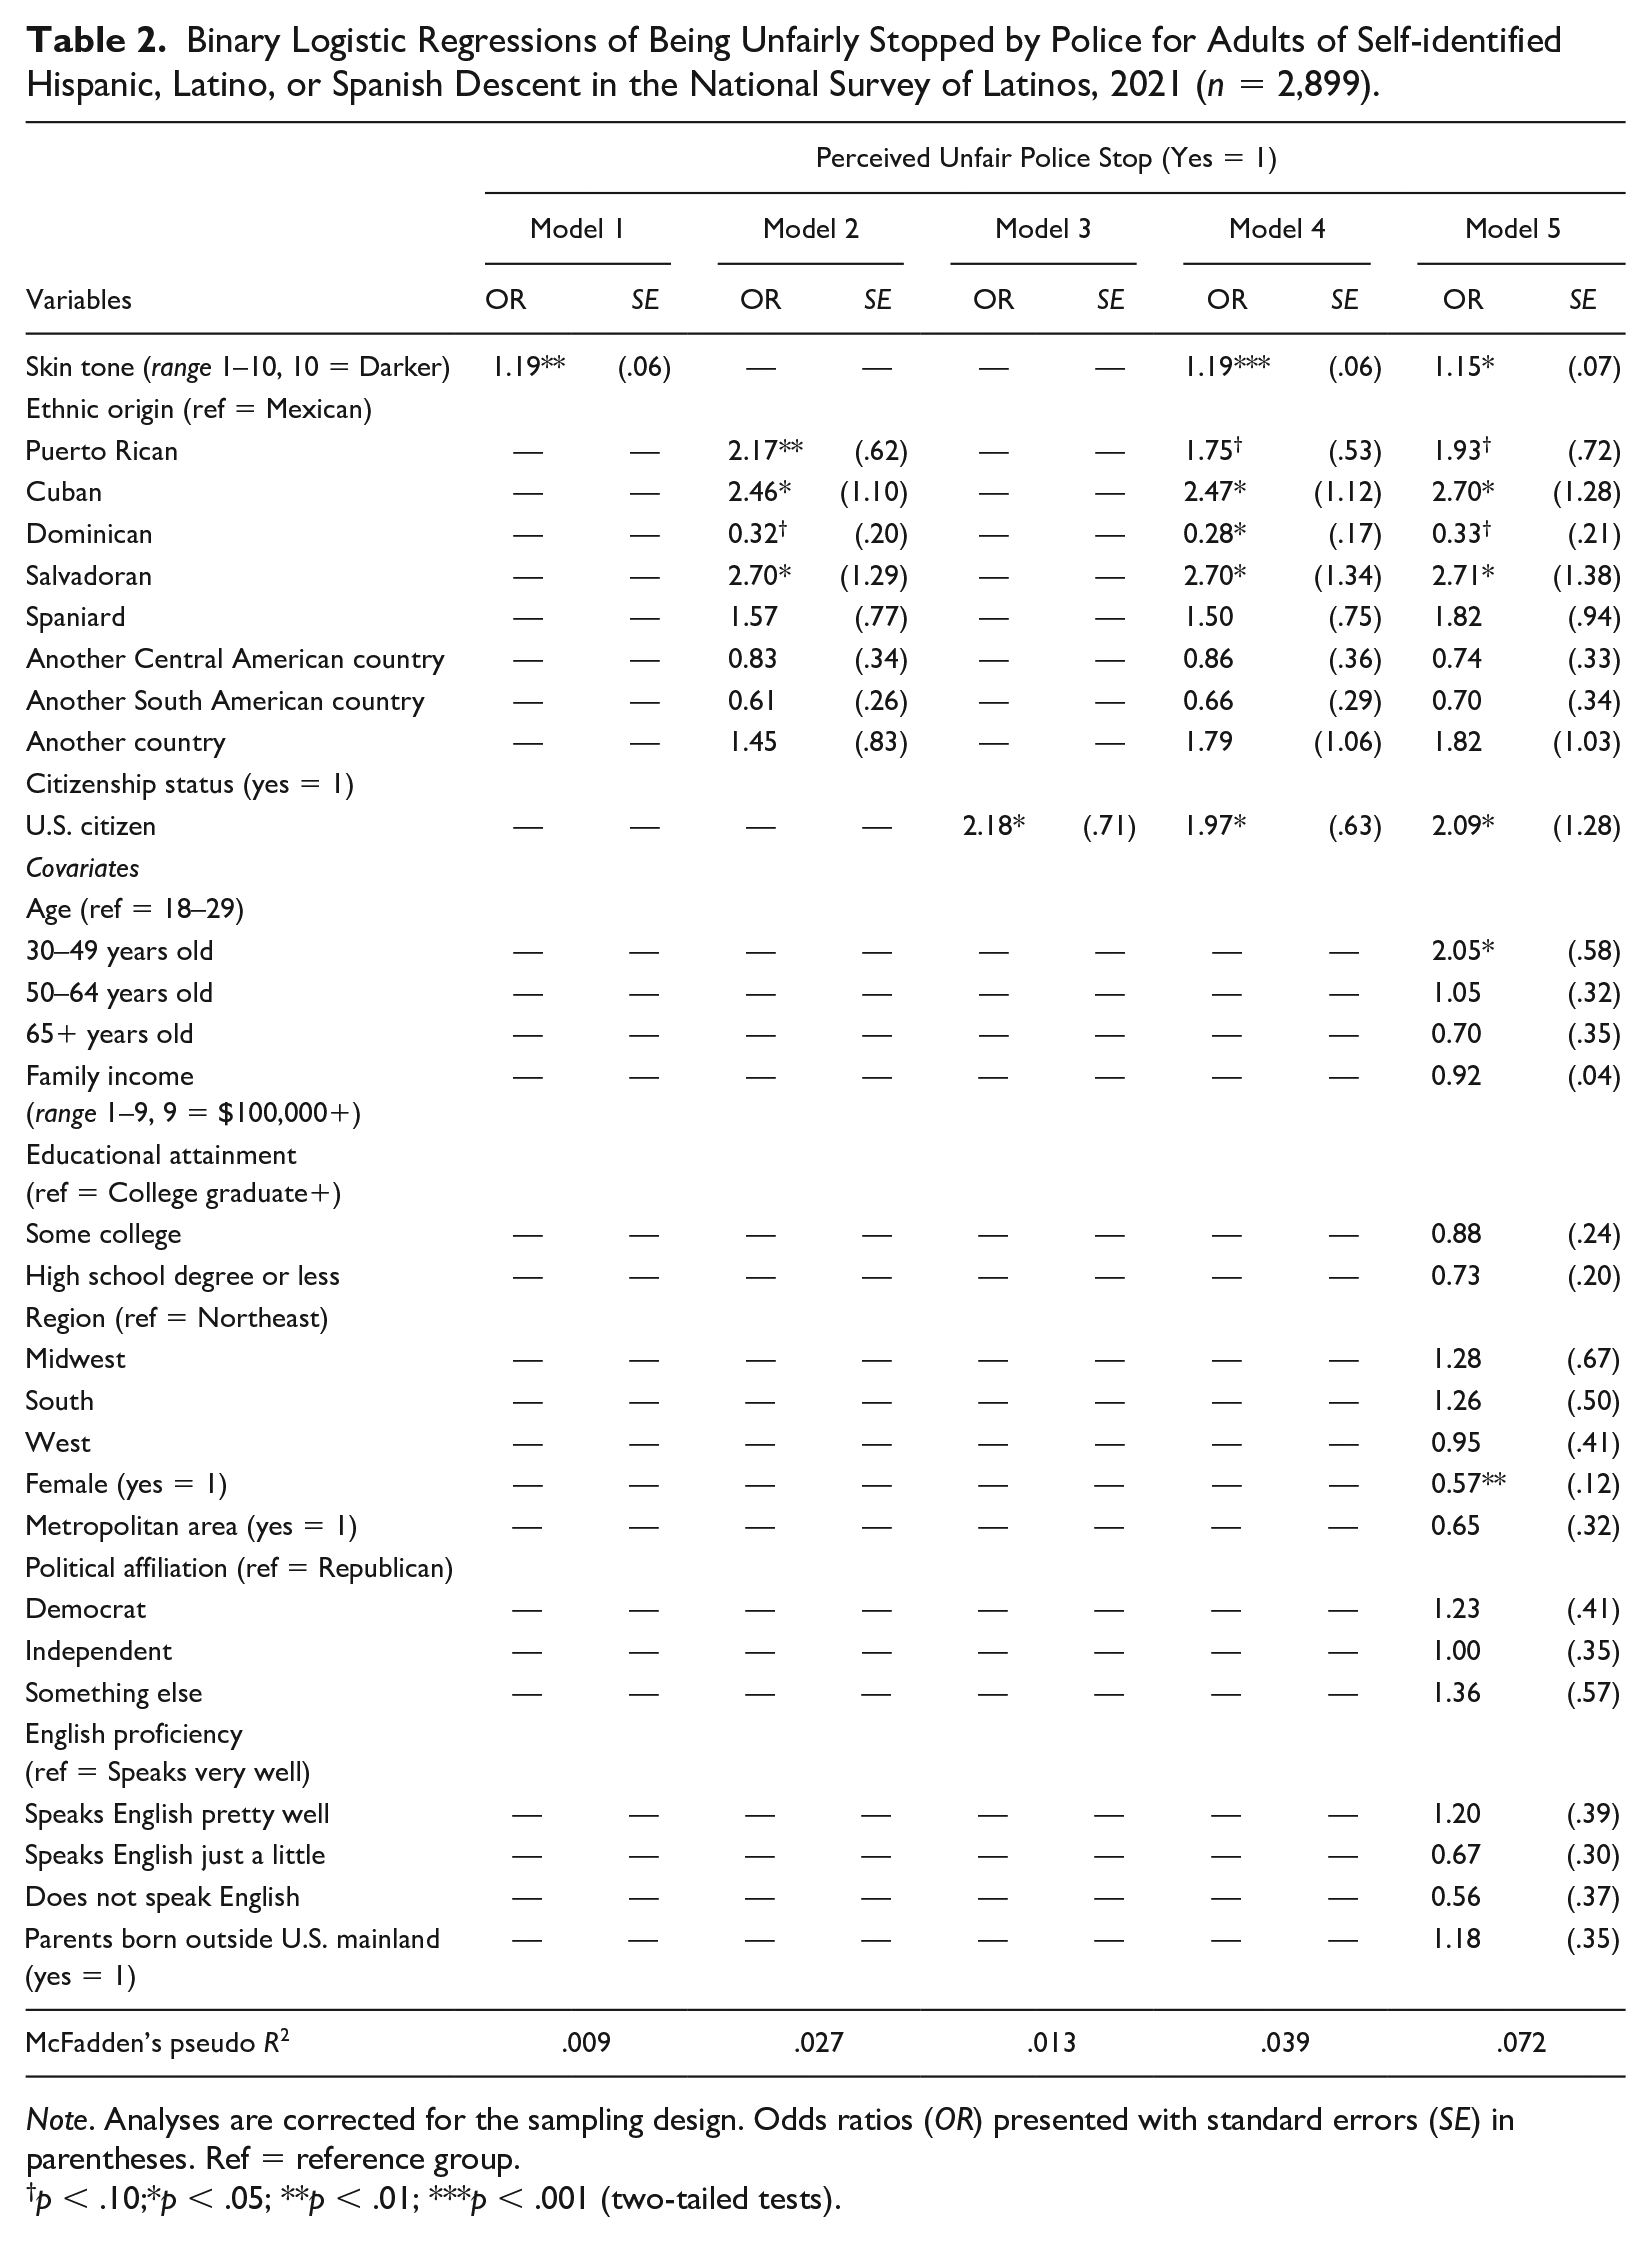
Note. Analyses are corrected for the sampling design. Odds ratios (OR) presented with standard errors (SE) in parentheses. Ref = reference group.
p < .10;*p < .05; **p < .01; ***p < .001 (two-tailed tests).
Model 5 incorporated all study variables. The darker skin tone gradient was positively associated with increased odds of a perceived unfair police stop (OR = 1.15). Cubans (OR = 2.70) and Salvadorans (OR = 2.71) had greater odds of self-reporting an unfair stop than Mexicans. Puerto Ricans (OR = 1.93; p < .10) had marginally greater odds, while Dominicans had marginally lower odds (OR = .33; p < .10). Citizens had higher odds of a self-reported, unfair police stops by a factor of 2.09.
Figure 1 derives from estimates presented in Model 5 and graphs adjusted predicted probabilities of a perceived unfair stop at values of the skin tone gradient (e.g., 1, 2, 3). The figure shows a positive relationship between the probability of a perceived unfair police stop and darker skin tone. At the lightest skin tone, the probability of a self-reported unfair stop was 7 percent. The probability significantly increased to 12 percent for people with a skin tone of 5. For adults with the darkest skin tone, the probability of an unfair police stop inflated to 20 percent. Latinos with the darkest skin tones had nearly a one in five chance of a self-reported unfair police stop even after accounting for other measures.
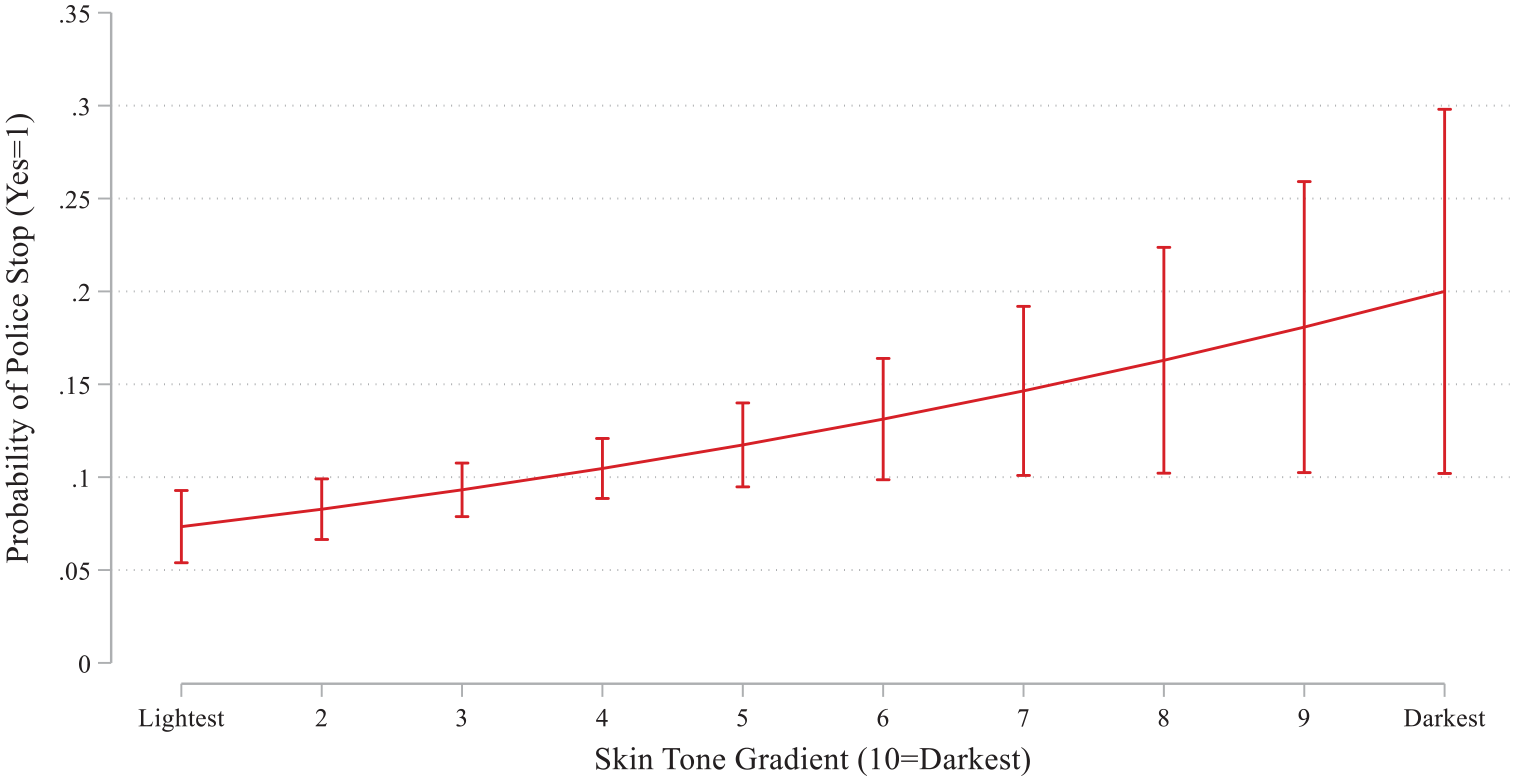
Adjusted predicted probability of a perceived unfair police stop at representative values of skin tone among adults of Hispanic, Latino, or Spanish origin in the National Survey of Latinos, 2021.
Figure 2 depicts average adjusted predicted probabilities by ethnic origin. Estimates in Figure 2 derive from the Model 5 equation and reflect the average probability of a police stop for each group after averaging the probabilities for each respondent. While Puerto Ricans (probability = .16), Cubans (probability = .18), and Salvadoran adults (probability = .19) had statistically similar probabilities, all three had higher probabilities of a self-reported unfair stop relative to Dominicans (probability = .03), Mexicans/Chicanos (probability = .08), and South Americans (probability = .05). Dominicans showed markedly lower probabilities of a self-reported unfair police stop compared with most other groups.
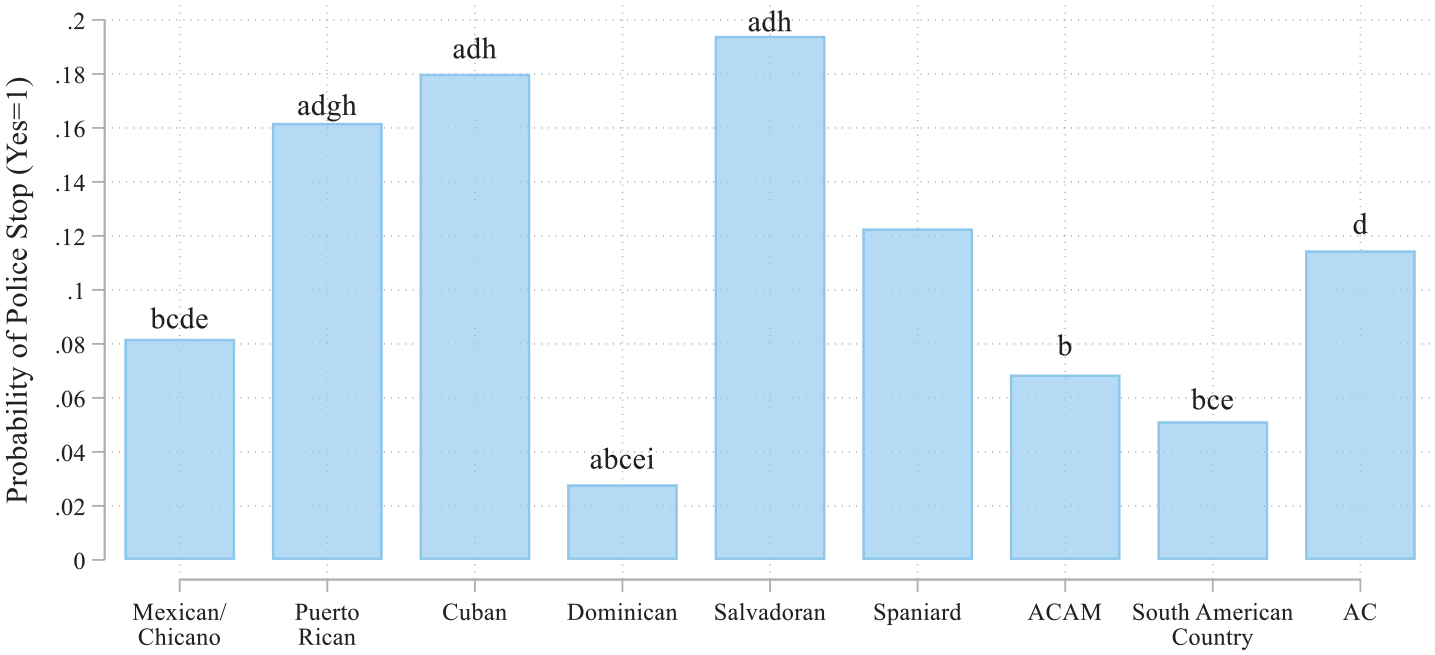
Average adjusted predicted probability of a perceived unfair police stop by ethnic origin among adults of Hispanic, Latino, or Spanish origin in the National Survey of Latinos, 2021.
Discussion
This study investigated the association between perceived unfair police stops among Latinos and skin tone, ethnic origin, and citizenship status. We anticipated that people with darker skin tones would be more likely to experience self-reported unfair police stops (Hypothesis 1). Results supported Hypothesis 1 such that the probability of unfair police stops increased by about 1 percent as the skin tone gradient darkened (Table 2 and Figure 1). In addition, Hypothesis 2a–f anticipated that Puerto Ricans, Dominicans, and Mexicans/Chicanos would experience higher odds of unfair police treatment than others. Results in Figure 2 only supported Hypothesis 2d–e for Puerto Ricans having higher odds compared with Central and South Americans. Results did not support Hypothesis 3 that U.S. citizens would experience lower odds of perceived unfair stops (Table 2).
To explain key findings, we return to our theoretical framework. Overall, results were mixed in their support of tri-racial stratification theory. Recall that the perspective specifies that the socially constructed ethnoracial hierarchy in the United States is growing in similarity to Latin America where stratification is largely based on phenotype (Bonilla-Silva 2004, 2021). In the present case, lighter skin tones were associated with decreased odds of self-reported unfair police stops, which is consistent with the theory. Those with lighter complexions are generally closer in social proximity to whiteness, which is important because whiteness grants or restricts access to valued resources and opportunities. Moreover, police may perceive people with lighter skin tones as less suspicious, threatening, and criminal, and thus, be less likely to stop them. The present findings extend research that showed darker skin was associated with higher likelihood of perceiving and experiencing discrimination (Canache et al. 2014; Finkeldey and Demuth 2021; Telles and Ortiz 2008; White 2015). With exception to Puerto Ricans’ disproportionate police contact, the present study’s findings on ethnic origin do not align well with tri-racial stratification theory. While skin tone is not concentric with ethnic origin, we propose that stratification in self-reported unfair police stops involves the confluence of skin tone, ethnic origin, and citizenship status as well as the context of a stop.
This study suggests that skin tone remains a powerful stratifying social status with implications for interactions with police. Importantly, findings related to skin tone should be understood in the context of skin tone being one form of bodily capital that is interpreted or observed by others depending on a person’s additional identifiers (e.g., hair, facial features, names, accents, clothing) as well as where the interaction is taking place (e.g., neighborhood, home, courtroom) (Monk 2019; Santana 2018; Yadon and Ostfeld 2024). Yet, some ethnic origin groups, despite average lighter skin tones, are still disadvantaged relative to others. Cuban Americans, as members of tri-racial stratification’s honorary Whites’ strata, show an average skin tone that is second lightest only to folks from another country, and they are on average socioeconomically advantaged relative to many other groups (see the appendix). By contrast, Puerto Ricans and Dominicans, both members of the collective Black strata, have average skin tones that fall on the darker end of the spectrum, yet Puerto Ricans are more likely to encounter police discrimination while Dominicans show markedly lower probabilities than others. These findings are consistent with a study that showed that Puerto Rican New Yorkers felt that the police were unreasonably suspicious of their citizenship (Solis et al. 2009); hence, interactions may lead to greater instances of self-reported unfairness. This means that social context and the institution with which one is interacting with factors into the production of ethnoracial inequality (Yadon and Ostfeld 2024).
Puerto Rican, Cuban, and Salvadoran adults had greater probabilities of a perceived unfair stop than Mexican/Chicano adults, which is directionally consistent with existing research (Santana 2018). We anticipate that groups may experience higher odds of self-reported unfair police treatment dependent on other characteristics such as neighborhood, degree of social disorganization, or concentration of poverty that we are unable to incorporate into the present study. Ultimately, tri-racial stratification’s heuristic imperfectly captures self-reported unfair police contact in this study. Nonetheless, the criminal legal system remains a race-making institution, and race-ethnicity continues to reflect the ascription of social significance to physical characteristics with profound implications for life chances.
Our findings on ethnic origin may reflect the socially constructed nature of legal or undocumented status. In other words, research has shown that people ascribe legal status to others based on national origin, occupation, and symbolic attributes (Flores and Schachter 2018). Regardless of one’s actual legal status, some Latinos, particularly those with lower status, must navigate the stigma, suspicion, and stereotypes associated with being undocumented (Alcalá and Montoya 2018; Romero 2006; Solis et al. 2009). In the present case, Puerto Ricans, Cubans, and Salvadorans may arouse perceptions from police of undocumented status, and thus, experience more perceived unfair treatment. Moreover, each of these groups vary dramatically in their geographic concentration in the U.S. Puerto Ricans have predominantly resided in the Northeast and Central Florida, Cubans in South Florida, and Salvadorans in the Southwest (Dhuman 2023; Menjívar and Abrego 2012). While we controlled for region and metropolitan-residence, these measures may not be sensitive enough to detect areal differences in how officers perceive and police civilians across neighborhoods (Alcalá and Montoya 2018; Bjornstrom 2015).
Existing research as well as our theoretical framework anticipated that Dominicans would be disadvantaged relative to other groups given their, on average, lower socioeconomic attainment, poorer neighborhood contexts, and greater residential segregation (Bonilla-Silva 2021). The findings may stem from a decreased likelihood of reporting unfair treatment among Dominicans. For instance, research proposes that Dominican immigrants have less English proficiency, on average, relative to other foreign-born immigrants. Dominicans are also more likely than other immigrants to enter the United States through family-sponsored preferences (Babich and Batalova 2021). In the present study, nearly all Dominicans’ parents were born outside the United States. Yet, most Dominicans in the United States are U.S. citizens, and the vast majority of Dominican immigrants become permanent U.S. residents (Babich and Batalova 2021). A second contributing factor is that over 70 percent of Dominican respondents are women in this study (see the appendix). While women of color encounter police mistreatment in various forms, men are typically more likely to self-report unfair treatment (Table 1); hence, the results are partly the result of sample composition. Third, research in New York City, home to many Dominicans, showed that immigrant communities are typically less cynical of the law and more cooperative with legal authority (Kirk et al. 2012). Consequently, the unique immigration experiences and contexts Dominicans encounter may lead to fewer self-reported negative police interactions.
U.S. citizens were more likely to experience unfair police stops than their non-citizen counterparts (Table 2). Non-citizens, and particularly those who are undocumented, generally have more to lose by interacting with police than citizens such that deportation could result, and consequently, non-citizens may be less likely to report experiencing unfair treatment (Romero 2006). In addition, citizens may have different expectations of professional treatment by police. While citizens may be more likely to feel that their treatment was unfair, non-citizens could have lower expectations about what they perceive as unfair. Nonetheless, immigrants become more perceptive of differential treatment and unfairness over time (Pérez et al. 2008; Szaflarski and Bauldry 2019; Waters 1999). The more immigrants and their descendants establish themselves as part of mainstream society, their awareness about their group’s enduring marginalized status grows (Portes, Parker, and Cobas 1980; Schaeffer and Kas 2023). Moreover, citizens may drive more than non-citizens in part because of the potential adverse outcomes non-citizens may encounter while driving (e.g., fines for driving without documentation, driving without insurance). A large share of police contact is in the context of police-initiated traffic stops. In fact, approximately 84 percent of police-initiated contact with civilians are traffic stops (Tapp and Davis 2022). Thus, non-citizens who do not drive may have a lower probability of encountering unfair police treatment.
Limitations
This study should be interpreted in light of several limitations. First, our use of cross-sectional data precludes causal conclusions. For instance, research contends that contact with the legal system shapes how one self-identifies racially as well as how others identify people such that selection bias could result (Saperstein and Penner 2012). Ostfeld and Yadon (2022b) state that perceptions of one’s own skin color are not simply based on appearance, but are deeply embedded within one’s understanding of American political power. Second, the analyses should be interpreted in light of the limited covariates that we are able to include. Future research would benefit from incorporating measures such as neighborhood disadvantage, ethnoracial composition, crime rates, previous offending, and contact with police. Factors including a narrower identification of immigrant generational status, perceived social and emotional support, and familiarity with U.S. social issues likely inform Latinos’ experiences with police (Alcalá and Montoya 2018; Santana 2018). Third, much contact between police and civilians occurs in the context of traffic stops (Tapp and Davis 2022). Yet, the survey does not allow determination of whether people drive. More information in future research on the context of police interactions would aid in clarifying where, when, and how perceived unfair stops occur among Latinos.
Conclusion
Results presented here identified heterogeneity among Latino populations such that variation in skin tone, ethnic origin, and citizenship status independently factor into self-reported unfair police stops. Research examining ethnoracial disparities in criminal legal contact and its consequences would benefit from more fully disaggregating panethnic groups. In addition, researchers must continue to grapple with how systemic racism impacts daily life outside a Black-White binary. Our findings call to action U.S. policymakers and law enforcement agencies, and highlight the need for increased police training to recognize the biases that underlie discriminatory profiling based on ethnoracial status (Talbert 2023; Talbert and Patterson 2024). It remains imperative to improve policing practices considering unfair police stops’ extensive criminogenic, socioeconomic, and health effects (Hirschtick et al. 2020; Kalinowski et al. 2022; Turney 2021; Vélez and Peguero 2023). Divesting from punitive policing practices is crucial for reducing ethnoracial disparities in the criminal legal system and their spillover consequences.
Footnotes
Appendix
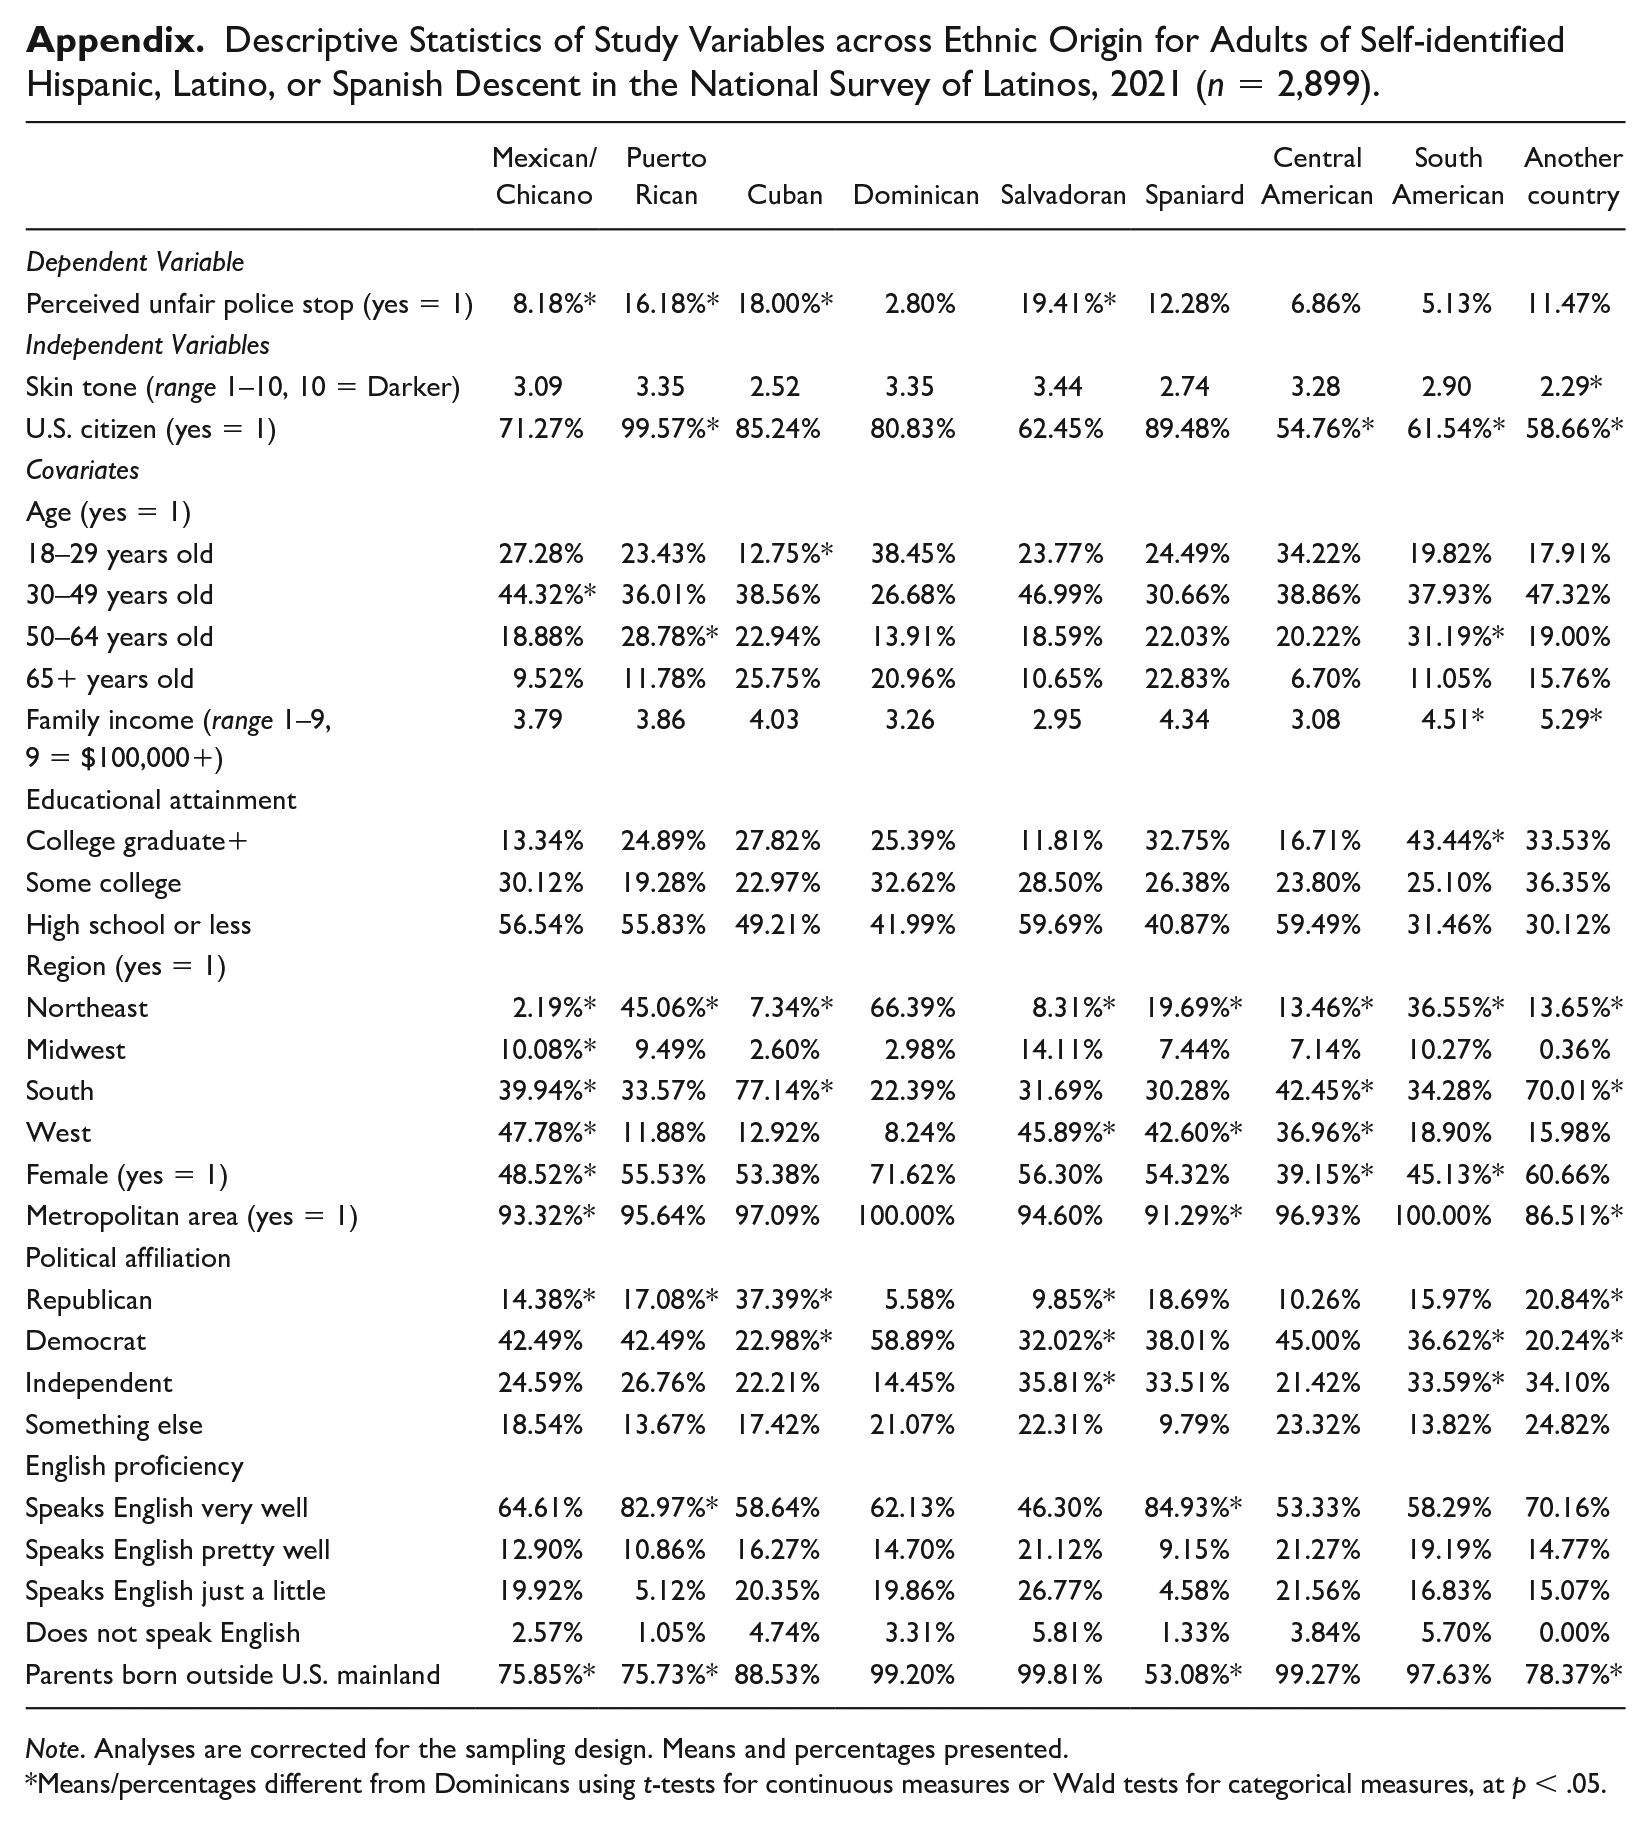
Descriptive Statistics of Study Variables across Ethnic Origin for Adults of Self-identified Hispanic, Latino, or Spanish Descent in the National Survey of Latinos, 2021 (n = 2,899).
| Mexican/Chicano | Puerto Rican | Cuban | Dominican | Salvadoran | Spaniard | Central American | South American | Another country | |
|---|---|---|---|---|---|---|---|---|---|
| Dependent Variable | |||||||||
| Perceived unfair police stop (yes = 1) | 8.18%* | 16.18%* | 18.00%* | 2.80% | 19.41%* | 12.28% | 6.86% | 5.13% | 11.47% |
| Independent Variables | |||||||||
| Skin tone (range 1–10, 10 = Darker) | 3.09 | 3.35 | 2.52 | 3.35 | 3.44 | 2.74 | 3.28 | 2.90 | 2.29* |
| U.S. citizen (yes = 1) | 71.27% | 99.57%* | 85.24% | 80.83% | 62.45% | 89.48% | 54.76%* | 61.54%* | 58.66%* |
| Covariates | |||||||||
| Age (yes = 1) | |||||||||
| 18–29 years old | 27.28% | 23.43% | 12.75%* | 38.45% | 23.77% | 24.49% | 34.22% | 19.82% | 17.91% |
| 30–49 years old | 44.32%* | 36.01% | 38.56% | 26.68% | 46.99% | 30.66% | 38.86% | 37.93% | 47.32% |
| 50–64 years old | 18.88% | 28.78%* | 22.94% | 13.91% | 18.59% | 22.03% | 20.22% | 31.19%* | 19.00% |
| 65+ years old | 9.52% | 11.78% | 25.75% | 20.96% | 10.65% | 22.83% | 6.70% | 11.05% | 15.76% |
| Family income (range 1–9, 9 = $100,000+) | 3.79 | 3.86 | 4.03 | 3.26 | 2.95 | 4.34 | 3.08 | 4.51* | 5.29* |
| Educational attainment | |||||||||
| College graduate+ | 13.34% | 24.89% | 27.82% | 25.39% | 11.81% | 32.75% | 16.71% | 43.44%* | 33.53% |
| Some college | 30.12% | 19.28% | 22.97% | 32.62% | 28.50% | 26.38% | 23.80% | 25.10% | 36.35% |
| High school or less | 56.54% | 55.83% | 49.21% | 41.99% | 59.69% | 40.87% | 59.49% | 31.46% | 30.12% |
| Region (yes = 1) | |||||||||
| Northeast | 2.19%* | 45.06%* | 7.34%* | 66.39% | 8.31%* | 19.69%* | 13.46%* | 36.55%* | 13.65%* |
| Midwest | 10.08%* | 9.49% | 2.60% | 2.98% | 14.11% | 7.44% | 7.14% | 10.27% | 0.36% |
| South | 39.94%* | 33.57% | 77.14%* | 22.39% | 31.69% | 30.28% | 42.45%* | 34.28% | 70.01%* |
| West | 47.78%* | 11.88% | 12.92% | 8.24% | 45.89%* | 42.60%* | 36.96%* | 18.90% | 15.98% |
| Female (yes = 1) | 48.52%* | 55.53% | 53.38% | 71.62% | 56.30% | 54.32% | 39.15%* | 45.13%* | 60.66% |
| Metropolitan area (yes = 1) | 93.32%* | 95.64% | 97.09% | 100.00% | 94.60% | 91.29%* | 96.93% | 100.00% | 86.51%* |
| Political affiliation | |||||||||
| Republican | 14.38%* | 17.08%* | 37.39%* | 5.58% | 9.85%* | 18.69% | 10.26% | 15.97% | 20.84%* |
| Democrat | 42.49% | 42.49% | 22.98%* | 58.89% | 32.02%* | 38.01% | 45.00% | 36.62%* | 20.24%* |
| Independent | 24.59% | 26.76% | 22.21% | 14.45% | 35.81%* | 33.51% | 21.42% | 33.59%* | 34.10% |
| Something else | 18.54% | 13.67% | 17.42% | 21.07% | 22.31% | 9.79% | 23.32% | 13.82% | 24.82% |
| English proficiency | |||||||||
| Speaks English very well | 64.61% | 82.97%* | 58.64% | 62.13% | 46.30% | 84.93%* | 53.33% | 58.29% | 70.16% |
| Speaks English pretty well | 12.90% | 10.86% | 16.27% | 14.70% | 21.12% | 9.15% | 21.27% | 19.19% | 14.77% |
| Speaks English just a little | 19.92% | 5.12% | 20.35% | 19.86% | 26.77% | 4.58% | 21.56% | 16.83% | 15.07% |
| Does not speak English | 2.57% | 1.05% | 4.74% | 3.31% | 5.81% | 1.33% | 3.84% | 5.70% | 0.00% |
| Parents born outside U.S. mainland | 75.85%* | 75.73%* | 88.53% | 99.20% | 99.81% | 53.08%* | 99.27% | 97.63% | 78.37%* |
Note. Analyses are corrected for the sampling design. Means and percentages presented.
Means/percentages different from Dominicans using t-tests for continuous measures or Wald tests for categorical measures, at p < .05.