
Abstract
Increasingly children spend the period of rapid development between ages of 3 and 5 years in group-based learning settings. To unpack the timing and sequence of skill growth during this period, we use piecewise growth modeling with longitudinal data on 154 children participating in 2 years of public prekindergarten. We consider whether growth patterns differ across four learning domains as well as between children who are dual language learners versus monolingual English speakers and children beginning prekindergarten scoring lower versus higher at baseline. We generally observed positive growth in all domains across all time points, with the exception of spring of the second year, when we observed limited growth. Although there were few differences in growth patterns by children’s language status, children who scored lower at baseline grew faster than those with higher baseline scores. The implications of these findings for prekindergarten programs looking to consistently promote all children’s learning are discussed.
Keywords
Introduction
Today, a sizable proportion of young children spend time before kindergarten in a variety of publicly funded group-based early learning programs outside the home (Cascio, 2023; Jones et al., 2020). Robust empirical evidence compiled over the last several decades has shown that these types of programs, which include public school–based prekindergarten (pre-K) and a diversity of community-based centers receiving public funds, have the potential to nurture children’s learning during this foundational period of development, because children who attend pre-K programs tend to have stronger skills at kindergarten entry than those who do not (e.g., Puma et al., 2005; Weiland & Yoshikawa, 2013; Wong et al., 2008). Yet, despite the strong evidence on the influence of pre-K participation on children’s outcomes at the start of kindergarten, less is known about the timing and sequencing of how skills develop during the period in which they are enrolled in pre-K programs because most studies focus on children’s skill levels only at the end of the program period. Studies that do focus on developmental trajectories tend to focus only on singular skill areas (e.g., math or literacy), meaning that they often do not examine how patterns of growth compare across domains or unfold over multiple years of enrollment within publicly funded pre-K programs.
This study expands our understanding of children’s learning during public pre-K by examining how their language, literacy, math, and executive functioning (EF) skills broadly grow during 2 years of pre-K. Specifically, we examine skill growth in each of these domains across five time points among a sample of 154 children enrolled in one of the largest public pre-K programs, federally funded Head Start, as both 3- and 4-year-olds using a piecewise regression approach. This empirical approach allows us to flexibly estimate the magnitude of skill growth between different time points across the 2 school years. We also examine whether growth patterns differ by children’s primary language status or baseline skill level. In doing so, we extend prior work on publicly funded pre-K by (a) looking at learning across multiple years of enrollment in the same program, (b) using growth modeling to understand broad patterns and timing of learning during pre-K, and (c) including a wide range of outcome measures to understand how learning differs across domains. These advancements generate descriptive insights to inform practice- and policy-related decisions about how to best support children’s learning in early education programs. Specifically, understanding when growth occurs, for whom, and in which domains can help program leaders consider where additional instructional supports (e.g., curricular supplements and professional-development resources) might be needed to sustain children’s learning over time. These insights are particularly relevant as public pre-K programs across the nation follow Head Start’s lead by expanding early education opportunities for 3-year-olds (e.g., as in New York City’s 3-K program).
Children’s Growth and Learning Across Domains During Pre-K Enrollment
Early childhood is an exciting period of rapid developmental change during which children are increasingly able to effectively communicate, retain information, engage in complex thinking, and regulate themselves (Sameroff, 2010). Pre-K settings are seen as important environments that can shape young children’s learning across multiple domains not only because of the amount of time a majority of children today spend in these spaces but also because of their potential to influence how children develop (Yoshikawa et al., 2013). For many children, pre-K settings represent a new frontier outside the home in which they get the chance to interact with same-age peers and nonfamilial adults, operate in group settings, and engage with new content and materials. These experiences extend the abilities children bring to pre-K programs by requiring them to communicate in new ways (language) and regulate their attention and behavior in unfamiliar scenarios (executive functioning) while also introducing them to new ways to engage with literacy and mathematical concepts. In pre-K, literacy instruction spans skills such as phonologic and print awareness, alphabet knowledge, writing, comprehension, and early reading (Portilla et al., 2025a). In math, it spans concepts and abilities related to numerical sense, operations and algebraic thinking, measurement, and geometry (Portilla et al., 2025b). In line with this comprehensive skill focus, instruction in most pre-K programs recognizes the interplay among these skill domains and seeks to support their simultaneous growth to foster strong overall child development (e.g., stronger EF can bolster language development and vice versa; Hanno & Surrain, 2019).
Empirical research has confirmed that pre-K programs have the potential to positively impact multiple skill areas by the end of pre-K (Phillips et al., 2017). Much of the more rigorous evidence on this topic has come from studies exploiting birthday cutoffs that determine eligibility for public pre-K programs to compare the outcomes of children who are eligible by a cutoff date and enroll in pre-K (the treatment group) and those who are not eligible by the cutoff date and cannot enroll in pre-K (the control group) (Lipsey et al., 2015). These studies show that children completing a year of pre-K tend to generally have higher language, literacy, math, and EF skills than those who are yet to enroll (Gormley et al., 2005; Weiland & Yoshikawa, 2013; Wong et al., 2008). In their examination of Boston Public School’s 4-year-old pre-K program, Weiland and Yoshikawa (2013) found moderate to large average effects on children’s early academic skills (i.e., language, literacy, and math; ranging from 0.45 to 0.62 SD) and smaller effects on several measures of EF (0.20–0.27 SD). EF reflects children’s ability to manage their cognitive processes and is often thought to consist of three components: inhibitory control, working memory, and cognitive flexibility (Diamond, 2013). The authors of that study hypothesized that the smaller effects on EF as compared with those on early academic skills might be because EF skills were not explicitly targeted by the Boston Public School curriculum but still were likely to develop through spillover consequences of early academic development. That is, building language, literacy, and math skills requires children to employ progressively more complex EF skills such that children can sustain engagement in learning tasks, retain new information, and mentally represent abstract concepts (Hanno & Surrain, 2019; Hanno et al., 2020).
A smaller number of randomized controlled trials in which the opportunity to enroll in pre-K was randomly offered to children have confirmed the short-term impacts of pre-K (Lipsey et al., 2018; Puma et al., 2005). The largest of these studies—the Head Start Impact Study—involved randomizing a national sample of nearly 5,000 three- and four-year-old children from low-income communities to either receive Head Start services or not. Analyses examined impacts separately at the end of 1 year of Head Start for those starting as 3-year-olds (before a subsequent year of pre-K) and those starting as 4-year-olds (before kindergarten). Results indicated statistically significant impacts for the 3-year-old cohort on math (0.15 SD), early literacy skills such as phonologic awareness (0.10 SD), and receptive vocabulary (0.18 SD) (Puma et al., 2010). Among the 4-year-old cohort, there were no significant impacts on math, but there were impacts on some early literacy and language skills (0.09–0.25 SD for direct assessments). The study did not examine impacts on EF. The study also was unable to examine the impacts of 2 years of Head Start participation among the 3-year-old cohort because children in the control condition were allowed to participate in Head Start during their 4-year-old year.
These studies offer rigorous causal evidence into children’s skill gains during pre-K programs. However, they are limited in their ability to illuminate how and when children’s skills develop during their time enrolled in pre-K because they tend to focus on outcomes at the end of a single pre-K year (and most often only in the 4-year-old year). Understanding when learning is occurring (or not) can inform program-level instructional adjustments to potentially improve the ultimate impact of pre-K. These adjustments could include adding reinforcements for specific skill areas or providing additional support to specific subpopulations. Descriptive studies of children’s skills in early childhood have suggested that development across skill domains in this period is unlikely to be consistent or linear across time (Connor et al., 2006; Cuartas et al., 2022; Hojnoski et al., 2009). For example, in EF, Cuartas et al. (2022) used data from a statewide study of >2,000 three- and four-year-olds to chart a host of regulation-related outcomes, including the Minnesota Executive Function Scale (Carlson, 2021) reflecting multiple subdomains of EF, against age. The authors found that EF skills tend to expand rapidly between the ages 3 and 5 years, with growth slowing around age 5. Similarly, some studies examining multiple waves of data on children’s academic skills using longitudinal growth-modeling approaches uncovered nonlinear growth patterns in these skills, with gains decelerating or accelerating as children progress through early learning experiences (Choi et al., 2016; Hojnoski et al., 2009; Peisner-Feinberg et al., 2001). Using data from the Head Start Family and Child Experiences 2006 (FACES 2006) cohort, Choi et al. (2016) used growth-curve modeling with assessment data collected at four time points with children first enrolled in Head Start as 3-year-olds: fall of the 3-year-old year, spring of the 3-year-old year, spring of the 4-year-old year, and spring of kindergarten. The authors found that reading and math growth rates accelerated across the 2 years, but receptive vocabulary growth slowed.
In contrast to growth-modeling approaches that make assumptions about the association between growth rates across time periods, piecewise growth models that flexibly estimate growth rates between time points offer a method for understanding whether there are specific time periods during which skill growth is most (or least) pronounced. McCormick et al. (2021) used this approach in a sample of children attending pre-K in Boston to show that children’s math and language growth slows in the summer between pre-K and kindergarten compared with growth during the pre-K and kindergarten years. This approach similarly could be used to understand whether there are periods during pre-K in which children’s skills advance rapidly (or not). In line with the literature reviewed earlier, we might expect children to quickly develop some skills—such as EF—early in pre-K because they are required to build competencies that allow them to function in group-based learning settings (e.g., waiting their turn, suppressing impulses, and switching between activities). In contrast, children’s abilities in other areas—such as early math and literacy—might accelerate only later on in pre-K once foundational classroom routines are well established and there can be more instructional focus on academic content.
Individual Differences in Skill Growth During Pre-K
Patterns of skill growth during pre-K may vary not only across outcomes and time periods but also across groups of children. Subgroup analyses of growth during pre-K are typically grounded in two opposing hypotheses: the complementarity hypothesis and the compensatory hypothesis (Choi et al., 2016; Watts et al., 2023). On the one hand, pre-K programs may induce complementarities, wherein children arriving in programs with the strongest skills are most able to continue expanding their abilities (“skills beget skills”; Cunha & Heckman, 2007, p. 35). On the other hand, pre-K programs may play a compensatory role, best nurturing the skills of children with the most room to grow or who have had few prior experiences to develop skills targeted by pre-K programs. It is also possible that both hypotheses might coexist, with complementarities potentially being more salient for complex skills (e.g., children with strong vocabularies may quickly learn more words as they make connections to other words and use context clues to infer definitions) and compensatory effects for basic skills (e.g., children who know few letters can learn them quickly in pre-K) (Maier et al., 2022).
Children’s baseline skills are often used in analyses testing the complementarity and compensatory hypotheses. Under the complementarity hypothesis, there would exist a significant positive interaction between baseline skills and pre-K, whereas under the compensatory hypothesis there would be a significant negative interaction. The Head Start Impact Study found support for the compensatory hypothesis, with program impacts on language and early math skills being greater for 3-year-olds entering with pre-academic skills in the lowest quartile than for those with baseline skills not in the lowest quartile (Puma et al., 2010). A randomized study of public pre-K in Tennessee similarly found that children with the lowest baseline skills grew most as a result of the program (Lipsey et al., 2018). Descriptive conditional growth-curve analyses examining associations between baseline skills and growth in a national sample of children enrolled in Head Start for 2 years also supported the compensatory hypothesis in receptive language, because language growth was higher for children with lower baseline language skills than for those with higher baseline skills (Choi et al., 2016). However, the authors found no differential growth patterns by baseline skills for math or early literacy.
Analyses examining outcomes for dual language learners (DLLs) compared with those for monolingual children typically have found greater growth for DLLs, particularly for language and literacy outcomes (Lipsey et al., 2018; Puma et al., 2010; Weiland & Yoshikawa, 2013). In line with the compensatory hypothesis, pre-K programs may represent initial exposure to English-speaking environments for children with limited English proficiency, offering opportunities to develop skills reflected on English language assessments that children otherwise may not have. At the same time, in line with the complementarity hypothesis, research has suggested that bilingual children often have advantages in EF given the mental demands of switching between languages (Barac et al., 2014; Bialystok, 2017; Bialystok et al., 2010) and that these cognitive advantages may facilitate rapid development (Choi et al., 2018; Hanno & Surrain, 2019). Thus, while DLLs may have more room to grow in some areas, such as English language, they may simultaneously have strong foundational skills in other areas such as EF that can facilitate rapid skill growth. Understanding when differential growth occurs, whether it is sustained throughout pre-K participation or concentrated in specific periods such as the start of participation, can deepen understanding of the complementary and compensatory hypotheses.
This Study
This study extends the literature on children’s learning during pre-K by examining how and when children grow across 2 years of participation in Acelero Learning Head Start, a national network of federally funded public pre-K programs primarily serving children and families experiencing poverty. Specifically, this paper draws on data collected in the 2021–22 and 2022–23 school years to address the following research questions:
In addressing these questions, this work sheds light on the development of children’s skills across a range of learning domains through multiple years of pre-K. It provides insight into when and for whom growth in each of these areas is greatest. This work has implications for the development of more effective early childhood education programs by illuminating the periods during which programs might need to consider ways to better support specific aspects of children’s learning. Early childhood education programs beginning at age 3 are increasingly touted as an important policy solution to ensure that children begin kindergarten on the right foot. Understanding how, when, and which skills develop across this period is critical for ensuring that these investments meet the needs of today’s early learners.
Method
Participants and Setting
Data for this study came from a research–practice partnership with Acelero Learning, a division of Acelero, Inc., which runs a national network of Head Start programs (and Early Head Start programs for younger families) that at the time of the study included four delegate sites across the country: Philadelphia, PA/Camden, NJ; Monmouth/Middlesex County, NJ; Milwaukee/Racine, WI; and Clark County, NV. (The organization has since added sites in Delaware and South Carolina.) During the 2021–22 school year, the time of initial sampling for the study, these sites served 3,276 children in 49 Head Start centers.
All centers operate with a common program model. Classrooms operate on a full-day schedule, with some programs offering extended day and/or summer coverage. All classrooms serving 3- and 4-year-olds use the network’s own Ready to Shine curriculum, which is a so-called whole-child curriculum aligned with the full range of learning standards outlined in the Head Start Early Learning Outcomes Framework. The curriculum also focuses on expanding children’s worldview and conceptual development while building on their curiosity and playfulness. It provides teachers with week-by-week lesson and activity guides corresponding to thematic units. The materials also include information on differentiation strategies to scaffold or extend learning. (For additional details on the curriculum, see LiBetti, 2019).
Acelero Learning has been recognized for affording children high-quality early learning experiences by giving educators the tools (e.g., the curriculum) and supports (e.g., coaching and ongoing data collection) they need to support children’s learning (LiBetti, 2019). These quality features make this program a prime context for understanding children’s growth under the sorts of ideal conditions that many public pre-K programs are striving toward. The earliest study of Acelero students’ learning, conducted during the 2011–12 school year, found that children’s receptive vocabulary as measured by the Peabody Picture Vocabulary Test and math as measured by the Woodcock–Johnson Applied Problems subtest grew an average of 5.12 and 4.12 standard score units from fall to spring (Barnett & Jung, 2013). More recent work conducted since the start of the COVID-19 pandemic in the 2020–21 school year found that children in Acelero Learning centers made average gains between fall and spring in print knowledge of 4.99 standard score points and in EF of 2.13 standard score points (Groom-Thomas et al., 2021).
All research activities as part of this partnership were approved by MDRC’s Institutional Review Board. As part of this work, the research team supported program staff in collecting direct assessments with a subset of enrolled students across the program’s four delegate sites during five time points in the 2021–22 and 2022–23 school years. Program staff randomly selected five to six children from each classroom’s roster for direct assessments in the winter of 2022 (T1). Parents provided permission on enrollment for the program to conduct assessments with their children. In the first year (2021–22), 475 unique students were assessed across two time points (i.e., winter [T1] and spring [T2]). In the second year (2022–23), students were assessed across three timepoints (i.e., fall [T3], winter [T4], and spring [T5]).
This paper focuses on a subset of assessed children who were (a) in their 3-year-old pre-K year (pre-K3) in the 2021–22 school year and 4-year-old pre-K year (pre-K4) in the 2022–23 school year and (b) had assessment data in at least three time points across the 2 years, including from the first assessment administration (T1). Although the first criterion allows us to examine children in pre-K for 2 years, the second ensures that we have sufficient information to estimate unique growth rates across multiple time points. Together these criteria resulted in an analytic sample of 154 students, representing 91.12% of children present in both years of data (N = 169). (Three students present in both years of data were excluded because they only had data at two time points; an additional 11 were excluded because they did not have valid assessments at T1.) Across these 154 students, 102 (66.23%) were assessed in all five time points, 46 (29.87%) in four time points, and six (3.90%) in three time points. This resulted in 712 unique student-by-time-point observations (M = 4.62 time points per child). Children in the analytic sample were nested in 67 classrooms in 35 centers in year 1 and 75 classrooms in 34 centers in year 2. In year 1, 88% of the children in the analytic sample were in mixed-age classrooms with 3- and 4-year-olds (with the remainder in 3-year-old classrooms), and in year 2, 82% were in mixed-age classrooms (with the remainder in 4-year-old classrooms).
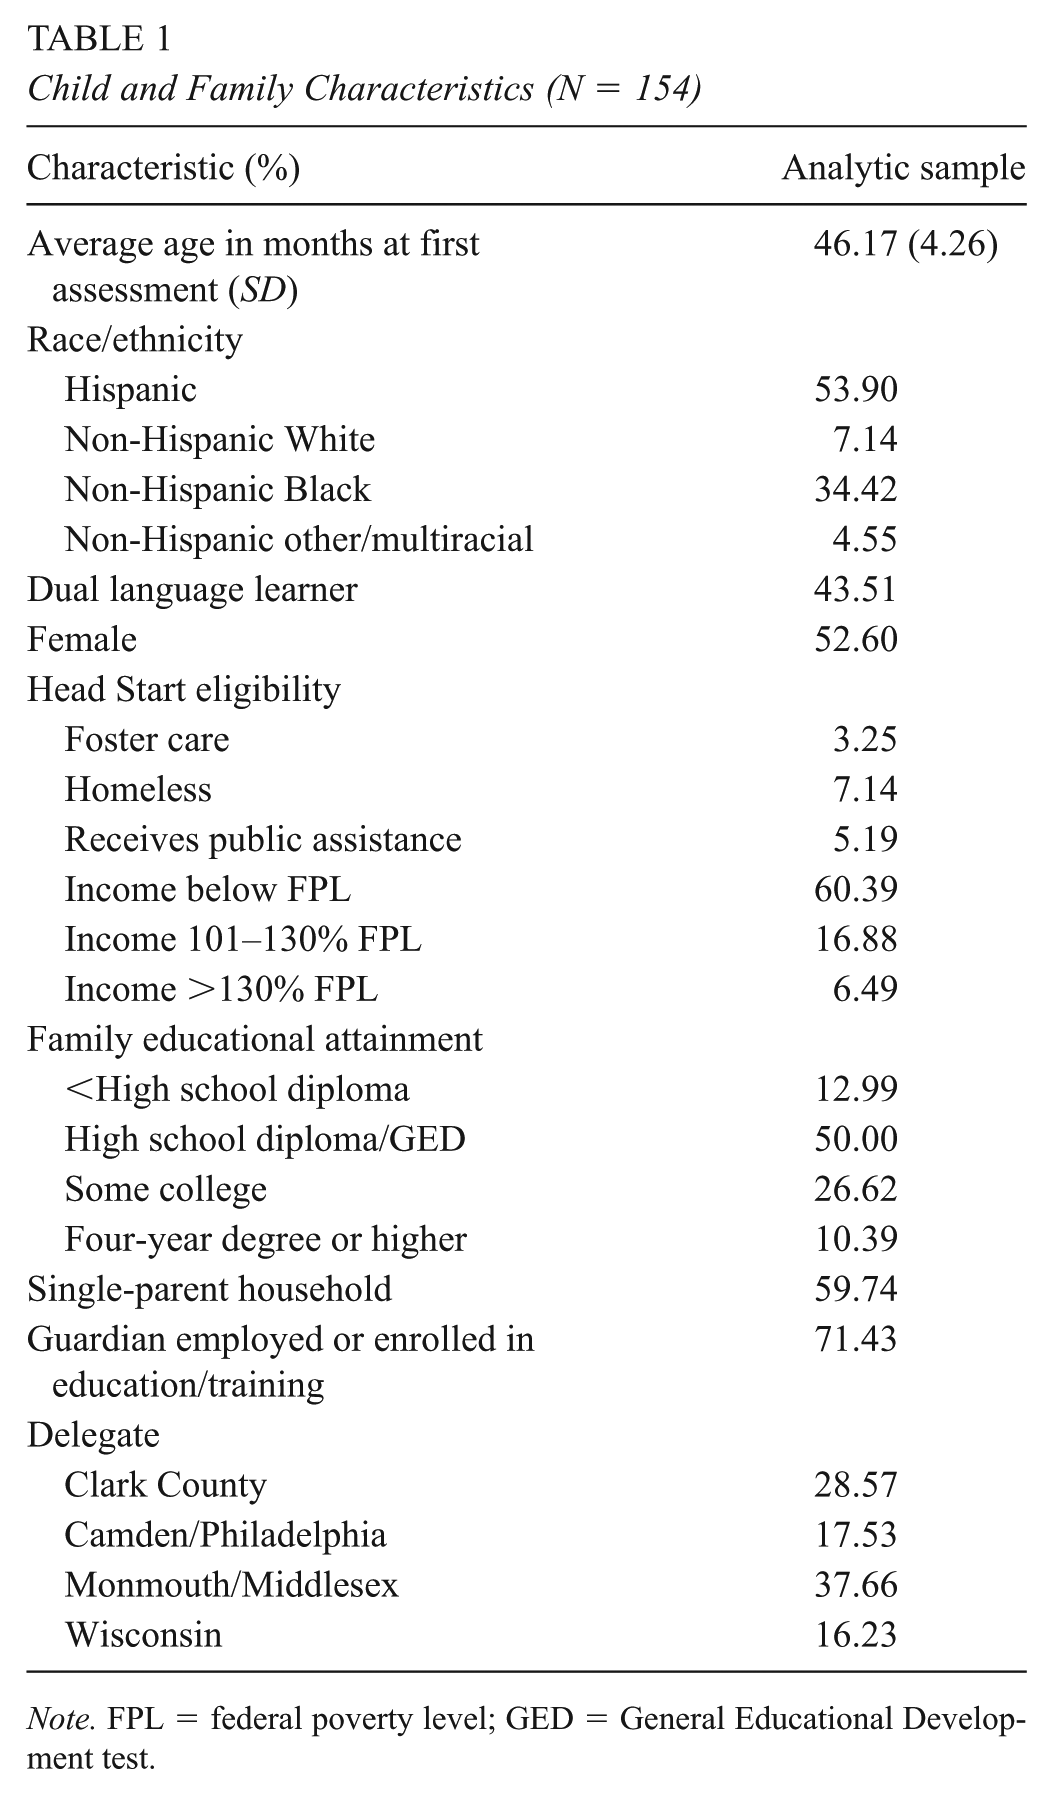
Table 1 presents descriptive statistics for the 154 children and their families in the study’s analytic sample. Most children in the sample were Hispanic (53.90%), and 34.42% identified as non-Hispanic Black, 7.14% as non-Hispanic White, and 4.55% as non-Hispanic other/multiracial. Approximately half the children were female (52.60%), and nearly half were DLLs (43.51%). Students were, on average, 46.17 months old (SD = 4.26) at the time of the first assessment in early 2022. Roughly 60% of children came from single-parent households. Primary caregivers had variable levels of education, and most were employed or enrolled in education or job training (71.43%). Supplementary Appendix Table A1 in the online version of the journal compares the demographic characteristics of this sample against (a) all children enrolled at the time of sampling (n = 3,276) and (b) the sample of children assessed in winter 2022 (T1; n = 473). Children in the analytic sample were generally similar to these other groups of children across household characteristics and Head Start eligibility categories. Children in the analytic sample were slightly more likely to be Hispanic and less likely to be Black than in the all-enrolled sample, although these characteristics were similar across the all-assessed and analytic samples.
Child and Family Characteristics (N = 154)
Note. FPL = federal poverty level; GED = General Educational Development test.
Procedures
Direct Assessments
Direct assessments were conducted by trained program staff who participated in a 1.5-day training and had passed a mock reliability assessment to demonstrate their ability to follow required procedures when conducting assessments. Assessors also completed one or two quality assurance checks during data-collection periods where they submitted recordings of themselves completing a direct assessment to receive feedback. At the time of assessment, assessors calculated each child’s age using their birthdate for the language, math, and literacy outcomes. For the EF assessment, assessors computed each child’s age by entering the child’s date of birth on the website used to administer the assessment.
All assessments were conducted in English to have comparable information on all children, to not burden DLLs to complete additional assessments in their home language during their school day, and to ensure that data could be collected in a cost-efficient way. This approach means that all DLLs were assessed in English regardless of English proficiency. Separate from the direct assessment battery, program staff screened children’s English proficiency using the preLAS (Duncan & DeAvila, 1998) three times over the course of the study period, which indicated variable levels of English proficiency among DLLs in the analytic sample. Among DLL children, 62.7% demonstrated limited English proficiency on one or more preLAS administrations, whereas 16.4% demonstrated limited English proficiency across all three administrations. We retained the full sample of children regardless of language proficiency to maintain the generalizability of the analytic sample to the full program population.
Administrative Data
Acelero Learning collects detailed information on the demographic characteristics of children and families as part of enrollment procedures required by Head Start. Information on time-varying characteristics (e.g., parent employment status) was collected in each year. This study drew on these data to create covariates and key moderators, as described in more detail below.
Measures
Child Outcomes
The same battery of child assessments was collected at each of the five time points. Measures were selected to cover a range of developmental domains. Selection was further guided by the availability of national norms and the widespread use of tools in prior early childhood research, including in prior studies with students in Acelero Learning Head Start (e.g., Barnett & Jung, 2013; Groom-Thomas et al., 2021), allowing for comparability with earlier findings on children’s growth. Each of the assessments (described in detail below) yielded raw and standard scores. For four of the five assessments, raw scores reflect the total number of items children answered correctly. The EF assessment’s raw score was computed differently (as described further below). Across all measures, standard scores represent the child’s performance relative to a national average for same-age children such that a standard score of 100 represents the national average.
To facilitate comparisons across outcomes and to understand how children’s skills grow as compared with their own previous skill levels (rather than against a national standard), for our main analyses, we converted the raw scores for each outcome to z scores using the winter 2022 (T1) mean and standard deviation of that outcome for children in the analytic sample such that z scores reflect outcomes relative to the distribution of scores for children in the sample at T1. Given naturally occurring development, we expected raw scores to grow regardless of participation in early learning programs, so we cannot interpret gains as solely attributable to participation in the program.
As sensitivity analyses, we present analyses using standard scores (see Supplementary Appendix B in the online version of the journal) that allow us to understand how Acelero Learning students’ gains compare with typical growth for a national sample of children in the same age band. We caution, however, that the samples used to develop norms for these measures may not reflect the population of Acelero Learning students and therefore may not reflect typical growth for children with similar demographic profiles. Moreover, gains in standard scores also should not be interpreted as solely attributable to participation in Acelero Learning because other factors—such as family behaviors and availability of developmentally supportive community resources—likely also contribute to gains against norms.
Language
Children’s receptive language skills were assessed using the Peabody Picture Vocabulary Test V (PPVT-V; Dunn, 2018). Each item on the PPVT-V shows children four pictures. Children are then required to select the picture that best represents a word said out loud by the assessor. Items receive a score of 1 if the child identifies the correct image and 0 if not. The PPVT-V is widely used in research with diverse samples of children and demonstrates adequate internal and predictive psychometric properties (Dunn, 2018). The PPVT-V includes a maximum of 240 items (PPVT-V Manual; see Supplementary Appendix A in the online version of the journal), and children begin the assessment at various start points based on their age. Children stop the assessment once they answer six items in a row incorrectly. The PPVT-V is meant to be administered to examinees of all ages, so the maximum score of 240 does not represent a realistic ceiling for preschool-aged children. The range of items administered in our sample was 0–136.
Math
Children’s early numeracy and arithmetic skills were assessed using the Woodcock–Johnson Applied Problems IV (WJAP-IV; Schrank et al., 2014). The WJAP-IV requires children to respond to basic computational and problem-solving questions. Items receive a score of 1 if the child answers correctly and 0 if not. The WJAP-IV is another widely used child assessment measure in early childhood research that demonstrates adequate internal psychometric properties (Schrank et al., 2014). This assessment has a total of 56 items, although preschool-aged children could not attain this maximum score. Children in our sample started the assessment at the first item and stopped the assessment after responding incorrectly to five consecutive items, resulting in our sample having a range of items administered of 0–21.
Literacy
Children’s print knowledge and phonologic awareness were measured using two subtests of the Test of Preschool Early Literacy (TOPEL; Hayward et al., 2013). The 36-item print knowledge (TOPEL-PK) subtest requires children to identify letters and words. Items require children to select the correct picture or text from a set of four when prompted. The 27-item phonologic awareness (TOPEL-PA) subtest captures children’s word elision and blending abilities. Items require children to say a word and then say that word again when dropping certain sounds or to listen to sounds and combine them to form a word. In both subtests, items are scored as 1 if the child answers correctly and 0 if not. Both subtests demonstrate adequate internal reliability (Lonigan et al., 2007).
Executive Functioning
Children’s EF was measured using the tablet-based Minnesota Executive Function Scale (MEFS; Carlson, 2021). Children must sort virtual cards following increasingly complicated sets of rules that are adaptive to children’s abilities. This task engages multiple aspects of children’s EF, including working memory, inhibition, and cognitive flexibility (Perone et al., 2018). The MEFS uses a proprietary algorithm to generate scores that consider both accuracy and response time to calculate a raw score that ranges from 0 to 100. The MEFS has been nationally normed with >50,000 children and demonstrates adequate internal consistency (Carlson, 2021).
Child Characteristics
Using administrative data collected by the program in each academic year, we generated four mutually exclusive race/ethnicity indicators reflecting whether the child was Hispanic, non-Hispanic White, non-Hispanic Black, or non-Hispanic multiracial/other. The indicators took on a value of 1 if the child was a member of that group and 0 if not. We also used administrative records to create indicators for whether the child was a DLL (with a value of 1 indicating a child whose primary language was not English or who communicated with a parent/guardian in a language other than English) and whether the child was female (with 1 indicating that the child identified as female). We gathered information on age from assessment data files.
Family Characteristics
Using administrative data collected by the program in each academic year, we also generated a series of four indicator variables reflecting the child’s Head Start eligibility category. The mutually exclusive indicators reflected whether the child qualified for Head Start because (a) the child experienced homelessness, foster care, or received public assistance in the prior year; (b) the child’s family income was less than or equal to the federal poverty line (FPL); (c) the child’s family income was between 101 and 130% FPL; or (d) the child’s family income was greater than 130% FPL. We also generated an indicator of whether the child was in a single-parent/guardian household. We additionally created indicators to reflect the primary parent/guardian’s highest level of education with the following categories: less than a high school diploma/GED, high school graduate, some college/Associate’s degree, or a 4-year college degree or higher. The final group served as a reference category in analyses. Finally, we created an indicator for whether the primary parent/guardian was currently employed or enrolled in school or a job training program.
Analytic Approach
All analyses were conducted in R, version 4.4.0 (R Core Team, 2024) and relied on the following packages: lme4 (Bates et al., 2015), lmerTest (Kuznetsova et al., 2017), and emmeans (Lenth, 2024).
Research Question (RQ) 1: Observed Gains Between Years 1 and 2
We first descriptively examined average levels and variation (i.e., means and standard deviations) in children’s assessment scores across the five time points to understand observed changes in scores across time.
RQ2: Growth Across Years 1 and 2
We then estimated piecewise growth models for each of the five outcomes (i.e., PPVT-V, WJAP-IV, TOPEL-PA, TOPEL-PK, and MEFS) to evaluate whether growth rates between the five assessment periods were significantly different from zero. As a preliminary step, we examined the unconditional model and resulting intraclass correlations, which indicated that a two-level model with time (level 1) nested within children (level 2) was appropriate for the current data. There was an insufficient number of children per classroom and center to estimate variation at either the classroom or center level. (On average, there were two students per classroom and four students per center in our analytic sample.)
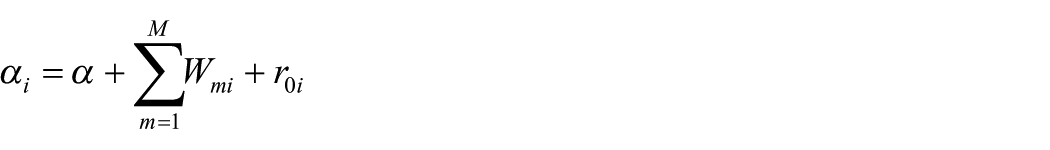
We fit the following two-level random intercept piecewise growth model for outcome Y measured for child i at time t:
Level 1: Time:
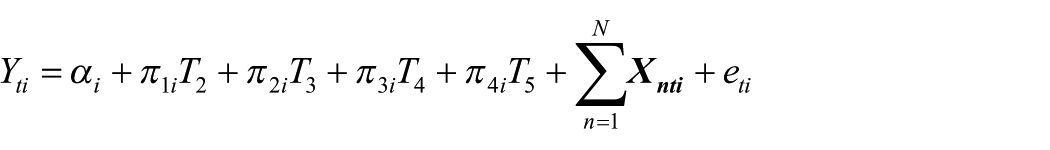
Level 2: Child:


At level 1 (time within children), outcome Y is a function of a series of indicators for the time period (T2–T5), with T1 as the excluded reference period. Level 1 additionally included a vector of time-varying covariates (
RQ3: Moderation by DLL Status and Baseline Skills
To understand whether growth rates between assessment periods differed for key subgroups, we adapted the above-mentioned model to allow growth rates to differ across subgroups. Specifically, we included one of two moderators as a predictor of each of the four slope terms at level 2
Missing Data
As described earlier, analyses were restricted to children who had at least three time points of child assessment data given our aim of understanding growth in children’s skills across time. As noted earlier, not all children in the analytic sample were assessed in all five time points, and within each time point, not all children were assessed with all tools. The dataset used in analyses included 712 child-by-time-point observations, with the number of observations by outcome ranging from 681 (MEFS) to 711 (TOPEL).
There was complete child and family covariate information for all observations except for information on parental employment status in year 2 for one child. To retain this child in the analytic sample, we imputed this child’s values for this variable in year 2 using their value from year 1.
Results
RQ1: Observed Gains Between Years 1 and 2
Table 2 documents the descriptive statistics (mean and standard deviation) for the observed z scores for each outcome at each of the five assessment periods. As described earlier, all scores were standardized relative to the distribution of scores in T1. Therefore, each z scored outcome at T1 has an average level of 0 and a standard deviation of 1, and z scores in subsequent time periods represent the difference in scores between a given time point and T1. For example, in T2—the spring of the pre-K3 year—scores were 0.25 (math) to 0.34 SD (phonologic awareness) higher than in T1. The right-hand column for T5 indicates cumulative average growth across the five time points (from T1 to T5), illustrating that children, on average, grew more than 1 SD in all skills. Children grew most in math skills (1.63 SD) and least in EF skills (1.07 SD) across the 2 years.
Average Child Assessment Scores Across 2 Years of Pre-K
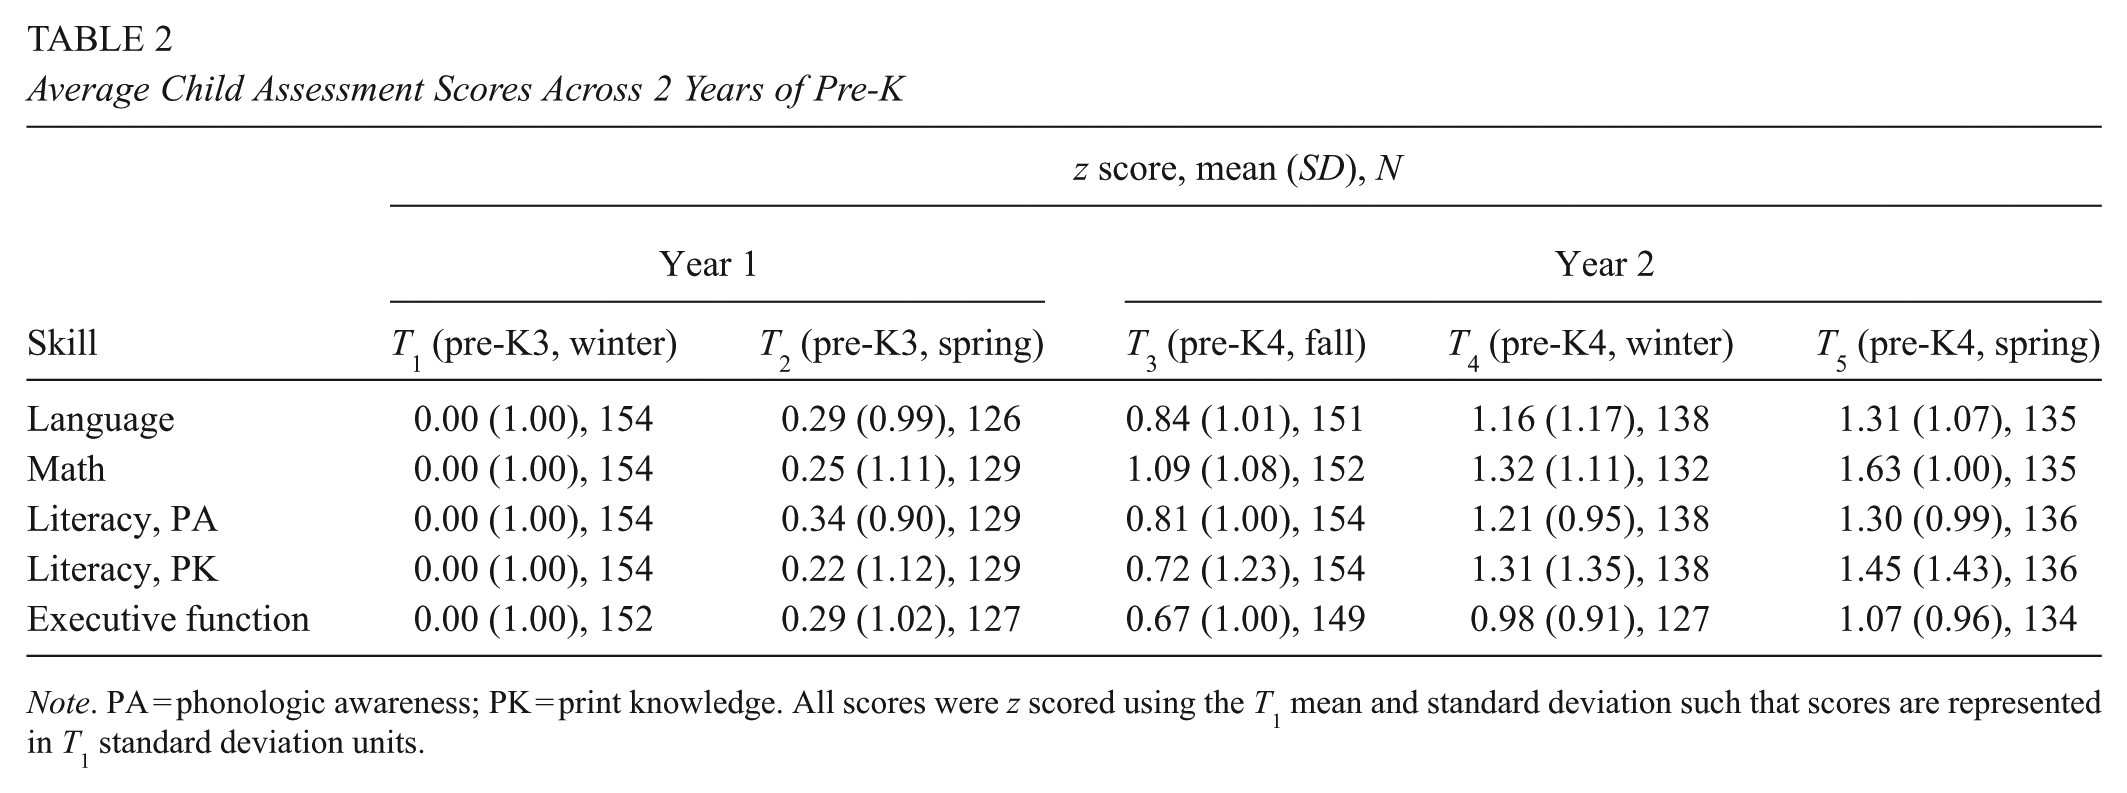
Note. PA = phonologic awareness; PK = print knowledge. All scores were z scored using the T1 mean and standard deviation such that scores are represented in T1 standard deviation units.
Gains in standard scores reflecting children’s progress against national norms for same-age peers paint a similar picture (see Supplementary Table B1 in the online version of the journal). Observed standard score gains between the five time points were greatest in phonologic awareness (9.06 points) and math (7.02 points), whereas the smallest standard score gains were in language (0.26 points) and EF (0.49 points). Phonologic awareness and math standard scores at T1 were the furthest below the national norm of 100 (81.95 and 83.77, respectively), meaning that gains in those scores brought children closer to the national norm over the 2-year period. At T1, average language scores also were below the national norm of 100 (85.64), but small standard score gains indicated that language scores did not advance much toward the norm. Finally, average EF and print knowledge skills at T1 were near the national norm of 100 (96.33 and 93.82, respectively), but gains were small, with average scores staying near the norm over time.
RQ2: Growth Across Years 1 and 2
Figure 1 illustrates predicted developmental trajectories for all five skills using the estimated marginal means from the piecewise growth modeling approach with z scores as outcomes. Asterisks in this figure indicate whether the growth rate in the corresponding time period was significantly different from zero. For example, in the spring of the pre-K3 year (between T1 and T2), we observed statistically significant growth in all outcomes except for print knowledge. Then, over the summer between pre-K3 and pre-K4 (between T2 and T3), children experienced significant growth in all outcomes except for EF. Notably, children experienced rapid growth in math (growth = 0.66 SD, SE = 0.10, p < .001) and print knowledge (growth = 0.34 SD, SE = 0.11, p = .003) during this period.
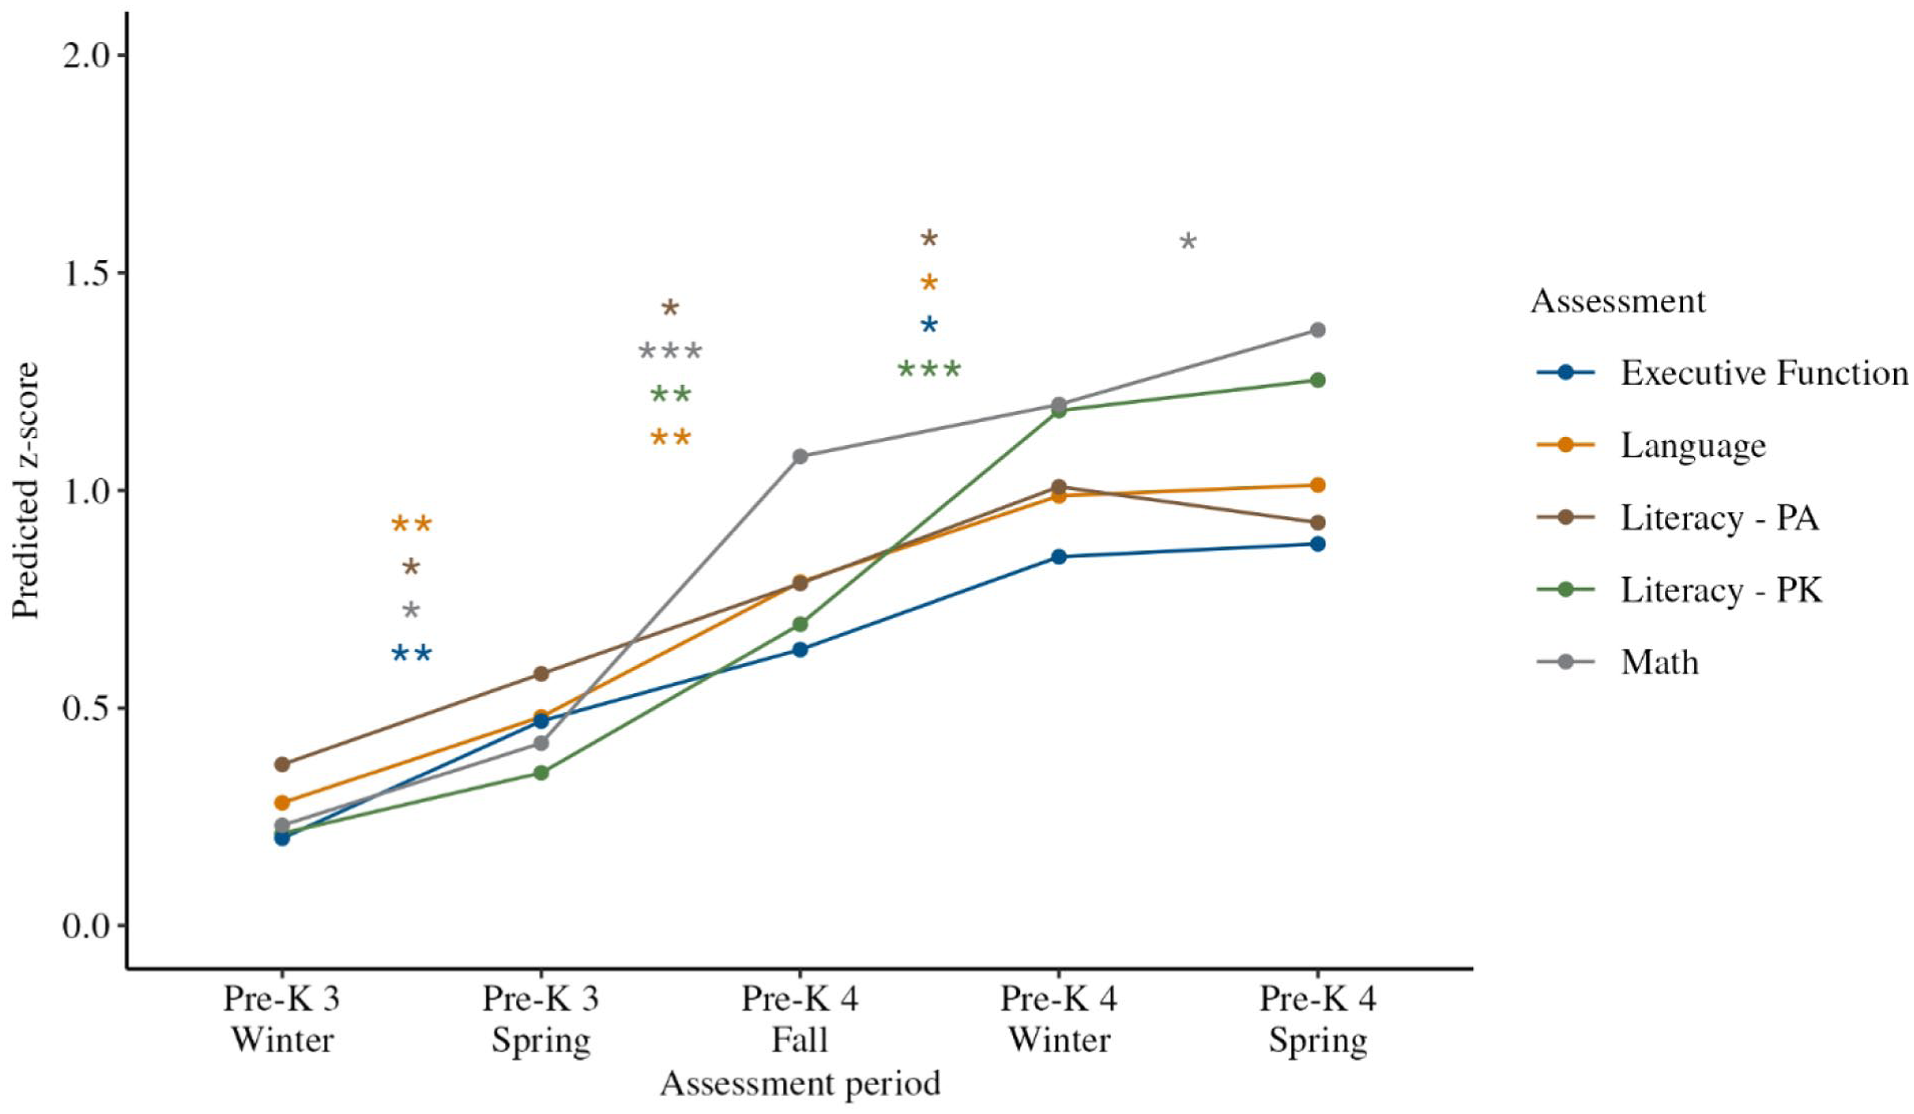
Average predicted growth trajectories across 2 years of Head Start.
In the pre-K4 year (T3 to T5), growth was most pronounced in the fall between T3 and T4. Between T3 and T4, there was statistically significant growth in all outcomes except for math. We continued to see particularly rapid growth in print knowledge in this period (growth = 0.49 SD, SE = 0.10, p < .001). In the spring (between T4 and T5), only growth in math was statistically different from zero (growth = 0.17 SD, SE = 0.08, p = .04).
Supplementary Figure B1 in the online version of the journal presents results of this piecewise growth-modeling approach with standard scores. Zero growth in standard scores indicates that scores did not change relative to the national norm, whereas growth that is statistically different from zero indicates improvements relative to the national norms. As with the z scored results, growth in math standard scores between T2 and T3 was steep and statistically different from zero (growth = 8.61 points, SE = 1.66, p < .001). Growth in print knowledge standard scores was also markedly steep and statistically significant in the subsequent time period between T3 and T4 (growth = 3.37 points, SE = 1.11, p = .003). Finally, there was statistically significant, although only moderate, growth for language and phonologic awareness standard scores between T1 and T2. Growth rates in standard scores across all other time periods were not statistically different from zero.
RQ3: Moderation by DLL Status and Baseline Skills
Figure 2 includes a separate panel for each outcome and charts estimated growth within the full sample for DLLs and non-DLLs. Asterisks in this figure indicate whether the growth rate for a specific subgroup was statistically different from zero; crosses indicate whether the growth rates for DLLs and non-DLLs were statistically different from each other. In general, performance levels for DLLs and non-DLLs were largely the same across all time points, and there were few statistically significant differences in the growth rates of DLLs and non-DLLs. There were, however, two exceptions: First, non-DLL children experienced faster growth in phonologic awareness between the spring of pre-K3 and the fall of pre-K4 (between T2 and T3) than DLL children (∆ growth = 0.35 SD, SE = 0.16, p = .03). Second, DLL children experienced more rapid language growth than non-DLL children in the spring of pre-K4 (between T4 and T5; ∆ growth = 0.27 SD, SE = 0.13, p = .05), although the growth rate for neither group was statistically different from zero.
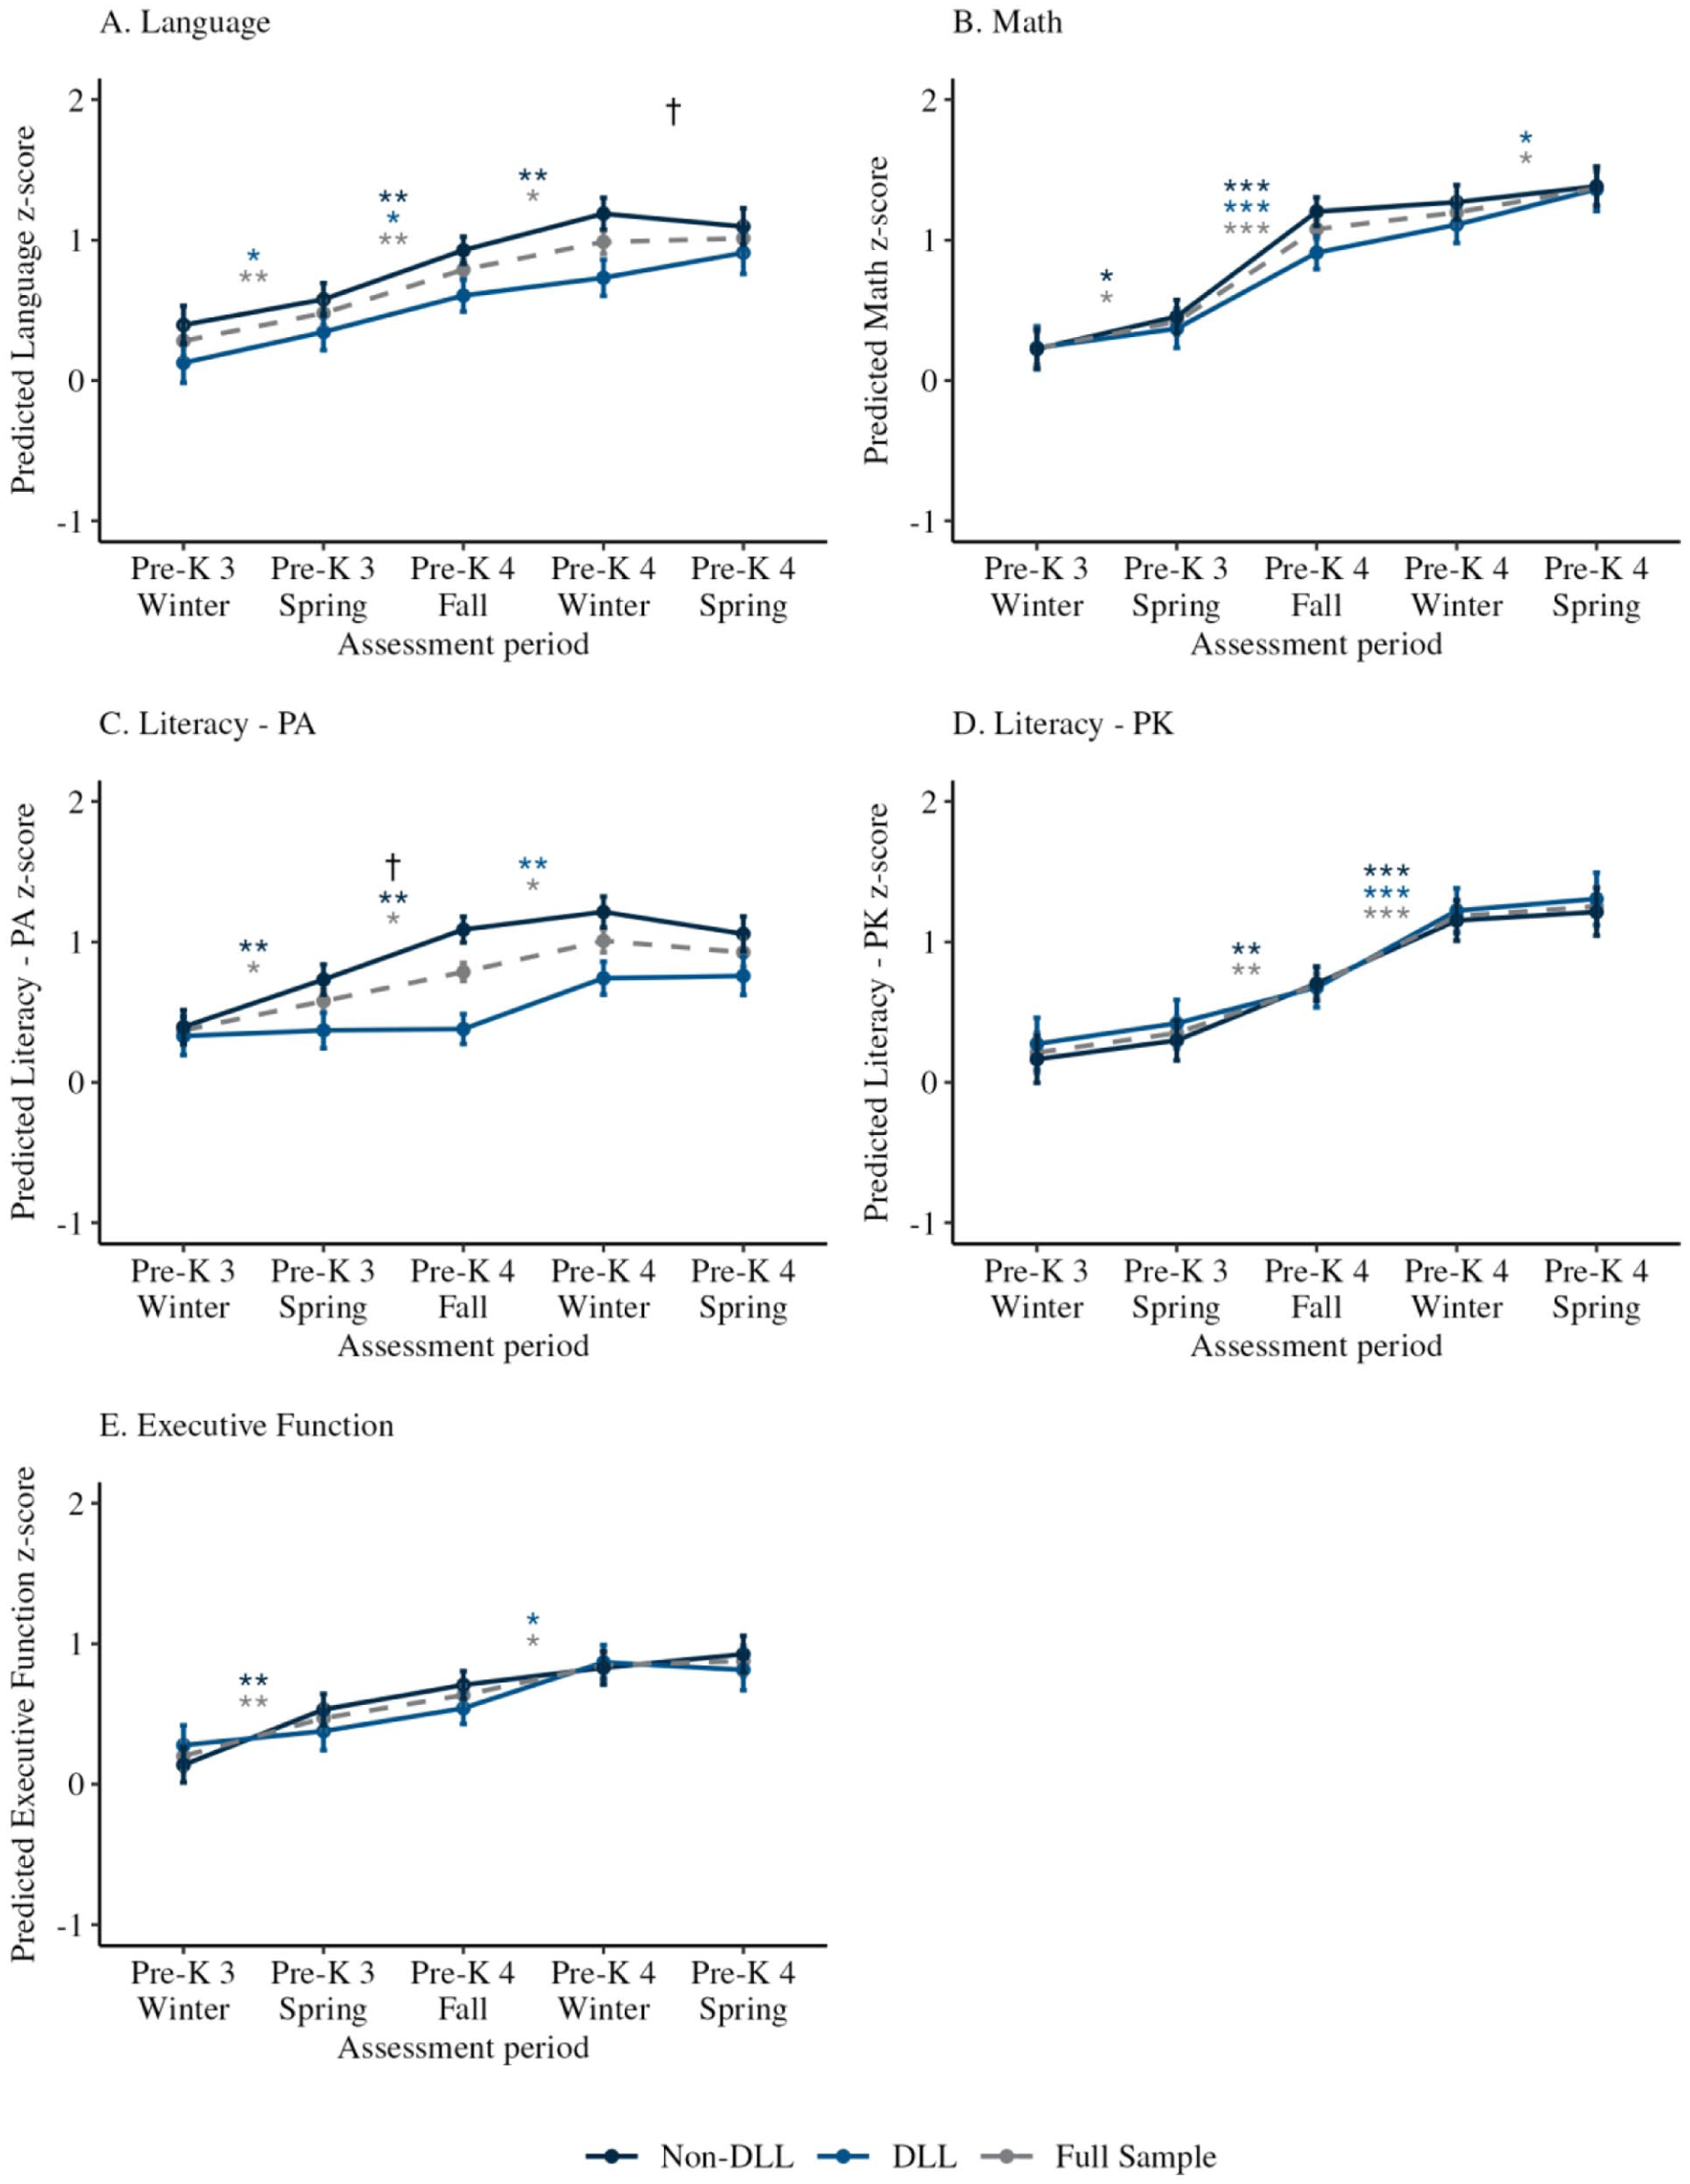
Average growth trajectories for dual language learners and non–dual language learners by outcome.
Results from analyses using standard scores closely align with our z score estimates (see Supplementary Figure B2 in the online version of the journal). The only statistically significant difference in growth rates by DLL status was in phonologic awareness between T2 and T3. Over that time period, DLLs experienced small skill declines and non-DLLs grew significantly against national norms, resulting in DLLs growing significantly slower than their non-DLL counterparts (∆ growth = 5.55 points, SE = 2.75, p = .04). However, as noted earlier, in general, DLLs and non-DLLs scored and grew in tandem, resulting in limited differences in performance over time.
In contrast to the findings by language status, we observed notable differences by baseline skill level (Figure 3), particularly in the pre-K3 year. For four of the five skills (i.e., language, math, EF, and phonologic awareness), growth rates for children with low baseline skills were higher in the spring of the pre-K3 year (between T1 and T2) than for children with high baseline skills. Although growth rates for high scorers were not statistically different from zero for any outcome in this time period, growth rates in language (growth rate = 0.32 SD, SE = 0.13, p < .02), math (growth rate = 0.40 SD, SE = 0.14, p = .004), phonologic awareness (growth rate = 0.70 SD, SE = 0.16, p < .001), and EF (growth rate = 0.86 SD, SE = 0.17, p < .001) were all positive and statistically significant for low scorers. Low scorers also experienced more rapid math growth over the course of the summer between pre-K3 and pre-K4 (T2 and T3) than high scorers (∆ growth = 0.33 SD, SE = 0.14, p = .02), although both low and high scorers experienced growth in this period. There were no statistically significant differences in growth for low and high scorers in the pre-K4 year (either between T3 and T4 or between T4 and T5).
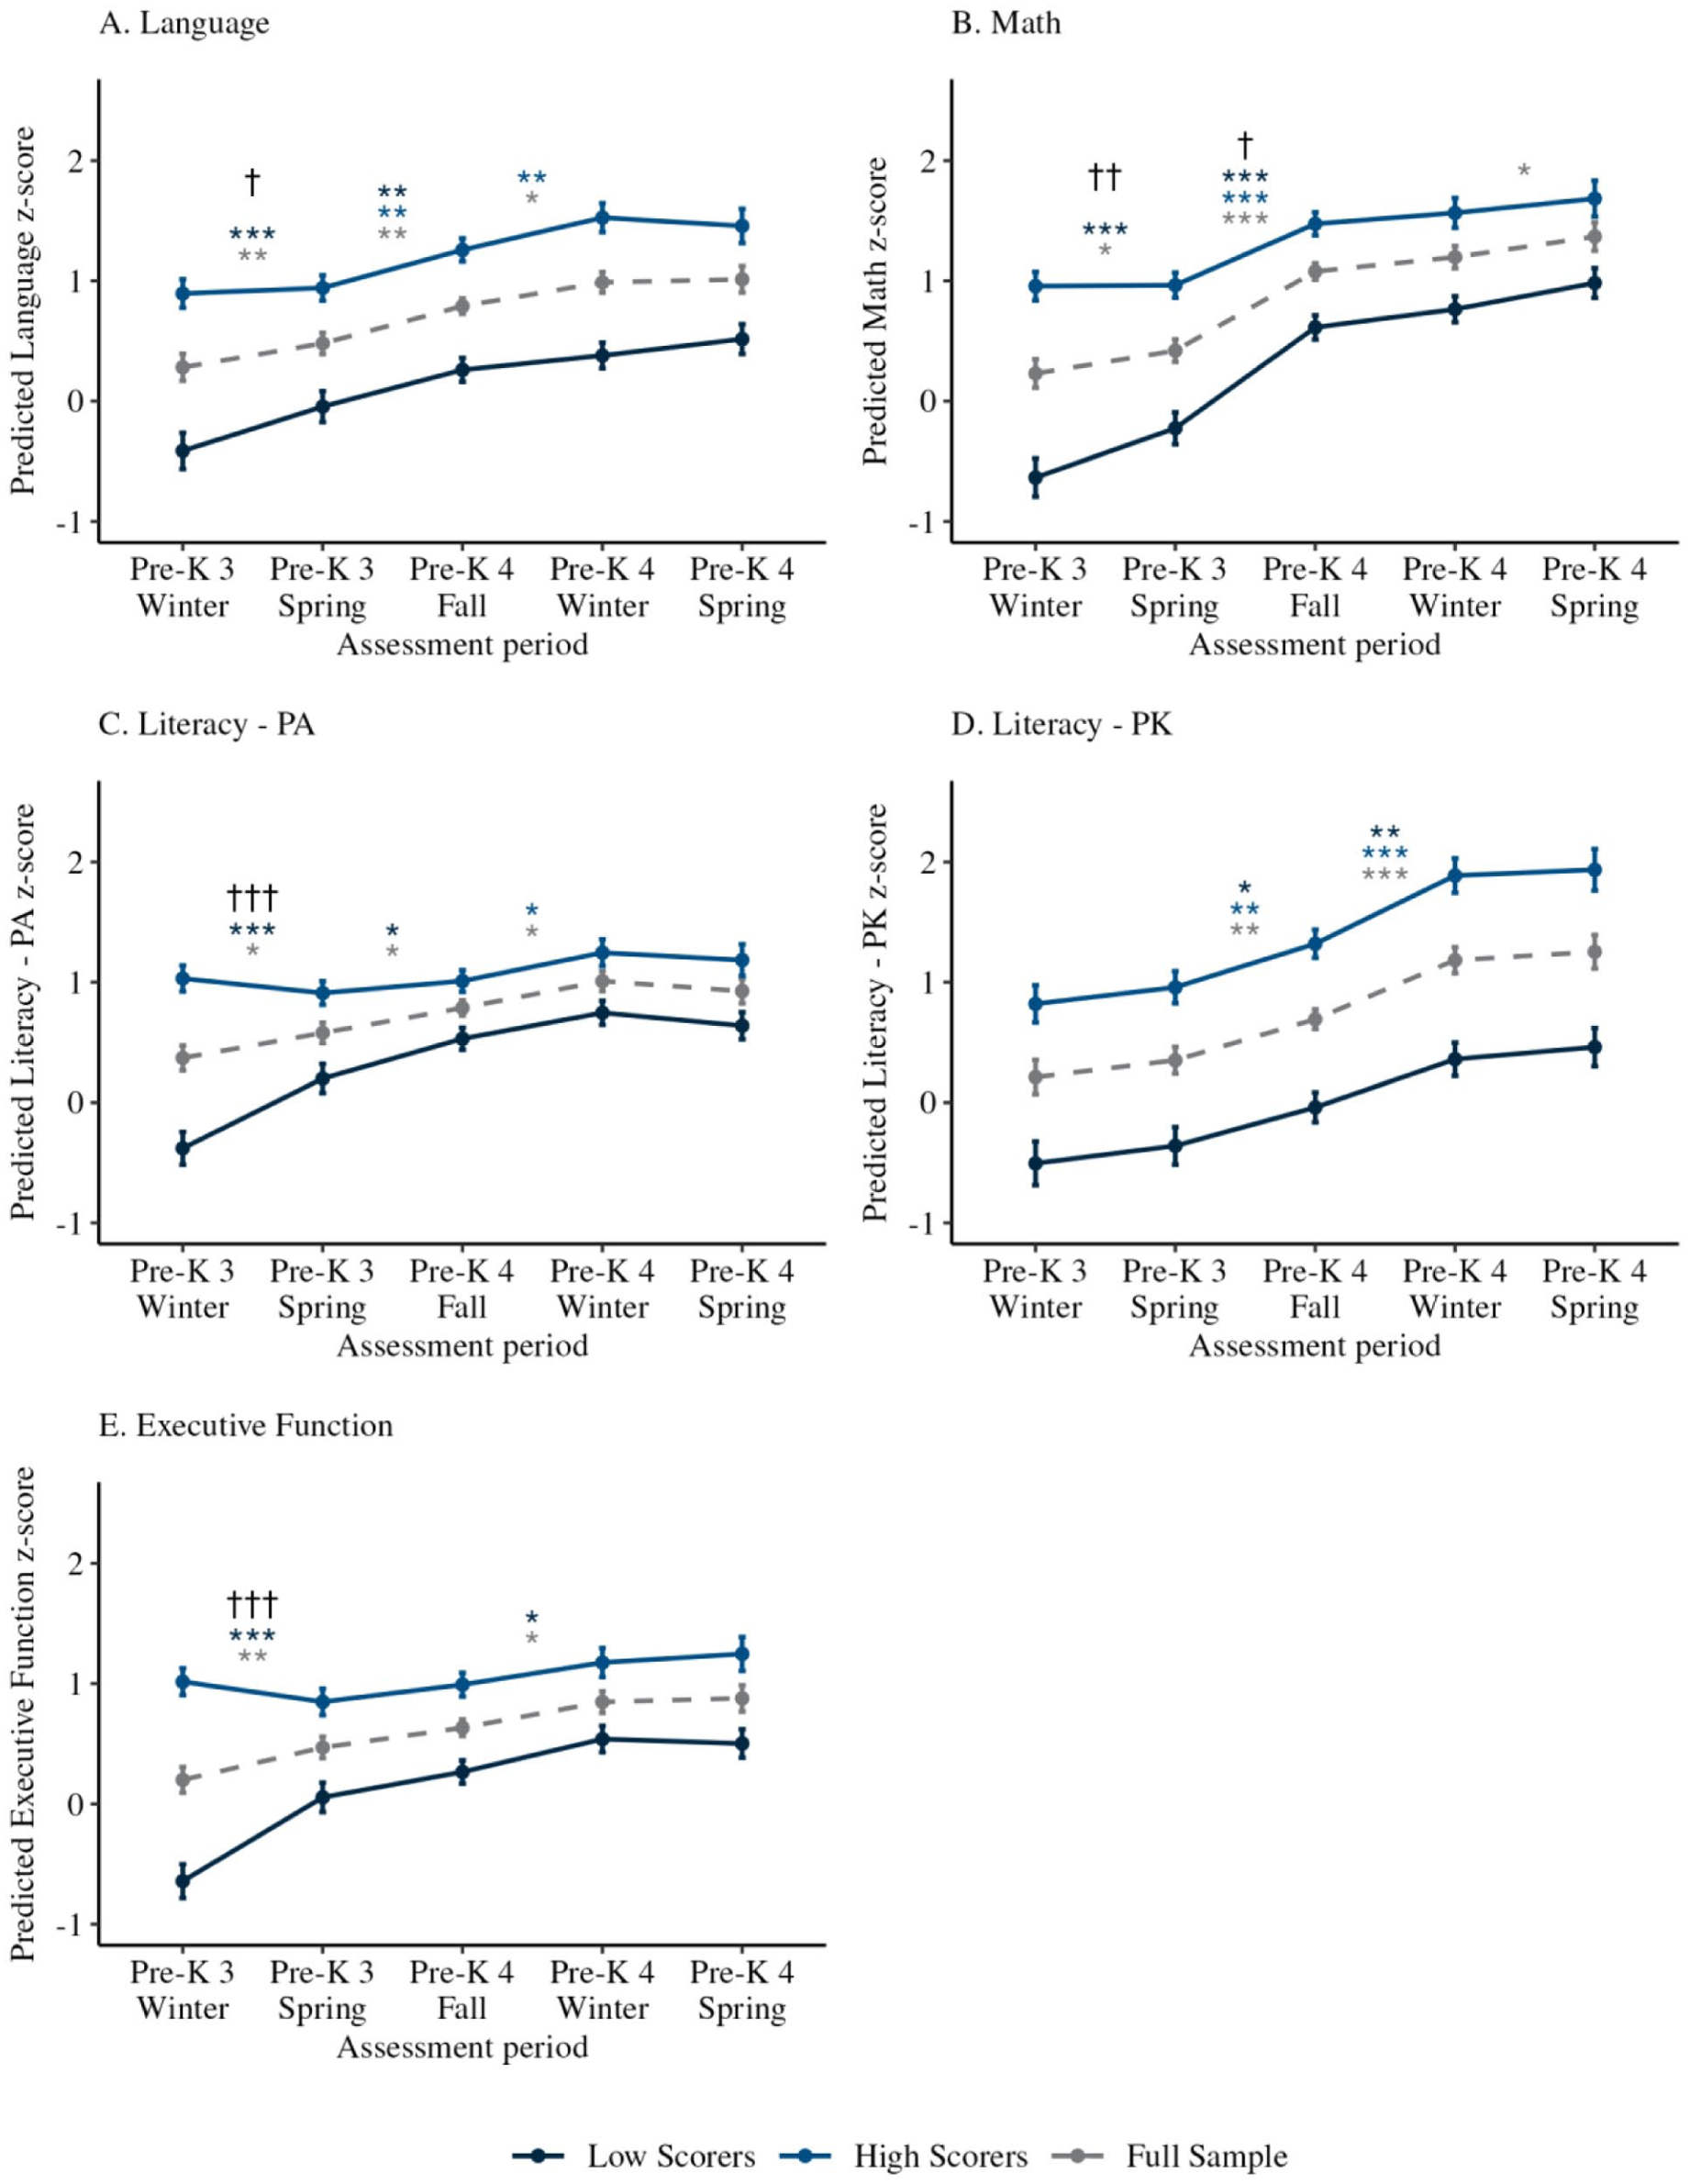
Average growth trajectories for children with high and low baseline skills by outcome.
Although score gaps between low and high baseline scorers persisted across time points and outcomes, we observed continued moderate convergence between score groups for all outcomes except print knowledge. Over the study period, 28.05% of the baseline gap in language scores between low and high scorers was closed. For math, that figure was 55.14%; for phonologic awareness, 61.29%; and for EF, 55.87%. The gap widened by 11.33% in print knowledge. Of the gap closed in language, only 12.58% of the closure occurred after spring of the pre-K3 year. In the same period, 54.94% of the closure in math, 18.99% in phonologic awareness, and 5.40% in EF occurred.
We observed convergence between baseline score groups over a nearly identical set of periods when using standard score outcomes as z score outcomes (see Supplementary Figure B3 in the online version of the journal). In all domains except for print knowledge, low scorers grew by a statistically significant amount relative to national norms, and high scorers declined after spring of the pre-K3 year, resulting in different growth rates between the two groups (although not significantly different in EF). In math and phonologic awareness, low and high scorers had a second consecutive period of significant convergence between the spring of the pre-K3 year and the fall of the pre-K4 year (∆ math growth = 7.22 points, SE = 2.36, p = .002; ∆ phonologic awareness growth = 5.79 points, SE = 2.59, p = .03), both driven by statistically significant gains by low scorers. There were no other periods where low and high scorers grew at significantly different rates, and across outcomes, score gaps remained nearly constant after these two periods of significant convergence.
Discussion
Early childhood is touted as an exciting period of growth across developmental domains (Phillips & Shonkoff, 2000). During this time, young children learn foundational academic content in areas such as math and literacy, expand their ability to verbally communicate, and build core regulatory skills. Increasingly, young children spend this critical time outside the home in group-based early learning settings intended to foster their healthy development (Jones et al., 2020). A robust body of evidence has shown that these types of programs can raise children’s skills before they enter kindergarten (Phillips et al., 2017). However, little research has shed light on when during children’s early learning experiences their skills grow most rapidly and whether those growth patterns differ across skill type or subgroups of children.
Drawing on data collected at five time points during children’s enrollment as 3- and 4-year-olds in a national Head Start program, this descriptive paper extends our broad understanding of the extent and timing of children’s early learning across five areas. This work builds on research examining children’s learning in the preschool years by looking across a longer time horizon, adopting a more comprehensive approach to skill measurement, and considering differential growth patterns across key subgroups. We found that development was not uniform across skill type, time, or groups of children, underscoring the importance of diving deeper into children’s learning during this period to inform programmatic decisions to effectively nurture positive outcomes across time and among all learners.
Variation in Overall Gains by Skill Type
Observed gains between winter of the pre-K3 year and spring of the pre-K4 year indicated that the magnitudes of overall growth varied across skills. Children experienced the greatest overall gains in math (1.63 SD), which also translated into sizable gains against the national norm in this domain as well. In our sample, children advanced an average of 7.02 standard score points across the 2 school years in math. A potential explanation for this math growth is that the program provided children with opportunities to engage with math content that they otherwise would not have had. Families, regardless of household income or race/ethnicity, typically reported spending less time working with their children on math skills at home compared with skills in other areas such as language and literacy (McCormick et al., 2020b). Moreover, even if families engaged with math content at home, families often emphasized certain types of quantitative, numerical skills such as counting with their young children as opposed to a broader set of math skills such as problem solving, spatial reasoning, and geometry (Caspe, 2023; Galindo et al., 2019). In contrast, Acelero Learning’s curriculum takes a comprehensive approach to developing early math skills in line with the Head Start Early Learning Outcomes Framework. Engagement in the program also may have consequences for children’s exposure to math outside the home because Acelero Learning’s home-learning curriculum similarly outlines activities that families can do to promote diverse math skills.
Importantly, however, observed average math gains were perhaps not as large as we might have expected when noting the 5.12 standard score point gain on the same measure of math skills by Acelero Learning students in a single academic year nearly a decade earlier (Barnett & Jung, 2013). This may be explained in part by the fact that data for this study were collected in the immediate aftermath of the COVID-19 pandemic in the 2021–22 and 2022–23 school years. In line with programs nationwide, Acelero Learning shut its centers at the start of the pandemic in the spring of 2020 and then offered families either in-person or home-based virtual instruction in the 2020–21 school year (Groom-Thomas et al., 2021). Although all Acelero Learning students returned to in-person learning in the fall of 2021 (the first year of this study), there continued to be ongoing disruptions to learning, including sporadic closures due to illness outbreaks and related staffing shortages. Challenges with teacher turnover were not acute in Acelero Learning, because educators reported on a spring 2022 survey that they had worked in their current position for an average of >5 years and had an average of 13 years of teaching experience. However, these ongoing pandemic-related interruptions likely meant that children received less formal instruction, including in areas such as math before and during the study period than did students in previous years. Beyond likely effects of closures on the quantity of math instruction, the instability and stress brought by the pandemic also may have affected other unmeasured dimensions of children’s development and early learning experiences with downstream consequences for math learning (Benton et al., 2022; Hanno et al., 2022; Watts & Pattnaik, 2023).
In contrast to the sizable absolute and relative gains in math, children made the smallest gains in EF. The average standard score gain we observed (0.49 points) also was smaller than that observed among Acelero Learning students between the fall and spring of the 2020–21 school year (2.13 points; Groom-Thomas et al., 2021). One hypothesis to explain this limited growth is that educators are less likely to directly teach or use strategies that foster EF skills than they are for traditional early academic skills (Moreno et al., 2017; Willis et al., 2014). Despite this current reality, pre-K educators have a unique opportunity to curate opportunities for children to practice EF in safe and scaffolded ways, such as by playing memory games or asking children to follow progressively more complex multistep directions (Barnes et al., 2021). Alternatively, it is possible that educators scaffolded children’s self-regulation more broadly (e.g., laying out consistent routines or offering cues to inhibit behavioral impulses), the consequences of which were unlikely to show up in the direct-assessment measure of EF used in this paper, which captures children’s specific ability to sort cards through an emotionally neutral, tablet-based game. Instead, we might expect these practices to show up in children’s ability to control their emotions and behaviors in the classroom. It is also worth noting that average initial standard scores in EF were on par with national norms for same-age peers (whereas average math skills began nearly 20 points below the norm). This may have meant that students had less room to grow in this domain compared with other domains.
Differences in When Skill Growth Occurs During Pre-K
In addition to variation in gains across skills, we observed considerable differences in growth rates across time periods. Gains were most pronounced during the first three time periods (spring of the pre-K3 year, summer between the pre-K3 and pre-K4 years, and fall of the pre-K4 year), whereas there was little growth in skills during the spring of the pre-K4 year. These descriptive patterns likely reflect the combined influence of multiple instructional and broader contextual factors operating within each period, which could not be fully disentangled in our analyses. Below we discuss several potential hypotheses that may help explain these broad patterns in the timing of growth.
Our finding of limited growth in the spring of the pre-K4 year may relate to variation in individual children’s learning experiences in preschool classrooms over time. A growing body of research has shown that classroom quality is not static across the year (Buell et al., 2016; Meyer et al., 2011) and that this variation may relate to children’s outcomes (Gonzalez et al., 2024). Peer age composition may be one factor underlying differences in children’s learning experiences and instructional quality that may be particularly salient for children’s experiences in the pre-K4 year. Mixed-age pre-K classrooms comprising 3- and 4-year-olds are a common model in Head Start programs, including in Acelero Learning. Most of the students in the analytic sample were in mixed-age classrooms in both years 1 and 2. Analyses drawing on nationally representative Head Start data demonstrate that 4-year-olds tend to have lower academic gains in classrooms with younger peers (Ansari & Purtell, 2018; Ansari et al., 2016). Although more research is needed to understand the mechanisms behind this trend (Purtell & Ansari, 2018), it is possible that 4-year-old children with younger-age classmates do not have extensive opportunities for peer interactions or instructional activities that push and challenge their skills. In a classroom with younger students, educators may feel that they need to focus on reinforcing basic routines and concepts (such as position words and letter recognition) rather than introducing and extending the knowledge of their most advanced students. Evidence from kindergarten classrooms confirms this pattern, showing that teachers tend to focus math instruction on basic skills, benefiting only children who have yet to master those skills (Engel et al., 2013). Relatedly, it is possible that teachers need additional support to extend materials in the program’s curriculum for advanced 4-year-olds, particularly in the context of mixed-age classrooms with a range of needs. Future work should consider the instructional realities of mixed-age classrooms, addressing the strategies that support sustained growth regardless of peer composition.
Most surprising were the significant gains in children’s skills in the summer between the pre-K3 and pre-K4 school years, with particularly fast growth in math. This finding stands in contrast to the well-documented “summer slide” phenomenon, particularly for children from lower-income backgrounds such as those that Head Start programs tend to serve (McCormick et al., 2021). This difference in findings may be attributable to the fact that most Acelero Learning centers close only for a few weeks or remain open year round. In line with the findings of McCormick et al. (2021), we might expect that this continuity in early learning experiences would have allowed for sustained growth (or smaller summer deceleration), although not necessarily acceleration. In general, our findings of differential growth across skills over time underscore the need for more detailed longitudinal data collection that can shed light on how early learning experiences and exposure to content across domains shift over time and how those shifts relate to changes in children’s skills.
Baseline Skills but Not Language Status Associated with Growth-Rate Differences
Another surprising finding was that growth patterns were largely consistent between DLLs and non-DLLs. Based on the literature indicating that DLLs tend to benefit most from early learning programs (Puma et al., 2005; Weiland & Yoshikawa, 2013), we had expected that DLLs might grow faster than non-DLLs. The absence of differences could be attributable to features of Acelero Learning environments that equally supported children regardless of their primary language. Alternatively, it is possible that features of the assessments themselves explain the absence of differences. Specifically, all children were evaluated in English. Children’s knowledge and skills are thought to be distributed across the languages they speak (Hanno & Surrain, 2019), implying that an English-only assessment approach may underestimate the true abilities of DLLs. We may have observed other growth patterns if a different measurement approach were adopted that captured children’s skills across languages.
In contrast to our findings with DLLs, we found evidence in support of the compensatory hypothesis based on baseline skills. That is, children with lower baseline skills tended to grow more rapidly than children with higher baseline skills, resulting in partial convergence in skill levels across children who began Acelero Learning with relatively lower and higher scores. This finding is consistent with other studies that have shown that children with the “most room to grow” tend to experience the largest skill gains during pre-K (Lipsey et al., 2018; Puma et al., 2010). At the same time, this finding means that growth was slower among children who began Acelero Learning with stronger skills. In some skill areas, such as print knowledge and EF, this meant that these children’s skills stayed on par with age-level norms, but in other skill areas such as language, math, and phonologic awareness, higher achievers’ scores stayed below age-level norms. In line with the previously discussed challenges of sustaining growth in the spring of the pre-K4 year, this finding underscores the importance of finding solutions—such as differentiated instruction—to ensure that all children have learning experiences that continue to push their skills.
Despite the strengths of this study (e.g., a multistate sample, comprehensive coverage of developmental domains, and five time points), there are several limitations of this work that should inform future work in this area. First, this study is observational and therefore cannot disentangle growth attributable to pre-K from other factors. This underscores the need for future experimental studies of pre-K programs with robust data-collection approaches that allow for understanding how programs might affect development over time during the preschool years as opposed to focusing solely on impacts on outcomes after pre-K and through later years. Second, although this study’s sample included children from four states and generally was reflective of the broader Acelero Learning student population, it was nonetheless a small sample not reflective of the full diversity of children and program types in public pre-K programs today. Third, this study’s comprehensive approach to child assessment could be further supplemented by using assessments that capture additional dimensions of development (e.g., emotional and behavioral self-regulation) and that more holistically capture the skills of DLLs. Specifically, future work could benefit from using measures that evaluate children’s skills across the languages they speak. Finally, given the sample size, subgroup analyses in this study rely on broad comparisons between binary groups. Future research could adopt a more nuanced perspective on these characteristics by, for example, exploring growth in relation to children’s linguistic profiles (e.g., home language use and language exposure).
Conclusion
Taken together, the findings of this study underscore that children’s learning during the pre-K years is complex and nonlinear, occurring at different times for different skills and different children. Children grew most in the skills they were least likely to be exposed to at home (i.e., math) and in their first year of the program. For researchers, this work drives home the importance of collecting rich longitudinal data on children’s skills and using those data with methodologic approaches such as piecewise growth modeling that mirror the complexity of development. This work also has implications for education leaders tasked with expanding and improving pre-K programs. Programs must explicitly target children’s skills across domains, ensure consistency in classroom experiences over time, and provide all children with the individualized support they need to flourish. There is a particular need, as pre-K programs nationwide consider a shift toward a multiyear approach, to understand how to continue fostering the development of children after the first year of the program in the context of classrooms with children who arrive with diverse skill abilities and variable prior early education experiences.
Supplemental Material
sj-docx-1-ero-10.1177_23328584261457101 – Supplemental material for Unpacking Students’ Language, Literacy, Math, and Executive Functioning Growth Across 2 Years of Prekindergarten
Supplemental material, sj-docx-1-ero-10.1177_23328584261457101 for Unpacking Students’ Language, Literacy, Math, and Executive Functioning Growth Across 2 Years of Prekindergarten by Emily C. Hanno, Emily Swinth, Samantha Xia and Meghan P. McCormick in AERA Open
Footnotes
Acknowledgements
We are grateful to collaborators at Acelero Learning, Inc., including Lydia Carlis and Victoria Chavez, for their support of this work. We also thank Marie-Andrée Somers for her thoughtful comments on this manuscript.
Declaration of Conflicting Interests
The authors declared no potential conflicts of interest with respect to the research, authorship, and/or publication of this article.
Funding
The authors disclosed receipt of the following financial support for the research, authorship, and/or publication of this article: Research activities and preparation of this manuscript were funded by Acelero Learning, Inc. The findings and conclusions in this report do not necessarily represent the official positions or policies of the funders.
Authors
EMILY C. HANNO is a senior research associate at MDRC. Her research focuses on understanding how early education and care programs and policies support children, families, and communities.
EMILY SWINTH is a technical research assistant at MDRC. She supports a wide variety of projects focused on family well-being and child development.
SAMANTHA XIA is currently data governance manager at the University of Missouri and was previously a technical research associate at MDRC. At MDRC, she managed complex data projects in the organization’s family well-being and child-development area.
MEGHAN P. MCCORMICK is currently the senior research and impact officer at the Overdeck Family Foundation and was previously a senior research associate at MDRC. Her research has focused on examining the roles of the home, school, and neighborhood contexts for children’s development.
References
Supplementary Material
Please find the following supplemental material available below.
For Open Access articles published under a Creative Commons License, all supplemental material carries the same license as the article it is associated with.
For non-Open Access articles published, all supplemental material carries a non-exclusive license, and permission requests for re-use of supplemental material or any part of supplemental material shall be sent directly to the copyright owner as specified in the copyright notice associated with the article.