
Abstract
This article provides empirical evidence on the zero-leverage phenomenon for a sample of European listed firms for the period 1995–2016. It is shown that there are two types of firms with zero leverage: the financially constrained firms that face obstacles in obtaining external finance, as predicted by the financial constraints hypothesis; and the financially unconstrained firms that maintain zero leverage as a consequence of a financing decision, which supports the financial flexibility hypothesis. The zero-leverage phenomenon is also influenced by the financial system that prevails in each country, being boosted (inhibited) in market-based (bank-based) financial systems, and by the country’s macroeconomic conditions, with the recent financial and sovereign debt crises increasing the propensity for zero leverage in market-based countries. We also find that the financial flexibility hypothesis seems to be more important in market-based systems and that the financial constraints approach did not gain importance during the crisis period. Our results are robust to the use of alternative measures of debt conservatism, explanatory variables, and econometric methods and maintain their validity when we allow for endogeneity in firm size and dividend payments.
Introduction
A recent line of research in corporate finance investigates the phenomenon that has become known as “mysterious zero leverage,” after the contemporary studies of Strebulaev and Yang (2013), which found that an important and increasing proportion of firms had been presenting no debt over the years, and Devos et al. (2012), which showed that zero leverage is a persistent phenomenon. 1 Also intriguing is the fact that the existence of debt-free firms seems to be a global phenomenon, being present all over the world (Bessler et al., 2013) and including both large, listed firms (Strebulaev & Yang, 2013) and small, unlisted firms (Ramalho & Silva, 2009). Moreover, the zero-leverage phenomenon is not confined to the lack of long-term debt, but also refers to zero short-term debt (Strebulaev & Yang, 2013). Firms such as Apple, Amazon, and Yahoo are examples of organizations that in a given period have adopted extremely conservative levels of debt, even reaching an unexpected zero-leverage level. 2
The complexity of the zero-leverage phenomenon increases inasmuch as the classical theories of capital structure, namely, the trade-off, pecking-order, and agency theories, are not able to explain such conservative levels of debt. The lack of theoretical support has led academics to present alternative approaches to explain zero leverage, such as the financial constraints theory, where zero leverage emerges as an imposition of creditors, and the financial flexibility hypothesis, which states that firms avoid using debt in order to retain financial flexibility. Nevertheless, despite the considerable advances made during the last decade, it is still not clear which are the theoretical approaches that best explain the zero-leverage phenomenon, as recently stressed by Saona et al. (2020).
A drawback of existing studies on zero-leverage firms is their focus on countries with market-based financial systems, especially the United States, which favors financing through the capital market rather than through bank debt (La Porta et al., 1997). Although studies considering other countries and financial systems do exist (Bessler et al., 2013; Ghoul et al., 2018; Saona et al., 2020), their results are likely to have been strongly influenced by the considerable number of debt-free US firms present in their samples. A more balanced context to study zero leverage is provided by European countries. Indeed, Europe is the home of the largest banking system of the world, with non-financial firms being very dependent on bank loans as the primary source of external finance (European Investment Bank, 2015), but at the same time includes a relevant proportion of firms operating in countries with market-based financial systems. Therefore, the European context seems to be the ideal for studying not only the general effect of the financial system on the zero-leverage phenomenon, as Ghoul et al. (2018) did using a sample that included some European countries, but also to test whether the relative importance of the financial constraints and financial flexibility hypotheses to explain zero-leverage decisions varies across countries with different financial systems.
Another issue that has not been fully analyzed is the impact of the financial crisis initiated in 2008 on zero leverage. In various countries, this crisis has been related to the sovereign debt crises that until very recently prevented the normal economic growth, the availability of finance and the recovery of investment levels, particularly in Western European countries (Dolz et al., 2019; European Investment Bank, 2015). Although the reduction in credit demand and supply is expected to have favored the zero-leverage phenomenon, the economic crisis, by reducing the internal resources generated by firms, may have forced former zero-leverage firms to resort to debt after 2008 (Ramalho et al., 2018). To the best of our knowledge, only Morais et al. (2020) analyzed the effect of the 2008 global crisis on the existence of zero-debt firms. However, several questions remain to be answered, such as whether that effect was similar across countries with different financial systems or whether the financial constraints hypothesis gained relevance during the crisis.
In an attempt to fill the previously identified gaps, this study focuses on the following research questions: (1) Does zero leverage in the European context result mainly from financial constraints experienced by firms or from the desire of maintaining financial flexibility?; (2) Is the increasing phenomenon of zero leverage observable in all European countries, irrespective of their financial systems?; (3) Has the recent financial crises increased the phenomenon of zero leverage in Europe? and (4) Are the answers to questions 1–3 independent or inter-related? To answer these questions, we use an unbalanced panel of 8,676 listed firms from 14 European countries for the 1995–2016 period. The sample, which was collected from the DataStream database, includes information that allows the construction of a set of proxy variables representing the financial constraints and financial flexibility approaches in order to examine whether zero leverage can be explained by both theories. It also comprises a relatively balanced number of firm-year observations between countries with market- and bank-based financial systems and covers the whole period of the most recent banking crises and sovereign debt crises in Europe, which, for some countries, according to Laeven and Valencia (2018), went until 2012.
This article contributes in several ways to the literature. Confirming previous evidence (Bessler et al., 2013; Morais et al., 2020), our results show that also at the European level there are two types of zero-leverage firms: financially constrained firms that are unable to get any funding; and financially unconstrained firms, which maintain zero leverage by choice. Also, similarly to Ghoul et al. (2018), we confirm that the financial system prevailing in the country, as well as the level of stock market development, are important determinants of zero leverage, with firms in countries with market-based systems being more prone to be unlevered. In addition, we show that the recent finding by Morais et al. (2020) that the European financial and sovereign debt crises increased the propensity for zero leverage, actually is only valid for market-based countries, since no significant changes occurred in bank-based countries. Another novel result uncovered by our study is the fact that the relevance of the financial flexibility hypothesis is higher in market-based systems and that, contrary to what could be expected, the financial constraints approach did not gain importance with the 2008 crisis. Finally, we show that our conclusions are robust to the use of alternative measures of debt conservatism, explanatory variables and econometric methods, including instrumental variable models that allow for endogeneity in firm size and dividend payments. A preliminary propensity score matching analysis also provides similar results. Overall, our results show that (at least some of) the conflicting results found in previous studies may be due to the incorrect assumption they made of a unique, homogeneous effect of each determinant of zero leverage across different realities.
The remainder of the article is organized as follows. Section “Literature review and research hypotheses” briefly reviews theoretical explanations of the zero-leverage phenomenon and formulates some empirical hypotheses. Section “Data and methodology” describes the data and the methodology used in the empirical analysis. Section “Empirical results” presents and discusses the results obtained by both univariate and multivariate data analyses. Finally, section “Conclusion” contains some final considerations.
Literature review and research hypotheses
Studies on the “zero-leverage phenomenon” need to resort to explanatory approaches alternative to the main financial theories. This article focuses on two firm-level arguments (financial constraints and financial flexibility) and on two macroeconomic factors (financial system and the global financial crisis), and on their interaction, as possible explanations for zero leverage. Next, we review the main theoretical arguments underlying each class of zero-leverage determinants and formulate a set of empirical hypotheses that will be tested in section “Empirical results.”
Internal determinants of the zero-leverage phenomenon: the financial constraints and the financial flexibility approaches
The financial constraints approach is the hypothesis most widely accepted by researchers as an explanation of the zero-leverage phenomenon. According to this theory, in the presence of capital market imperfections, capital structure is not only determined by the need for capital (i.e., the demand side), but mainly by the possibility of obtaining external finance (i.e., the supply side). Therefore, decisions about debt are not taken only by firms, but also by creditors that may be willing to grant or not debt to them. In this context, the zero-leverage phenomenon is more an imposition of creditors due to financial market imperfections than the firm’s own financing decision.
Stiglitz and Weiss (1981) developed a theoretical model which shows that, in the presence of market frictions such as information asymmetries, debt can become too expensive. This prevents firms from funding projects with a positive net present value (NPV) through external finance, which may force firms to forego good investment opportunities (Almeida & Campello, 2007). Indeed, financially constrained firms face restrictions in accessing credit, because lenders are not able to assess the quality of their future investments due to information asymmetries (Stiglitz & Weiss, 1981). Furthermore, Diamond (1991) states that in the presence of adverse selection and moral hazard problems external finance becomes more difficult for firms with little reputation, that is, firms without a favorable past in the credit market.
In terms of empirical research, Bessler et al. (2013) and Devos et al. (2012) find strong evidence that zero-leverage firms are financially constrained. The authors also conclude that such firms are smaller, present a lower asset tangibility and have not yet acquired a favorable reputation in the debt market. More recently, Huang et al. (2017) show that firms that face financial constraints more frequently are more likely to present zero leverage.
Based on the theoretical arguments and empirical evidence described, we test the following hypothesis:
Regarding the financial flexibility hypothesis, this approach suggests that firms avoid debt because of their financing decisions and not of their inability to obtain external finance. The literature relates financial flexibility to the firm’s capacity to fund future investments, even in the presence of information asymmetries (Ferrando et al., 2017; Gamba & Triantis, 2008). It is considered that the capacity to timely react to unexpected changes in the firm’s activity is improved by its financial flexibility (Denis, 2011). Recognizing the interdependence over time between the firm’s financing and investment decisions is the starting point for enhancing the importance of financial flexibility.
Survey evidence points out that financial managers consider financial flexibility as a determinant factor of firm’s capital structure decisions, indicating that they voluntarily limit credit lines to maintain firm’s debt capacity to turn to credit in the future (Brounen et al., 2006; Campello et al., 2010). Recognizing that financial flexibility allows firms to mitigate both financial distress costs and the underinvestment problem in situations of restricted access to external finance (Rapp et al., 2014), firms have an incentive to present high levels of cash holdings as well as to preserve their borrowing capacity (de Jong et al., 2012). Internal liquidity is then a determinant factor of financial flexibility (Ferrando et al., 2017). However, Marchica and Mura (2010) conclude that firms with low levels of debt try to maintain their financial flexibility through a low level of investment and turning to debt only when good investment opportunities arise.
Empirically, Bessler et al. (2013) present evidence that some debt-free firms deliberately adopt a debt conservatism policy. They conclude that such firms are typically more profitable and have a greater level of cash holdings than leveraged firms. Dang (2013) states that firms with greater levels of growth opportunities and liquidity are more likely to avoid debt, this being explained by the search for financial flexibility. He concludes also that the strategic decision to hold zero leverage prevails essentially in firms without financial constraints. Finally, Huang et al. (2017) show that firms with a greater level of financial flexibility are, in fact, more likely to have zero leverage.
Considering these arguments, we formulate the following hypothesis:
External determinants of the zero-leverage phenomenon: the financial system and the 2008 global financial crisis
Previous research suggests that decisions regarding capital structure are affected not only by firms’ specific factors but also by their country’s specific characteristics. For example, Ghoul et al. (2018) report that zero leverage is more prominent in developed and high-income countries. In the case of Europe, analyzing the phenomenon of extreme financial conservatism implies to highlight the importance of the banking sector. In recent decades, the European banking sector has shown strong development, presenting much stronger growth than that registered in other banking systems across the world (Langfield & Pagano, 2016). In the recent study by Takami (2016), it is argued that the reduced level of debt-free firms in Japan may be explained by the bank-based financial system that prevails in the country. Actually, although Japan is a country known for its highly developed banking system, such system has even a greater weight in Europe (Langfield & Pagano, 2016). Such a high preponderance of the bank-based financial system is reflected in the European firms’ great dependence on funding from banks (Fernández-Méndez and González, 2019; Langfield & Pagano, 2016). Indeed, European non-financial firms are more dependent on bank loans as the first source of external finance than firms in the US and Japan (European Investment Bank, 2015).
However, market-based financial systems are characterized by a generally well-functioning stock market, with greater size and liquidity (Drobetz et al., 2015), which is more attractive to external investors than bank-based financial systems. Therefore, in countries with market-based financial systems firms tend to have a wider range of available sources of financing. Taking into account the characteristics of both bank- and market-based financial systems, countries with market-oriented system are expected to have a greater proportion of debt-free firms than those with bank-oriented systems (Ghoul et al., 2018). Hence, the following research hypothesis is postulated:
Firm’s financing decisions are also determined by macroeconomic conditions. However, the effect of macroeconomic conditions on capital structure is somewhat ambiguous. Choe et al. (1993) show that in periods of economic growth, the costs of adverse selection are lower, which motivates a greater volume of share issuances. Therefore, given that firms’ preference for financing through equity is higher in periods of economic growth, equity issues are considered to be pro-cyclical and debt to be counter-cyclical. Another theoretical perspective points out that asset values fall in periods of uncertainty and macroeconomic shocks, which is reflected in a lower firm’s net worth and collateral (Brunnermeier & Oehmke, 2013). Therefore, in periods of economic recession, firms turn less to credit because the value of their collateral falls. In this view, both collateral and debt are pro-cyclical (Kiyotaki & Moore, 1997).
There are some studies relating macroeconomic conditions with zero leverage. Dang (2013) shows that in adverse macroeconomic conditions, represented by a low, or negative, GDP growth rate, a firm’s likelihood of adopting zero leverage increases. A similar result is obtained by Ghose and Kabra (2016), and so the authors conclude that zero leverage is counter-cyclical as regards macroeconomic conditions. More recently, Morais et al. (2020) showed that the 2008 financial crisis reduced the firms’ propensity to resort to debt.
In this article, we are particularly interested in estimating the effects of the recent global financial crisis on zero leverage. Considering that the 2008 US subprime crisis was transformed into a sovereign debt crisis in 2010 in several European countries (Laeven & Valencia, 2018), preventing the availability and access to external sources of finance (European Investment Bank, 2015), it is expected that the recent crisis experienced in Europe had an important effect on zero leverage. Indeed, during periods of macroeconomic shocks, the access to external finance generally becomes more expensive and difficult due to increasing information asymmetries and default risk. On one hand, the uncertainty about the real value of the firm and the quality of their investments reduce the creditor willingness to grant debt (Kiyotaki & Moore, 1997; Stiglitz & Weiss, 1981). On the other hand, the substantial losses faced by financial institutions during the recent financial crisis may also have decreased their loan activities (Ivashina & Scharfstein, 2010).
Based on these arguments, we expect that one consequence of the 2008 global crisis was an increment in the proportion of zero-debt firms. Thus, the following hypothesis is formulated:
The great dependence of firms on debt in bank-based countries results in closer ties and less information asymmetries between firms and banks, which can arguably mitigate the negative effects of the crisis on access to debt financing (Leland & Pyle, 1977). Therefore, firms from bank-based systems may benefit from their closer relationships with banks to keep access to debt at a fair condition during crisis periods, while firms from market-based systems may be forced to renounce the use of debt in such periods to avoid the aggravated costs. Hence, while it is expected that the 2008 crisis increased zero leverage in both bank- and market-based financial systems, one could also expect that firms located in bank-based financial systems were less impacted than their peers located in market-based countries. Thus, we argue that the crisis may have had a different effect on zero leverage depending on the financial system being considered and formulate the following hypothesis:
Interactions between zero-leverage internal and external determinants
So far, the literature on zero leverage has considered independently the effects of internal and external determinants on zero leverage, assuming they are homogeneous across different contexts. For example, while Bessler et al. (2013) and Ghoul et al. (2018) present evidence of a direct impact of country legal and/or financial system on zero leverage, they assume that the effects of internal determinants are identical across countries. Similarly, the direct impact of the 2008 crisis on firm’s and creditor’s debt decisions was estimated by Morais et al. (2020) assuming that the effects of internal determinants were the same during the crisis and non-crisis years. However, there are some connections between internal and external factors that may boost or attenuate their influence on zero leverage. Therefore, we formulate two additional hypotheses that consider their joint influence in cases that we think are particularly important.
The stronger protection to minority shareholders and the higher flow of information existent in countries with well-functioning and developed capital markets increase investors’ willingness to invest (La Porta et al., 2002), providing firms with a wider range of alternative and attractive sources of financing than in bank-based systems, where the relationships are mainly established with banks (Leland & Pyle, 1977). In particular, the greater number of investors and the higher liquidity of capital markets in market-oriented systems give firms a better chance to replace debt by equity and remain debt-free. Therefore, it is easier for firms located in those countries to keep their financial flexibility and, hence, their borrowing capacity to finance future investment opportunities that may arise (de Jong et al., 2012). For example, more profitable firms, with higher levels of internal liquidity and holding future good prospects, have more chances to be debt-free in market systems than in bank systems, where, instead of building up financial flexibility, firms often have to use their operational profits and liquidity to comply with debt repayment plans. Thus, the financial flexibility approach may apply, particularly, to firms in countries with market-based systems, that is, there is a higher propensity for those firms to adopt zero-leverage policies due to their own decision. Therefore, the following hypothesis will be tested:
However, the overall increase in information asymmetries and default risk during crisis periods are expected to hamper the access to external finance. In particular, the arguments put forward in section “External determinants of the zero-leverage phenomenon: the financial system and the 2008 global financial crisis” suggest that the recent financial and sovereign debt crises aggravated firms’ financial constraints and, hence, firms’ access to debt got worse due to creditors’ imposition. From the debt supply side, there are some reasons that may lead creditors to aggravate the conditions to grant debt to firms during periods of crisis. As argued by the balance sheet channel perspective, asset values fall during crisis, which, together with the uncertainty about the real value of the firm, increases considerably the risk taken by creditors and consequently reduces their willingness to grant debt (Kiyotaki & Moore, 1997; Stiglitz & Weiss, 1981). Moreover, creditors may react to the substantial losses faced by financial institutions during the crisis by promoting a contraction in credit availability to firms or requiring higher interest rates (Ivashina & Scharfstein, 2010; Santos, 2011). Although this situation affects all firms, firms with little reputation are expected to be even more affected and to have even more difficulties to raise debt (Diamond, 1991). Therefore, smaller firms with low percentage of asset tangibility and low-dividend payments are expected to be more prone to have zero leverage during the crisis period due to creditors imposition. Thus, financial constraints arguments for zero leverage may acquire more relevance during the crisis period.
Hence, we hypothesize that:
Data and methodology
The accounting, financial and market data about the listed European firms included in our sample were obtained from the DataStream database provided by Thomson Reuters. Data were collected for the period between 1995 and 2016 for 14 Western European countries (Austria, Belgium, Denmark, Finland, France, Germany, Greece, Ireland, Italy, The Netherlands, Portugal, Spain, Sweden, and the UK). These countries were selected to ensure the availability of information for listed firms during the period of analysis.
As in previous studies about capital structure, utilities and financial firms were excluded from the sample due to the different regulations that these firms are subject to. Following the recent study by Sardo and Serrasqueiro (2018), we used the FTSE/Dow Jones Industry Classification Benchmark (ICB), and so firms with an industry code of 7000-7999 (Utilities) or 8000-8999 (Financials), as well as firms without industry code, were excluded from the sample. Then, we removed from the sample firm-year observations with missing information for total assets, sales or total debt. Finally, we excluded firm-year observations with invalid information or obvious errors for assets, sales and short and long-term debt. To mitigate potential survivorship bias, we allowed firms’ entry and exit from the sample. After applying those cleaning and filtering criteria, the final sample contains 8,676 listed firms corresponding to an unbalanced panel data of 88,348 firm-year observations.
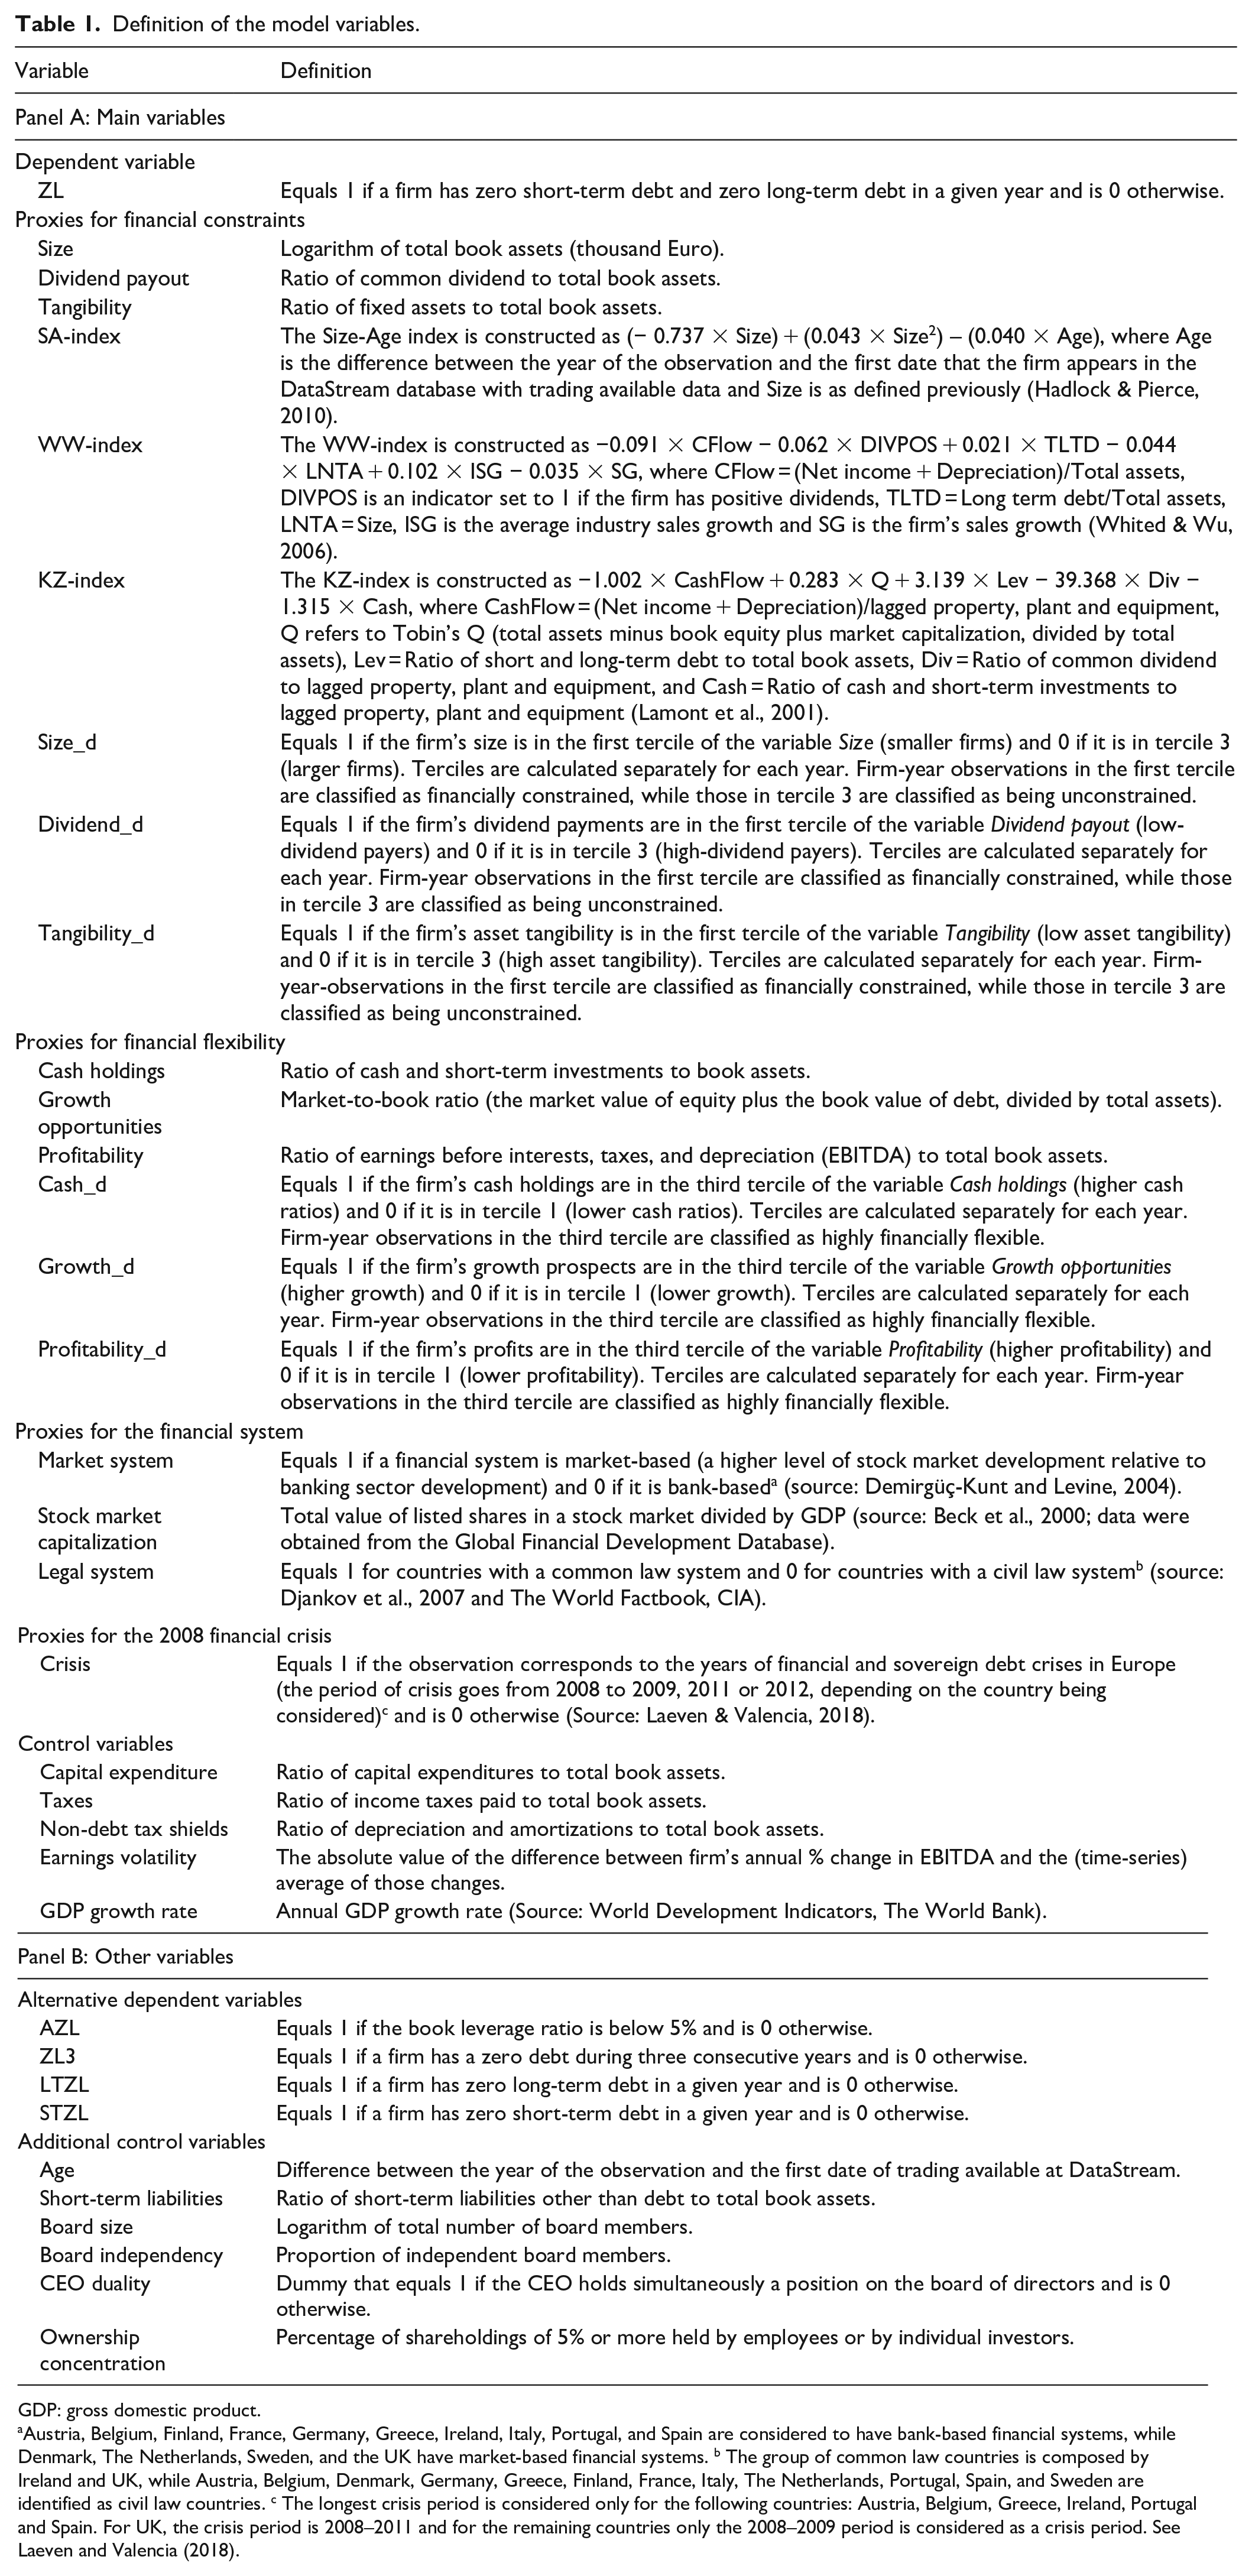
Table 1 provides a definition of the variables considered in the main econometric models and also of the additional variables that were used to test the robustness of our main results. The dependent variable (ZL) has a binary nature, being 1 if total debt is equal to zero in a given year. In this calculation we considered only financial debt and excluded non-debt liabilities, since our focus is on financing decisions (Strebulaev & Yang, 2013).
Definition of the model variables.
GDP: gross domestic product.
Austria, Belgium, Finland, France, Germany, Greece, Ireland, Italy, Portugal, and Spain are considered to have bank-based financial systems, while Denmark, The Netherlands, Sweden, and the UK have market-based financial systems. b The group of common law countries is composed by Ireland and UK, while Austria, Belgium, Denmark, Germany, Greece, Finland, France, Italy, The Netherlands, Portugal, Spain, and Sweden are identified as civil law countries. c The longest crisis period is considered only for the following countries: Austria, Belgium, Greece, Ireland, Portugal and Spain. For UK, the crisis period is 2008–2011 and for the remaining countries only the 2008–2009 period is considered as a crisis period. See Laeven and Valencia (2018).
As determinants of ZL, we consider several proxies for the factors related to the hypotheses formulated in section “Literature review and research hypotheses.” Regarding the financial constraints hypothesis, there is not a unique, consensual way to measure financial constraints (see Almeida et al., 2004). Therefore, various proxies for the willingness of creditors to grant credit to a firm have been used in the literature, in particular firm size (Cleary, 2006; Guariglia, 2008; Hadlock & Pierce, 2010), dividend payments (Cleary, 2006; Dang, 2013; Fazzari et al., 1988) and asset tangibility (Benmelech & Bergman, 2009). 3 These firm-specific characteristics can be seen as proxies for the degree to which firms are more exposed to information asymmetries and, thus, for the difficulty in obtaining external finance (Guariglia, 2008). Specifically, firms of smaller size and firms that do not pay out dividends have generally less reputation, which makes it difficult to obtain external finance, inasmuch as lenders require greater compensation for the risk in granting credit to such firms. Simultaneously, tangible assets serve as collateral to debt, which grants creditors protection in case of firms’ default, implying that firms with lower asset tangibility are more likely to face information asymmetries and consequent credit rationing (Benmelech & Bergman, 2009). Alternatively, researchers have used composite indexes of financial constraints, such as the SA-index (Hadlock & Pierce, 2010), the WW-index (Whited & Wu, 2006) and the KZ-index (Kaplan & Zingales, 1997; Lamont et al., 2001), which are constructed weighting differently several firm-specific characteristics assumed to be related to the existence of financial constraints. In the three cases, a higher (lower) value for the index suggests that greater (smaller) financial constraints are faced by firms. Another possible strategy for proxying financial constraints is to use the dummy variables defined in Table 1, which are based on the Size, Dividend payout, and Tangibility variables, but distinguish directly financially constrained firms (firms with values in the first terciles of those variables—smaller firms, firms with a lower dividend payout or firms with less tangible assets) from the unconstrained ones (firms in the last tercile). This approach may provide additional insights, since using the continuous values of the three mentioned variables may not completely identify and differentiate firms with different levels of constraints. In order to reduce misclassification of constrained and unconstrained firms, all analyses based on the dummy variables exclude firms in the second tercile of Size, Dividend payout, or Tangibility.
Similarly, in the literature there is no well-defined measure of financial flexibility, this being a non-observable factor that depends greatly on managers’ assessment of future growth opportunities (Ferrando et al., 2017). Nevertheless, previous studies have assessed financial flexibility by resorting mostly to measures related to debt and/or internal liquidity (Arslan-Ayaydin et al., 2014; Ferrando et al., 2017; Gamba & Triantis, 2008; Marchica & Mura, 2010). In this article, we consider three of those measures as proxies for financial flexibility: cash holdings, profitability and growth opportunities. Firms with a higher level of any of these measures are expected to have a greater ability or desire to build up financial flexibility. In addition, as in the previous case, we use dummy variables distinguishing between the most and least financially flexible firms.
To analyze the effect of the financial system, three alternative proxies are used. First, we construct a dummy variable based on an indicator developed by Demirgüç-Kunt and Levine (2004) that allows the partition of the sample into countries with a market-based financial system and countries with a bank-based financial system. Second, we use the Stock market capitalization variable, an indicator of the size of the stock market (Beck et al., 2000), also interpreted as a measure of stock market development (Aktas et al., 2019). Finally, because common law countries favor the development of market-based financial systems (Demirgüç-Kunt & Levine, 1999), we use a dummy variable based on the legal system prevailing in the country, a variable that has also been considered by Bessler et al. (2013) to explore the effect of country specificities on zero leverage.
For the crisis, we use a dummy variable based on the recent classification developed by Laeven and Valencia (2018) about banking, currency and sovereign debt crises, which recognizes that the 2008 global financial crisis affected European countries in different ways and assigns distinct final years for the crisis in each country.
Finally, the econometric models also include control variables shown in previous studies as having power in explaining capital structure decisions. These control variables are: Capital expenditures, Taxes, Non-debt tax shields, Earnings volatility, and GDP growth rate (Bessler et al., 2013; Dang, 2013; Strebulaev & Yang, 2013). In order to control for non-observed specific effects, all models include dummy variables for industry (based on the 1-digit ICB code) and some models also consider country and year dummies.
We perform both univariate and multivariate analyses to investigate which firms’ characteristics stimulate zero-leverage policies. In the multivariate analysis, as a consequence of the binary nature of the dependent variable, it is required the use of an econometric method appropriate for such response variable, since, for example, standard estimators such as ordinary least squares assume that the dependent variable can take on any real negative or positive value (Wooldridge, 2012). In particular, pooled logit regression models are used to estimate the impact of the explanatory variables on the likelihood of a firm having zero leverage. The logit model has the following form:

where x represents the vector containing some of the explanatory variables defined in Table 1 (including also a constant term) and β represents the vector of the variable coefficients. In the robustness section other models will be considered, including probit models, random and fixed effects models and an instrumental variable approach. Propensity score matching will also be considered in a preliminary analysis.
Empirical results
Univariate analysis
Sample
We begin the empirical part of the paper by presenting a brief description of the research sample. Table 2 shows the distribution of observations and firms by country and financial system for both the full sample and the sub-sample of debt-free firms. Between 1995 and 2016 around 10.84% of firm-year observations are classified as having zero leverage, with debt-free firms being significantly present in all countries. The dimension of this result is even more noteworthy if we consider that almost 29% of firms present zero-leverage levels in at least one year. Nevertheless, these values are lower than those reported in most studies developed for the Unites States (Strebulaev & Yang, 2013) and the United Kingdom (Dang, 2013). Comparing with papers including other countries, the values reported here are also lower than those found by Bessler et al. (2013) and Ghoul et al. (2018), where about 18% and 13% of observations correspond to debt-free firms, respectively.
Sample characterisation by country.
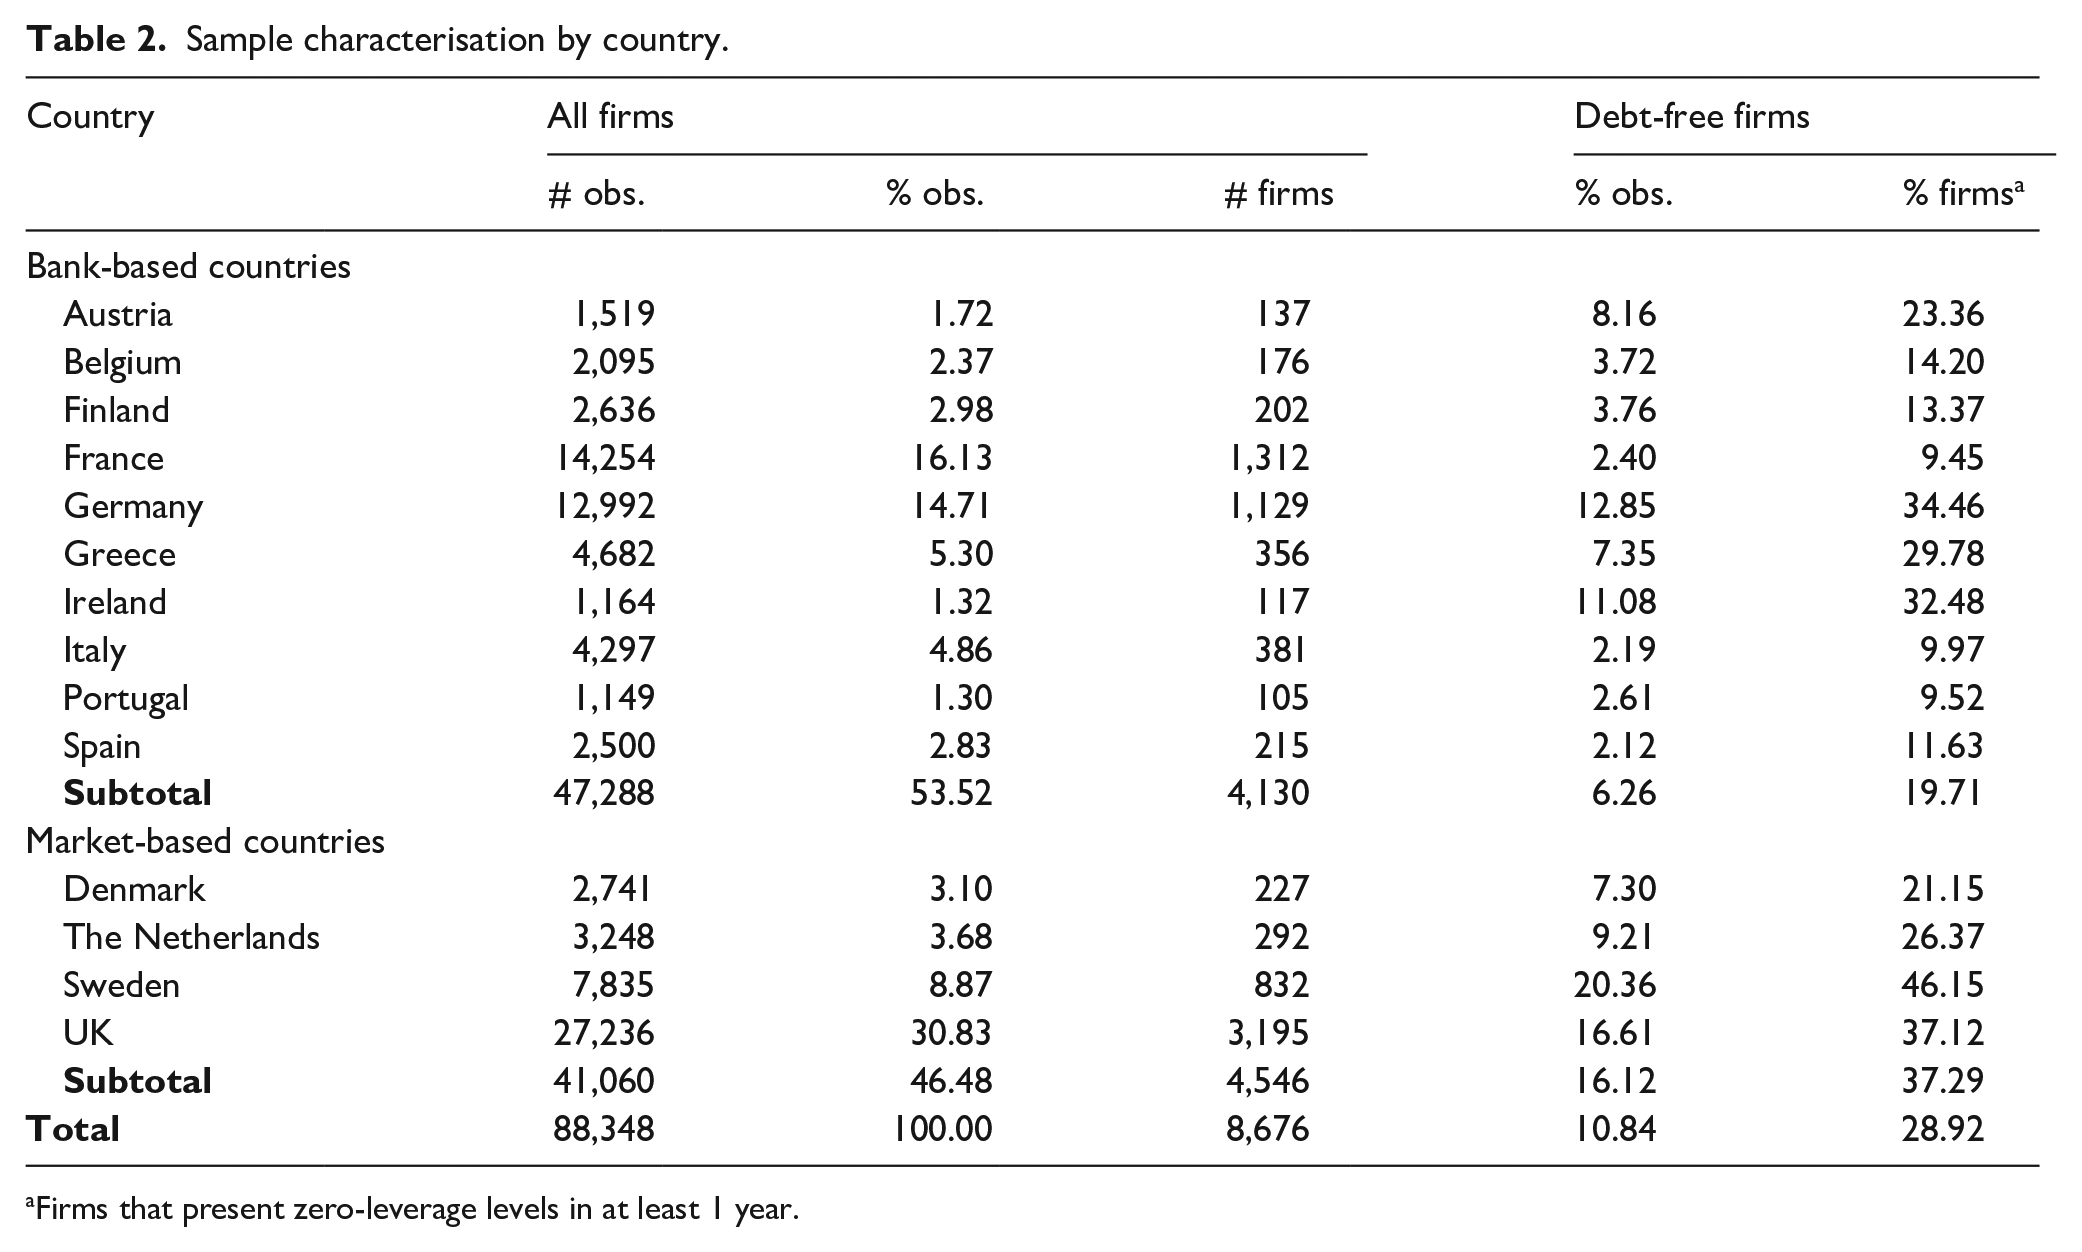
Firms that present zero-leverage levels in at least 1 year.
A more detailed analysis reveals great heterogeneity in the distribution of zero-leverage firms between countries, with Sweden (20.36%) and UK (16.61%) presenting the greatest proportions of zero-leverage observations and France, Italy, Portugal and Spain the lowest (between 2% and 3%). Since the first two countries are characterized by market-based financial systems and the last four by bank-based systems, it seems that, as hypothesized, there may be a relationship between the level of development of the financial system and the zero-leverage phenomenon. The same conclusion is achieved when we compare the average percentage of observations of debt-free firms in countries with market and bank-based systems (16.12% and 6.26%, respectively).
Trends of zero leverage
There is consensus in the literature about an increasing trend toward zero leverage over the years (e.g., Bessler et al., 2013; Ghoul et al., 2018). In order to confirm a similar trend in Europe, Figure 1 shows the evolution of zero leverage over the period 1995–2016, both in global terms and by financial system. It is clear an upward trend of zero leverage for the full sample. The proportion of firms with zero leverage was 5.15% in 1995, increased fairly steady until 2006 (12.81%), stagnated during the global financial crisis (12.11%–12.87% between 2008 and 2010), peaked in 2014 (13.92%) and reached 11.94% in 2016, more than doubling during the period of analysis.
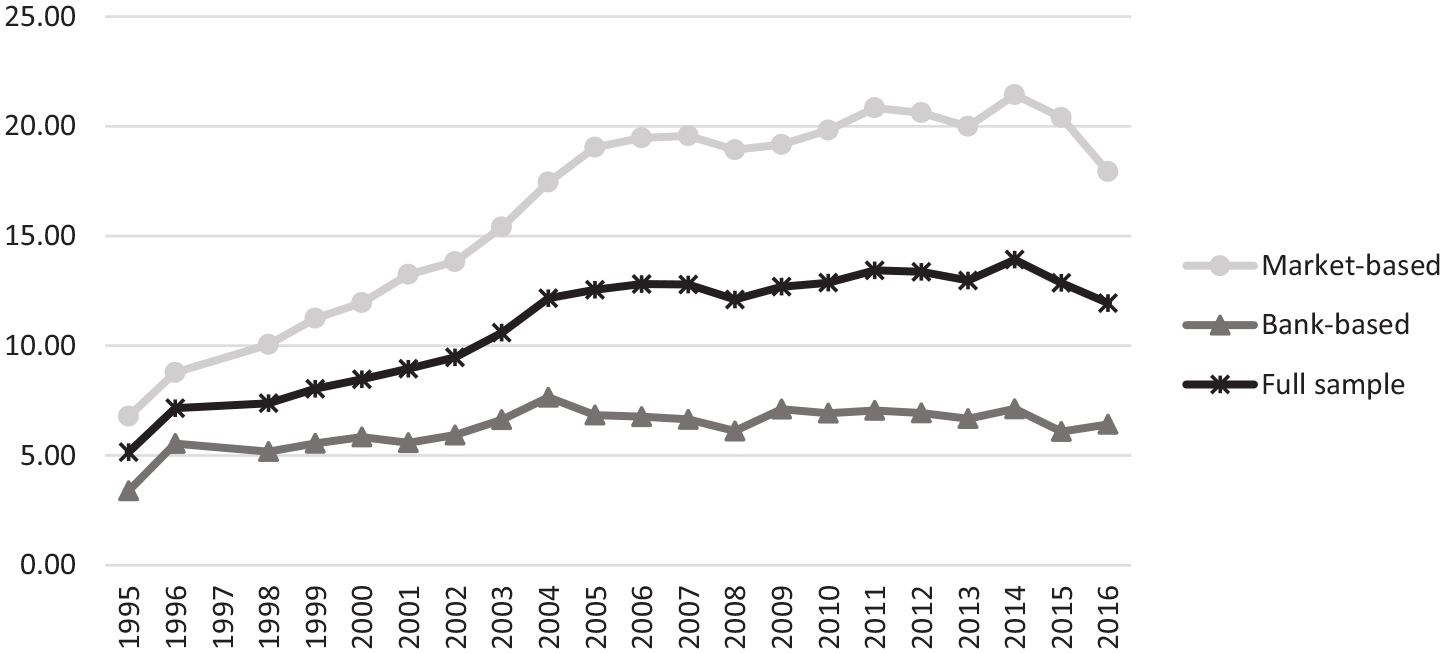
Evolution over time of zero-leverage levels in different financial systems and in the whole sample.
Figure 1 also shows marked differences in the distribution and evolution of zero leverage between the two financial systems considered. In countries with a market-based financial system, zero leverage increased considerably over the years, with the proportion of debt-free firms almost tripling between the beginning (6.79%) and the end of the period of analysis (20.40% in 2015 and 17.93% in 2016). However, for countries with a bank-based financial system, the increase of zero leverage was much less noticeable. In fact, considering the evolution from 1996 (5.54%) to 2016 (6.42%), we find that the increase of zero leverage is residual, not even reaching 1 percentage point (pp). It increased slightly until 2004 and then fell until 2008, with the figures remaining similar until 2016.
Descriptive statistics
Table 3 presents descriptive statistics for the continuous variables defined in Table 1. In particular, Panel A reports several descriptive statistics for the full sample, while Panel B presents the mean values for both zero-leverage and leveraged firms and the results of t-tests for the mean differences across groups.
Descriptive statistics and mean characteristics of zero-leverage versus leveraged firms.
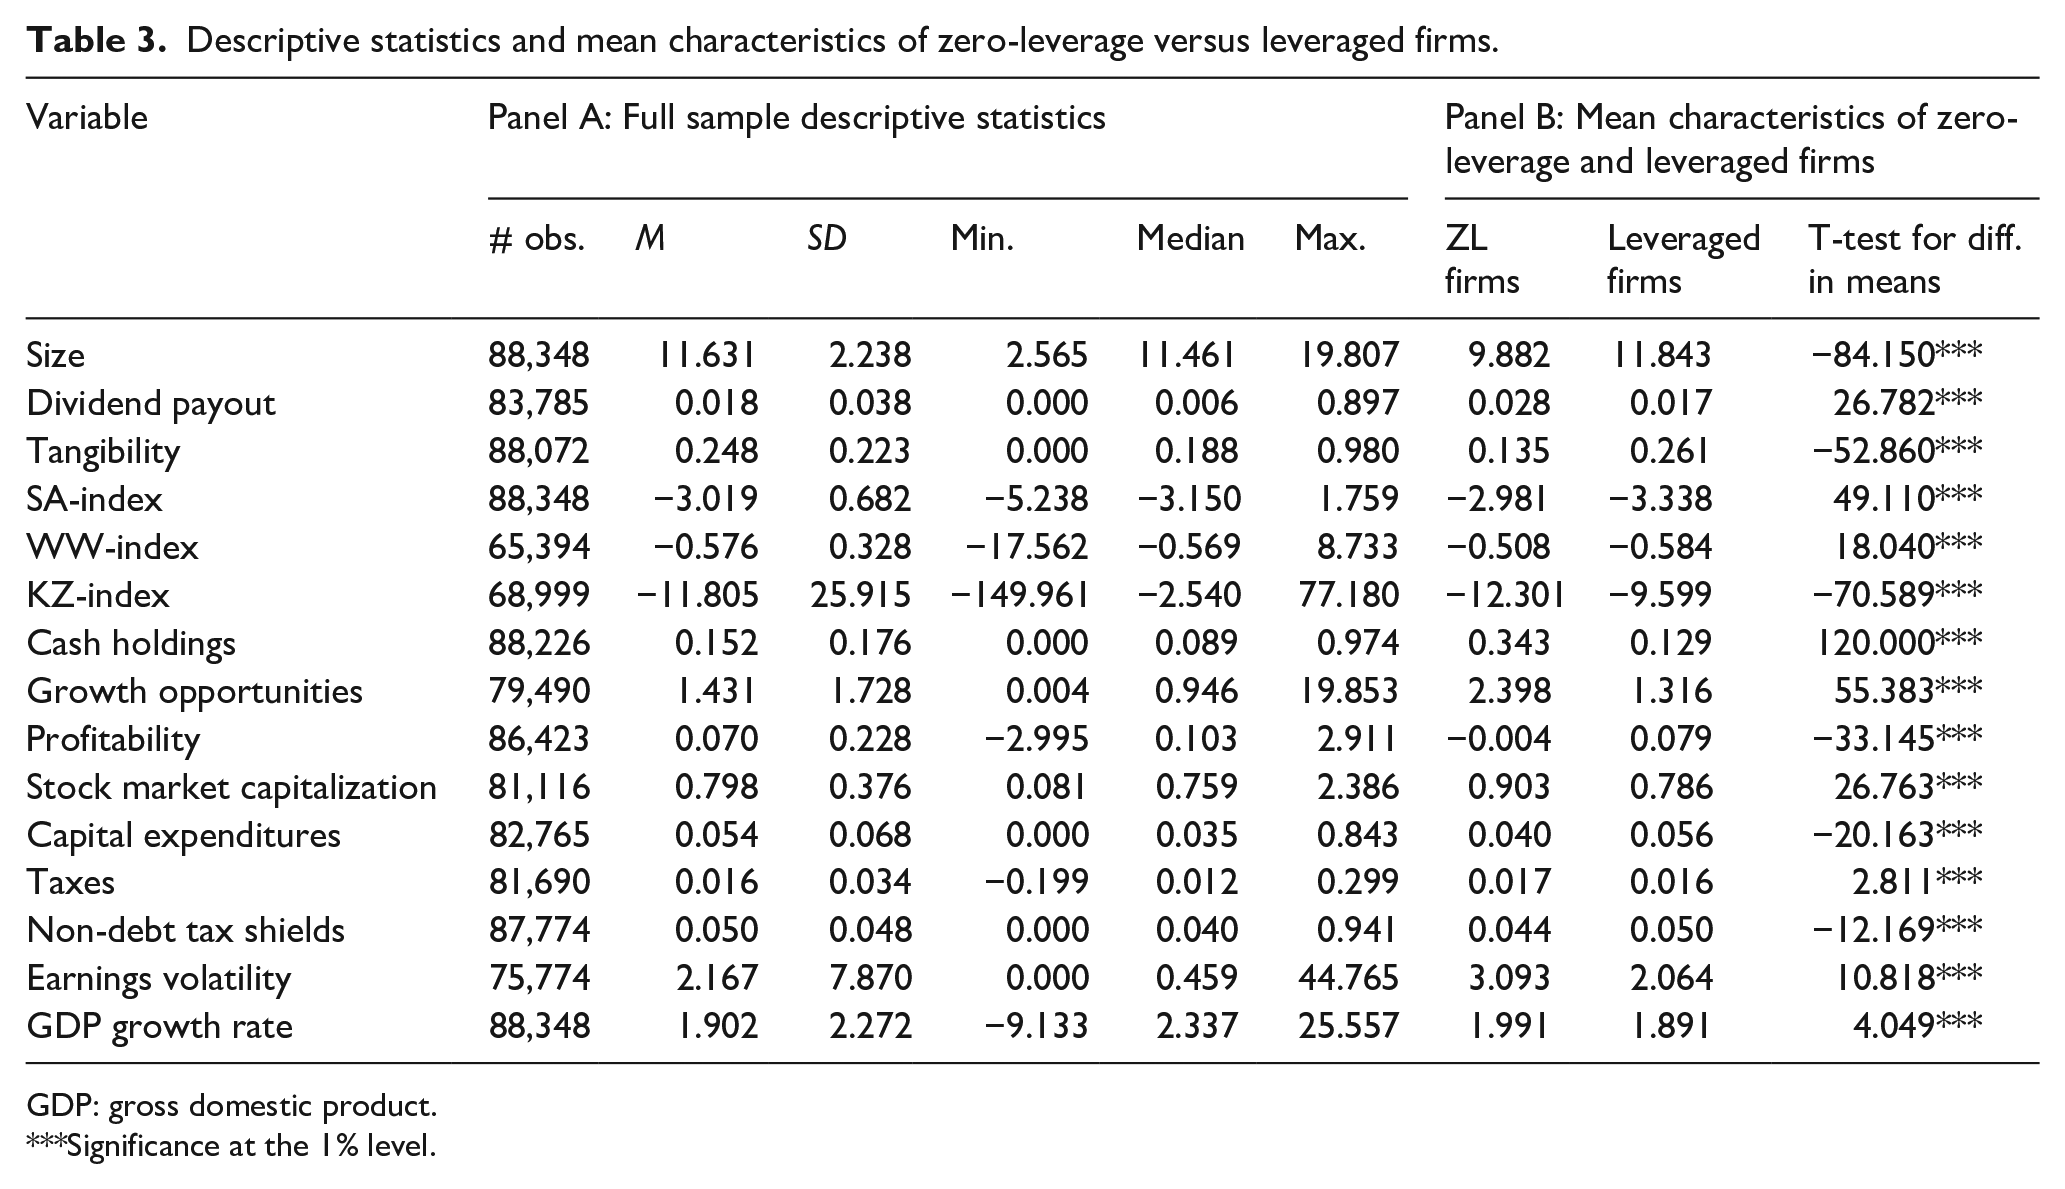
GDP: gross domestic product.
Significance at the 1% level.
Table 3 shows that debt-free firms are smaller and have lower levels of tangible assets than leveraged firms, which is in line with the hypothesis of zero leverage arising from financial constraints (Benmelech & Bergman, 2009; Hadlock & Pierce, 2010). However, on average, debt-free firms pay out more dividends as a percentage of assets than leveraged firms. This result is against the financial constraints approach according to which firms paying more dividends suffer less from information asymmetries and have a better reputation and, hence, are less likely to be financially constrained (Cleary, 2006; Fazzari et al., 1988). The composite measures of financial constraints are also not completely in accordance, since two of them show that on average debt-free firms are more financially constrained while the other (KZ-index, the only index that considers the actual value of the dividends) shows the opposite. In addition, the results show that firms with zero leverage, on average, present higher levels of growth opportunities and cash holdings than leveraged firms. These results are similar to those of Dang (2013) and are consistent with the argument of zero leverage being the result of a financing decision of firms, which aim at maintaining financial flexibility to preserve their debt capacity in order to fund future valuable growth opportunities (Marchica & Mura, 2010). However, unlike what the financial flexibility theory predicts, debt-free firms are less profitable than leveraged firms.
Propensity score matching analysis
Because the previous analysis mixes zero-leverage firms with different characteristics, we use the propensity score matching approach suggested by Rosenbaum and Rubin (1983) to further examine the effect of firm-specific variables proxying for financial constraints and financial flexibility on zero leverage. Propensity score matching analysis allows us to get a more balanced distribution of the values of the covariates across the groups of financially constrained and unconstrained firms, on one hand, and the groups of highly and little financially flexible firms, on the other hand. To implement this method, we first use the procedure described in Table 1 to divide firms into terciles and create the “treatment” variables Size_d, Dividend_d, Tangibility_d, Cash_d, Growth_d, and Profitability_d. The first three variables are equal to 1 for financially constrained firms (“treatment” group) and to 0 otherwise (“control” or “non-treatment” group), while the last three are equal to 1 when firms are classified as highly financially flexible firms (“treatment” group) and to 0 otherwise (“control” group). Then, for each treatment variable, we use a logit model to estimate the corresponding propensity scores conditional on a set of other firm-specific characteristics (e.g., for Size_d, we consider Dividend payout, Tangibility, Cash holdings, Growth opportunities, and Profitability). Next, using nearest-neighbor matching, we match each constrained or highly financially flexible firm with the unconstrained or little financially flexible firms that display the closest predicted propensity scores, and vice-versa. 4 Finally, we estimate the differences between the predicted probabilities of being a zero-leverage firm for each match and average those differences for the whole sample.
Table 4 reports the results obtained. In the first row we present the “treatment effect,” which in this case may be interpreted as the average difference in the predicted probability of being debt-free between financially constrained and unconstrained firms (columns (1)–(3)) and between highly and little financially flexible firms (columns (4)–(6)). In the other rows we present, both for the original and matched sample, descriptive statistics and Rubin (2001) diagnostic criteria for the balance of the distribution of the covariate values for each group of firms. A perfect matching would imply a standardized mean difference of zero across groups and a variance ratio of one. As can be seen, the level of balance between the groups improves substantially in the matched sample in all cases. Nevertheless, the matching is never perfect and Rubin (2001) measures suggest that in some cases the samples are not sufficiently balanced. Therefore, the following conclusions should be seen as preliminary and must be confirmed by the multivariate regression analysis that we undertake in section “Multivariate analysis.”
Propensity score matching estimates.
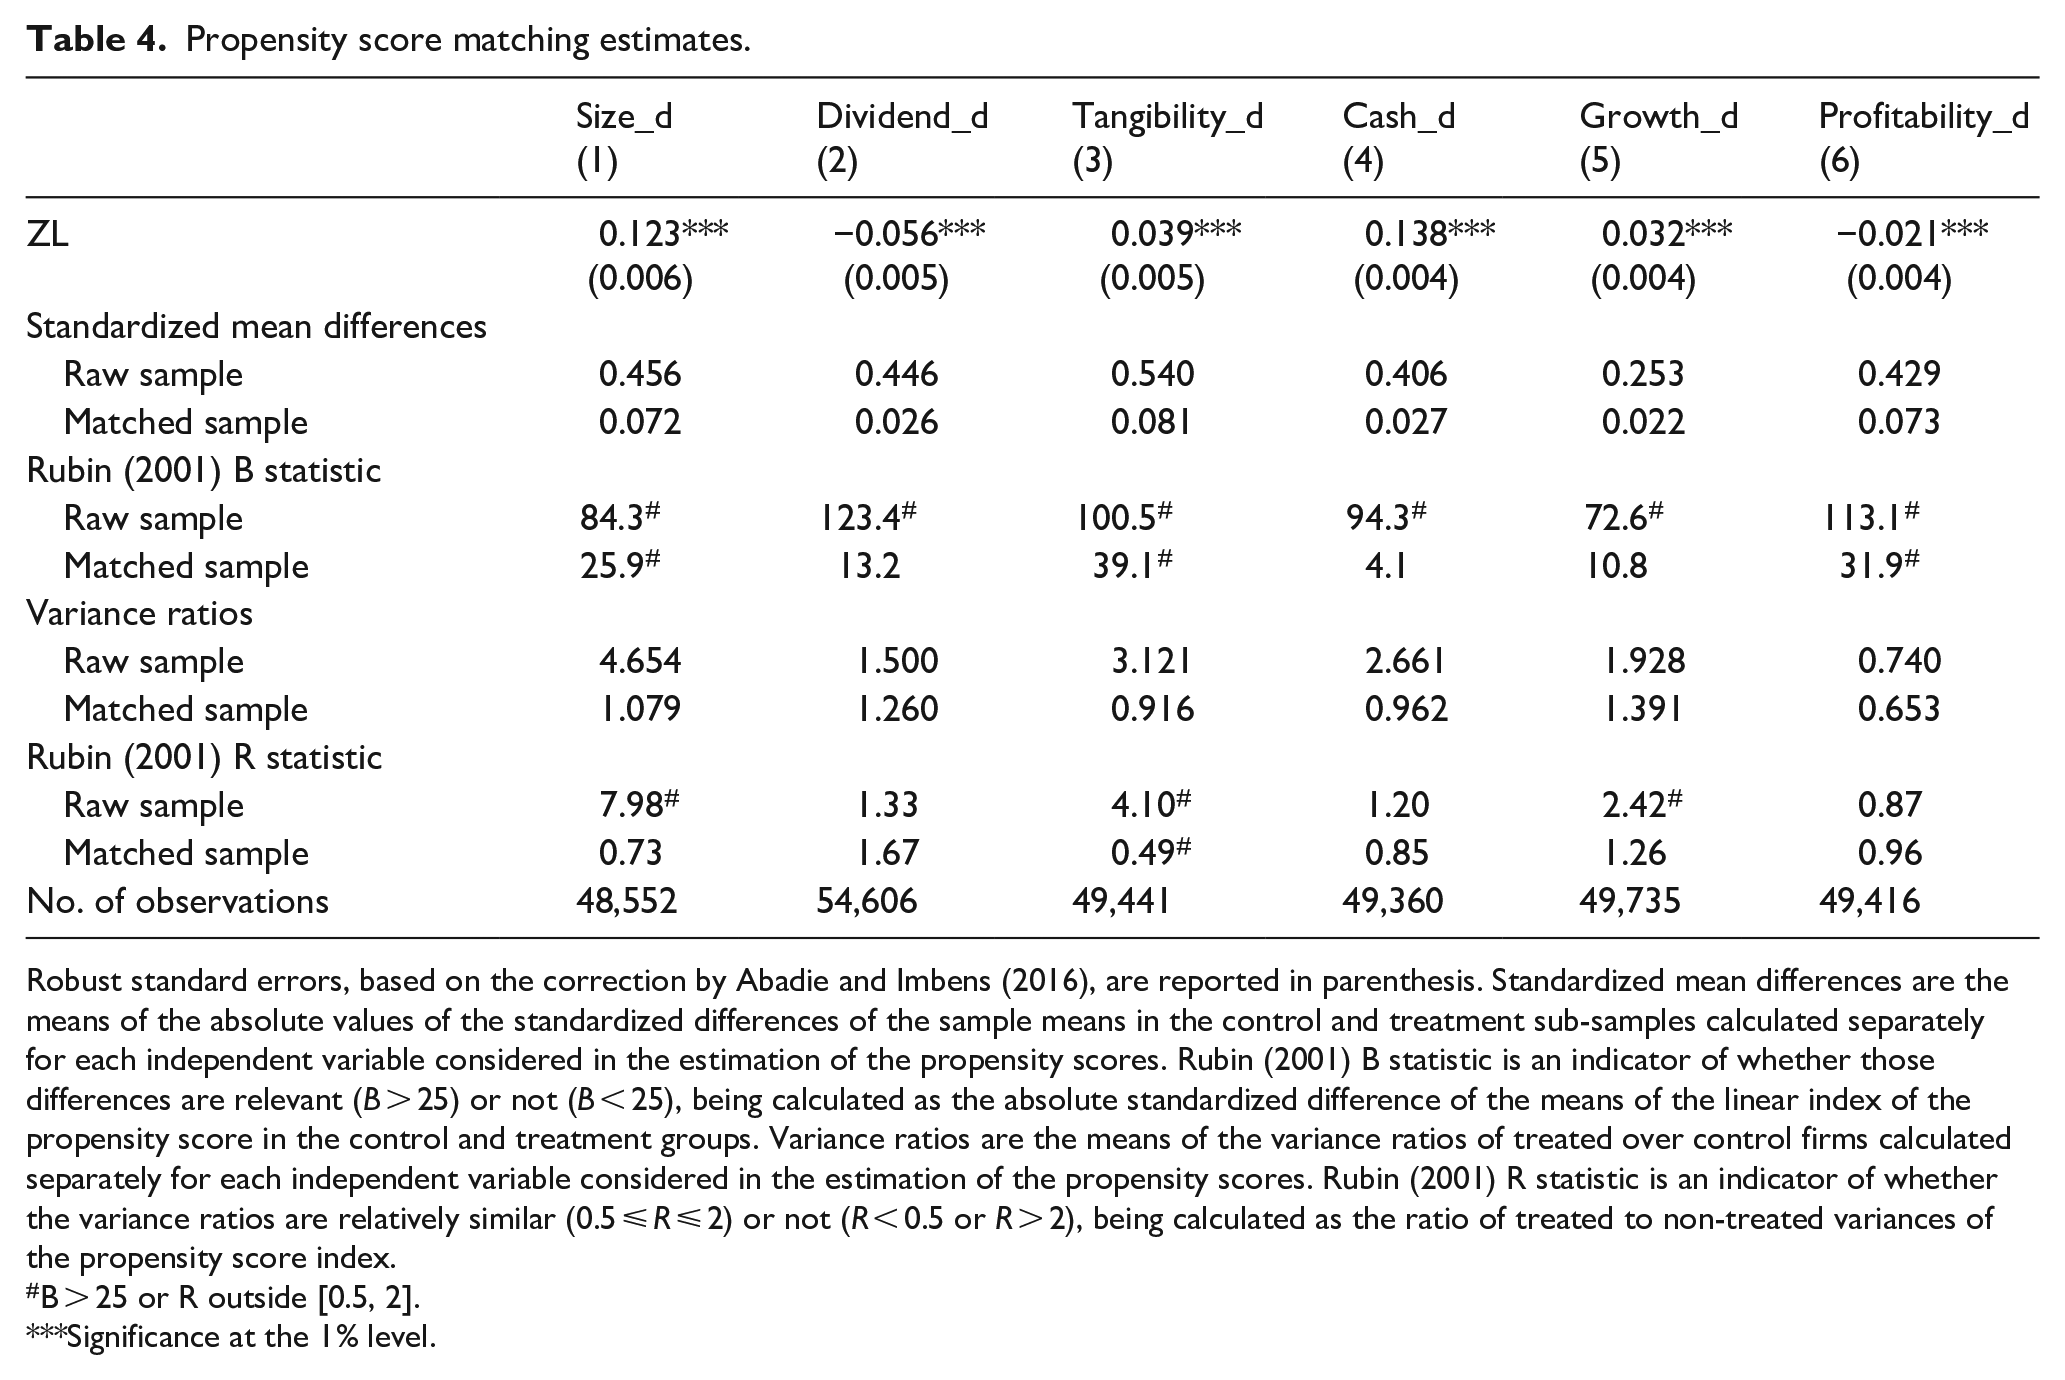
Robust standard errors, based on the correction by Abadie and Imbens (2016), are reported in parenthesis. Standardized mean differences are the means of the absolute values of the standardized differences of the sample means in the control and treatment sub-samples calculated separately for each independent variable considered in the estimation of the propensity scores. Rubin (2001) B statistic is an indicator of whether those differences are relevant (B > 25) or not (B < 25), being calculated as the absolute standardized difference of the means of the linear index of the propensity score in the control and treatment groups. Variance ratios are the means of the variance ratios of treated over control firms calculated separately for each independent variable considered in the estimation of the propensity scores. Rubin (2001) R statistic is an indicator of whether the variance ratios are relatively similar (0.5 ⩽ R ⩽ 2) or not (R < 0.5 or R > 2), being calculated as the ratio of treated to non-treated variances of the propensity score index.
B > 25 or R outside [0.5, 2].
Significance at the 1% level.
Overall, the results of Table 4 lead to conclusions similar to those of Table 3. The probability of being debt-free is higher by 12.3pp for small firms and 3.9pp for the firms with the lowest proportion of tangible assets, and lower by 5.6pp for firms with the lowest dividend payouts. Thus, as before, the two first effects conform with the financial constraints theory, while the third is in contradiction. However, firms with the highest cash holdings and growth opportunities have a higher probability of having zero leverage, while the most profitable ones are less likely to be debt-free, the average difference in probability being 13.8pp, 3.2pp, and −2.1pp, respectively. Again, the two first results are in accordance with the financial flexibility theory, while the third is in conflict.
Correlation analysis
Table 5 presents the Pearson pairwise correlation coefficients between the continuous independent variables. 5 The results show that the correlations between the explanatory and control variables are not particularly high, being higher than 0.5 only for the pair (Size, SA-index), an expected result given that the composite measure is based on firm’s size. As shown in the last column, the variance inflation factor is always under 4, suggesting that even in that case multicollinearity is not a problem.
Pearson correlation matrix and VIF.
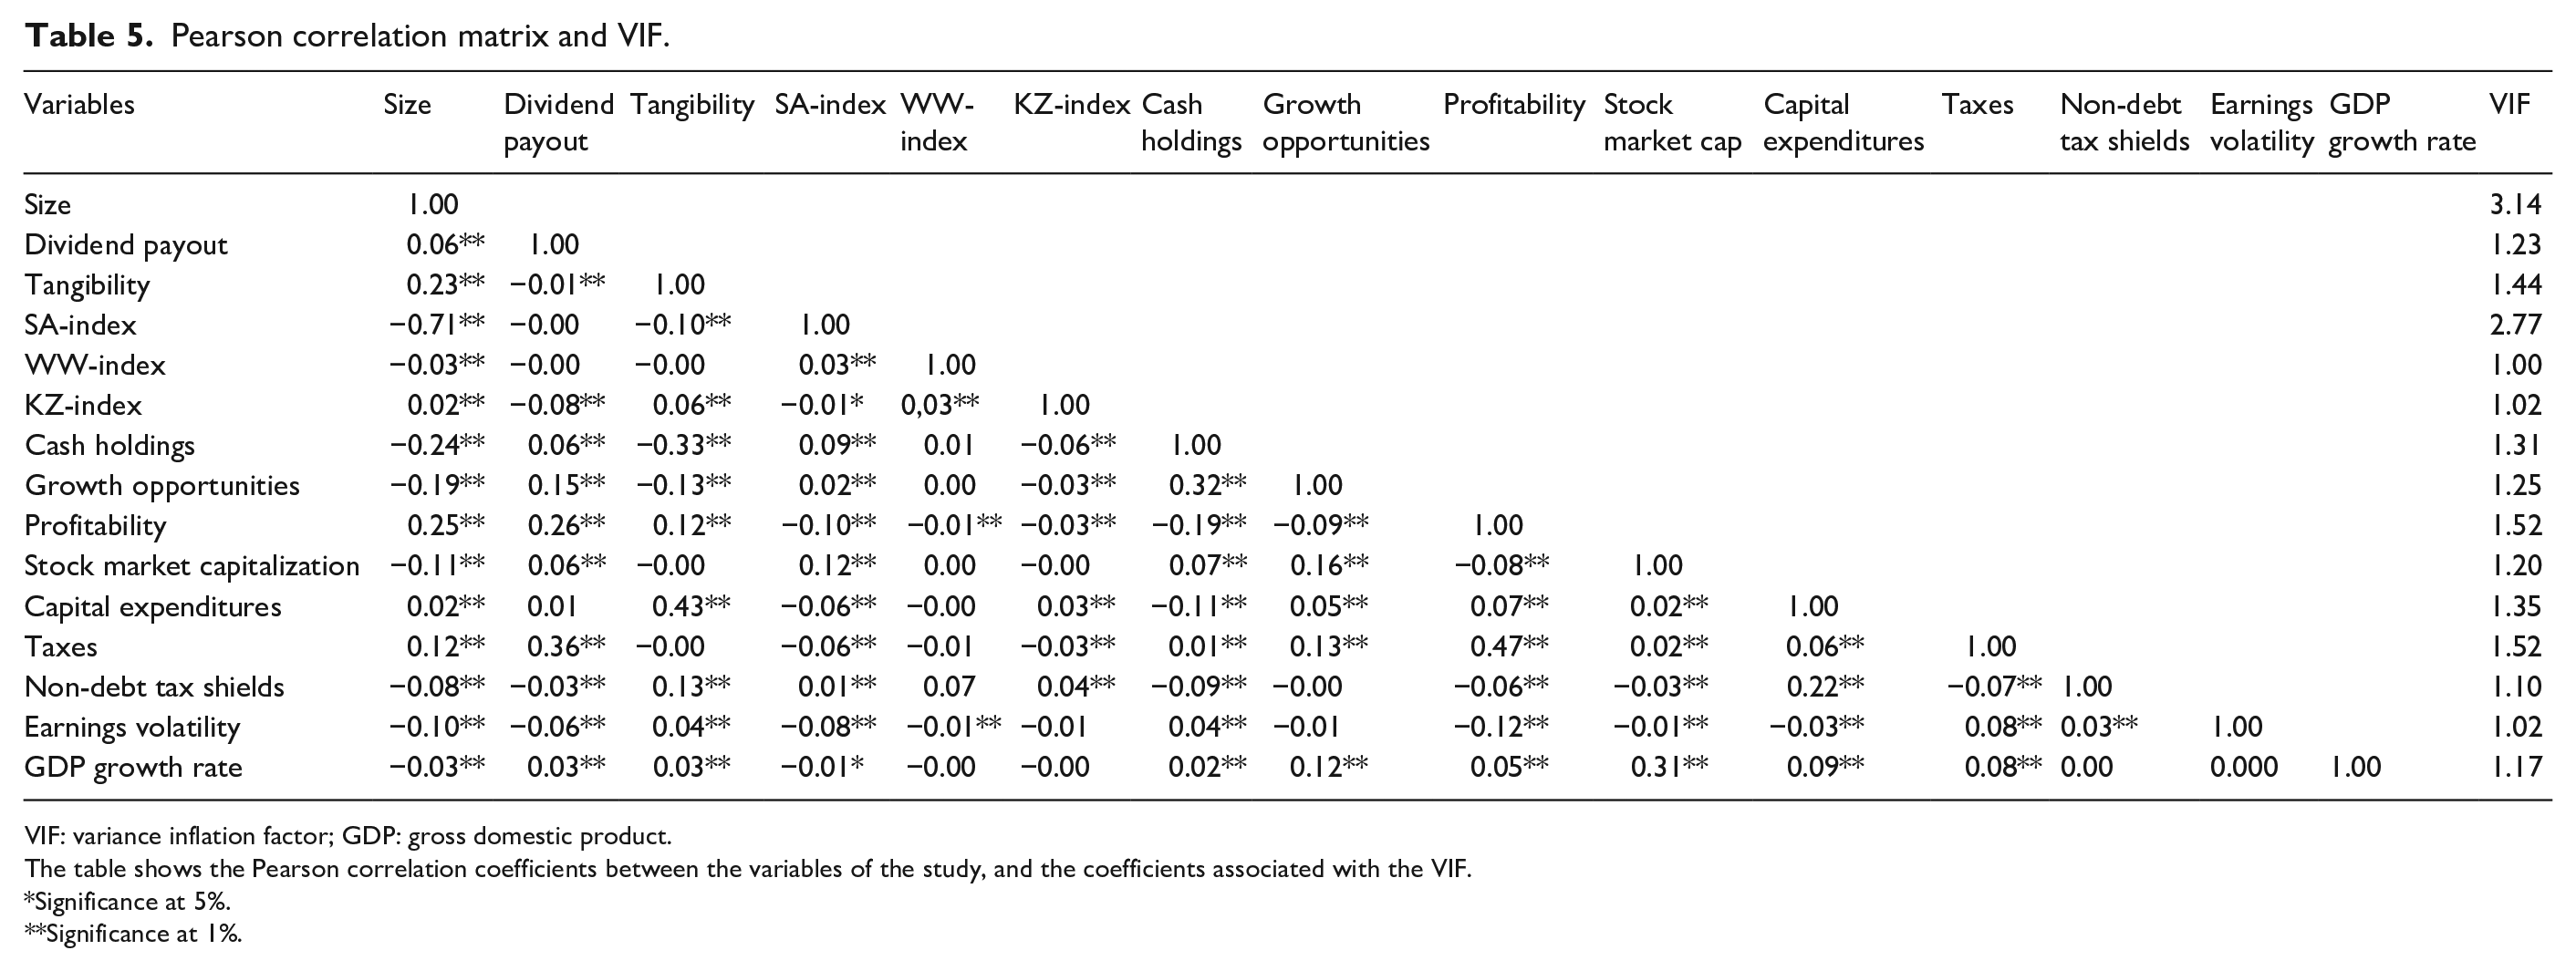
VIF: variance inflation factor; GDP: gross domestic product.
The table shows the Pearson correlation coefficients between the variables of the study, and the coefficients associated with the VIF.
Significance at 5%.
Significance at 1%.
Multivariate analysis
Results for the internal determinants of zero leverage
Table 6 presents the results of the models that allow us to test the hypotheses concerning the internal determinants of zero leverage. The eight estimated logit regression models differ only on the set of independent variables considered. For each independent variable, we report the estimated coefficient and the result of a Wald test for its individual significance in brackets. The Wald test uses robust standard errors that are adjusted for heteroscedasticity and clustered by firm to mitigate concerns about within-firm correlation. Given that the value of the regression coefficients is not directly interpretable in nonlinear models, below we also comment on the estimated (average) partial effect for the main independent variables, but these results are not presented in the table to save space. 6
Internal determinants of zero leverage.
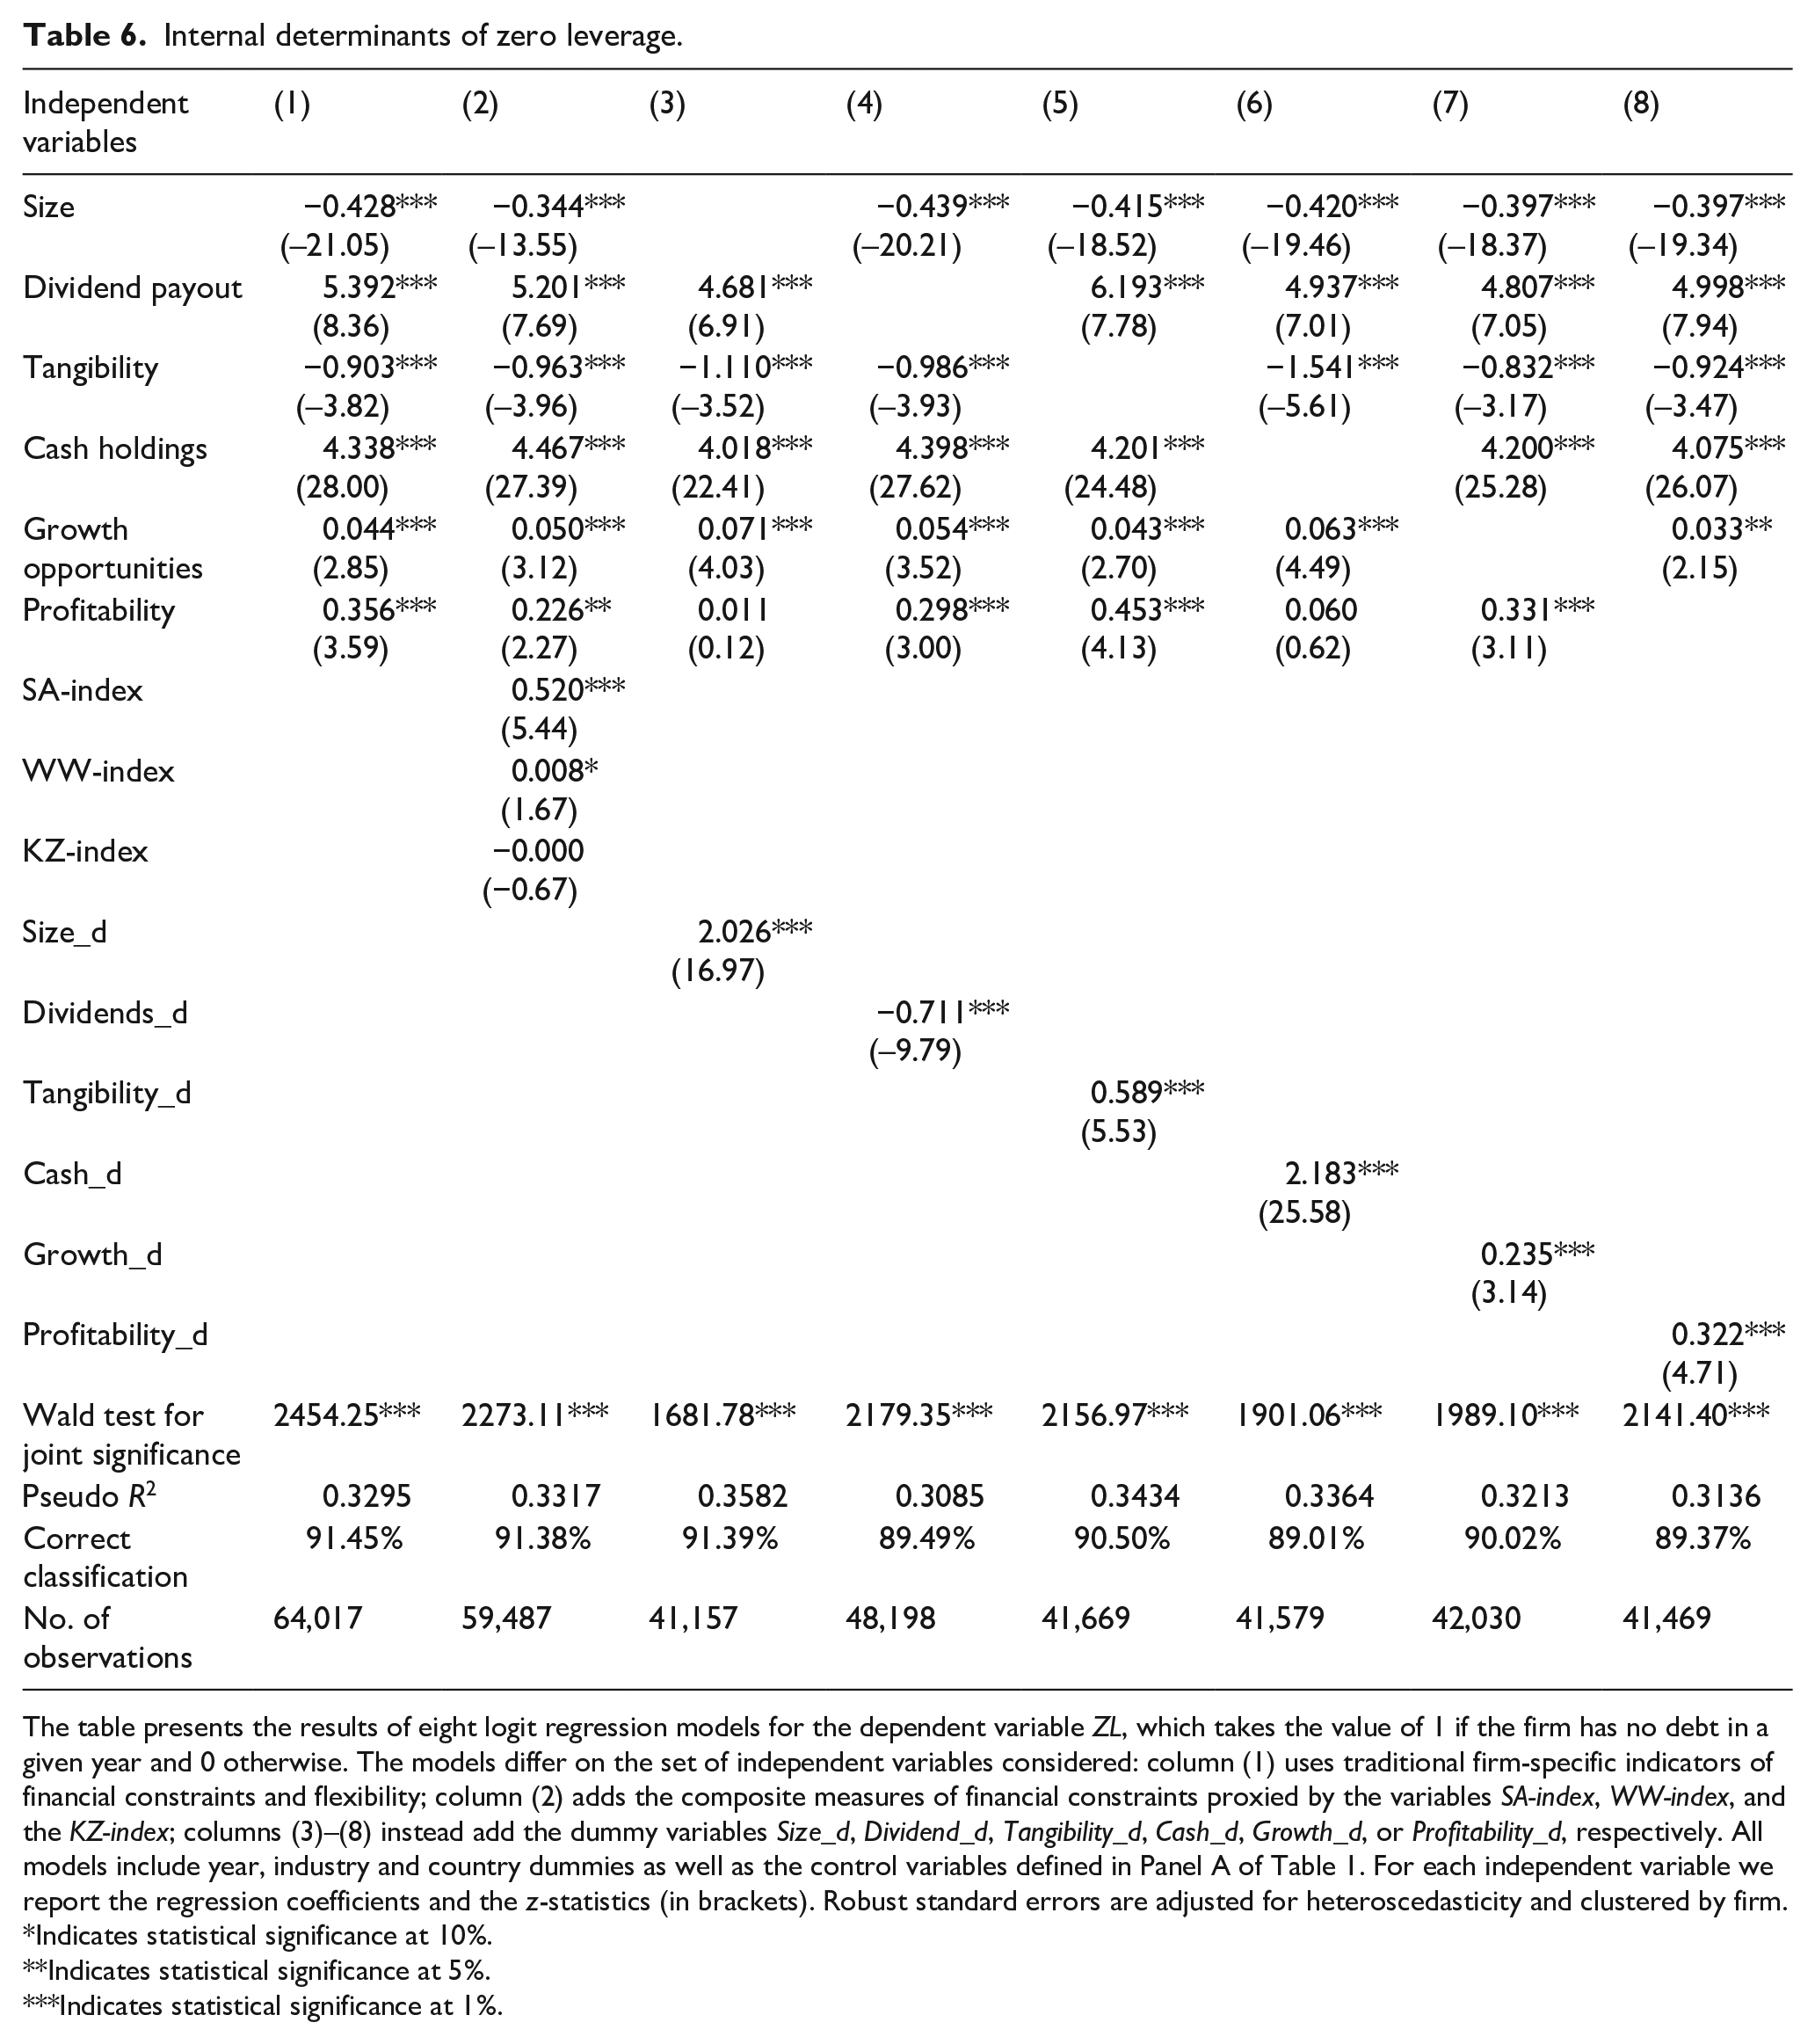
The table presents the results of eight logit regression models for the dependent variable ZL, which takes the value of 1 if the firm has no debt in a given year and 0 otherwise. The models differ on the set of independent variables considered: column (1) uses traditional firm-specific indicators of financial constraints and flexibility; column (2) adds the composite measures of financial constraints proxied by the variables SA-index, WW-index, and the KZ-index; columns (3)–(8) instead add the dummy variables Size_d, Dividend_d, Tangibility_d, Cash_d, Growth_d, or Profitability_d, respectively. All models include year, industry and country dummies as well as the control variables defined in Panel A of Table 1. For each independent variable we report the regression coefficients and the z-statistics (in brackets). Robust standard errors are adjusted for heteroscedasticity and clustered by firm.
Indicates statistical significance at 10%.
Indicates statistical significance at 5%.
Indicates statistical significance at 1%.
We focus on columns (1)–(5) to test hypothesis H1 about the role played by financial constraints on zero leverage and on columns (1) and (6)–(8) to test hypothesis H2 about the role played by financial flexibility. The specification in column (1) is used as our baseline model and incorporates the firm’s specific explanatory variables representing the financial constraints and financial flexibility approaches, the control variables defined in Panel A of Table 1, as well as industry, year and country dummies to mitigate concerns about omitted variables. The model in column (2) adds the composite measures of financial constraints, namely, the SA-index of Hadlock and Pierce (2010), the WW-index of Whited and Wu (2006) and the KZ-index of Kaplan and Zingales (1997). Columns (3)–(5) report the results for the models that use the dummy variables Size_d, Dividend_d, and Tangibility_d, respectively, to distinguish between groups of financially constrained (dummy variable = 1) and unconstrained firms. Finally, the models in columns (6)–(8) use the dummy variables Cash_d, Growth_d, and Profitability_d, respectively, to separate highly (dummy variable = 1) and little financially flexible firms. We consider the dummy variables one at a time in order to avoid a substantial loss of observations, since firms in the middle tercile of each variable are dropped from the sample, as explained before.
The applied econometric tests and criteria confirm the suitability of the estimated logit regression models. The Wald tests for the individual and joint significance of the explanatory variables confirm their ability to explain ZL. The Pseudo R-squared is always above 30%. The percentage of values of ZL being correctly predicted by the model are always around 90%.
Analyzing first the variables proxying the financial constraints approach, column (1) shows that both Size and Tangibility present a negative and statistically significant effect on zero leverage. Ceteris paribus, the increase of one standard deviation in each variable corresponds to a fall of, respectively, 2.6pp or 5.5pp in the firm’s likelihood of having ZL. 7 Consequently, the results suggest that smaller firms and firms with less collateral to debt are more likely to face information asymmetries and the consequent credit rationing (Benmelech & Bergman, 2009; Hadlock & Pierce, 2010; Stiglitz & Weiss, 1981), which is in accordance with the financial constraints hypothesis. In contrast, dividend payments present a positive and statistically significant effect on ZL, with a positive change of one standard deviation in the dividend payment ratio, ceteris paribus, increasing the likelihood of ZL by 33pp. This result, although similar to those obtained by Bessler et al. (2013) and Byoun and Xu (2013), disagrees with the arguments of the financial constraints approach, whereby firms paying lower dividends are more likely to adopt zero leverage due to higher costs of information asymmetry.
When we add to the model the composite indexes of financial constraints, see column (2), the previous conclusions are reinforced. 8 On one hand, the sign and significance of the Size and Tangibility variables do not change and the positive and significant coefficients of the SA-index and the WW-index variables are also in accordance with the financial constraints hypothesis. On the other hand, the effect of Dividend payout is again the opposite of that predicted by the financial constraints theory and the non-significant coefficient of the KZ-index also does not corroborate that theory. Similarly, the positive coefficients of the variables Size_d and Tangibility_d on columns (3) and (5), respectively, and the negative coefficient of the variable Dividend_d on column (4), confirm that smaller firms, firms with lower asset tangibility and firms paying more dividends have greater propensity to have zero leverage.
Overall, in spite of the contradictory results found, we conclude that there is some support for hypothesis H1. Indeed, given that the univariate analysis in section “Univariate analysis” had already shown that zero-leverage firms display on average smaller values for the KZ-index, and that this index is the only one that considers the actual value of dividend payments in its calculation, we think that our results suggest that both Dividend payout and KZ_index may not be the best proxies for financial constraints. The unexpected, but systematic, positive effect of dividends on zero leverage seems to indicate that, more than a proxy of the financial constraints experienced by zero-leverage firms, dividends may act mainly as a mechanism controlling for managerial entrenchment arising from excessive free cash-flows, and therefore as a substitute for debt for that purpose (Easterbrook, 1984) or as a way to establish a good reputation with shareholders to obtain financing via equity issuances and therefore avoid raising debt (Byoun & Xu, 2013). However, there is an active debate about the ability of composite measures of financial constraints to effectively identify financial constraints (Farre-Mensa, & Ljungqvist, 2016). Our results seem to confirm the doubts cast by Hadlock and Pierce (2010) and Whited and Wu (2006) regarding the use of the KZ-index as a measure of financial constraints, since, for example, this index tends to classify large and overinvested firms as constrained firms (Whited and Wu, 2006). Moreover, as debt loads the KZ-index positively and higher values of the index mean higher financial constraints, zero-leverage firms have more chances to be classified as financially unconstrained.
Concerning the variables representing the financial flexibility approach, that is, Cash holdings, Growth opportunities, and Profitability, column (1) shows that they have, as predicted by that theory, positive and statistically significant effects on the firm’s likelihood of having zero leverage. Specifically, the increase of one standard deviation in the level of cash holdings, with the other variables remaining constant, increases by around 26.5pp a firm’s likelihood of having zero leverage, while a similar change in the Growth opportunities and Profitability variables present a lower economic impact (approximately 0.3pp and 2.2pp, respectively). These results are in accordance with the arguments of the financial flexibility theory, whereby firms with high internal liquidity, represented by high cash holdings and profitability and valuable growth opportunities, choose zero leverage to hold on debt capacity, in order to fund future good growth opportunities (Marchica & Mura, 2010; Rapp et al., 2014).
Columns (6)–(8) show that results are quite similar when we use only the extreme terciles of the financial flexibility measures. The positive coefficients of the variables Cash_d, Growth opportunities, and Profitability_d confirm that cash-rich firms, with greater future prospects and profitability, are more likely to adopt zero-leverage policies. Thus, highly financially flexible firms, namely, those in the top tercile of each proxy of financial flexibility, show a greater propensity to be debt-free. Hence, on the basis of these results, hypothesis H2 is validated.
Results for the external determinants of zero leverage
The results for the models including external determinants of zero leverage are reported in Table 7. Using the first model in Table 6 as baseline, the model in column (1) incorporates the Market system dummy variable to control the specific effect of the financial system on zero leverage (hypothesis H3) and the Crisis variable to capture the specific effect of the recent crisis on zero leverage (hypothesis H4). The model in column (2) adds the interaction variable Market × Crisis, which allows testing whether the effects of the crisis depend on the financial system of the country (hypothesis H5). In columns (3)–(4), the Market system variable is replaced by other variables also characterizing or affecting the functioning of the financial system of each country: column (3) considers the Stock market capitalization variable and column (4) the Legal system variable. All models discussed in this section use proxies for countries specificities or for the crisis period and, therefore, country and year dummies are excluded from the regression analysis.
External determinants of zero leverage.
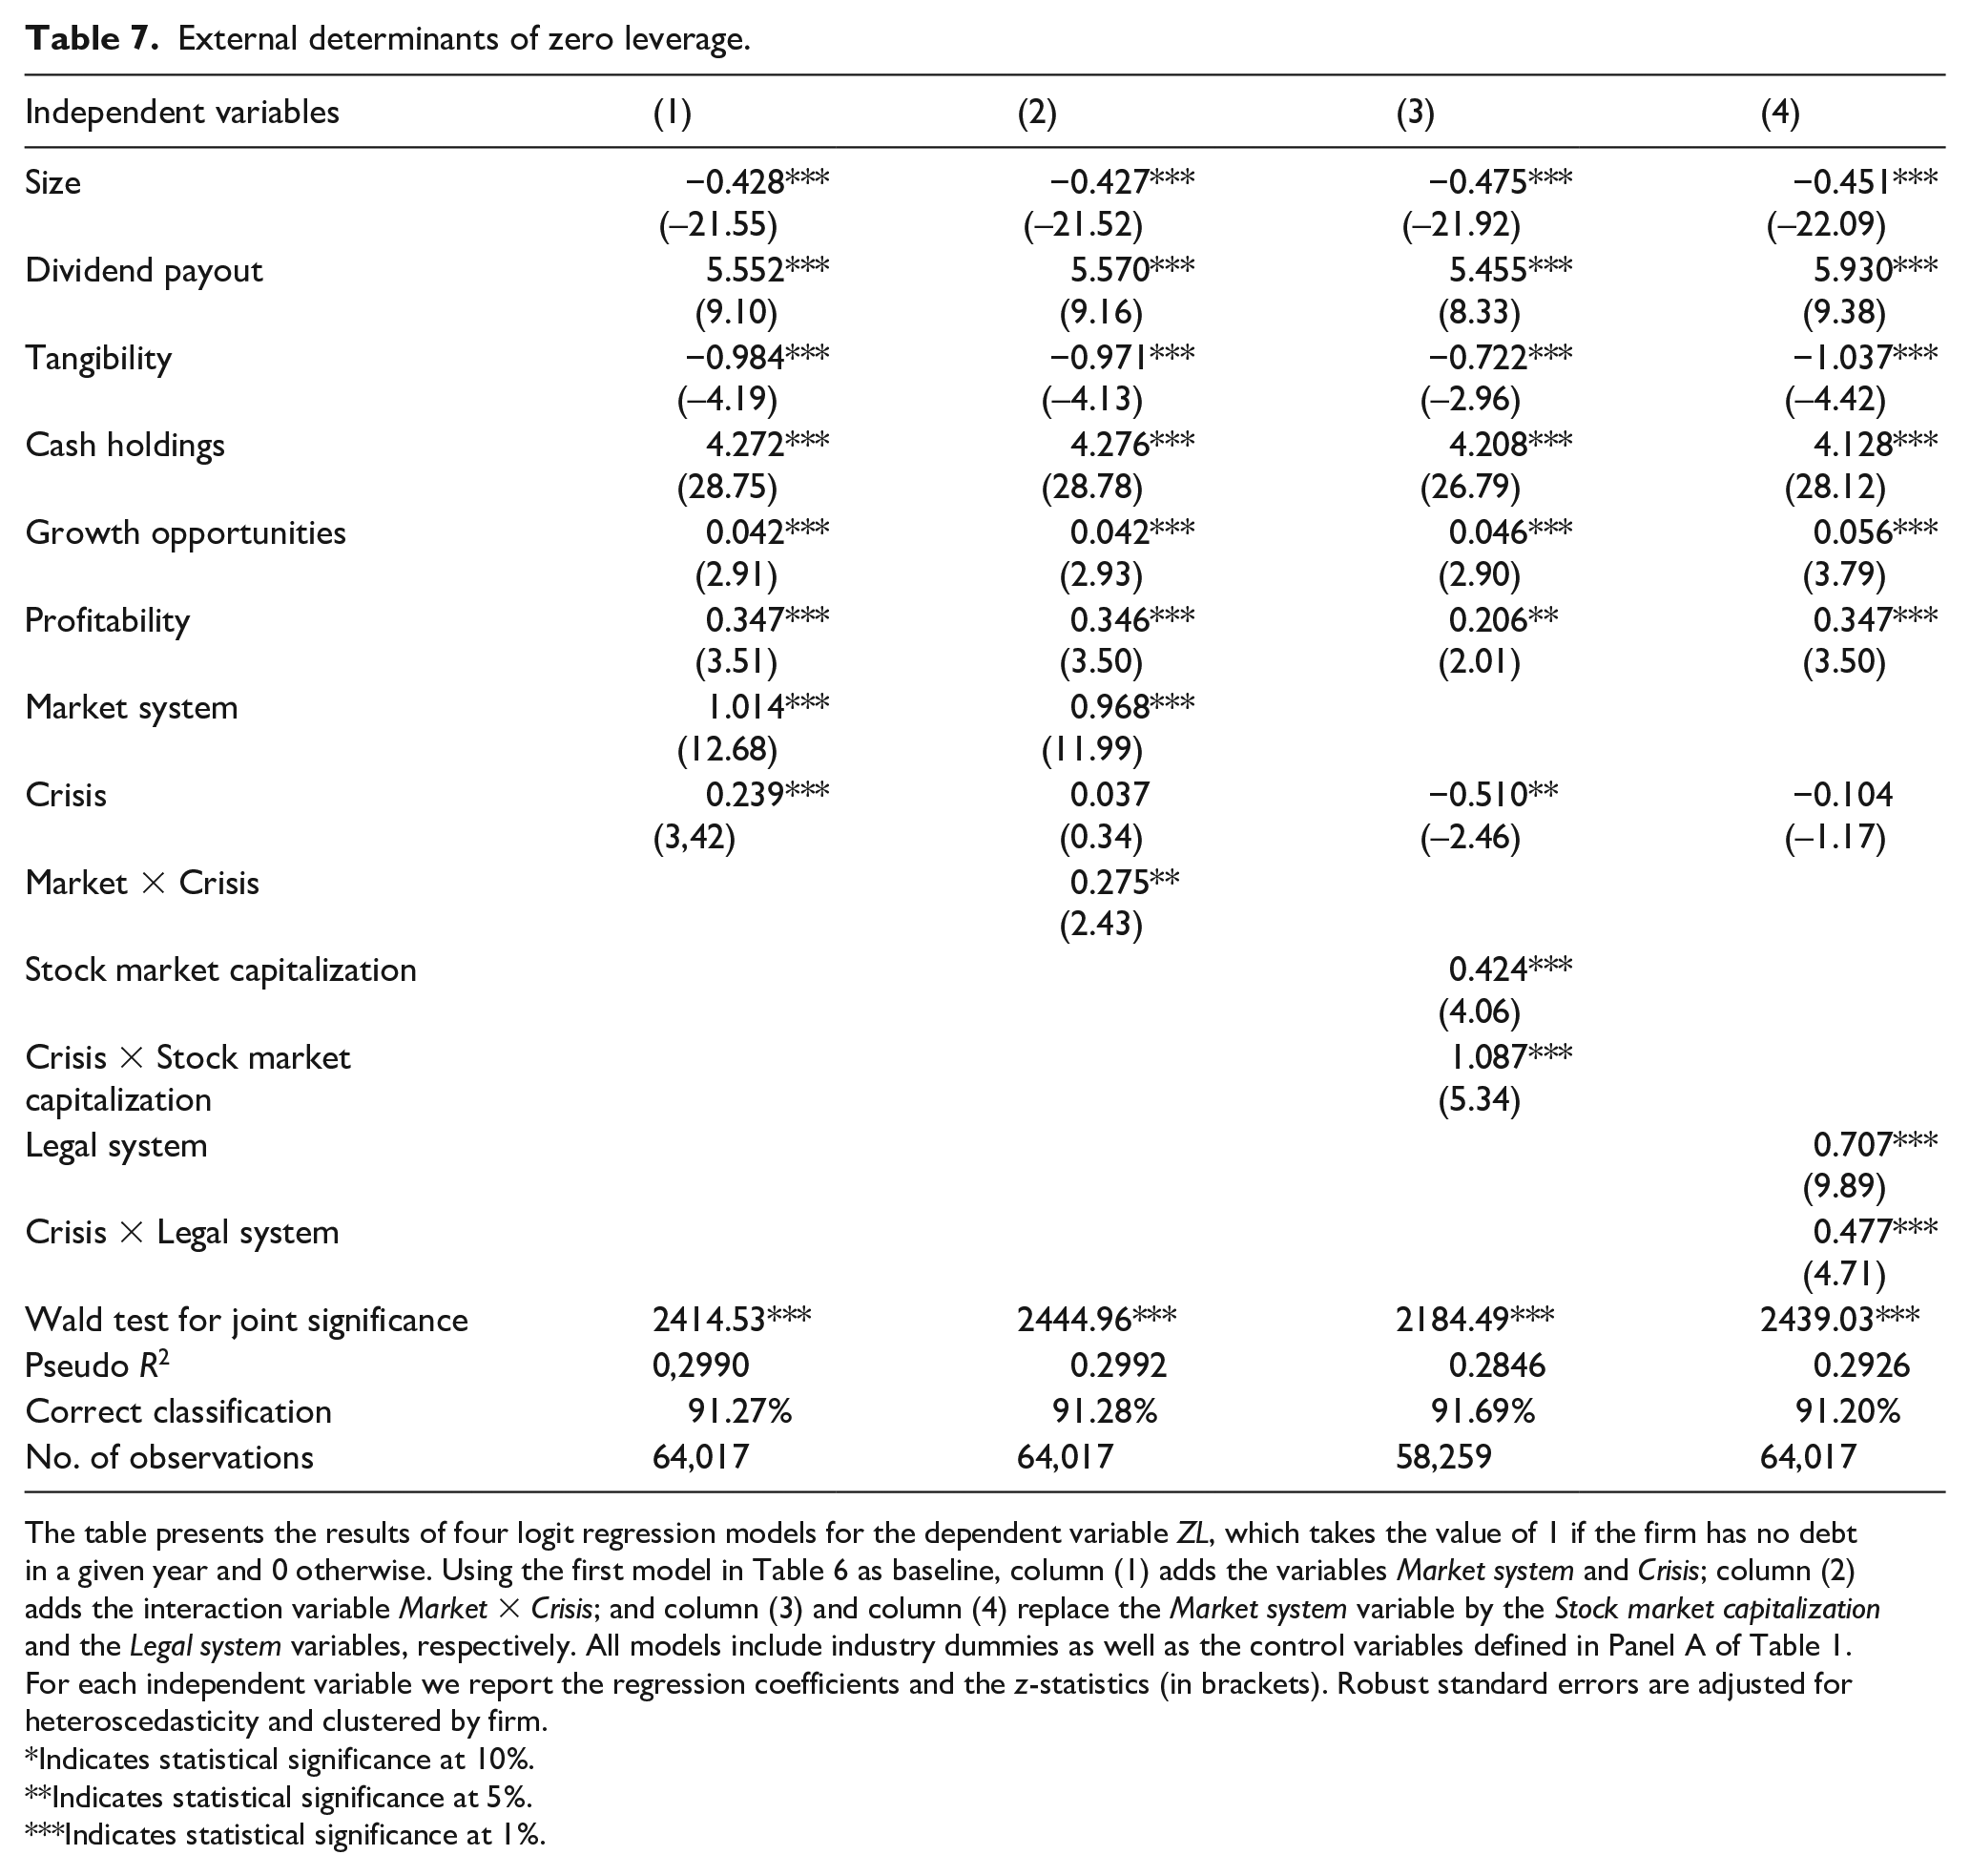
The table presents the results of four logit regression models for the dependent variable ZL, which takes the value of 1 if the firm has no debt in a given year and 0 otherwise. Using the first model in Table 6 as baseline, column (1) adds the variables Market system and Crisis; column (2) adds the interaction variable Market × Crisis; and column (3) and column (4) replace the Market system variable by the Stock market capitalization and the Legal system variables, respectively. All models include industry dummies as well as the control variables defined in Panel A of Table 1. For each independent variable we report the regression coefficients and the z-statistics (in brackets). Robust standard errors are adjusted for heteroscedasticity and clustered by firm.
Indicates statistical significance at 10%.
Indicates statistical significance at 5%.
Indicates statistical significance at 1%.
Focusing on column (1), we confirm the importance of the financial system’s development on zero leverage. The Market system dummy variable has a positive and statistically significant coefficient, implying that a firm located in a European market-based financial system is more likely to have zero leverage, as also found by Ghoul et al. (2018). Specifically, belonging to a market-based financial system rather than to a bank-based one, ceteris paribus, increases by around 6.4pp the firm’s probability of having zero leverage. The results validate hypothesis H3, confirming that firms’ greater dependence on bank finance in bank-based financial systems, as is mostly the case in Europe (Langfield & Pagano, 2016), implies that the likelihood of a firm having zero leverage is lower than in market-based financial systems.
The results on the Crisis dummy variable reveal that, overall, the 2008 financial crisis and the recent sovereign debt crises had a positive and statistically significant effect in explaining zero leverage, and that, during this period, the likelihood of firms adopting zero leverage increased by around 1.5pp. This validates hypothesis H4 and suggests that the recent crises had an impact on decisions related to firms’ capital structure in the European context, implying a greater trend toward zero leverage during this period and corroborating the findings of Morais et al. (2020).
Regarding the joint effects of financial system and financial crisis, see column (2), we find that the coefficient of Market × Crisis is positive and significant. This means that the 2008 crisis had a higher impact on the zero-leverage phenomenon in countries with market-based systems, as postulated by hypothesis H5. Interestingly, the variable Crisis is no longer significant, which implies that zero-leverage propensity was not affected by the 2008 crisis in countries with bank-based systems. In contrast, because the sum of the coefficients associated to the variables Crisis and Market × Crisis is positive (0.312) and significant (p = .000), the 2008 crisis increased the propensity for zero leverage in countries with market-based systems. Therefore, while we cannot reject that the 2008 financial crisis increased the overall propensity for zero leverage, see column (1), we find that such effect is only significant in market-based oriented systems. A possible explanation for these findings is the closer ties between firms and banks that tend to be established in countries with bank-based systems (Leland & Pyle, 1977). Instead of being forced to renounce the use of debt, these firms may benefit from their good relation and partnership with banks to renegotiate credit lines.
Columns (3) and (4) show that using alternative proxies for the country’s specificities do not change our main findings. Column (3) shows that more developed stock markets potentiate the zero-leverage phenomenon and column (4) reveals that firms located in common law countries are more likely to have zero leverage. Because common law countries favor the development of market-based financial systems (Demirgüç-Kunt & Levine, 1999) and having a more developed stock market is a characteristic of such financial systems, these results confirm that European firms located in countries with market-based financial systems are more likely to have zero leverage.
The models in columns (3) and (4) also confirm that the crisis period increased the propensity for zero leverage in countries with market-based systems. In column (3) that effect depends on the sign and significance of the sum of the coefficient of Crisis with the product of the coefficient of Crisis × Stock market capitalization by the variable Stock market capitalization. This sum is only positive and significant for values of Stock market capitalization higher than 0.616 (10% significance level), 0.639 (5%) or 0.680 (1%) and is negative and significant for values lower than 0.218 (10%), 0.146 (5%) or −0.040 (1%). During the crisis period all four market-based countries in our sample displayed a value higher than 0.616 for that variable, implying that the propensity for zero leverage was significantly higher in those years; for most bank-based countries the value of Stock market capitalization was between 0.218 and 0.616 and thus the impact of the global crisis was not statistically relevant; and for Greece the effect of the global crisis even decreased significantly (10% level) the propensity for zero leverage in 2011 and 2012. Regarding the effect of the legal system, see column (4), while the coefficient of Crisis is not significant, the sum of the coefficients associated to the variables Crisis and Crisis × Legal system is positive (0.373) and significant (p = .000), implying that the probability of observing the zero-leverage phenomenon increased significantly during the crisis period in countries with common law systems, but not in those with civil law systems.
Interactions between external and internal zero-leverage determinants
In this section we allow the effect of internal and external determinants of zero leverage to be interrelated. For this purpose, we use as baseline the second model of Table 7, which incorporates all variables relevant for the hypotheses H1 H5 already tested, and add interaction terms between firm’s internal and external determinants of zero leverage. Table 8 displays the results obtained. The model in column (1) includes the interaction variables Market × Cash holdings, Market × Growth opportunities and Market × Profitability, in order to test the joint effects on zero leverage of financial system and financial flexibility (hypothesis H6). To test the joint effects of the 2008 crisis and financial constraints (hypothesis H7), the model in column (2) includes the interaction variables Crisis × Size, Crisis × Dividend Payout and Crisis × Tangibility.
Interactions between firm’s internal and external determinants of zero leverage.
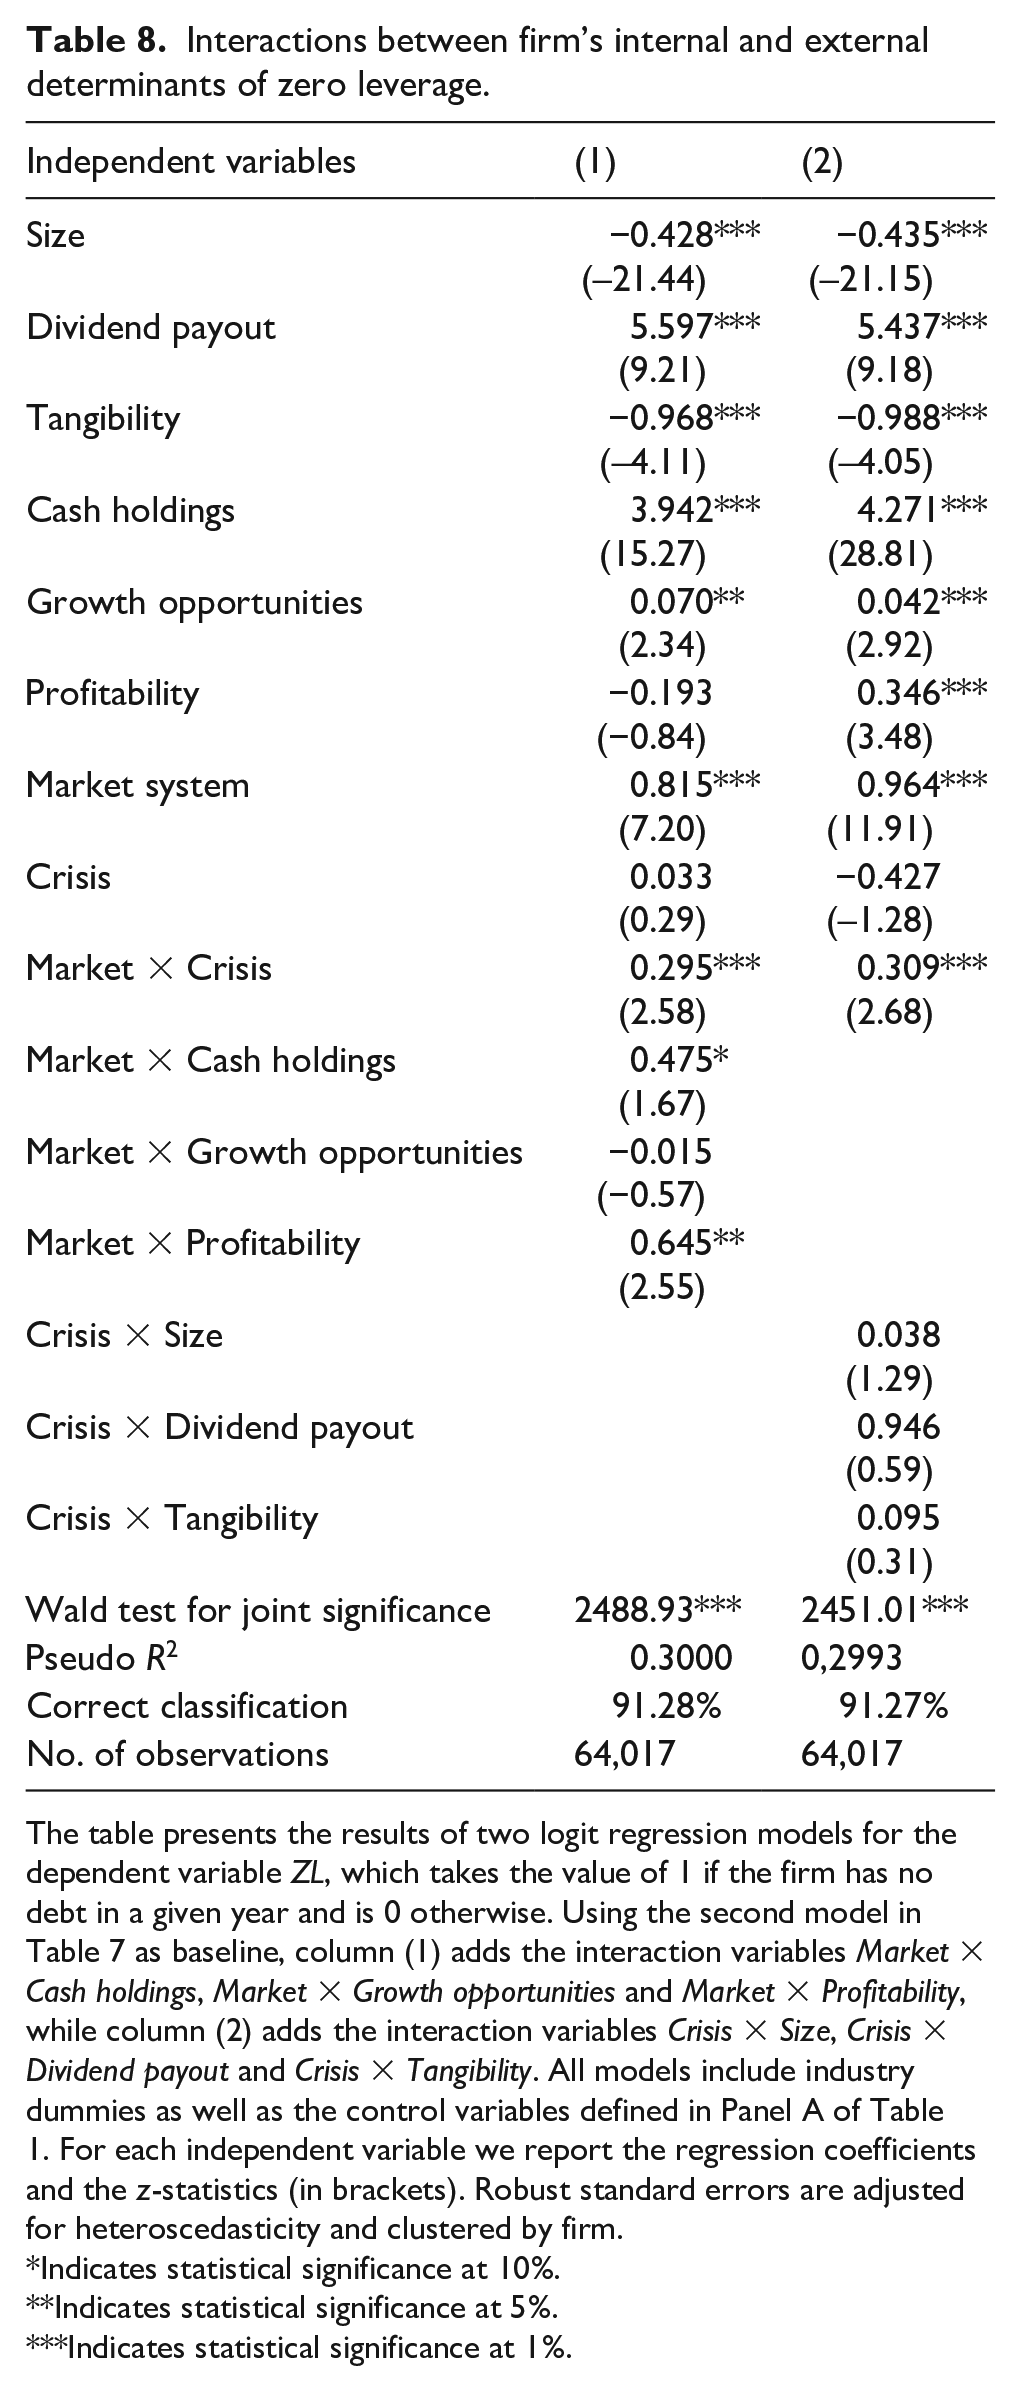
The table presents the results of two logit regression models for the dependent variable ZL, which takes the value of 1 if the firm has no debt in a given year and is 0 otherwise. Using the second model in Table 7 as baseline, column (1) adds the interaction variables Market × Cash holdings, Market × Growth opportunities and Market × Profitability, while column (2) adds the interaction variables Crisis × Size, Crisis × Dividend payout and Crisis × Tangibility. All models include industry dummies as well as the control variables defined in Panel A of Table 1. For each independent variable we report the regression coefficients and the z-statistics (in brackets). Robust standard errors are adjusted for heteroscedasticity and clustered by firm.
Indicates statistical significance at 10%.
Indicates statistical significance at 5%.
Indicates statistical significance at 1%.
According to column (1), we find some evidence supporting hypothesis H6, since only the effect of Growth opportunities is similar in bank- and market-based financial systems. Indeed, the positive and significant coefficient of interaction term Market × Cash holdings shows that firm’s cash ratios have a stronger effect on zero leverage in market- than in bank-based systems. Moreover, Profitability is no longer significant but its interaction with Market system is, which implies that firm profitability has a significant and positive effect on the probability of a firm having zero leverage (sum of the coefficients = .452, p = .0000) only in market-based systems. Therefore, as hypothesized, firms located in market-based financial systems, by having a wider range of alternative funding sources, are more prone to use their profits and internal liquidity to preserve debt capacity to fund future investments.
In contrast, in column (2) we find that none of the coefficients relative to the interaction variables where Crisis is present is significant, which means that the effects of the variables proxying financial constraints were similar in crisis and non-crisis periods. This suggests that eventual increases in the likelihood of zero leverage during the crisis period were not the consequence of additional restrictions imposed by creditors to grant debt to more constrained firms, but probably firms’ own decision, which corroborates previous findings by Kahle and Stulz (2013) and Morais et al. (2020) that the 2008 crisis reduced firm’s debt levels primarily by demand and not by supply-side reasons. Thus, hypothesis H7 is rejected.
Robustness tests
This section considers several departures from the model reported in the second column of Table 7 to evaluate the robustness of our results. 9 First, alternative dependent variables are used. Second, alternative econometric models (probit, random effects, fixed effects) are estimated. Third, models appropriate to deal with potential omitted variable bias and endogeneity issues are considered.
Table 9 presents the results for the models that use alternative dependent variables to ZL for measuring debt conservatism. The models in columns (1) and (2) replace ZL by, respectively, the AZL and ZL3 variables defined in Table 1. These alternative measures of financial conservatism allow us to examine the determinants of, respectively, low debt levels (Strebulaev & Yang, 2013) and persistent zero-leverage policies (Devos et al., 2012). Columns (3) and (4) consider only long-term debt and short-term debt, respectively, to classify a firm as having zero leverage, instead of total debt as in the base model. In all cases, the results are quite similar to those found before for the base case.
Robustness tests using alternative dependent variables.
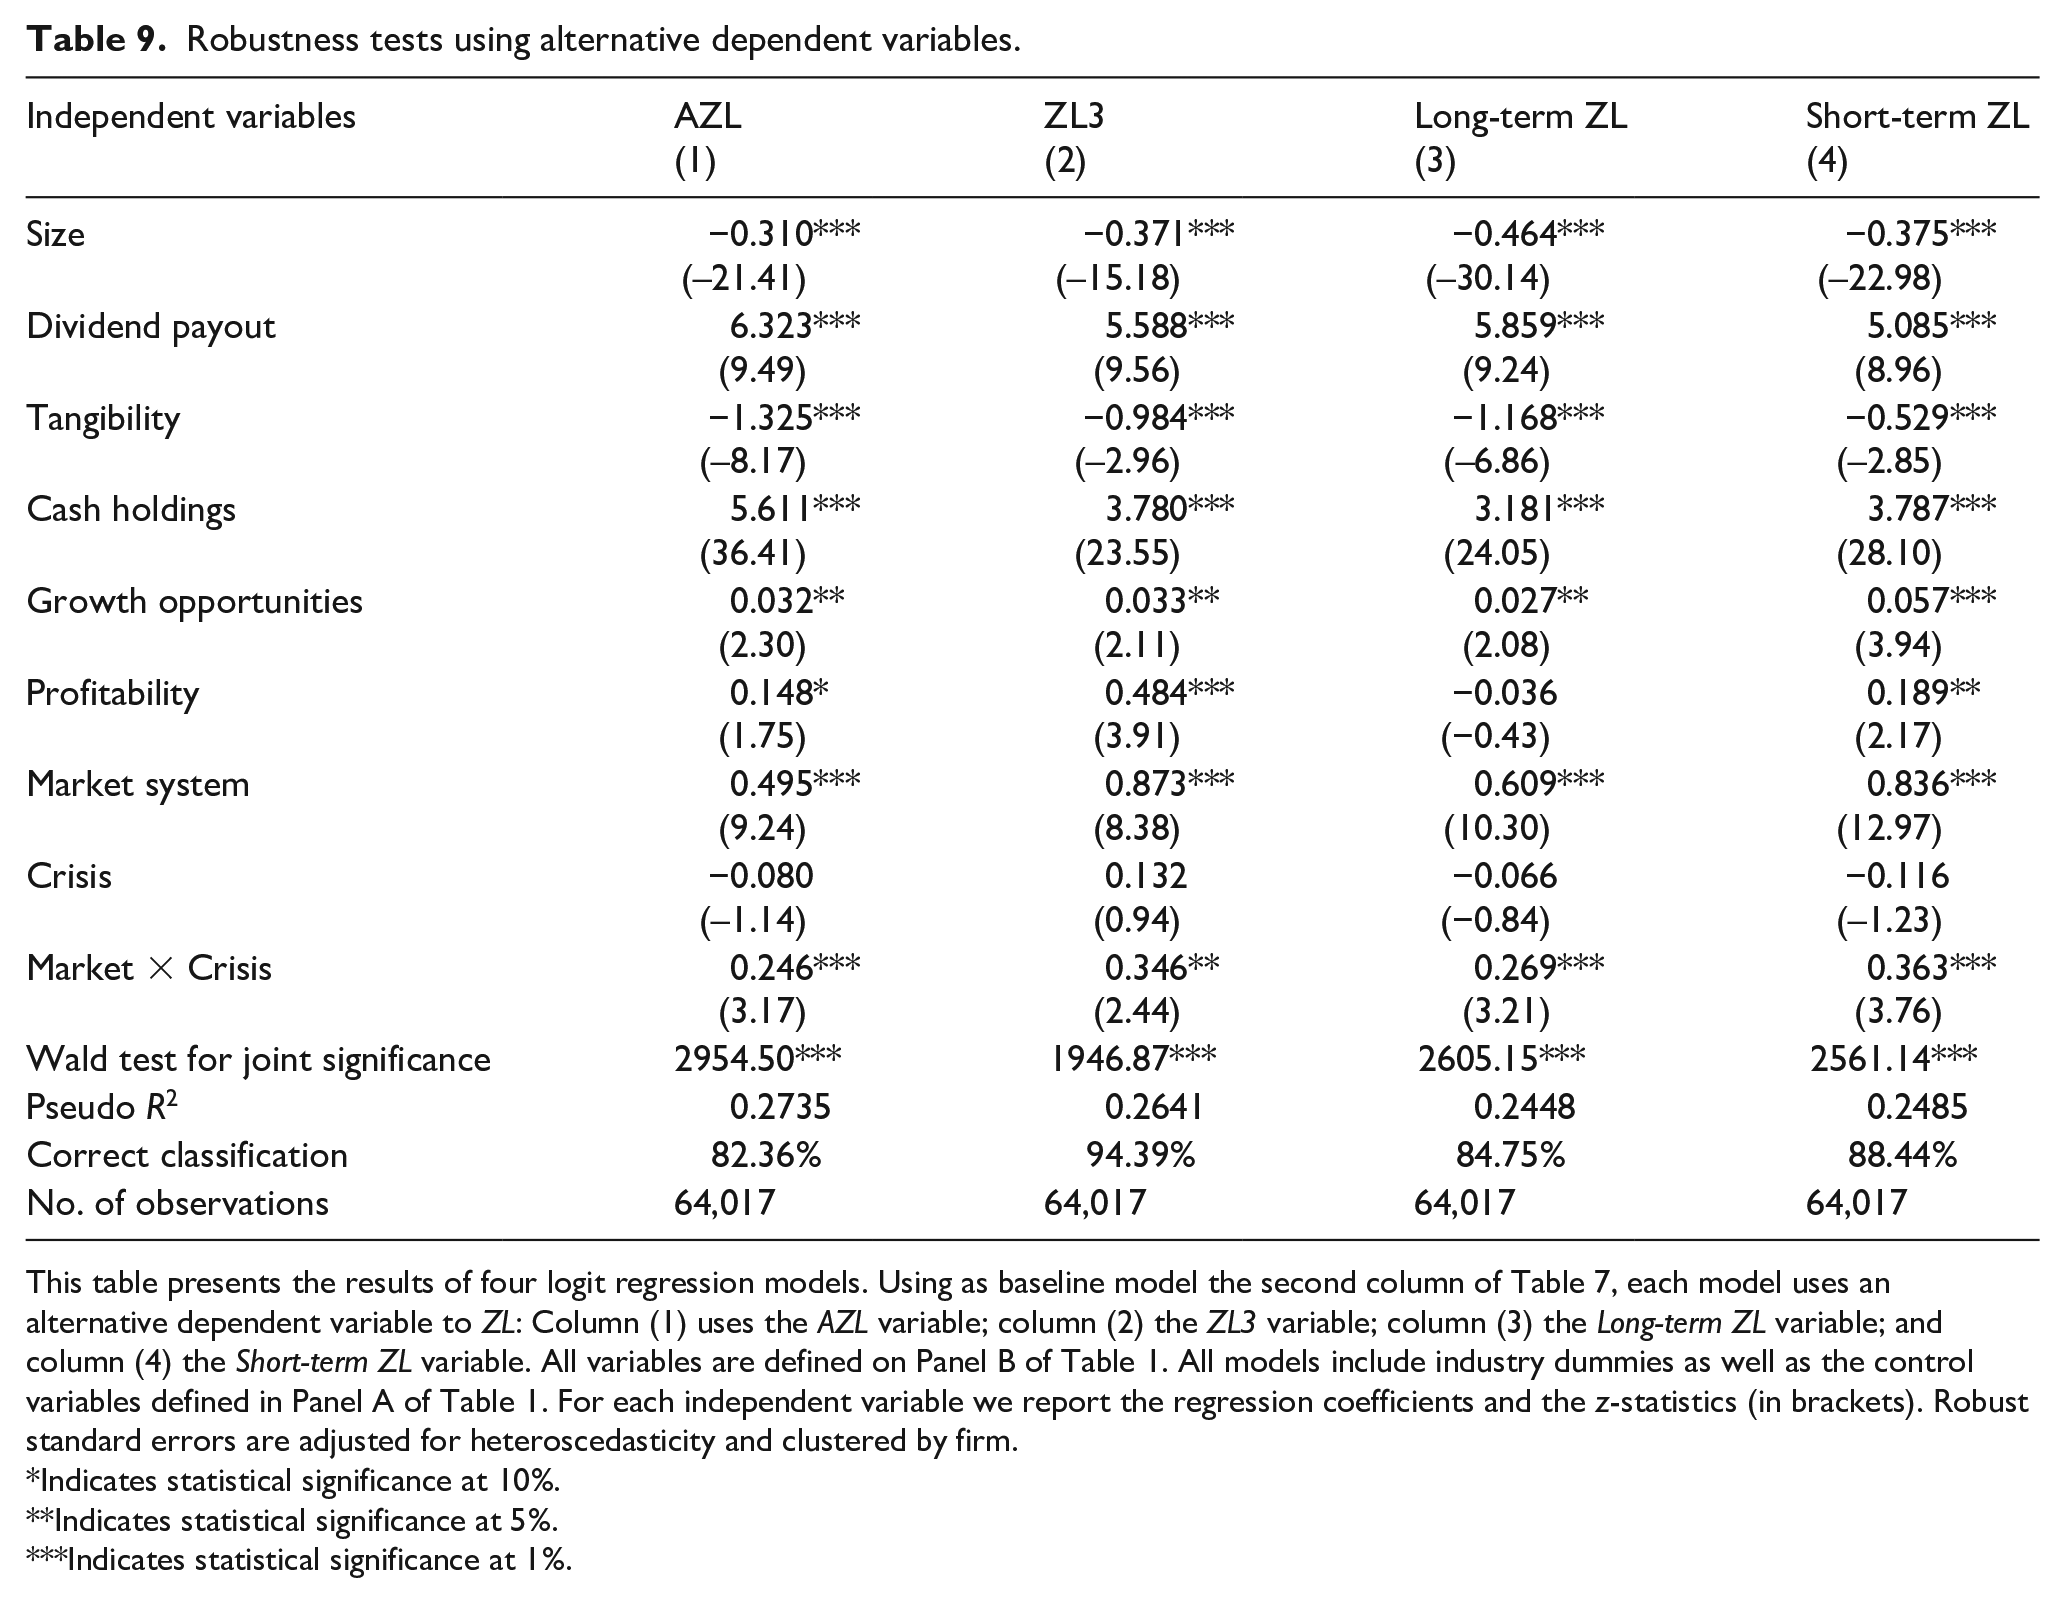
This table presents the results of four logit regression models. Using as baseline model the second column of Table 7, each model uses an alternative dependent variable to ZL: Column (1) uses the AZL variable; column (2) the ZL3 variable; column (3) the Long-term ZL variable; and column (4) the Short-term ZL variable. All variables are defined on Panel B of Table 1. All models include industry dummies as well as the control variables defined in Panel A of Table 1. For each independent variable we report the regression coefficients and the z-statistics (in brackets). Robust standard errors are adjusted for heteroscedasticity and clustered by firm.
Indicates statistical significance at 10%.
Indicates statistical significance at 5%.
Indicates statistical significance at 1%.
Table 10 presents results from four alternative econometric methods. columns (1), (2), (3), and (4) are estimated using, respectively, Random-effects Logit, Fixed-effects Logit, Pooled Probit, and Random-effects Probit methods. 10 Again, our main findings are robust to the estimation method applied, since the only explanatory variable that lost significance (in two out of the four models) was Growth opportunities and the other two proxies for financial flexibility kept theirs.
Robustness tests using alternative econometric methods.
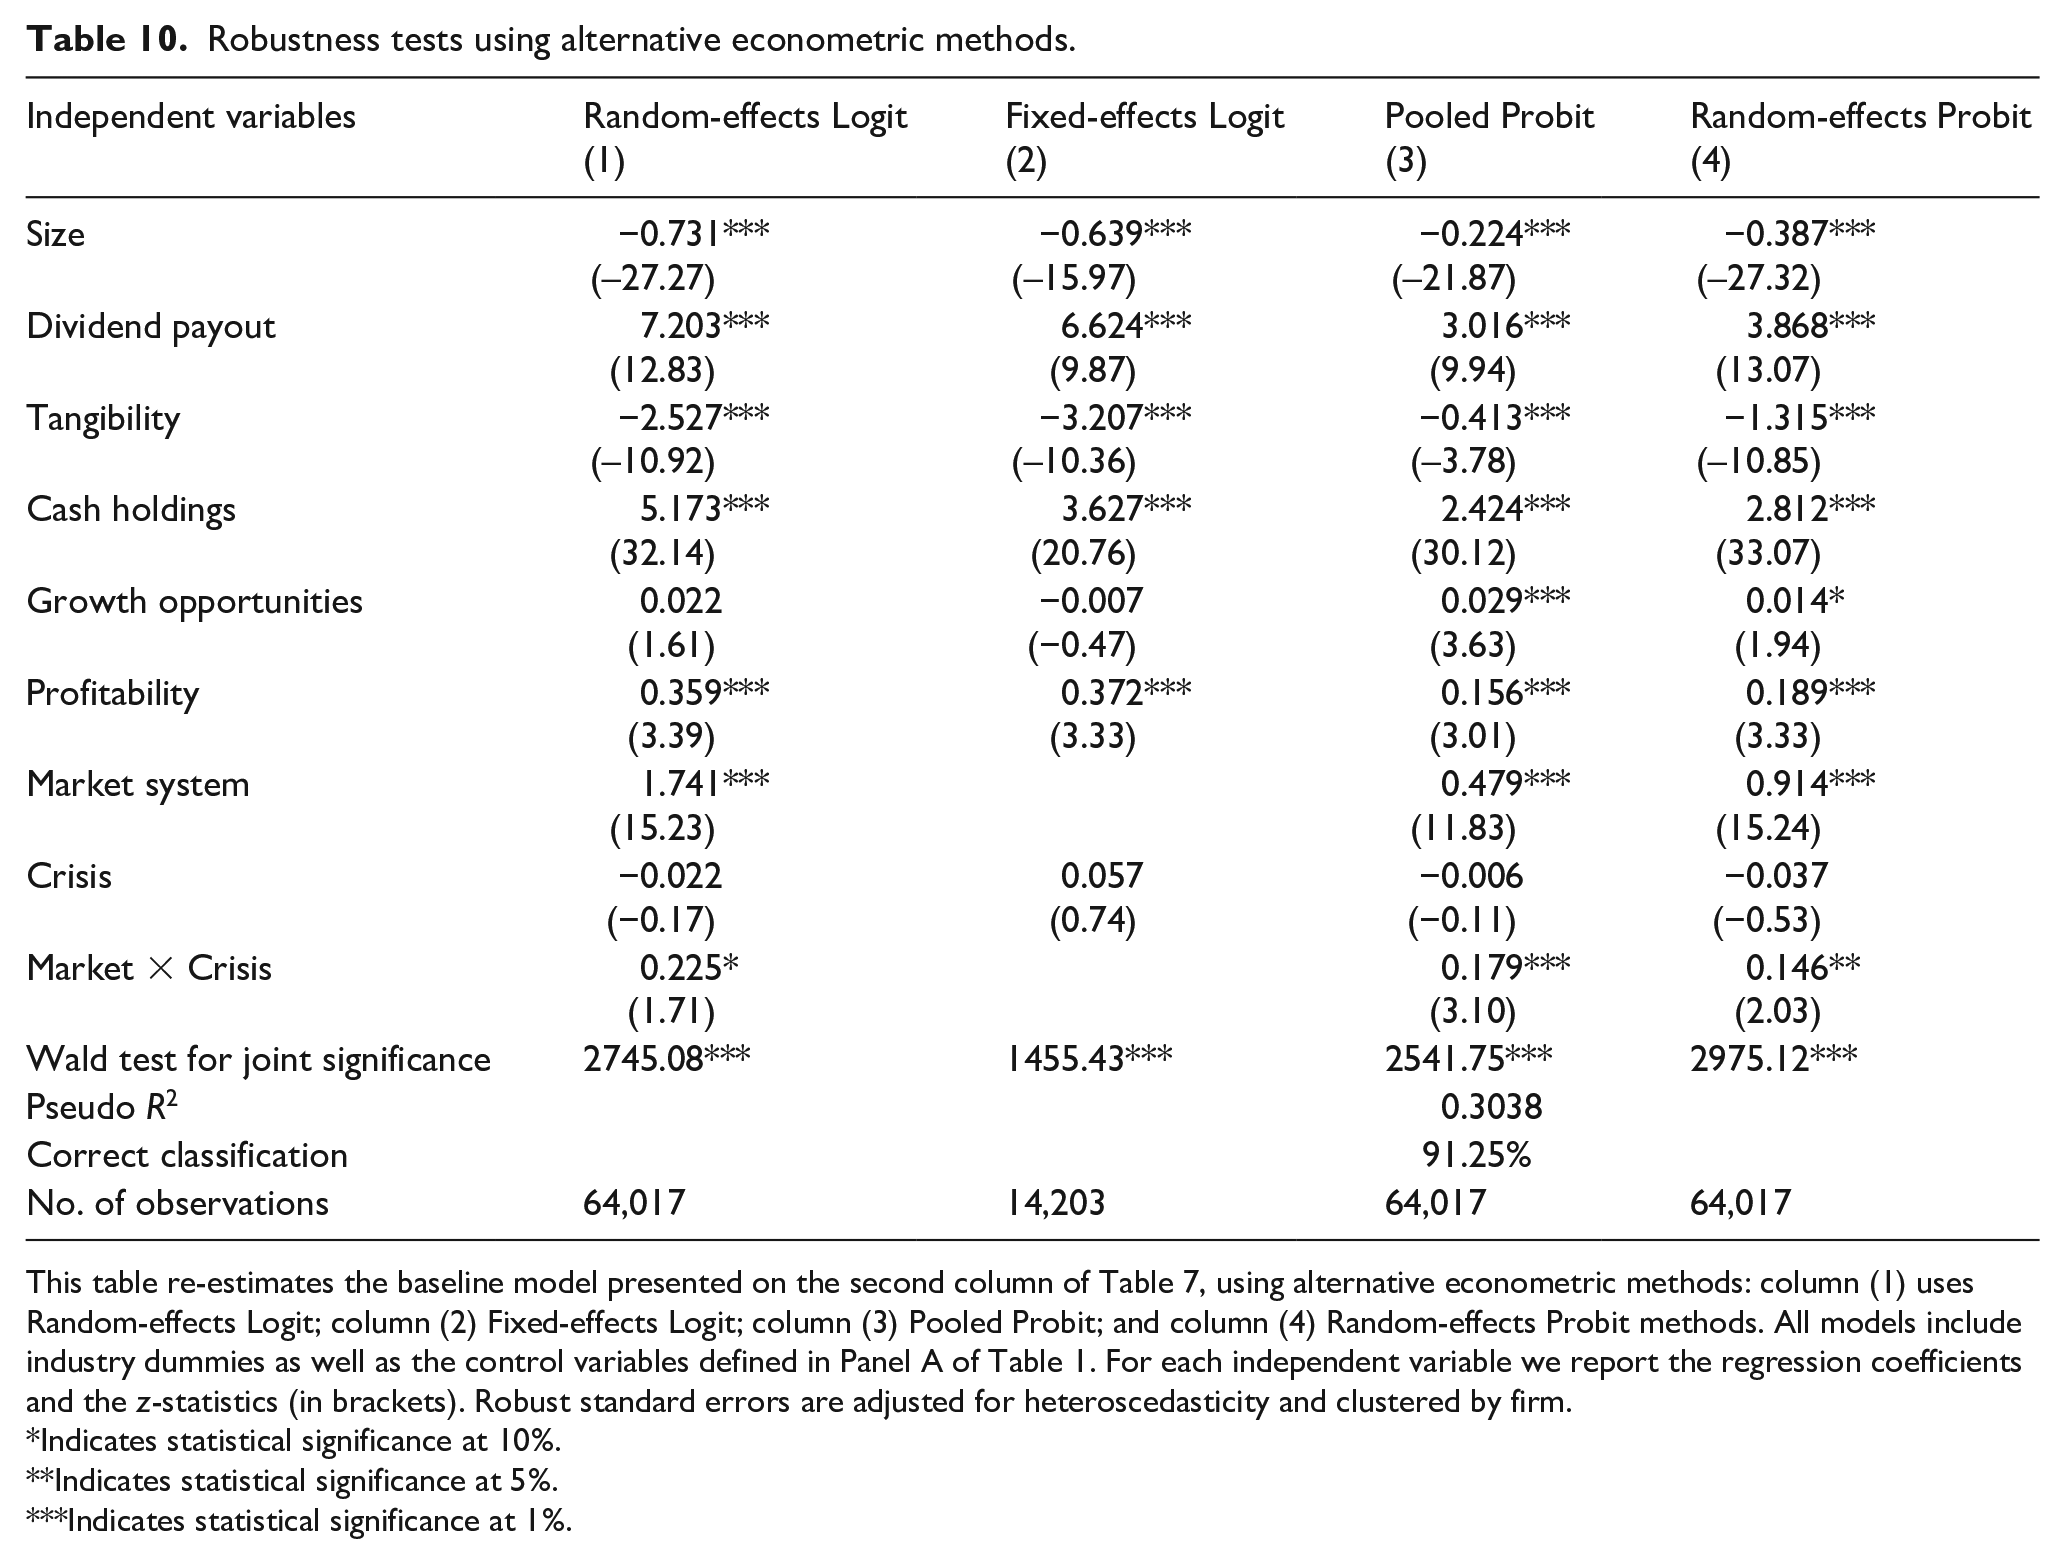
This table re-estimates the baseline model presented on the second column of Table 7, using alternative econometric methods: column (1) uses Random-effects Logit; column (2) Fixed-effects Logit; column (3) Pooled Probit; and column (4) Random-effects Probit methods. All models include industry dummies as well as the control variables defined in Panel A of Table 1. For each independent variable we report the regression coefficients and the z-statistics (in brackets). Robust standard errors are adjusted for heteroscedasticity and clustered by firm.
Indicates statistical significance at 10%.
Indicates statistical significance at 5%.
Indicates statistical significance at 1%.
Finally, recognizing that endogeneity is a real problem in corporate empirical finance due to omitted variables and reverse causality, we consider, in Table 11, five further models that try to mitigate the effects of potential endogeneity issues. First, in Panel A we consider models with additional control variables, which have not been considered in our main models because they have been rarely used in zero-leverage studies (Short-term liabilities other than debt and lagged ZL), we could not get good measures of it (firm’s Age—see footnote 3) or its utilization implies a substantial loss of observations (corporate governance measures). The model in column (1), which adds the Short-term liabilities and Age variables in order to control for the influence of firm’s non-interest liabilities and maturity on its overall debt demand and capacity, does not change our main findings. The model in column (3), which accounts for the persistence of zero-leverage policies, also produces similar conclusions. Column (2) reports the results for the model that recognizes that, because debt may be used as a mechanism to control for their possible opportunistic actions, managers may by tempted to follow a zero-leverage policy. None of the additional controls considered, three board-specific measures (Board size, Board independency, and CEO duality) and a measure of ownership structure (Ownership concentration), are statistically significant, probably due the considerable loss of observations (almost 90%) originated by their presence in the model. Probably for the same reason, although no opposite results to our previous findings were found, some explanatory variables lost their significance.
Robustness tests controlling for endogeneity problems.
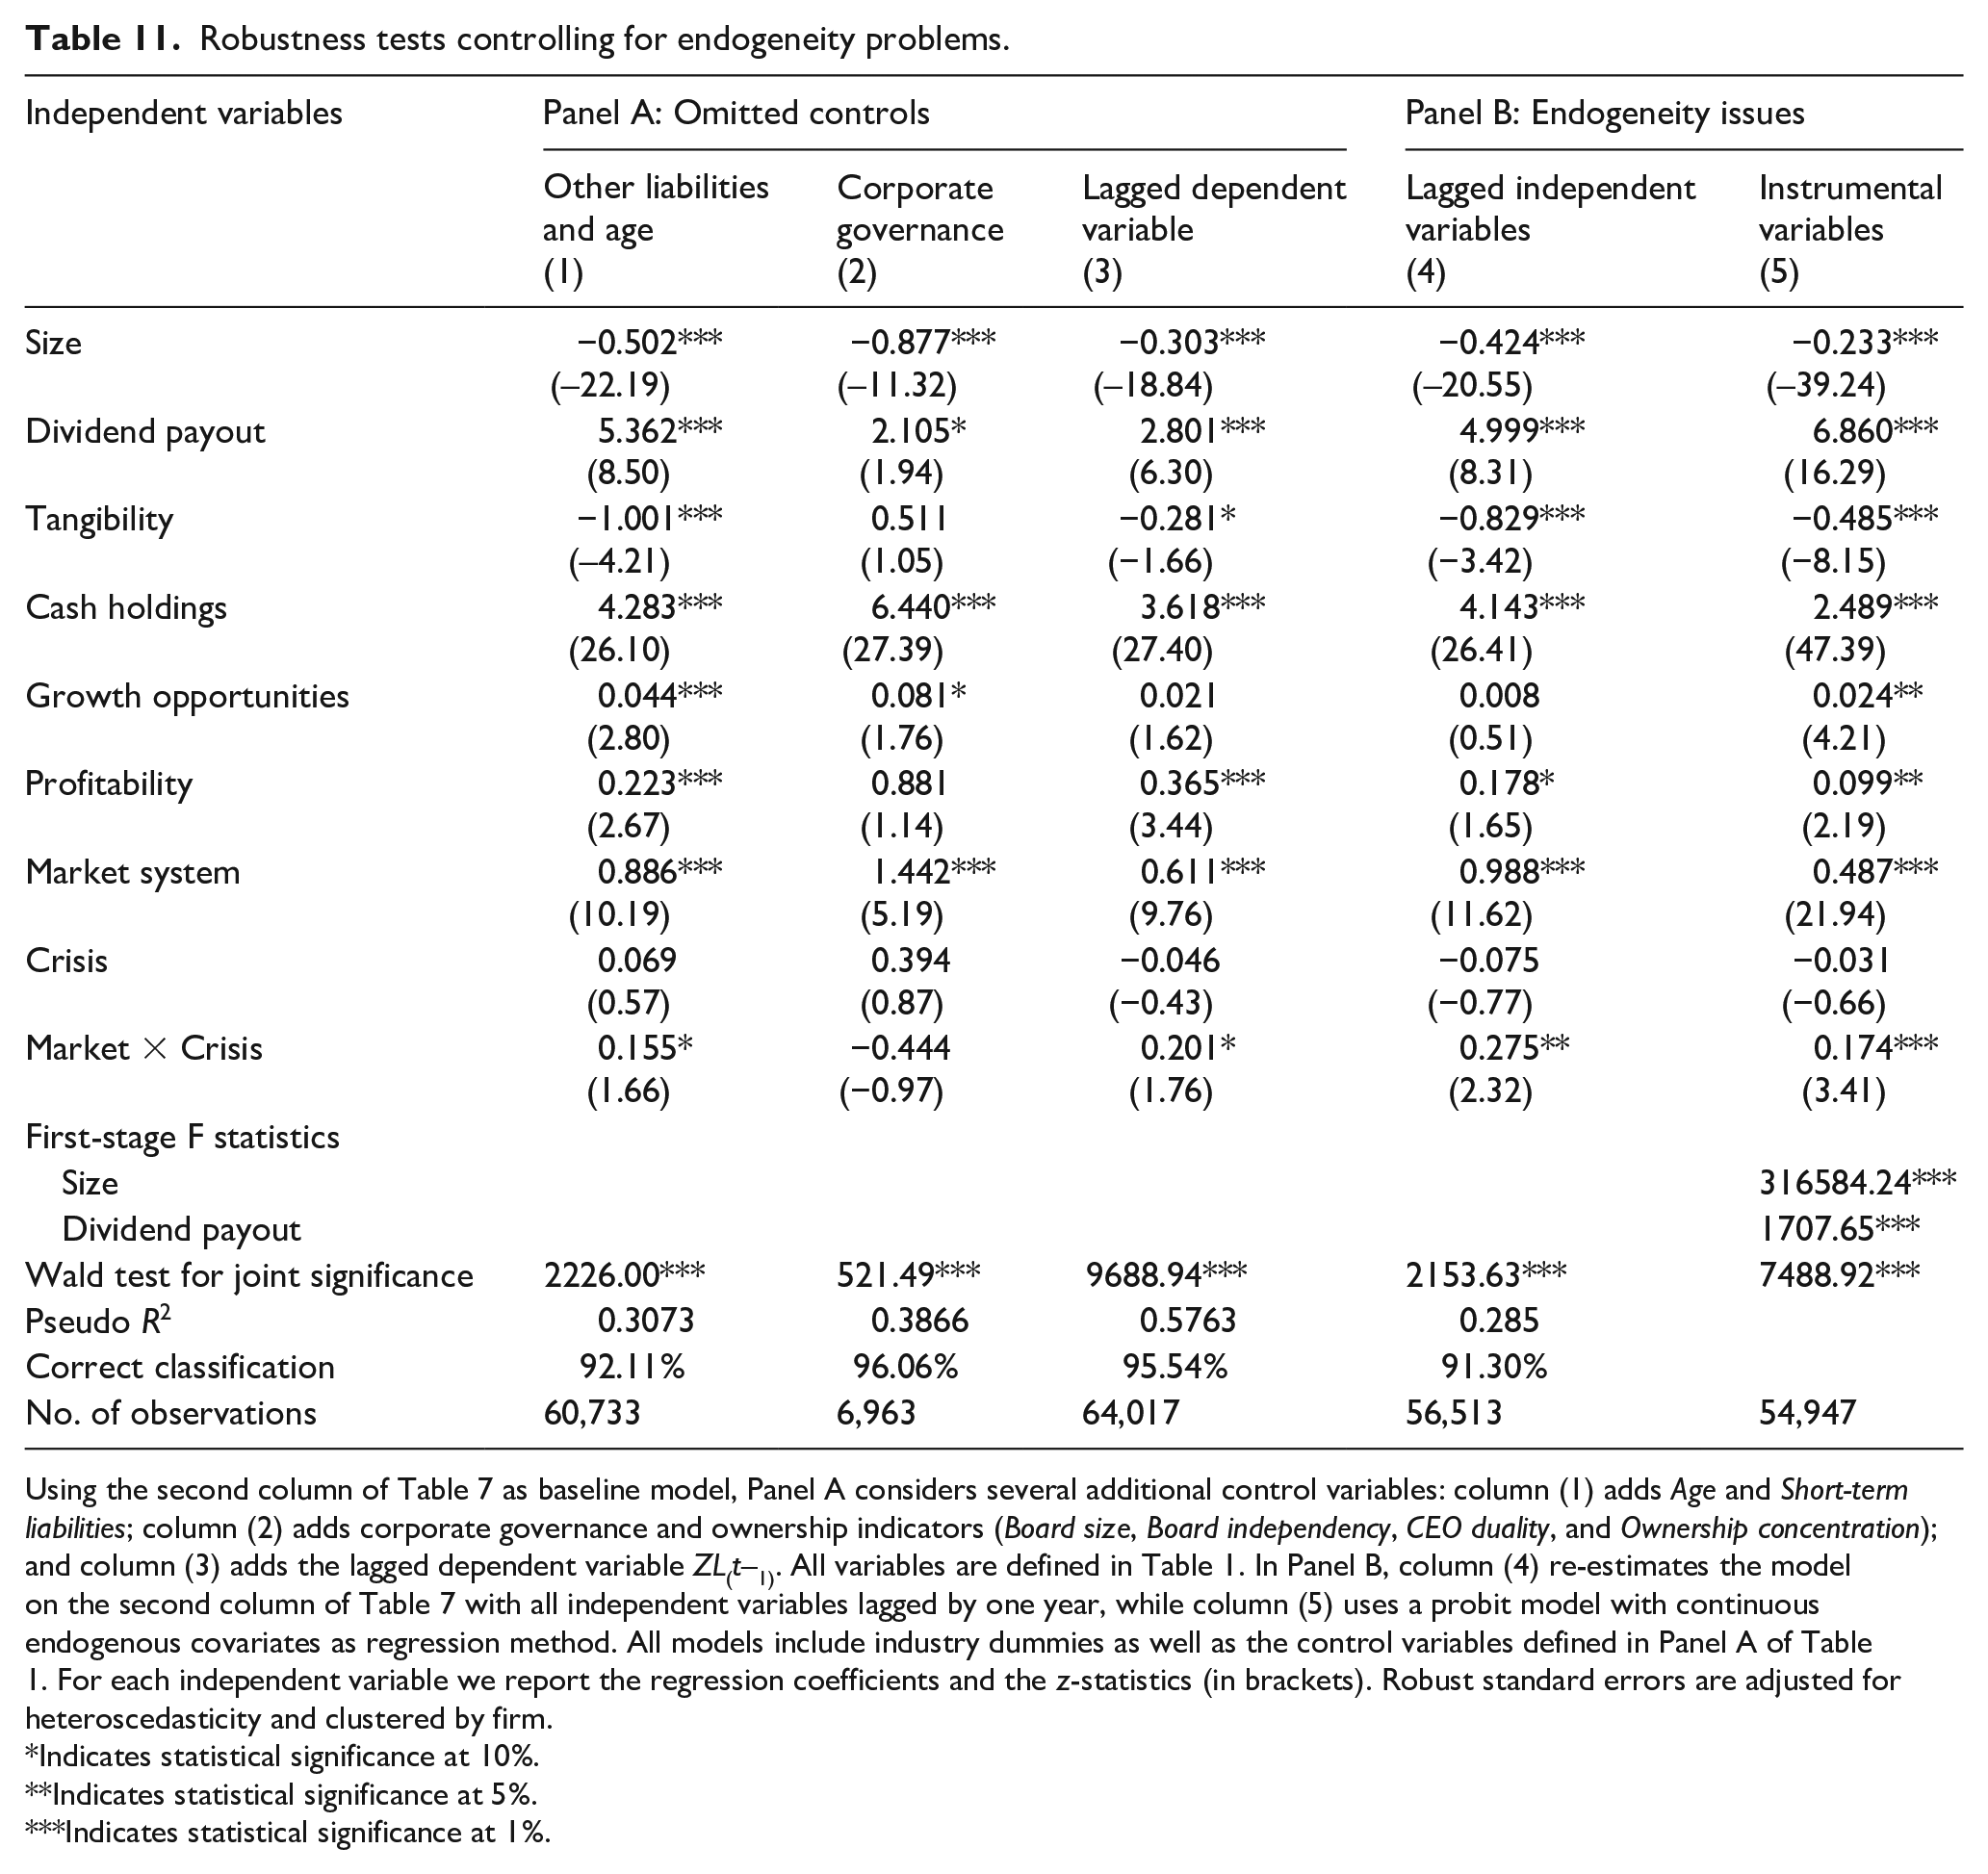
Using the second column of Table 7 as baseline model, Panel A considers several additional control variables: column (1) adds Age and Short-term liabilities; column (2) adds corporate governance and ownership indicators (Board size, Board independency, CEO duality, and Ownership concentration); and column (3) adds the lagged dependent variable ZL(t–1). All variables are defined in Table 1. In Panel B, column (4) re-estimates the model on the second column of Table 7 with all independent variables lagged by one year, while column (5) uses a probit model with continuous endogenous covariates as regression method. All models include industry dummies as well as the control variables defined in Panel A of Table 1. For each independent variable we report the regression coefficients and the z-statistics (in brackets). Robust standard errors are adjusted for heteroscedasticity and clustered by firm.
Indicates statistical significance at 10%.
Indicates statistical significance at 5%.
Indicates statistical significance at 1%.
In panel B, column (4), similarly to previous empirical studies on debt conservatism that deal with endogeneity concerns, we lag all independent variables by one year (e.g., Bessler et al., 2013; Ghoul et al., 2018). Alternatively, in column (5) we consider an instrumental variables approach to deal with possible reverse causality between debt and firm size and dividend payments. 11 Indeed, debt-free firms may be foregoing the opportunity to finance their investment opportunities at a lower cost and hence may invest less and present lower size; and firms with debt contracts may face covenants requiring low or no dividend payments and hence zero-leverage firms may be more prone to pay higher dividends. Considering the binary nature of the dependent variable, the model in column (5) is based on the probit model with continuous endogenous covariates proposed by Newey (1987). It assumes Size and Dividend payout to be endogenous and uses the first lag of the remaining firm-specific variables as instruments. The first-stage F statistics show that the selected instruments are correlated with both Size and Dividend payout. 12
Again, the only explanatory variable that loses significance, and only in one case, is Growth opportunities and hence our main findings are not changed.
Conclusion
This article analyses the zero-leverage phenomenon in Europe, a continent greatly dominated by bank-based financial systems. During the 1995–2016 period, 10.84% of the observations in our sample of listed firms corresponded to debt-free firms. This figure is slightly lower than that reported in most previous studies, but it hides a great heterogeneity among countries. Indeed, we find that the financial system has a great relevance for the distribution of debt-free firms: while, on average, around 16% of the observations recorded in market-based financial systems correspond to debt-free firms, the corresponding figure recorded in bank-based financial systems is only about 6%. Moreover, while in market-based financial systems zero leverage presents a clear upward trend, in bank-based financial systems the percentage of debt-free firms increased less than 1pp between 1996 and 2016.
The importance of the financial system for the explanation of the zero-leverage phenomenon is reinforced by the results of our econometric analysis. After controlling for many other factors, we find that firms located in countries with market-based systems have a significant higher probability of being debt-free. We also find that the recent European financial and sovereign crises promoted firm’s zero leverage by significantly increasing the probability of a firm being debt-free, both in terms of short- and long-term debt, but this effect seems to have been limited to countries with a market-based system. Finally, we found some support that the financial flexibility hypothesis, which argues that firms may be debt-free by their own choice, seems to be a more relevant explanation for zero leverage in market-based systems, probably due to the wider range of funding options that are available in countries with that system.
An active research topic in the zero-leverage literature is whether it results mainly from frictions and impositions created by the financial market or from firms’ own financing decisions. We found that debt-free firms in Europe tend to be smaller and less profitable and to have fewer tangible assets. However, they display higher levels of cash holdings and growth opportunities and pay more dividends than leveraged firms. This shows that neither the financial flexibility nor the financial constraints approaches can explain entirely the zero-leverage phenomenon, with both of them being useful to explain the zero-leverage policies of particular groups of firms. We also found that the financial constraints approach did not gain importance during the crisis period.
In addition to contributing to the scientific literature on zero leverage, our article also has some interesting implications for practitioners, managers and government entities. For example, given that for some firms zero leverage is an imposition of the financial market, it would be important for firms located in countries with market-based systems to develop closer ties with banks and/or to focus on the creation of a financial slack that could prepare them better for periods of uncertainty. Both measures would result in a greater willingness of creditors to make credit available, in better conditions, to those firms, allowing them to keep their investment plans through periods of deteriorated credit conditions. Interesting topics for future research are, inter alia, the comparison of the performance of debt-free and leveraged firms and investigating the existence, or not, of target debt ratios for both groups of firms. The development and application of suitable methods to deal with multiple endogenous variables in the framework of the probit model, together with the search for potentially better instruments than those used in our study, are another important avenue for future research.
Footnotes
Acknowledgements
The authors thank the Associate Editor, Ignacio Requejo, and two anonymous referees for their valuable comments and suggestions on previous versions of this paper.
Declaration of conflicting interests
The author(s) declared no potential conflicts of interest with respect to the research, authorship, and/or publication of this article.
Funding
The author(s) disclosed receipt of the following financial support for the research, authorship, and/or publication of this article: Financial support from Fundação para a Ciência e a Tecnologia (FCT) is gratefully acknowledged (grant no. SFRH/BD/119851/2016).