
Abstract
This study aims to document the impact of oil price variations on generating stock returns in Gulf Cooperation Council (GCC) markets during the COVID-19 era. It documents the pandemic era results from January 2020 to October 2022 by employing cointegration, Granger causality, and time-varying coefficient-vector autoregression techniques on daily data. The findings suggest two-way causality between all stock indices and the oil market. Time-dependent relationships were observed during the review period. The findings (based on regression and variance decomposition) indicate that although the reliance of the GCC stock markets was not on oil alone, oil had a significant impact during the study period. It is recommended that investors not consider diversifying portfolios in GCC stocks and oil markets to optimize benefits. The findings are expected to enhance the understanding of academics, market players, regulators, and investors regarding relationships among GCC stocks and oil markets. This study contributes to the literature by documenting the impact of the oil market on stocks during an abnormal period of the COVID-19 pandemic, considering time-varying parameters in a net oil exporting region.
Introduction
The humanity has passed through a severe pandemic that has spread through deadly coronaviruses. The coronavirus disease 2019 (COVID-19), a global pandemic, has contributed significantly to threats to human existence on Earth biologically and economically. Due to COVID-19 restrictions (including social distancing, other specific protection measures, and, in extreme cases, country lockdowns), economic activities were paralyzed in multiple regions by varying degrees of severity and increased health-related expenditures. The economic losses of countries reached USD trillions, in addition to millions of deaths due to the pandemic. According to an estimate, by May 2023, close to 687 million people were infected with the virus, and approximately 7 million people died due to COVID-19, while the United Nations estimated a global loss of economic output of $8.5 trillion due to the pandemic (United Nations, 2023).
The pandemic has posed specific challenges for economic management at the personal and economy levels. Oil consumption plays a significant role in modern economies, covering almost every sector directly or indirectly (including industry, services, and agriculture). Hence, the modern economy’s gross domestic product (GDP) depends to an extent on the availability and consumption of petroleum products. Although renewable alternative energy sources are explored and limited usage is in practice, the share of petroleum as an energy source is significant for economic growth. Management of the supply chain of such a vital resource as needed by the economy is essential to avoid negative implications for other related economic sectors—leading to jeopardizing the goal of economic growth and development. Like any other commodity, demand and supply imbalances lead to oil price fluctuations, with different implications for net oil exporting and importing countries. A negative oil price shock benefits the net oil importer (lower cash outflow) and vice versa.
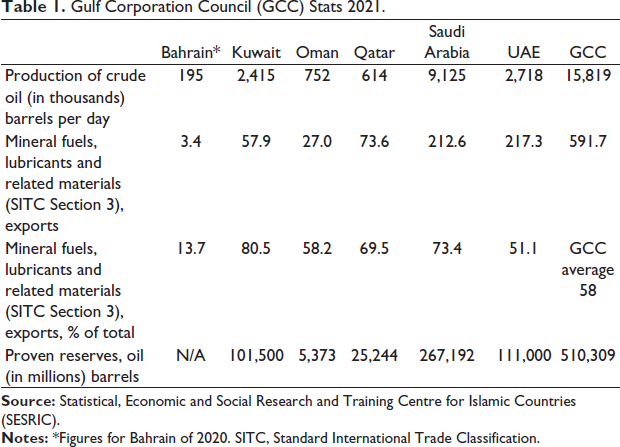
The Gulf Cooperation Council (GCC) region of six Arab countries is one of the leading oil producers and exporters. One of the significant contributions to GCC economies is from the oil sector. Although efforts to diversify economies aimed at reducing reliance on the oil sector are underway in multiple GCC countries, the significance of black gold cannot be undermined, as depicted by the statistics presented in Table 1. For all GCC economies except Bahrain, export earnings from oil-related products were greater than 50% of the total for 2021. According to an estimate, GCC countries represent approximately 34% of the world’s estimated proven crude reserves (Al Suwailem and Aldayel, 2020).
Gulf Corporation Council (GCC) Stats 2021.
Measuring, recording, and understanding the economic implications of oil price movements are essential for optimal resource management and utilization. Stock market responses to variations in oil prices might be an option to address this issue, given that they are an indicator of economic activity. Theoretically, the expected responses of the market index to oil price shocks differ for oil-importing and oil-exporting economies. Some empirical support exists for this assertion. For example, higher cash inflows increase demand for stocks, leading to a positive correlation between the market index and oil price movements (Bass, 2017; Alzyoud et al., 2018), while an increase in the cost of production leads to a negative association between oil price variations and stock markets in net oil-importing economies (Chang et al., 2019). However, such a relationship might be negative in the oil-exporting economy due to the diversion of funds from stocks to oil commodities, given that the oil market is also an investment avenue. In addition, demand-push inflation in oil prices signals greater economic activity, which may lead to demand for stocks in the net oil-importing economy, resulting in a positive association between stocks and the oil market. Hence, the direction of the relationship between the stock market index and oil prices needs to be documented for a particular market through empirical study.
The empirical literature hints at co-movements and independence between stock and oil markets. However, evidence supporting independence in movements (Aydogan and Berk 2015; Anyalechi et al., 2019) is far less than the evidence in favor of the association of both markets (e.g., Lamouchi and Alawi, 2020; Ewing & Malik, 2016; Hanif, 2020; Ahmad, 2019; Shirazi & Meibodi, 2020). Additionally, in the case of the association between oil and stock markets, the literature documents negative (Filis et al., 2011; Partalidou et al., 2016) as well as positive (Hanif, 2020; Santillán-Salgado et al., 2017; Shirazi & Meibodi, 2020) relationships. Empirical studies on the association between oil prices and stock markets have been conducted in multiple regions, including the GCC countries, in the pre-COVID-19 era; however, for the pandemic period, little evidence exists regarding the GCC countries. Some studies have attempted to document results covering the COVID-19 era (e.g., Abuzayed & Al-Fayoumi, 2021; Al Refai et al., 2022; Bahrini & Filfilan, 2020; Shamsudheen et al., 2022; Umar et al., 2021). However, irrespective of the methodologies applied, available studies lack coverage of the complete COVID-19 era in the GCC region. The pandemic era started at the beginning of 2020 and continued to extend to late 2022. To the best of the author’s knowledge, none of the studies available in the literature aimed at documenting volatility transmission from the oil market to GCC stocks, covering the complete COVID-19 period.
This research is intended to study the relationship between the oil and stock markets in the GCC region and document fresh evidence on the co-movement of selected markets to fill this void in the literature. The study covers three areas of the stock market in the GCC, including conventional, Islamic, and environmental, social, and governance (ESG) indices. A unique feature of the study is the documentation of results during the COVID-19 era (January 2020 to October 2022), which led the oil prices to touch the lowest ebb [of $20 per barrel] in recent decades. We report findings based on daily data by applying cointegration, Granger causality, and regression techniques. Johansen’s cointegration test suggests the integration of markets, and Granger causality confirms causation from oil to stocks. The regression results indicate a highly significant (at 1%) positive association between oil prices (independent) and stock market indices (dependent). The GCC is a net oil-exporting region, and these results indicate that higher cash inflows increase the demand for stocks. Additionally, these results indicate that the reliance of GCC stocks is not exclusively on oil (beta coefficients are low), despite its significance; however, the need to accelerate economic diversification efforts in the multiple economies of the region by respective governments is reinforced.
The study proceeds as follows: The next section presents a literature review and the methodology covering data and econometrics in the subsequent section. The analysis and results are reported in the following section, while the conclusion is in the last section.
Literature Review
The relationship between stock and oil markets has been studied in multiple markets, and the literature contains extensive empirical evidence in this area. However, the findings indicate positive and negative associations between these markets. For a net oil-importing economy, the demand push hypothesis states that increasing oil prices may signal increased economic activities, leading to greater demand for stocks. At the same time, the competing argument is that the cost of production increases due to a rise in oil prices, leaving investors with less profit, which may lead to a fall in the stock market index. Interestingly, in the case of net oil-exporting countries, the relationship is expected to be positive based on the higher demand for energy stocks, and the relationship might be negative due to the switching of investors from stocks to the oil commodity itself. Available empirical evidence indicates positive and negative associations between oil and stock markets in multiple settings, leading to inconclusiveness. A very brief literature review follows.
Concerning global markets in Europe and America, empirical evidence exists on the joint movement of stocks and oil markets. Partalidou et al. (2016) document the negative association between oil and the stock markets (USA) for the period 1995–2014, while Alzyoud et al. (2018) report a positive association between oil and the stock markets for the Canadian market (an exporter) during 1986–2015. Similarly, after considering structural breaks, Ewing and Malik (2016) report volatility spillovers between the oil and stock markets (1996–2013) in the USA. Furthermore, Zhang et al. (2020) studied electricity stocks in North America and Europe during 2009–2019 and documented greater volatility spillover from oil to stocks than from natural gas to stock markets; however, the relationship is stronger in Europe than in North America.
Chang et al. (2019) document a negative association between financial markets and oil in the post-global financial crisis (GFC) period for the UK and the USA and mixed results for China (1988–2016), while Horobet et al. (2019) conclude that financial sector stocks in the European Union are exposed to oil price risk based on the 2010–2018 period. In a unique study on the impact of oil prices on Islamic stock indices by Chang et al. (2020) using quantile regression, January 1996 to April 2019 reported a positive relationship between oil and the Dow Jones Islamic stock index. After studying oil importers and exporters from 1987 to 2009, Filis et al. (2011) provide evidence of a negative association (except for the 2008 financial crisis) between all selected stock markets and oil prices. The sample includes three oil exporters (Germany, the Netherlands, and the USA) and three oil exporters (Brazil, Canada, and Mexico). However, different findings for Latin America emerged in the study of Santillán-Salgado et al. (2017). After studying six markets (Argentina, Brazil, Chile, Colombia, Mexico, and Peru), the authors document a positive association between the stock and oil markets, irrespective of importers and exporters, during 2000–2015. The findings are mixed as far as the direction of the relationship between oil and stocks is concerned.
The Caspian Basin region is an important oil exploration and trade market. A positive association between the stock market and oil prices was documented by Bass (2017) for Russia during 2003–2017. Similarly, Mikhaylov (2018) concludes that a positive impact of rising oil prices is expected in the Russian market (exporter). These findings are confirmed by Marashdeh and Afandi (2017) for the period 2000–2015. Davoudi et al. (2018) document a positive relationship between Iran’s stock and the oil market from 1993 to 2014, confirmed by a study conducted by Shirazi and Meibodi (2020). Kose and Ünal (2020) recently documented findings for three countries, namely, Iran, Kazakhstan, and Russia (oil exporters), for 2005–2018. The results show evidence of a greater impact of negative oil price shocks (than positive shocks) on stock returns.
Growing economies in the East Asian region, including Japan, South Korea, and China, are among the top five oil importers. The others are the USA and India in 2022. Recent evidence of a relationship between oil and stock markets is documented in the literature. Khan et al. (2019) provide evidence of a negative association between stocks and oil markets in China during 2000–2018. Hsiao et al. (2019) confirm the results of a negative association (for the short run) by examining renewable energy stocks and oil during 2014–2018. Cai et al. (2020) suggest portfolio diversification (in the short term) by including crude oil in East Asian markets, including Japan, South Korea, and China.
South and Southeast Asian emerging markets are among the major oil consumers globally. Few studies have documented evidence from India (Sharma et al., 2018; Kathiravan et al., 2019; Aggarwal and Manish, 2020). The results indicate a positive impact of oil on stocks. Evidence for Pakistan is documented by Hanif (2020) for the period 2009–2020. The findings suggest a positive relationship between the oil and stock markets, while negative relationships exist between stocks and gold and currency exchange markets. The positive relationship between oil and the stock market in Indonesia is documented by Adam et al. (2015) from 2004 to 2013. Additionally, Dharmawan et al. (2017) reported a significant relationship between oil and stocks in Indonesia in the phase of rising oil prices for a sample period of 1996–2016. In the case of the Malaysian market, Al-hajj et al. (2017) document a negative long-run association between the oil and stock markets during 1991–2016.
Nigeria is a net oil exporter from Africa. A brief review of the studies is presented here. Adaramola (2012) finds the relationship between stock and oil markets (for Nigeria) in the short and long run during 1985–2009. However, Anyalechi et al. (2019) document a lack of integration between Nigeria’s stock and oil markets during 1994–2016. These findings are similar to the results of studies conducted by Ojikutu et al. (2017) and Alio et al. (2019).
Finally, the Middle East is a vital oil-exporting region, especially the GCC countries. In the case of Turkiye, Polat (2020) documents a negative association (1988–2018), while Aydogan and Berk (2015) find little evidence of volatility spillover (1990–2011) between stocks and oil markets. Elhedi and Julien (2009) found mixed results for the GCC region after testing linear and nonlinear short-run relationships (2005–2008) between the oil and stock markets. Bahrain, Kuwait, and Saudi Arabia have shown independent movements in three markets. At the same time, Oman, Qatar, and the UAE display positive relationships. Two-way causality between the stock and oil markets in the GCC countries is documented by Albaity, and Mustafa (2018) for 2005–2015. El-Chaarani (2019) found a greater impact of negative fluctuations in oil prices on stock markets in three GCC countries, namely, Saudi Arabia, Kuwait, and Bahrain, during 2011–2017. However, Ahmad (2019) documents the significant impact of volatility in oil prices on all Gulf stock markets (2008–2017). Mokni and Youssef (2019) document the degree of persistence in dependence between stocks and oil for the GCC region for 2010–2017 and identify a positive association, with the Saudi Arabia market showing the highest degree of persistence independence. Additionally, Alqahtani et al. (2020) document evidence of high volatility of stocks with the oil market for the GCC markets during 2004–2018 using ordinary least squares (OLS) regression, cointegration, and causality tests. In another study, Lamouchi and Alawi (2020) documented the transmission of volatility between oil and energy stocks in the Dubai market by applying the MGARCH model from 2010 to 2018. Abdulrahaman (2020) studied the Saudi Arabian market from 2000 to 2017 and found a long-run relationship between the oil and stock markets.
Some studies have attempted to document the results covering the COVID-19 era (although it was a partial pandemic period). Using DCC-GARCH, Abuzayed and Al-Fayoumi (2021) document an increase in the effect of systemic oil price risk on GCC stocks during the pandemic era by studying daily data from January 2017 to May 2020. The negative short-term impact of COVID-19 on GCC stock markets was documented by Salman and Ali (2021) from September 2019 to July 2020. Additionally, Umar et al. (2021) document the short-term increased influence of supply shocks during COVID-19 by studying the GCC and BRICS economies from 2005 to 2020. In another study, Al Refai et al. (2022) confirmed the greater impact of oil prices on stocks in the GCC countries during the COVID-19 era from January 2017 to September 2020. Using daily data from April to June 2020, Bahrini and Filfilan (2020) documented the negative impact of deaths due to COVID-19 on GCC stocks, while confirmed cases remained insignificant. However, the increase in COVID-19 cases led to a negative effect on stock market returns during the initial period, followed by positive returns once the financial stimulus packages were announced, despite the increase in COVID-19 cases, as concluded by Shamsudheen et al. (2022) after studying conventional and Islamic stock indices in the GCC region for the period from February to November 2020.
The brief literature review indicates volatility spillover between the oil and stock markets, except for independent movements. Empirics support negative as well as positive associations between stock and oil markets. Evidence is available on the effects of oil price risk and the COVID-19 pandemic on stock returns in the GCC region; however, irrespective of methodologies, available studies lack coverage of the complete COVID-19 era as far as the GCC region is concerned. The pandemic era started at the beginning of 2020 and expanded to late 2022. None of the available studies cover the entire pandemic period. This research aims to document oil price volatility for stocks in the GCC region under the COVID-19 regime to fill this void in the literature. The study’s outcome is also expected to help assess the results of economic diversification programs (to reduce reliance on oil production) underway in multiple GCC economies.
Gulf Cooperation Council
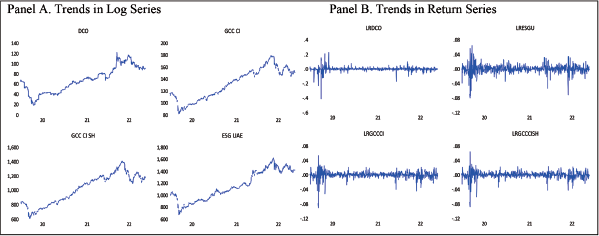
GCC consists of six Arab countries, namely, Saudi Arabia, Kuwait, Bahrain, Qatar, the UAE, and Oman, and is the center of Muslim civilization with a dominant Muslim population. The GCC is one of the wealthiest regions of the world, as depicted by GDP per capita current USD in thousands for 2022 (Bahrain 30, Kuwait 41, Oman 25, Qatar 88, Saudi Arabia 30, UAE 54) (World Bank, 2024a). Every GCC member has a stock exchange with numerous indices covering multiple sectors, including financial services and trade and commerce. Given the leading role of the GCC in Islamic financial services, Sharia-compliant stock universes and indices do exist in the region. In the region, the total number of domestic listed companies as of 2022 exceeds 750 (Saudi Arabia 269, Kuwait 148, UAE 153, Oman 110, Qatar 47 (2019), and Bahrain 41) (World Bank, 2024b). Figure 1 depicts selected GCC stock indices trends during the review period from January 2020 to October 2022.
One of the significant contributions to GCC economies is from the oil sector. Although efforts to diversify the economies aimed at reducing the reliance on the oil sector are underway in multiple GCC countries, thus far, the oil sector occupies a prime place in the economic management of GGC, as depicted by the statistics presented in Table 1. The export earnings of all GCC economies, except for Bahrain, from oil-related products, are above 50% of the total for 2021. Proven oil reserves exceed 500 billion barrels by 2021, accounting for more than one-third of the global estimated reserves.
Methodology
Data: The study period covers January 2020 to October 2022. The selection of January 2020 as the starting point is because of the start of the spread of COVID-19 worldwide, including in the GCC region. Daily data for selected variables, including stock markets (S&P GCC Composite Index, S&P GCC Composite Index Shariah, and S&P/Hawkamah ESG UAE Index), are obtained from S&P Global (
Econometrics: Literature review articles have concluded that the most widely used techniques for studying the integration of markets are correlation, Granger causality, Johansen’s cointegration, regression, and unit root tests (Hanif & Sabah, 2020; Sharma & Seth, 2012). This study applies multiple econometric techniques to data analysis, including regression, Granger causality, and Johansen cointegration (causality and cointegration tests are appropriate given that the data meet the order of integration). Analysis was conducted using MS Excel and EViews-13 software.
To meet the analytical requirements, except for cointegration, logarithmic return series are generated by using the following equation:
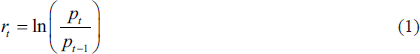
where returns are represented by
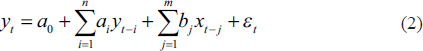
Formal tests documenting “cause and effect” and co-movement are applied to the data, and the results are reported in the next section. The long-term joint movements of the selected series are calculated by applying the standard Johansen cointegration test. The causality testing model is as follows:
An increasing focus of researchers to document causality among financial time series is on time-varying parameters (Baum et al., 2022; Chan & Jeliazkov, 2009; Lu et al., 2023; Shi et al., 2020). This study incorporates time-varying effects by documenting results through time-varying coefficient-vector autoregression (TVC-VAR) and switching VAR. For detailed derivations of the TVC-VAR, please consult Chan and Jeliazkov (2009).
This study relies on variance decomposition and regression techniques to answer the question of how much variation in stock indices is explained by the oil market. Separate regression models were estimated for all selected GCC stock indices (S&P GCC Composite Index, S&P GCC Composite Index Shariah, and S&P/Hawkamah ESG UAE Index) using the following basic regression model:

Stock returns are denoted by r;
We select the S&P GCC Composite Index as a proxy for conventional stock markets, the S&P GCC Composite Index Shariah for Islamic stocks, and the S&P/Hawkamah ESG UAE Index to represent stocks screened for ESG concerns. The historical prices of Dubai Crude Oil futures are used as a proxy for the oil market. Stock and oil markets depict associations in both negative and positive directions and a lack of integration (as documented in the literature). The literature suggests an association between oil and the stock market in both directions (positive and negative). Given the presence of oil-exporting economies, a positive association between stocks and oil markets is expected in the GCC region.
Analysis and Results
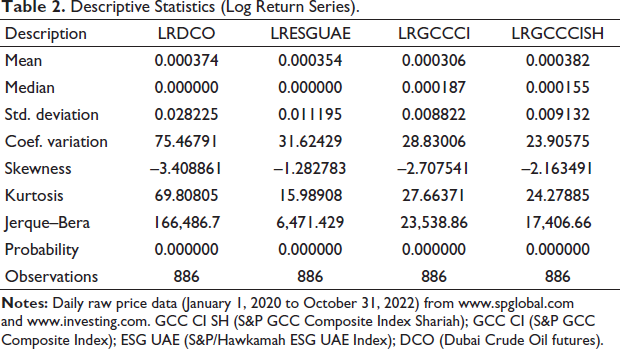
Descriptive statistics: Descriptive statistics are presented in Table 2. The highest average daily returns for stock markets are for the GCC Shari’ah, followed by the ESG UAE and the GCC conventional indices. The average daily returns for oil prices (0.000374) are greater than those for conventional stocks. The mean values are not close to the median for all series. The greatest variations are found in oil prices, while the least in the case of Shari’ah stocks, as depicted by the coefficient of variation (a relative measure of variations). Skewness values are far from zero, with negative signs indicating left fat tails. Kurtosis values of all series are far from the standard value (3.00), and probability statistics for Jerque–Bera confirm data abnormalities. Figure 1—Panel B presents trends in the log return series—somehow close to normality. For our analysis, the stationarity of the data series is a prerequisite, as discussed in the following subsection.
Descriptive Statistics (Log Return Series).
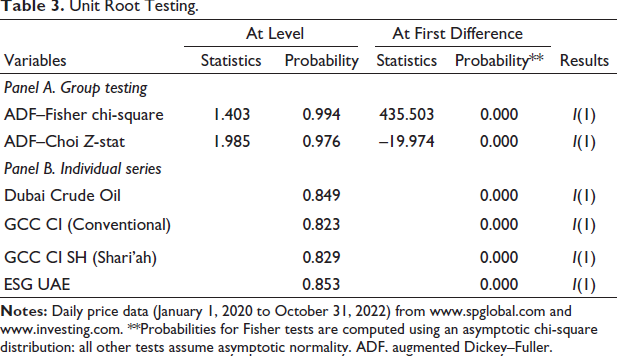
Stationary testing: Table 3 presents the results of unit root testing. Group results (Panel A) and individual series results (Panel B) show the existence of a unit root at the level, which is removed at the first difference, as depicted by probability values (less than 0.05). The results (Table 3) indicate the fitness of the data for the estimation of regression and Granger causality (at log-returns) and for testing cointegration (at level).
Unit Root Testing.
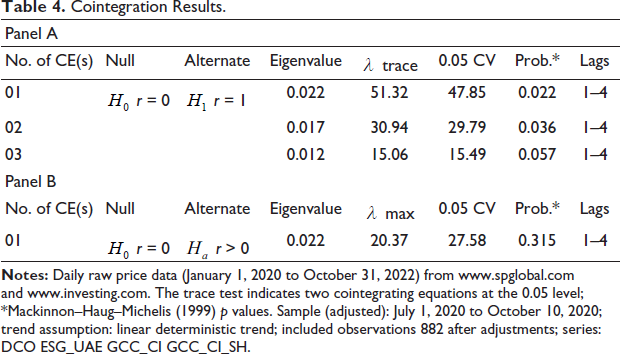
Cointegration testing: The results of the Johansen model of cointegration are reported in Table 4. The lag-length criterion of Akaike information criterion (AIC) and final prediction error (FPE) is applied in selecting lags (1–4). Model 3 (linear deterministic trend) was appropriate (through EViews option six) for stochastic trend series when testing multivariate cointegration. The results show zero cointegration based on the max-eigenvalue; however, two cointegration equations are under the trace test. The calculated values of the
Cointegration Results.
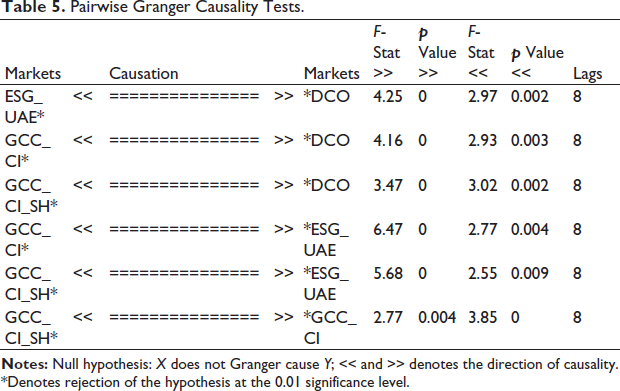
Granger causality: Although cointegration results indicate joint movement of time series, it is important to know the direction of the relationship (lead/lag), which is estimated by applying the Granger causality test. The representation theorem suggests that Granger causality must exist in at least one direction if two variables are cointegrated. The suggested lag length by AIC and FPE is 21; however, the results are similar at reduced lag length (8), used in bivariate Granger causality. The literature suggests that it is better to use more lags (than fewer) to cover all the related past information that helps predict a variable (y) by the other (x). Stationary series (log-returns) are used to calculate Granger causality (Table 5). Accordingly, we find causation from oil to all selected indices, including conventional, Islamic, and ESG indices. Two-way causality exists between three variables: oil-conventional stocks, oil-Sharia stocks, and oil-ESG stocks. The results are significant at the 1% level. The results are also significant regarding causation between multiple market indices.
Pairwise Granger Causality Tests.
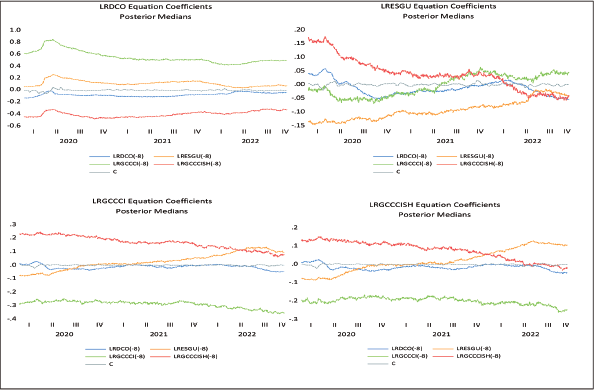
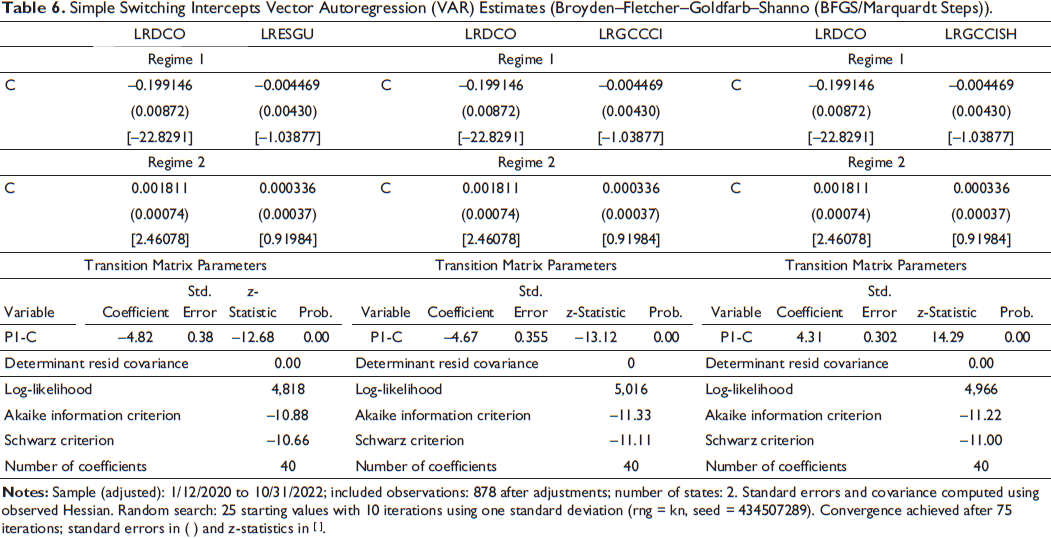
Time-varying effects: Granger causality is an appropriate econometric technique for linearity in the time series relationship. The results reported in Table 5 indicate two-way causation between the oil and stock markets. The following results are documented, taking into account time-varying effects. We selected two techniques to document time-varying effects in the time series relationship over time, including the TVC-VAR and switching VAR. The switching VAR aims at occasional discrete changes (e.g., structural breaks). To handle constant and smooth changes, TVC-VAR is recommended (S&P Global, 2022). The 13th edition of the EViews software carries the capabilities to calculate the switching VAR and the TVC-VAR, which is used for documenting the results of this research. TVCVAR is calculated following Chan and Jeliazkov (2009), and the results are reported in Figure 2. According to the results, all effects in the oil market and ESG index growth equations have drifted toward zero later in the sample. The conventional and Islamic stock indices equations depict strong instability throughout the sample period. The switching VAR obtains further evidence of time-varying effects; the results are reported in Table 6. The results for the two regimes are documented. Accordingly, the results are negative in all three cases in regime 1 but positive in all the cases in regime 2, indicating the absence of linearity in the relationship for the whole period. The coefficients are not static or similar for the entire study period. These results support findings documented through applications of TVC-VAR, which were previously documented.
Evolution of the Parameter βt in the Time-varying Coefficient-Vector Autoregression (TVC-VAR) model 01/01/2020 to 31/10/2022.
Simple Switching Intercepts Vector Autoregression (VAR) Estimates (Broyden–Fletcher–Goldfarb–Shanno (BFGS/Marquardt Steps)).
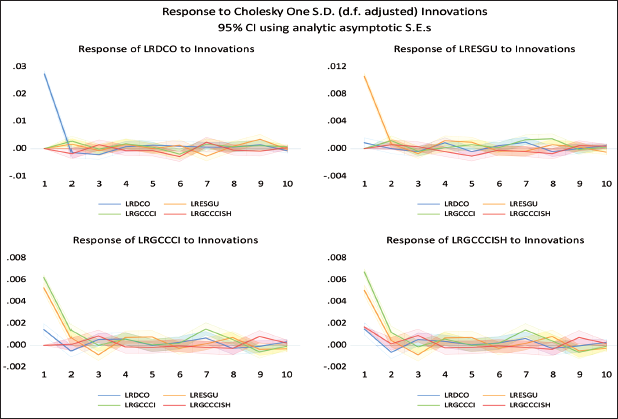
Another aspect of the study is to document how much variation in stock market indices is explained by the oil market. The answer to this question is revealed by the variance decomposition and impulse response results (Appendix 1). Accordingly, the highest variance in the oil market is explained by stock indices (including conventional, Shari’ah, and ESG indices), which are less than 10% (in period 10). Similarly, the highest variance explained by the oil market in stock indices (in period 10) is almost 5% in the case of a conventional market index, close to 4% in the Shari’ah index, and close to 3% in the ESG index. Regression analysis was performed to strengthen the findings further.
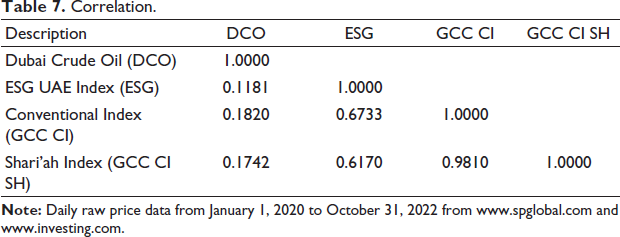
Correlation.
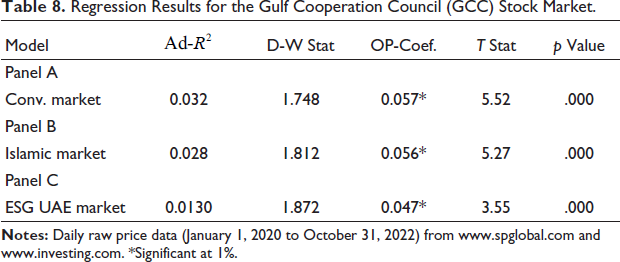
Regression Results for the Gulf Cooperation Council (GCC) Stock Market.
Multicollinearity: It is recommended that multicollinearity between variables be checked while estimating the regression equation. The correlation results are reported in Table 7. The results show the highest correlation between stock market indices (dependent variables). In the case of oil prices and stock markets, correlations exist—an indication of joint movements—to be confirmed by formal testing of “cause and effect” through the regression model.
Regression analysis: Table 8 reports the results of formal regression tests of three equations estimated separately to represent three markets (conventional, Islamic, and ESG), the S&P GCC Composite Index, the S&P GCC Composite Index Shari’ah, and the S&P/Hawkamah ESG UAE Index. The results for the conventional index (S&P GCC Composite) are reported in Panel A. A Durbin–Watson’s statistic close to 1.75 indicates the model’s overall fitness. Multiple other contributors create volatility in the GCC market, given that the value of the adjusted R square is low (3.2%); however, our variable of interest (oil market) contributes significantly (at 1%) to the stock return generation process. With a significant coefficient (of 5.7%), oil price variations positively impact the stock market in the GCC countries. Panel B reports the results for the Islamic market (S&P GCC Composite Index Shari’ah). A higher Durbin–Watson statistic (1.81) indicates improvement in the overall fitness of the model. However, the value of the adjusted R square (close to 3%) (less than that of the conventional index) signifies the role of other contributors in volatility. The variable of interest (oil prices), with a highly significant (at 1%) beta coefficient (5.6%), contributes positively to the stock return generation process in the GCC countries. Panel C depicts the results of the ESG-UAE index during the review period. The adjusted R square is very low, and the Durbin–Watson coefficient is within the acceptable range. However, the coefficient of oil prices (close to 5%) is significant at the 1% level.
The results are similar for all indices with low R squares; however, they signify the impact of oil prices on stock indices in the selected markets (low beta coefficients indicate that GCC stocks are not exclusively dependent on variations in the oil sector). Similar results are documented in earlier subsections by applying Granger causality and cointegration tests. A positive association indicates higher cash inflows to the oil sector in net-oil exporting economies, leading to increased stock demand. Thus, we conclude that the association between oil and stocks remained positive during the pandemic in the GCC oil-exporting economies. Similar results are available for periods before the pandemic crisis (e.g., Albaity and Mustafa, 2018; Ahmad, 2019). Our results confirm the findings of Abuzayed and Al-Fayoumi (2021) and Al Refai et al. (2022).
Conclusion
This study documents the role of oil market variations in generating stock returns in GCC markets, including conventional, Islamic, and ESG (UAE) indices, during the COVID-19 era, from January 2020 to October 2022. The findings are documented using daily data and applying cointegration, Granger causality, and regression tests. The integration of selected time series emerged through the Johansen cointegration test, and Granger causality confirmed causation from oil to stocks. The results of the VAR-TVC indicate changes in the relationships over time. The results are further confirmed by switching VAR with two regimes, which depicts negative results for regime 1 and positive results for regime 2 for all pairs of time series.
Causations from the oil to stock markets are captured in regression equations estimated for the GCC markets, including the Islamic, conventional, and ESG (UAE) indices. The regression results are highly significant (at 1%) and positive between the oil market (independent) and stock indices (dependent). The GCC is a net oil-exporting region, and these results indicate that higher cash inflows increase the demand for stocks. Additionally, these results indicate that the reliance of GCC stocks is not exclusively on oil (beta coefficients are less than 10%), despite its significance. Additionally, variance decomposition and the impulse response function confirm that major variations in oil and stock markets are caused internally. However, the need for accelerating economic diversification efforts in the multiple economies of the region by respective governments is reinforced.
Based on the results, our recommendation to investors and portfolio managers is NOT to diversify stock and oil markets in the GCC region, given the joint co-movements of both markets. However, the oil market may signal investors about the expected movements of stock markets and vice versa. We also recommend accelerating diversification efforts, including industrial and tourism-related projects, started by respective governments in the GCC region. The findings are expected to enhance the understanding of academics, market players, regulators, and investors in the relationship between GCC stocks and oil markets. The limitations of this study include the relatively short period (covering only the COVID-19 era) and the absence of information on the impact of other macro- and micro-level variables on stocks. Future studies may look into these aspects.
Appendix 1
Variance Decomposition
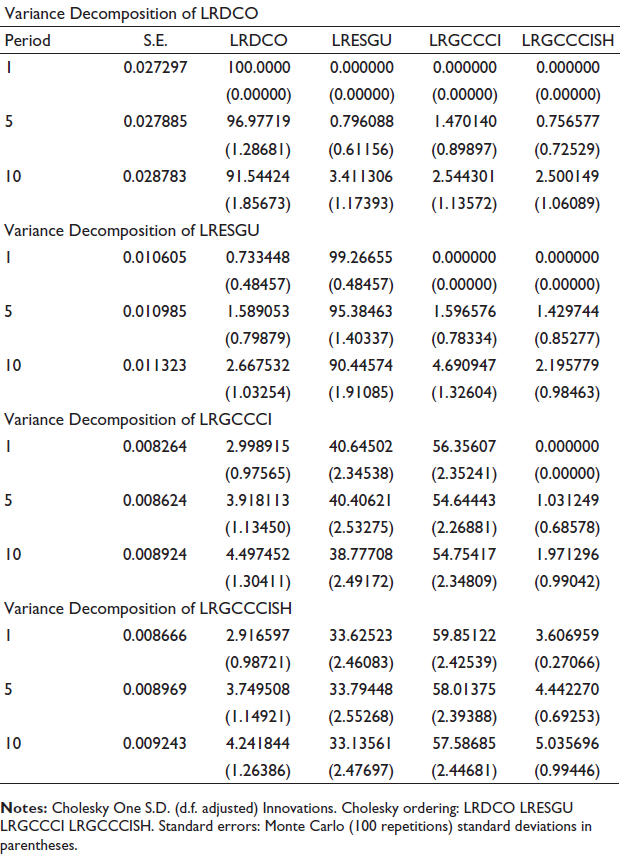
The variance decomposition results show that a major portion of the variance above 90% is within the oil market itself, and less than 10% of the variance is stock market-related. Likewise, the variance of stock market indices is within the 5% band from the oil market, and other factors cause the remaining 95% of the variance. Impulse response functions also depict similar results. The results indicate that although causality exists between the oil and stock markets, the capital market is not wholly dependent on oil. This might be the fruit of economic diversification efforts in multiple GCC economies.
Impulse Response Function
The impulse response graph for the oil market (DCO) depicts major variability within the market. The economic, social, and governance (ESGU) index results indicate that major variability is internal. Variations in the conventional stock market index (GCCCI) are internal and due to variations in the ESGU index. The conventional stock market and ESGU indices cause major variations in the Shari’ah index (GCCISH).
Footnotes
Acknowledgment
None.
Availability of Data and Material
Yes, open source.
Declaration of Conflicting Interests
The author declared no potential conflicts of interest with respect to the research, authorship, and/or publication of this article.
Funding
The author received no financial support for the research, authorship, and/or publication of this article.