
Abstract
This study provides an examination of the economic diversification efforts in the Gulf Cooperation Council (GCC) countries, employing advanced multi-criteria decision-making (MCDM) techniques to offer a more nuanced understanding of these efforts. Utilizing the Global Economic Diversification Index (GEDI) data from 2000 to 2022, the study employs a CRITIC (Criteria Importance Through Intercriteria Correlation)–TOPSIS (Technique for Order of Preference by Similarity to Ideal Solution) modeling framework to statistically weight and rank diversification indicators across production, trade, and revenue dimensions. This combined approach allows for a comprehensive weighting and ranking of economic diversification indicators, ensuring a balanced and rigorous evaluation of each GCC country’s performance. The study uncovers significant disparities among the GCC countries, with Saudi Arabia and the UAE emerging as leaders in economic diversification due to their strategic investments in infrastructure, technology, and human capital. Bahrain, on the other hand, consistently ranks the lowest, highlighting substantial challenges in achieving meaningful diversification. The study contributes to the literature by integrating longitudinal MCDM modeling with a unified diversification index, offering practical insights for tailoring national policies. Implications for policymakers include the importance of coordinated investment in innovation ecosystems, governance reforms, and fiscal sustainability to support long-term structural transformation. These findings underscore the critical need for a multifaceted approach that incorporates technological innovation, infrastructure development, and robust governance frameworks.
Keywords
Introduction
Economic diversification underpins sustainable development by spreading risk and opening new income channels across sectors and regions (Jolo & Koç, 2023; Sweidan, 2025). In small-scale fishing communities, diversification into tourism, transportation, and aquaculture has mitigated overfishing pressures while enhancing food security and livelihoods, although the long-term ecosystem outcomes remain uncertain (Armenta Cisneros et al., 2022). Similar gains emerge in Nigeria, where broader sectoral mixes enhance environmental efficiency—albeit with short-term trade-offs—and where anti-corruption reforms and youth-oriented entrepreneurship schemes further strengthen the payoff of diversification (Adewuyi & Adeleke, 2017; Omeje et al., 2020). Evidence from South and Southeast Asia suggests that diversified economies translate resource rents into human development improvements, a result that is amplified when trade heterogeneity, digital connectivity, and financial inclusion moderate the resource curse dynamic (Ali & Memon, 2019; Liu & Hong, 2024). Country cases reinforce this pattern: Russia’s gas sector illustrates how targeted resource use can spur diversification (Sohag et al., 2024); democratic institutions temper the disruptive effects of new oil finds (Alsharif & Bhattacharyya, 2019); and Colombia’s gold industry demonstrates that governance quality determines whether extraction expands or constrains the wider economy (Tarra-Almario & Restrepo Baena, 2021).
Within the Gulf Cooperation Council (GCC) countries, diversification has become indispensable for shielding public finances from hydrocarbon volatility and unlocking long-run resilience (Mohammed et al., 2018). Recent studies confirm that oil shocks and global crises expose structural vulnerabilities, urging fiscal, trade, and industrial reforms, as well as human capital investment (Abdelkawy, 2024). Yet, capital-formation surges alone yield only muted diversification gains when they remain concentrated in oil-adjacent assets (Jolo & Koç, 2023). Post-pandemic recovery strategies—emphasizing knowledge industries, digitalization, and green transitions—signal a pivot toward more balanced growth paths, although success depends on realigning state roles and demand-led innovation systems to crowd in private investment and technological upgrading (Abdelkawy, 2024; Ben Hassen, 2022).
GCC countries have long relied on hydrocarbon revenues as the primary source of income, making them vulnerable to global oil price volatility and energy market shocks. The dramatic downturns in oil prices—such as in 2008 (global financial crisis), 2014–2016 (oil-supply glut), and 2020 (COVID-19 pandemic)—have exposed the structural fragility of oil-dependent economies and accelerated policy shifts toward economic diversification (International Monetary Fund, 2021; World Bank, 2023). In response, GCC states have articulated long-term strategic frameworks—known as National Visions—outlining comprehensive goals for economic transformation and sectoral diversification. These visions include Saudi Arabia’s Vision 2030, which aims to increase non-oil government revenue from SAR 163 billion to SAR 1 trillion (approximately $43.5 billion–$266.5 billion) (Kingdom of Saudi Arabia, 2016); the UAE’s Vision 2021, which targeted a globally competitive knowledge economy (Government of UAE, 2021); Qatar’s National Vision 2030, focusing on human capital, environmental sustainability, and economic diversification (Government of Qatar, 2008); and Oman’s Vision 2040, which prioritizes private-sector growth and innovation (Government of Oman, 2020). These policy blueprints provide not only long-term orientation but also measurable targets to reduce dependency on volatile hydrocarbon markets.
The objective of this study is to critically assess the economic diversification strategies and outcomes of the GCC countries from 2000 to 2022, utilizing a comprehensive and policy-relevant dataset from the Global Economic Diversification Index (GEDI). The analysis centers on three core dimensions of diversification—production, trade, and government revenue—to provide a multidimensional understanding of each country’s structural transition. Given the heightened global emphasis on sustainability and resilience, this study aligns its analysis with key Sustainable Development Goals (SDGs), particularly SDG 8 (decent work and economic growth) and SDG 9 (industry, innovation, and infrastructure), both of which are central to the economic transformation agendas of oil-exporting countries. The study addresses three questions: (a) How have the GCC countries progressed in diversifying their economies across key structural domains? (b) What disparities exist in their relative performance, and what are the underlying factors? and (c) How can these insights inform national policies to enhance long-term economic resilience?
The analysis in this study is grounded in the theoretical foundations of structural transformation and resource dependence, particularly as articulated in the resource-curse and diversification-led growth literature (Song & Hou, 2024; Zhang et al., 2024). These frameworks emphasize that long-term economic resilience in resource-rich countries hinges on the ability to reallocate productive capacities from volatile extractive sectors toward more stable, innovation-driven activities (Imran et al., 2025; Liu & Hong, 2024). Economic diversification is conceptualized here as a multidimensional process encompassing shifts in production, trade composition, and government revenue sources (Abdelkawy, 2024; Mehmood & Kaewsaeng-On, 2024; Muhammad et al., 2024). Recent evidence underscores that natural resource abundance tends to impede industrial development in low- and middle-income countries unless moderated by economic complexity and trade diversification (Chairul et al., 2025; Song & Hou, 2024). Similarly, studies on the Brazil, Russia, India, China, and South Africa (BRICS) and Association of Southeast Asian Nations (ASEAN) countries highlight that overreliance on extractives, without concurrent institutional reform and investment in renewable energy or technology, exacerbates structural fragility (Imran et al., 2025; Zhang et al., 2024). Within the GCC context, diversification remains essential for transitioning beyond oil rents, particularly in light of diminishing returns from hydrocarbon revenues over time (Abdelkawy, 2024).
Methodologically, the study employs a multi-criteria decision-making (MCDM) approach, integrating the CRITIC (Criteria Importance Through Intercriteria Correlation) and TOPSIS (Technique for Order of Preference by Similarity to Ideal Solution) methods. The CRITIC method objectively derives indicator weights based on statistical dispersion and inter-criterion correlation, while the TOPSIS algorithm evaluates each country’s performance relative to an ideal diversification scenario. This approach ensures methodological rigor and eliminates subjective bias, offering a replicable framework for country-level assessment. The dataset comprises 138 observations from Bahrain, Kuwait, Oman, Qatar, Saudi Arabia, and the UAE, drawn from the 2024 version of the GEDI database, which provides consistent annual data from 2000 onwards.
The findings reveal marked disparities in economic diversification performance across the GCC countries. Saudi Arabia and the UAE consistently lead in overall diversification, with strong advancements in trade and government revenue structures, driven by substantial infrastructure investments, fiscal reforms, and the expansion of the non-oil sector. Qatar demonstrates steady but uneven progress, while Oman and Kuwait display moderate outcomes with room for improvement. Bahrain persistently ranks lowest, underscoring systemic constraints in its diversification model. These variations highlight the critical role of institutional capacity, resource endowments, and strategic implementation in shaping diversification outcomes.
This study contributes to the existing literature by integrating a multidimensional, longitudinal index with advanced MCDM techniques to evaluate the relative diversification performance of the GCC countries. Beyond empirical insights, the findings offer actionable guidance for policymakers navigating the complex path toward economic resilience. The article begins with a review of the literature on economic diversification in resource-dependent economies, followed by a detailed discussion of the data and methodology, including the rationale for using the CRITIC–TOPSIS framework. It is followed by a discussion of the empirical results, and the article concludes with key implications for policy and future research directions.
Data and Methodology
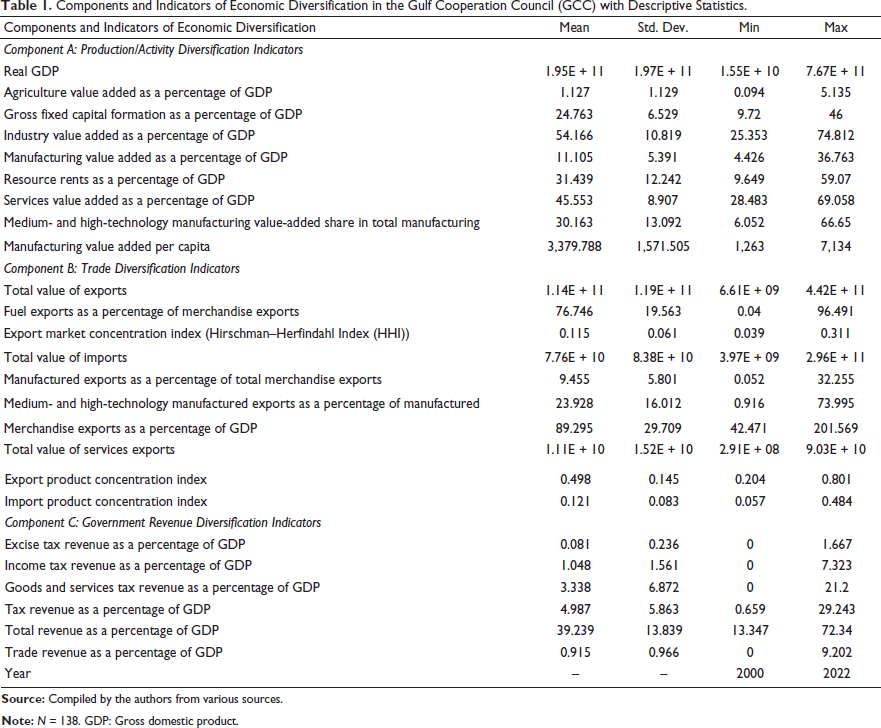
The data utilized in this study are sourced from the GEDI 2024 dataset (Prasad et al., 2024a). This comprehensive dataset spans from 2000 to 2022 and includes data for the GCC countries, namely, Bahrain, Kuwait, Oman, Qatar, Saudi Arabia, and the UAE, comprising a total of 138 observations. This 22-year window is methodologically relevant, as it captures major global shocks, the 2008 financial crisis, the 2014–2016 oil slump, and COVID-19 and the rollout of long-term national visions. The GEDI dataset offers a comprehensive collection of economic indicators essential for analyzing economic diversification across various dimensions (Prasad et al., 2024b, 2024c). The details of the indicators and components are presented in Table 1, along with the descriptive statistics of the data.
Components and Indicators of Economic Diversification in the Gulf Cooperation Council (GCC) with Descriptive Statistics.
The GEDI, developed by the Mohammed Bin Rashid School of Government (MBRSG), Dubai, provides a methodologically robust and multidimensional framework for assessing economic diversification. It spans 112 countries from 2000 to 2022 and incorporates 24 standardized indicators across three core dimensions: output, trade, and government revenue (Prasad et al., 2024a). The index is constructed using well-established dimensionality reduction techniques—principal component analysis and principal factor analysis—which facilitate the aggregation of complex, high-dimensional datasets into internationally comparable composite scores (Prasad et al., 2024a). Its methodological soundness is reinforced by extensive peer reviews from senior economists affiliated with the World Bank, International Monetary Fund (IMF), Organization for Economic Cooperation and Development (OECD), and United Nations Conference on Trade and Development (UNCTAD) (Prasad et al., 2024b, 2024c). Critically, the GEDI data sources are drawn from authoritative global repositories, primarily the World Development Indicators (WDI) and IMF databases, ensuring high validity and cross-country comparability (Prasad et al., 2024a). GEDI’s empirical robustness and policy relevance have been validated through its application in recent cross-country analyses, such as Gylfason and Nganou’s (2023) evaluation of diversification strategies in Mongolia. Accordingly, this study’s use of GEDI aligns with contemporary standards in global economic benchmarking, offering a credible and data-driven foundation for assessing the diversification trajectories of GCC economies.
To examine relative weights and rank countries based on their economic diversification, the CRITIC and TOPSIS methods are considered. The approach combines both methods to ensure a comprehensive and balanced evaluation of economic diversification indicators and components. The CRITIC method (Diakoulaki et al., 1995) is particularly suitable for deriving criterion weights in multidimensional analyses, as it simultaneously accounts for the variability of each indicator and the intercorrelation among them. This dual sensitivity ensures that the weight assigned to each indicator reflects both its standalone importance and its informational distinctiveness within the dataset (Krishnan, 2024; Yüksel et al., 2023). The TOPSIS method (Hwang & Yoon, 1981) was chosen due to its ability to rank alternatives based on their relative closeness to an ideal solution. This is particularly useful in MCDM scenarios, where the goal is to identify the best-performing alternatives (Papathanasiou & Ploskas, 2018; Triantaphyllou & Triantaphyllou, 2000). TOPSIS considers both the best possible scenario (positive ideal solution) and the worst possible scenario (negative ideal solution) for each criterion, providing a comprehensive evaluation of each alternative (Divya et al., 2020). This method is well-suited for studying economic diversification, as it enables a clear and intuitive ranking of countries based on multiple economic indicators (Pandey et al., 2023).
The CRITIC–TOPSIS combination was selected due to its objectivity, computational transparency, and suitability for contexts involving highly interrelated criteria, such as economic diversification. CRITIC derives weights based on contrast intensity and conflict among indicators, thereby avoiding the subjective bias inherent in expert-based methods, such as the analytic hierarchy process (AHP) (Munier & Hontoria, 2021). It also outperforms entropy-based models in handling redundancy across indicators, as it incorporates both the correlation structure and dispersion. TOPSIS, meanwhile, ranks alternatives based on their geometric closeness to an ideal solution—well-suited for policy benchmarking where best-case and worst-case scenarios are conceptually defined. Together, these methods provide a replicable and data-driven evaluation framework aligned with recent applications in regional development and sustainability assessments (Oussama et al., 2024).
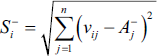
To determine the weights of the indicators and components of economic diversification in the GCC, the CRITIC method was used. CRITIC involves a series of steps to assign weights as indicated by Jahan et al. (2012) and Pandey et al. (2023). This method accounts for the contrast intensity and the conflict between criteria. Initially, the decision matrix was normalized to transform different criteria into a comparable scale. Each criterion value 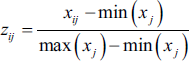
After normalization, the standard deviation for each criterion was computed to measure the contrast intensity. This step is critical as it captures the variability of each criterion, highlighting the importance of those with greater dispersion. The standard deviation for each criterion j was calculated using
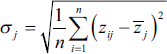
Next, the correlation coefficient matrix was calculated to measure the conflict between criteria. The correlation coefficient between each pair of criteria j and k was computed using
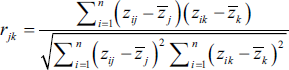
This step helps in understanding the interdependencies among criteria, which is essential for accurately determining their weights. The amount of information for each criterion was then computed. The information value 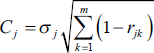
This formula combines the standard deviation and the correlation to capture both the contrast and the conflict among criteria. Finally, the criteria weights were determined by normalizing the information values. The weight for each criterion 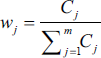
Using the criteria weights obtained from the CRITIC method, the TOPSIS method was applied to rank the countries. TOPSIS ranks alternatives based on their distance to an ideal solution, which considers both the best and worst possible scenarios for each criterion. TOPSIS, combined with CRITIC, involves different steps (Yüksel et al., 2023). First, the decision matrix was normalized again to ensure all criteria were on a comparable scale. The normalized decision matrix 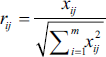
This step ensures that the magnitude of the criteria does not bias the ranking process. Next, the weighted normalized decision matrix was calculated by multiplying each normalized criterion value by its respective weight obtained from the CRITIC method. The weighted normalized value 
This step integrates the importance of each criterion into the evaluation process.
The positive ideal solution 
and

To assess how close each country is to these ideal solutions, the separation measures were calculated. The separation from the positive ideal solution 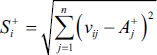
and
These measures indicate how far each country is from the ideal and anti-ideal solutions.
The relative closeness 
The relative closeness ranges from 0 to 1, where a higher value indicates that the country is closer to the ideal solution. Finally, countries were ranked based on their relative closeness.
The descriptive statistics of the dataset (Table 1) reveal significant insights into the economic structure and diversification efforts within the region. For production/activity diversification, indicators such as real gross domestic product (GDP), which range from $15.5 billion to $767 billion, and agriculture value added as a percentage of GDP, which has a mean of 1.127%, highlight the varying economic bases of the GCC countries. Industry value added and manufacturing value added, expressed as percentages of GDP, with means of 54.166% and 11.105%, respectively, underscore the substantial role of industrial activities, although there is notable variability among countries. Resource rents, averaging 31.439% of GDP, indicate a heavy reliance on natural resources, which poses a risk to economic stability. The services sector, with an average contribution of 45.553% to GDP, reflects efforts toward diversification, although the range (28.483%–69.058%) suggests uneven progress.
Trade diversification indicators further illuminate the economic landscape, with fuel exports averaging 76.746% of merchandise exports, underscoring a significant dependence on oil. The export market concentration index (mean of 0.115) and import product concentration index (mean of 0.121) indicate a moderate level of concentration in trade markets and products. Merchandise exports as a percentage of GDP average 89.295%, indicating a strong export orientation but also a potential vulnerability to global market fluctuations. For government revenue diversification, indicators such as tax revenue (mean of 4.987% of GDP) and total revenue (mean of 39.239% of GDP) show efforts to broaden revenue bases, though the reliance on non-diverse income streams remains evident. Excise, income, and goods and services taxes contribute variably across countries, reflecting different stages of tax system development. While the data highlight some progress toward economic diversification, the high standard deviations and wide ranges in key indicators indicate persistent vulnerabilities and an uneven pace of diversification across the GCC countries. This underscores the need for sustained policy efforts to enhance economic resilience and stability in the region.
Results and Discussion
Table 2 outlines the weights assigned to various indicators and components of economic diversification for the GCC countries. Component A (Production/Activity Diversification Indicators) accounts for a total weight of 0.3101 in the overall economic diversification assessment. Within this component, the indicators are evaluated based on their contribution to production and activity diversification. Real GDP weights 0.0431, translating to 12.24% within this component, highlighting its significant role in reflecting economic output. Agriculture value added, as a percentage of GDP, is slightly less influential at 11.29%, indicating its moderate impact on economic diversification despite the region’s overall low reliance on agriculture. Gross fixed capital formation, industry value added, and manufacturing value added, as percentages of GDP, are weighted at 8.48%, 10.02%, and 8.12%, respectively, highlighting their critical roles in sustaining and enhancing economic activity. Resource rents as a percentage of GDP, with a weight of 0.0481 (13.36% within the component), underscore the reliance on natural resources and the need for diversification. Services value added as a percentage of GDP is highly significant at 13.95%, reflecting the importance of the service sector in diversifying economic activities. The medium- and high-technology manufacturing value-added share and manufacturing value-added per capita are crucial for technological advancement and productivity, with weights of 9.71% and 12.82%, respectively, within this component. These indicators underscore the need for technological upgrading and value-added manufacturing to achieve diversification.
Weights of Indicators and Components of Economic Diversification.
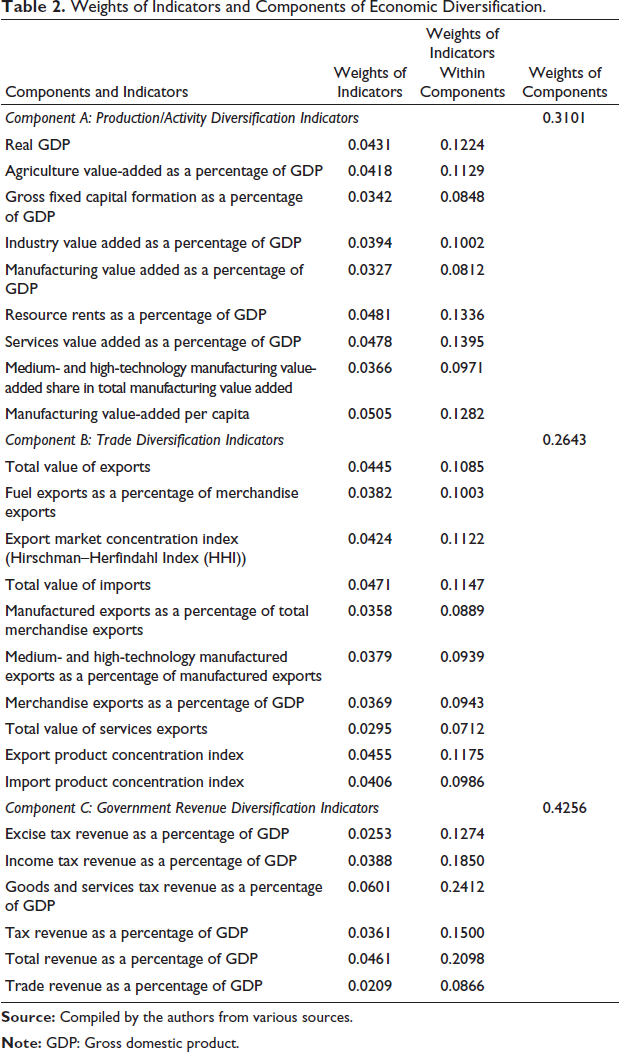
Component B (Trade Diversification Indicators) is assigned a total weight of 0.2643, reflecting the importance of trade diversification in the economic structure of the GCC countries. The total value of exports weighs 0.0445, representing 10.85% within this component, indicating its role in economic diversification through external trade. Fuel exports, as a percentage of merchandise exports, and the export market concentration index (Hirschman–Herfindahl Index (HHI)) have weights of 10.03% and 11.22%, respectively, highlighting the reliance on fuel exports and the concentration of export markets. The total value of imports and manufactured exports, as percentages of GDP, at 11.47% and 8.89%, respectively, underscores the balance between import reliance and export capabilities in manufactured goods. Medium- and high-technology manufactured exports as a percentage of manufactured exports, merchandise exports as a percentage of GDP, and the total value of services exports account for weights of 9.39%, 9.43%, and 7.12%, respectively. These indicators reflect the degree of technological sophistication and service sector contributions to trade diversification. The export product concentration index and import product concentration index, with weights of 11.75% and 9.86%, indicate the diversity or concentration of trade products, which is crucial for understanding trade vulnerabilities and opportunities for diversification.
Component C (Government Revenue Diversification Indicators) has the highest weight of 0.4256, underscoring the importance of diversifying government revenue streams. Excise tax revenue as a percentage of GDP accounts for 12.74% of this component, reflecting its moderate role in revenue diversification. Income tax revenue and goods and services tax revenue are significant, with weights of 18.50% and 24.12%, respectively, indicating their substantial contributions to broadening the tax base. Tax revenue and total revenue as percentages of GDP are weighted at 15.00% and 20.98%, showing their importance in enhancing fiscal stability through diversified revenue sources. Trade revenue as a percentage of GDP, with a weight of 8.66%, underscores the importance of trade-related taxes in diversifying government revenue. These weights collectively provide a detailed understanding of the relative importance of various economic indicators and components in achieving economic diversification for the GCC countries.
Figure 1 presents the composite relative weights of economic diversification indicators across the GCC countries. The analysis reveals that goods and services tax revenue as a percentage of GDP carries the highest weight, underscoring the indispensable role of fiscal diversification through robust tax policy. This aligns with findings from Abdelkawy (2024), who highlights the diminishing marginal returns of hydrocarbon rents and the need for broadening the revenue base in the face of global shocks. Closely following, “Manufacturing value-added per capita” and “Resource rents as a percentage of GDP” reflect the transitional challenge of shifting from resource dependence to industrial productivity. This echoes the concerns raised by Zhang et al. (2024) and Imran et al. (2025) regarding the volatility of resource rents and the imperative for industrial restructuring. Other prominent indicators, such as “Services value added,” “Total revenue,” and “Export product concentration index,” collectively reflect a multidimensional diversification profile that cuts across output, trade, and fiscal fronts. Conversely, indicators such as “Fuel exports as a percentage of merchandise exports” and “Medium- and high-technology manufactured exports” receive lower weights, highlighting ongoing structural rigidities in reducing oil dependency and fostering advanced manufacturing—challenges also noted in Song and Hou (2024) regarding ASEAN economies’ trade restructuring efforts.
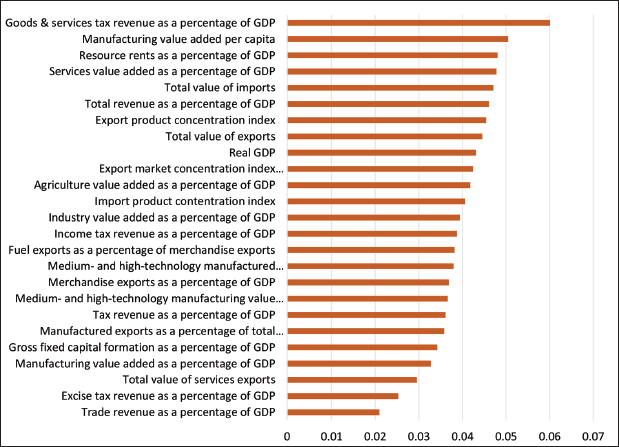
Figure 2 breaks down Component A: Production and Activity Diversification, where “Services value added” and “Resource rents” dominate, each with weights exceeding 0.13. This reflects the transitional state of GCC economies—balancing a growing service sector with residual dependence on natural resource exploitation. The high weight of “Manufacturing value-added per capita” further confirms the sector’s centrality in driving economic output per individual, echoing the observations by Muhammad et al. (2024) on the industrial transformation of the oil-exporting Belt and Road Initiative (BRI) countries. Indicators such as “Gross fixed capital formation” and “Medium- and high-tech manufacturing” show moderate but meaningful influence, suggesting that while capital investment exists, its diversification impact remains contingent on technological upgrading—an insight validated by Jolo and Koç (2023), who found limited diversification payoff from capital formation in GCC economies.
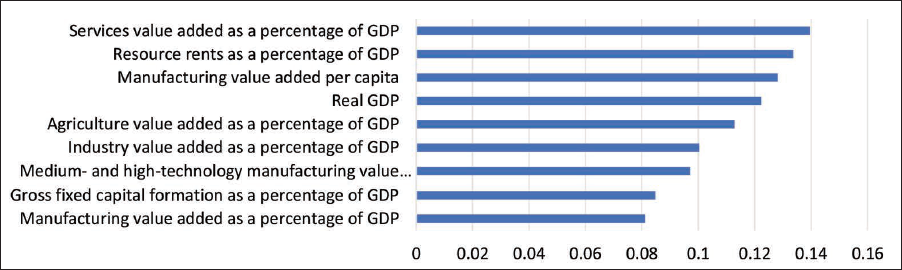
Figure 3 depicts Component B: Trade Diversification, led by “Export product concentration index,” “Total imports,” and “Export market concentration index.” These findings highlight the structural need for broader export baskets and diversified import sources to mitigate vulnerability to external shocks. As Liu and Hong (2024) show in the context of OECD countries, import diversification plays a stronger role in green growth than export diversification, suggesting a potential policy blind spot in the GCC trade strategies. The relatively lower weights assigned to “High-technology manufactured exports” and “Service exports” underline the underutilization of innovation-led trade opportunities. This is especially concerning, given the findings of Shadab (2023), who underscored the critical role of export diversification in sustaining the UAE’s GDP growth.
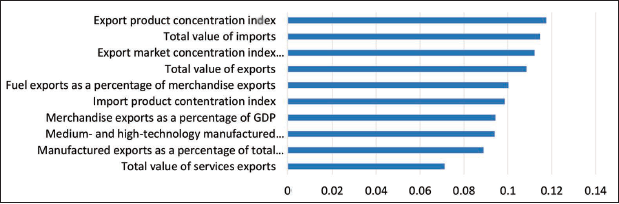
Figure 4 focuses on Component C: Government Revenue Diversification, where “Goods and services tax revenue” again emerges as the highest-weighted indicator (nearly 0.3), highlighting the foundational role of consumption-based taxes in stabilizing fiscal flows. “Total revenue” and “Income tax revenue” also carry substantial weights, reinforcing the significance of comprehensive tax reform. These insights are consistent with Li and Wei (2024), who argue that education and fiscal investments are critical for resource-rich countries to escape the volatility trap. The moderate influence of “Excise tax revenue” and “Trade revenue” suggests that while some fiscal instruments are being deployed, there is room to enhance the diversity of non-oil revenues through targeted reforms. These findings support policy prescriptions from Maswana and Farooki (2013), who emphasize the need for fiscal restructuring and institutional innovation in resource-intensive economies.
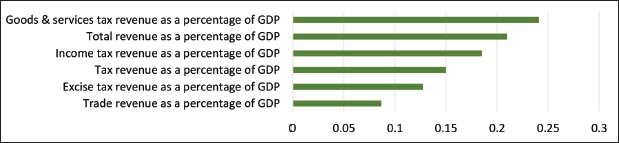
Figure 5 summarizes the component-level aggregation, indicating that government revenue diversification (Component C) holds the greatest overall influence (42.56%), followed by production (31.01%) and trade (26.43%) diversification. This underscores the strategic policy priority of enhancing fiscal sustainability as a foundation for broader economic resilience. While the strong weighting of Component C reflects immediate fiscal vulnerabilities, the substantial contributions from production and trade components underscore the systemic interdependencies required for achieving sustainable diversification. As Ben Hassen (2022) and Sweidan (2025) suggest, successful diversification in GCC countries requires integrated reforms that concurrently target governance, sectoral expansion, and long-term economic complexity.
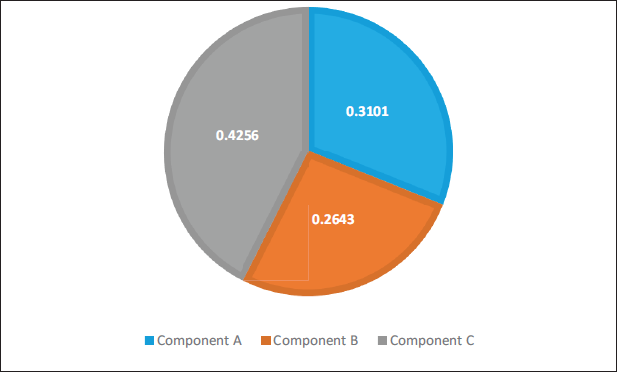
Table 3 provides yearly and average relative closeness scores alongside the overall rankings of GCC countries based on economic diversification from 2000 to 2022. The relative closeness scores measure each country’s proximity to the ideal diversification scenario, with higher values indicating better performance. Saudi Arabia has consistently demonstrated the highest scores over the years, achieving an average score of 0.7450 and securing the top rank. The United Arab Emirates follows closely with an average score of 0.5472, reflecting its significant efforts toward economic diversification. Qatar also performs well, with an average score of 0.2374, securing the third position. In contrast, Bahrain consistently scores the lowest, with an average score of 0.0834, placing it at the bottom of the rankings.
Yearly and Average Relative Closeness Scores with Overall Rankings of Gulf Cooperation Council (GCC) Countries Based on Economic Diversification.
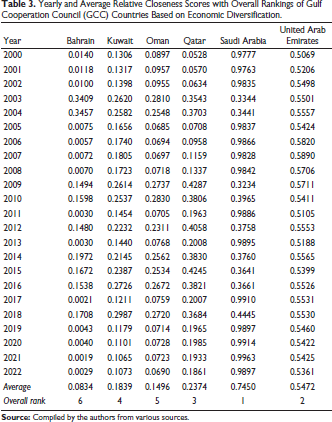
Kuwait and Oman display moderate performance, with average scores of 0.1839 and 0.1496, placing them fourth and fifth, respectively. The yearly data show fluctuations in the scores for all countries, highlighting periods of progress and setbacks in their efforts to diversify. However, the persistent lower scores of Bahrain and the variable performance of other nations underscore the ongoing challenges faced by the GCC countries in achieving sustained economic diversification. This comprehensive analysis highlights the necessity for ongoing and intensified policy measures to address these challenges and foster economic resilience throughout the region.
The temporal variation in relative closeness scores, particularly the fluctuations observed in years such as 2003–2004, 2009–2010, and 2020–2021, aligns with significant global macroeconomic events. For instance, the global financial crisis of 2008–2009 and the COVID-19 pandemic in 2020 had substantial economic repercussions across the GCC region. These events likely disrupted trade flows, fiscal revenues, and industrial activity, which are core dimensions of the economic diversification index. The observed dips or surges in certain countries’ rankings during these periods suggest that short-term exogenous shocks may have influenced the diversification scores beyond endogenous policy efforts.
Figures 6 and 7 depict the temporal progression of relative closeness scores for GCC countries from 2000 to 2022, highlighting significant disparities in their economic diversification trajectories. Saudi Arabia consistently exhibits the highest relative closeness scores, indicating a strong and sustained effort in economic diversification throughout the period. In contrast, Bahrain shows persistently low scores, reflecting its ongoing challenges in achieving economic diversification. The United Arab Emirates maintains a relatively high and stable performance, underscoring its effective diversification strategies. Qatar shows considerable improvement over time, although with notable fluctuations, indicating intermittent progress in its diversification efforts. Kuwait and Oman exhibit moderate and variable performances, suggesting a less consistent approach to diversification. These trends highlight the varying effectiveness of diversification policies across the GCC countries, underscoring the need for tailored strategies to address specific national challenges and foster broader economic resilience.
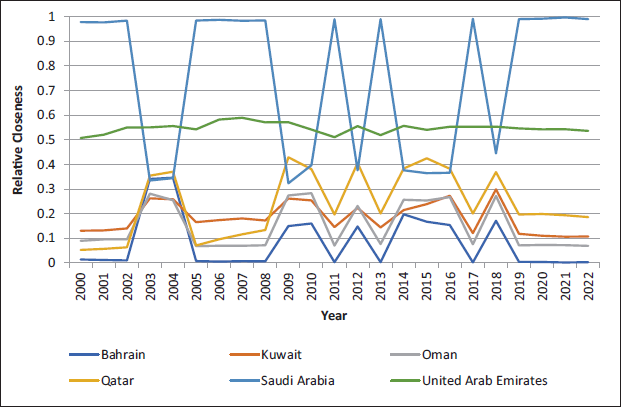
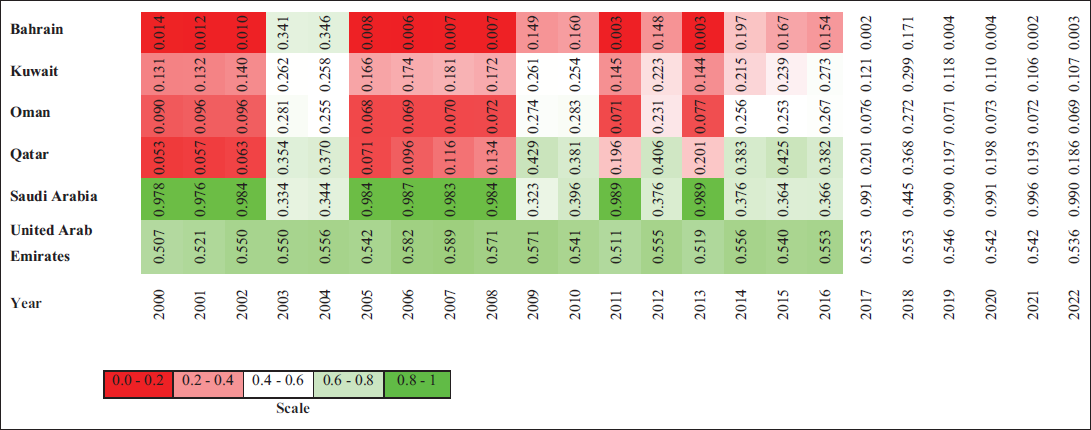
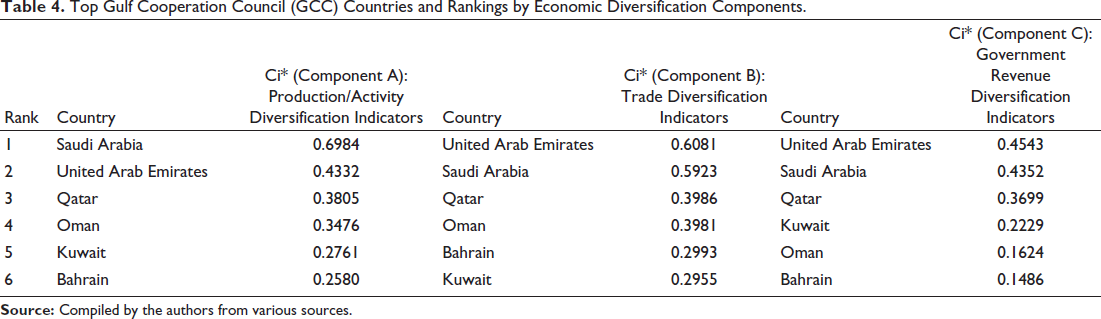
Table 4 presents the rankings of the GCC countries based on their performance in three key economic diversification components: Production/Activity (Component A), Trade (Component B), and Government Revenue (Component C). Saudi Arabia leads in Component A with a Ci* of 0.6984, underscoring its strong diversification in production and industrial activities. The United Arab Emirates dominates both Component B and Component C, with Ci* scores of 0.6081 and 0.4543, respectively, highlighting its superior trade diversification and robust government-revenue diversification strategies. Qatar consistently ranks third across all components, indicating a balanced but less dominant diversification approach. Oman and Kuwait exhibit moderate performance, with Oman ranking fourth in both Component A and Component B, while Kuwait ranks fourth in Component C. Bahrain consistently ranks lowest, particularly in Component C, reflecting its ongoing challenges in achieving substantial economic diversification. These rankings underscore the varying degrees of success among GCC countries in implementing effective diversification policies, with notable leadership by Saudi Arabia and the United Arab Emirates across different components.
Top Gulf Cooperation Council (GCC) Countries and Rankings by Economic Diversification Components.
The comprehensive analysis of economic diversification among the GCC countries presents a nuanced understanding of the relative performance of Bahrain, Kuwait, Oman, Qatar, Saudi Arabia, and the UAE across multiple dimensions. The data, derived from the GEDI 2024 dataset and evaluated using the CRITIC and TOPSIS methods, underscore substantial disparities in diversification efforts and outcomes. These findings align with recent evidence emphasizing the risks of resource dependence and the need for institutional and industrial reform in oil-exporting countries, such as those in the GCC (Imran et al., 2025; Song & Hou, 2024).
Saudi Arabia exhibits the highest relative closeness scores, averaging 0.7450, which underscores a sustained policy shift toward non-oil sectors, including manufacturing, tourism, and entrepreneurship. These transitions reflect broader regional trends, as observed by Abdelkawy (2024), who highlights the diminishing returns of hydrocarbon rents and the urgency of structural diversification. Similarly, the UAE follows closely with a score of 0.5472, leading in trade and fiscal diversification, consistent with Liu and Hong’s (2024) findings that trade structure reform is pivotal in mitigating the resource curse.
Qatar’s moderate ranking (0.2374) is bolstered by progressive trade and revenue diversification, although performance remains uneven—echoing the concerns raised by Zhang et al. (2024) regarding volatile outcomes in South Asia due to inconsistent policy implementation and overreliance on natural resource rents. Kuwait and Oman display balanced but modest gains, suggesting a need for deeper fiscal and institutional diversification—paralleling findings by Muhammad et al. (2024) on the slow transformation of industrial structures in resource-rich countries along the Belt and Road. Bahrain’s consistently low performance (average score 0.0834) signals systemic issues in revenue generation and production diversification. The situation mirrors challenges described in Sweidan (2025), where state control and rigid social contracts hinder effective economic reform in the Gulf region.
The analysis of annual Ci* scores reveals that regional diversification has been shaped not only by long-term strategies but also by external shocks such as the 2008 global crisis and the COVID-19 pandemic, as discussed by Abdelkawy (2024) and Ben Hassen (2022). Moreover, the empirical findings here validate the broader theoretical consensus that trade diversification, institutional quality, and human capital development are critical for escaping the resource curse (Maswana & Farooki, 2013; Mehmood & Kaewsaeng-On, 2024). These insights affirm that while Saudi Arabia and the UAE have emerged as frontrunners in diversification, the remaining GCC countries must accelerate structural reforms, invest in digital and green transitions, and adopt region-specific strategies to foster resilience and sustainable growth (Li & Wei, 2024; Zhou & Feng, 2024). Hence, this study contributes not only methodologically through CRITIC–TOPSIS but also conceptually by bridging empirical outcomes with contemporary literature, offering practical implications for policy recalibration in the post-oil era.
While Saudi Arabia ranks high in the composite economic diversification index (Table 3), this does not imply that it leads in every individual component. As shown in Table 4, the United Arab Emirates ranks first in the revenue diversification dimension, with Saudi Arabia in second place. Moreover, all GEDI component scores reflect relative performance within the GCC region. Therefore, Saudi Arabia’s position should be interpreted in comparative—not absolute—terms. Despite a continued reliance on hydrocarbon revenues, its fiscal structure may appear more diversified relative to some neighboring economies when evaluated across standardized indicators.
Conclusion and Implications
The objective of this article was to assess the progress of economic diversification efforts among the GCC countries over a two-decade period, using a comprehensive analysis of various indicators and components. The study employed the CRITIC and TOPSIS methods to provide a robust and nuanced evaluation of the diversification strategies implemented by these countries. The findings indicate significant variations in performance, with Saudi Arabia and the UAE emerging as leaders in economic diversification, demonstrating strong and sustained efforts across multiple dimensions. In contrast, Bahrain consistently ranked the lowest, highlighting substantial challenges in its diversification initiatives.
The analysis revealed that the success of Saudi Arabia and the UAE can be attributed to their substantial investments in infrastructure, technological advancements, and strategic policy interventions. These countries have effectively leveraged their natural resource wealth to diversify their economies, reducing their dependency on oil and enhancing their industrial and service sectors. Qatar, while showing moderate progress, exhibited notable fluctuations in its diversification efforts, indicating intermittent policy effectiveness and the influence of external economic factors. Kuwait and Oman presented a balanced yet less aggressive approach to diversification, with moderate performance across all components. Kuwait’s focus on government revenue diversification and fiscal framework improvements showed promise, but its efforts to diversify trade and production lagged. Oman’s consistent yet moderate progress suggests a steady but less ambitious diversification strategy, necessitating more comprehensive and sustained policy interventions. Bahrain’s consistently low performance underscores the need for substantial policy reforms and strategic investments to achieve meaningful economic diversification. The country’s reliance on limited economic activities and insufficient diversification of government revenue streams was a major impediment to its economic stability and growth.
The study also emphasized the crucial importance of a multifaceted approach to economic diversification, encompassing technological innovation, infrastructure development, human capital investment, environmental sustainability, and robust governance frameworks. The experiences of the GCC countries provide valuable insights into the strategies and factors that drive successful diversification. As global economic dynamics continue to evolve, the need for adaptive and forward-looking diversification strategies becomes even more crucial for ensuring sustainable and resilient economic growth in resource-dependent economies.
Implications of these findings suggest that policymakers in the GCC region must prioritize comprehensive and targeted policy measures to address specific national challenges and promote broader economic resilience. The critical role of government revenue diversification, industrial development, and trade diversification in achieving economic stability cannot be overstated. Strategic investments in education, technology, and infrastructure, combined with robust governance and regulatory frameworks, are crucial for creating an environment that fosters economic diversification. These measures will not only enhance economic resilience but also ensure long-term sustainable development across the region.
While general policy recommendations provide conceptual guidance, this study acknowledges the importance of translating these into actionable, context-specific reforms. For instance, Bahrain’s persistent low diversification score suggests a need to overhaul bureaucratic procedures through regulatory streamlining and e-governance initiatives that reduce friction for investors. Qatar, endowed with vast natural gas reserves, should prioritize downstream integration, including liquefied natural gas (LNG)-based petrochemical clusters and the development of green hydrogen export potential, leveraging its sovereign wealth fund for infrastructure investments. In Saudi Arabia, diversification can be accelerated by expanding non-oil small and medium-sized enterprises (SMEs) incentives within strategic sectors identified in Vision 2030, such as tourism, advanced manufacturing, and entertainment. The UAE, despite already being highly diversified, must scale its tech innovation ecosystem—particularly in artificial intelligence (AI), fintech, and digital health—and enhance labor flexibility to sustain its momentum. Oman and Kuwait, given their moderate performance, should focus on regional value-chain integration and targeted investments in logistics and eco-tourism. These differentiated strategies ensure that economic resilience is pursued in line with each country’s structural and resource endowments.
Moreover, this study underscores the importance of aligning economic diversification strategies with evolving geopolitical and macroeconomic realities. While policy blueprints such as Saudi Arabia’s Vision 2030 or Qatar’s National Vision 2030 articulate ambitious goals, their implementation is shaped by both internal capabilities and external constraints. For instance, fiscal reforms vary in depth across the region—with Saudi Arabia and the UAE taking more assertive steps than Qatar—while recent developments, such as the partial scaling back of the NEOM project, illustrate the challenges of translating strategic visions into operational outcomes. Additionally, sports-related investments have emerged as innovative levers of diversification, particularly in Saudi Arabia and Qatar, contributing to tourism, SME development, and global visibility. These dimensions, often underemphasized in conventional economic metrics, should be incorporated into future assessments of diversification success.
While this study provides a comprehensive evaluation of economic diversification trends across the GCC, it does not statistically isolate the impact of exogenous macroeconomic shocks—such as the 2008 global financial crisis or the 2020 COVID-19 pandemic—on diversification outcomes. Although visual trends reflect possible disruption patterns, the absence of explicit control variables limits the precision of causal attribution. Future research could strengthen this analysis by applying interrupted time-series models, structural break tests, or crisis-adjusted panel techniques to account for the effects of such systemic shocks on diversification trajectories.
Another limitation of this study is its exclusive focus on GCC countries, which, while allowing for an in-depth regional assessment, limits the ability to benchmark performance against other resource-rich economies such as Norway, Indonesia, or Russia. Future research should incorporate comparative analyses with non-GCC hydrocarbon-dependent countries to better contextualize the diversification trajectories observed in the GCC. Such benchmarking could help distinguish between region-specific constraints and broader structural challenges shared across resource-based economies.
While the GEDI provides a comprehensive framework for capturing economic diversification across production, trade, and revenue dimensions, it has not yet been formally benchmarked against other established indices—such as the Economic Complexity Index, the IMF’s Export Diversification Index, or the World Bank’s Theil Index. Future research should therefore explore the convergence and divergence among these measures further to validate the robustness and policy relevance of GEDI. Moreover, CRITIC–TOPSIS offers a transparent and objective ranking mechanism; alternative MCDM techniques, such as AHP, Preference Ranking Organization METHod for Enrichment Evaluation (PROMETHEE), or grey-Decision-Making Trial and Evaluation Laboratory (DEMATEL), may yield different weightings and prioritizations. Future studies could compare multiple MCDM frameworks to evaluate the consistency and sensitivity of diversification outcomes across methodological choices.
Footnotes
Acknowledgment
The findings of this article were presented at the 2024 Global Conference on Economic Diversification (GCED) held in Dubai.
Data Availability
The data for this study were obtained from the Economic Diversification Index (EDI). The current edition of the EDI is available for open access at
Declaration of Conflicting Interests
The authors declared no potential conflicts of interest with respect to the research, authorship and/or publication of this article.
Funding
The authors received no financial support for the research, authorship and/or publication of this article.