
Abstract
In the past, epidemiological studies focused on cavitated stages of caries. The arrival of the International Caries Detection and Assessment System (ICDAS) in 2004 allowed for clinical measurements of the initial stages of enamel caries. However, since the introduction, most studies applying the ICDAS still have studied the diseased population. The objective of this cross-sectional observational study was to describe early enamel caries in a large healthy young adult population and determine the relationship with diet and oral hygiene measures. The study population consisted of 268 healthy participants without frank cavitation. The examinations were done visually and radiographically using ICDAS on all tooth surfaces. In total, 8.6% of the surfaces (occlusal > approximal > smooth) had caries, of which 92.0% were confined to enamel (28.5% ICDAS score 1, 54.0% score 2, 8.6% score 3). Thirteen percent of the occlusal and 63% of the approximal caries were found with radiography. Thus, radiography is quintessential for the diagnosis of approximal enamel lesions. We found a positive correlation between enamel caries (ICDAS 1 to 3) and the consumption of mono- and disaccharides and carbohydrates (r = 0.226 and r = 0.188, respectively, both P < 0.01), as well as a negative correlation with alcohol consumption (r = −0.202, P < 0.01). There was also a positive correlation between enamel caries and the energy intake from mono- and disaccharides (sugar kJ, r = 0.206, P < 0.01), which was independent of body mass index. Only 11 participants consumed less than 10% of total energy as sugar kJ, which is the recommended percentage of kJ from free sugar by the World Health Organization. No clear correlation was found with oral hygiene. In conclusion, in this healthy young adult population, caries was found in 97.8% of the subjects, mostly initial enamel caries (ICDAS 1 to 2) in the occlusal surface of molars, and was related with dietary factors.
Introduction
World Health Organization (WHO) data suggest that the prevalence of caries has been declining. This decline started in the mid-1970s after the use of effective fluoride toothpaste became commonplace (Marthaler 2004; Haugejorden and Birkeland 2006; Schuller and Poorterman 2006). For example, Marthaler showed that in Switzerland, the number of decayed missing or filled teeth (DMFT) in 14-y-olds was reduced from 12.5 in 1964 to 2 in 2000 (Marthaler 2004). Even though the decline is considerable, recent estimations of the prevalence of caries (i.e., the percentage of patients with the disease) were 60% to 90% throughout the world and thus remain high (Petersen and Lennon 2004; Schuller et al. 2007, 2013). Moreover, most epidemiology studies underestimate the prevalence of caries by recording only cavitated lesions with the DMFT system (WHO 1997; Braga et al. 2009; Fisher et al. 2012).
In 2004, the International Caries Detection Assessment System (ICDAS) was first constituted (Pitts 2004) to register all stages of caries (precavitated and cavitated). In the early stages, caries can be arrested or remineralized with preventive noninvasive therapy. In the later stages, the microbial activity has reached the dentin and the damage is mostly irreversible, where the process can only be constrained through operative therapy (Ferreira Zandoná et al. 2012). To improve long-term oral health, it is necessary to detect and manage the earliest stages of caries (Mejàre et al. 2004; Pitts 2011; Ferreira Zandoná et al. 2012).
An FDI World Dental Federation task group emphasized that caries should be considered a behavioral disease with a bacterial component (Frencken et al. 2012). The 2 main behaviors that should be adapted to prevent caries noninvasively are reduce the frequency of fermentable sugar intake and brush with a fluoridated toothpaste twice daily. Over the past decades, oral hygiene has been improved and fluoride is widely used, which has reduced the caries experience in Western populations. In light of this, the correlation of caries with sugar intake has been obscured: consumption of sugar has increased steadily or remained stable, while caries has declined (Einarsdottir and Bratthall 1996; Nyvad 2003). Recently, the WHO introduced a new dietary guideline to reduce caries, which recommends to keep the dietary kJ obtained by consuming free sugar below 10% (WHO 2015).
Several studies have assessed populations with active caries using the ICDAS system and tested the correlations with caries risk factors (Ferreira Zandoná et al. 2012; Honkala et al. 2014). However, it is unknown whether these risk factors are similarly correlated with the presence of early enamel caries in a group of healthy participants. The aim of this study was to comprehensively describe the early stages of caries in a healthy young adult population free of cavities and their relation with behavioral caries risk factors such as diet and oral hygiene.
Materials and Methods
Study Population
This study was carried out within the framework of the Top Institute Food and Nutrition project, “Estimating the Boundaries for a Healthy Oral Ecosystem in Young Participants” (Oliveira et al. 2015), and conducted according to the ethical principles of the Declaration of Helsinki of 2008. The study was approved by the Medical Ethics Review Committee of the Academic Medical Centre of Amsterdam (2012_210 # B2012406) and registered at the Dutch Trial Register (NTR3649). In short, in 2012 and 2013, a cross-sectional survey was undertaken among nondentistry students aged 18 to 32 y, recruited at the Free University of Amsterdam by e-mail. The students were invited to fill out an online questionnaire to determine which participants were considered free of dental problems during a periodical checkup by their general dentist within the previous year. These participants were invited for a follow-up screening visit. During this visit, a medical questionnaire on general health, peripheral blood analysis, and clinical oral exams was performed (see Oliveira et al. 2015). The main inclusion criteria were systemically healthy, nonsmoking, no periodontitis (i.e., scores ≤3 of the Dutch Periodontal Screening Index [Van der Velden 2009]), and no frank cavities. Based on this selection, the study population was determined to be systemically and orally healthy. This study has been performed according to STROBE (Strengthening the Reporting of Observational Studies in Epidemiology) guidelines. The authors declare no conflict of interests to this study.
Caries Assessment
Visual assessment (ICDASvi)
The clinical examination was performed by an experienced examiner (M.L.). The ICDAS was applied in which a score is given to each tooth surface, forming a scale from 0 to 6 (Ismail et al. 2007). In short, 0 = sound surface, 1 = first visual change in enamel (5 s of air drying is required), 2 = distinct visual change in enamel (visible when wet and dry), 3 = localized enamel breakdown because of caries with no visible dentin or underlying shadow, 4 = underlying dark shadow from dentin with or without localized enamel breakdown, 5 = distinct cavity with visible dentin, and 6 = extensive distinct cavity with visible dentin. In addition, in this assessment, missing teeth and sealed or filled surfaces were determined. First, the dentition of a participant was polished. Then, all teeth apart from the third molars were examined while participants were seated in a dental chair with halogen light and an air-syringe. Visual examination was performed using a plane front-surface dental mirror and WHO periodontal probes. Where needed, a probe or dental floss was used to remove dental plaque or remnants of polishing paste to inspect the surface. Since this part of the assessment is visual, the scores were referred to as ICDAS visual (ICDASvi).
Radiographic assessment (ICDASx)
In addition to the visual examination, 2 bite-wing radiographs left and right were obtained on phosphor plates (Dürr Dental) exposed by an X-ray source (Planmeca Oy; 63 kV, 8 mA, 0.2 s). In case not all posterior teeth were visible or there was overlap of the teeth on the first image, another bite-wing radiograph was taken. The phosphor plates were read with a laser phosphor image scanner (VistaScan; Dürr Dental). Radiographs were independently analyzed by a modified version of the ICDAS (Ferreira Zandoná et al. 2012) based on progression of the lesion front: 0 = sound surface, 1 = lesion front in outer half of enamel, 2 = inner half of enamel including the dentino-enamel junction, 3 = outer one-third of dentin, 4 = middle one-third of dentin, 5 = inner one-third of dentin, and 6 = into the pulp. These scores were referred to as ICDASx.
Combining clinical and radiographic data (ICDAS)
The scores from the clinical (ICDASvi) and radiographic (ICDASx) indices were combined into the ICDAS. The index with the highest vi or x score was used in the total score. In case a surface had an ICDASvi score of 1 and an ICDASx score of 2, ICDAS was 2.
Activity assessment
Each lesion (ICDAS score 1 to 3) was given an activity score that could either be active (1) or inactive (0), based on the likelihood of progression. This was based on the visual appearance (chalky or shiny), tactile feeling (smooth or rough surface), and/or the potential for plaque accumulation (ICDAS manual as described by International Caries Detection and Assessment System Coordinating Committee 2009). ICDAS scores 4 to 6 were considered active.
Behavioral Factors
Diet
The volunteers filled out a validated food frequency questionnaire. This food frequency questionnaire (FFQ) was developed to assess habitual dietary intake in the previous month (Feunekes et al. 1993; Siebelink et al. 2011). The FFQ was based on consumption data of 20- to 40-y-old participants of the Dutch National Food Consumption Survey of 2007 to 2010 and the Dutch food composition database (van Rossum et al. 2011). The FFQ included questions on frequency and amount of intake of 130 food items. Selection of food items and calculation of the weighted average nutrient composition of the food items were performed using the validated Dutch FFQ-tool (Molag et al. 2010).
Oral hygiene
Using a modified version of the Oral Hygiene Behavior questionnaire (Buunk-Werkhoven et al. 2011), information regarding oral hygiene habits was acquired. This included the use of fluoride toothpaste, brushing frequency, brushing time, brushing method (hand or electrical), and the frequency of flossing and tongue cleaning.
Data Analysis
The distribution of ICDAS scores was calculated for the study population within the entire dentition and per surface type: occlusal (O), mesial (M), distal (D), lingual (L), and buccal (B).
The DMFS indices were calculated by summing the decayed (D), missing (M), and filled (F) surfaces (S) per participant. The D component was constructed from different ICDAS score ranges (e.g., when the range was ICDAS 1 to 6, all ICDAS scores were considered decayed, but when the range was ICDAS 4 to 6, only the highest 3 scores were counted as decayed). Scores also were calculated for surfaces with enamel caries (ICDAS 1 to 3e), dentin caries (ICDAS 4 to 6d), filled surfaces (FS), and active surfaces (Active-S) per participant.
Food frequency questionnaire
The percentage of mono- and disaccharides (sugar kJ) of each participant was calculated from the validated food frequency questionnaire (kJ from mono- and disaccharides / total kJ * 100 = sugar kJ), and the population was split into 6 groups: 0% to 5%, 5% to 10%, 10% to 15%, 15% to 20%, 20% to 25%, and >25% sugar kJ.
Statistical analysis
Statistical analysis was performed with SPSS 22 UK software (SPSS, Inc.). Spearman’s rank correlation coefficient was calculated for dietary factors and caries. The Mann-Whitney U test was used to compare groups of participants.
Results
Study Population
In total, 336 subjects were screened to include 268 participants. The main reasons for exclusion of the participants were the usage of systemic medication (n = 14) and the presence of frank cavities (n = 8), followed by a variety of different other reasons (Oliveira et al. 2015). The final study population consisted of 150 men (56%) and 118 women (44%) with an age range of 18 to 32 years and a mean (SD) age of 22.6 (2.6) years. In the Netherlands, no water fluoridation system is in place. All variables were assessed in all participants, apart from the food frequency questionnaire (diet), which was not filled out by 13 participants regardless of several reminders.
Caries Assessment ICDAS
ICDAS (i.e., visual assessment, ICDASvi, and radiographic assessment, ICDASx, combined) found 2,905 (8.6%) of the 33,960 surfaces to be carious. Even in this healthy young adult population, caries was observed in 97.8% of the subjects. Caries was found mostly in the premolars and molars, and scores 1 and 2 were most prevalent (Fig. 1A, B). Also, the higher scores (≥3) were found in the occlusal surface of the first and second molars. Only 2.2% of the participants were truly caries free (i.e., no surfaces with caries) after the comprehensive assessment. The severity of the caries was distributed as follows: 28.5% score 1, 54.0% score 2, 9.5% score 3, 7.6% score 4, and 0.4% score 5. No score 6 was observed. The surfaces with the highest percentage of caries were occlusal > approximal > smooth (Fig. 1C).
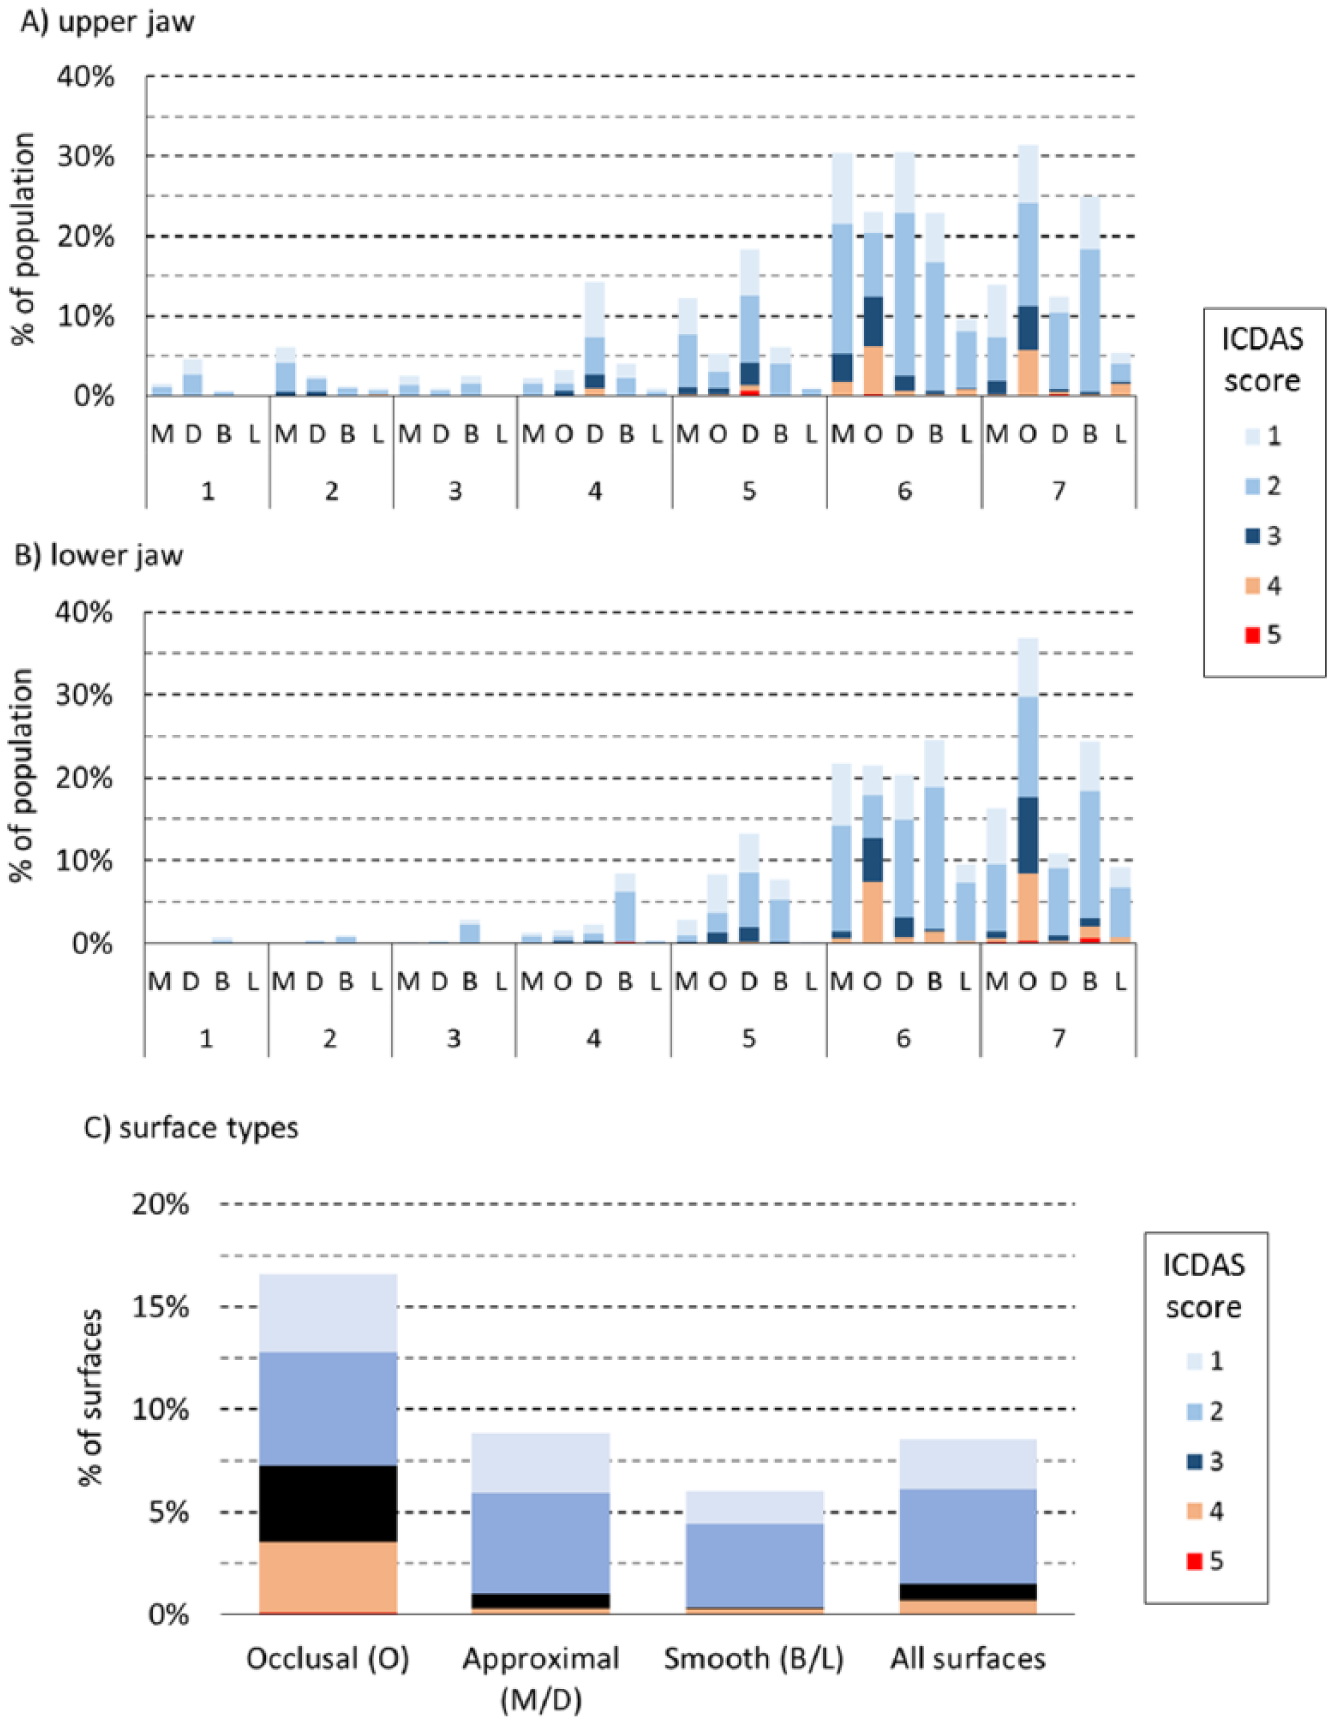
International Caries Detection Assessment System (ICDASvi +ICDASx) distribution among the study population in the upper jaw (
DMFS
The DMFS was calculated with different ICDAS score ranges (Table 1). The mean (SD) number of surfaces with enamel caries (ICDAS 1 to 3e) was 9.88 (7.69) per participant, and for dentin caries (ICDAS 4 to 6d), this was 0.87 (1.36). The mean (SD) number of surfaces with active caries lesions was 3.20 (4.19) per participant. There were no significant differences in caries experiences between men and women (data not shown).
DMFS with Different ICDAS Score Ranges.
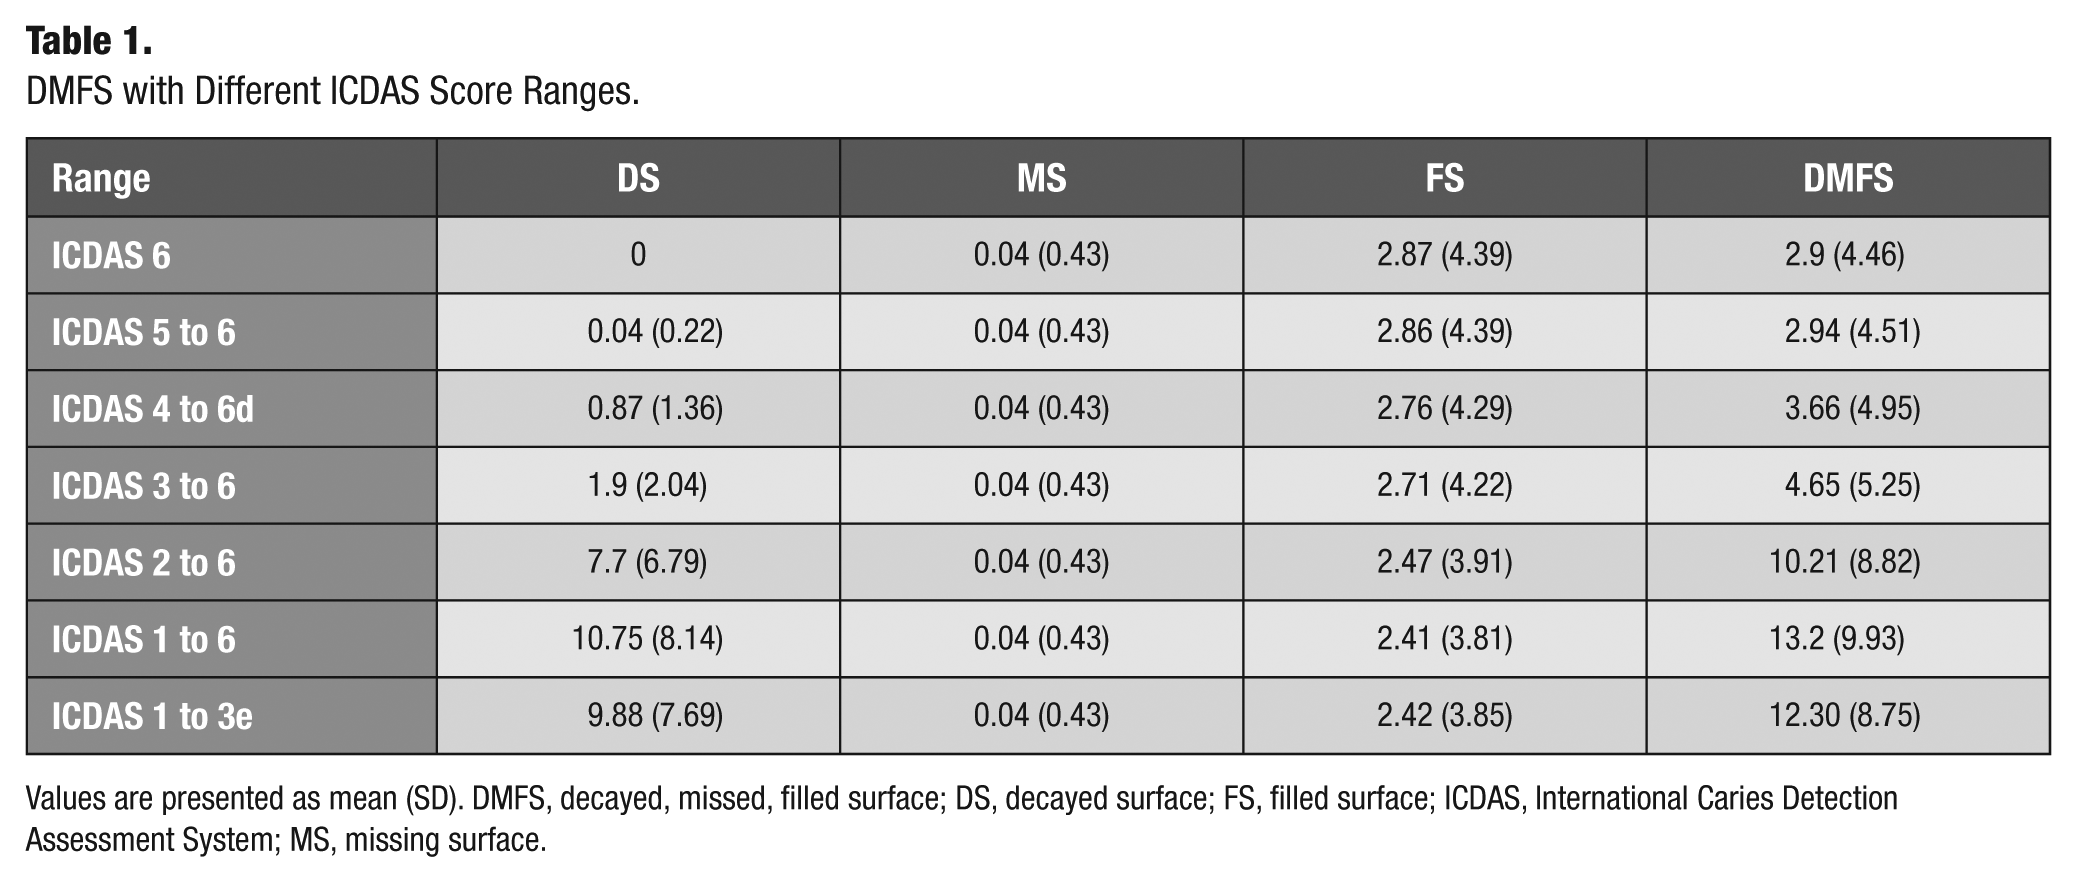
Values are presented as mean (SD). DMFS, decayed, missed, filled surface; DS, decayed surface; FS, filled surface; ICDAS, International Caries Detection Assessment System; MS, missing surface.
Diet
The age of the participants and some of the dietary parameters showed significant correlations with ICDAS and filled surfaces (FS) (Table 2). The score range of ICDAS influenced the strength of the correlation with other parameters. There was a significant correlation of enamel caries (ICDAS 1 to 3e) with dietary parameters, while dentin caries (ICDAS 4 to 6d) correlated with age. The positive correlation of enamel caries with dietary parameters was weak in all categories of carbohydrate intake, where the strongest correlation was with mono- and disaccharides (r = 0.226, P < 0.05). Surprisingly, there was also a weak but significant negative correlation with alcohol and enamel caries (r = −0.202, P < 0.01). After dichotomization, the participants above the ICDAS 4 to 6d median were on average 1.15 y older (P < 0.01, Appendix Table 1)—a significant difference in age that was not observed based on the median of enamel caries (ICDAS 1 to 3e).
Spearman Correlation Coefficients between Caries Scores, Age, and Dietary Parameters.
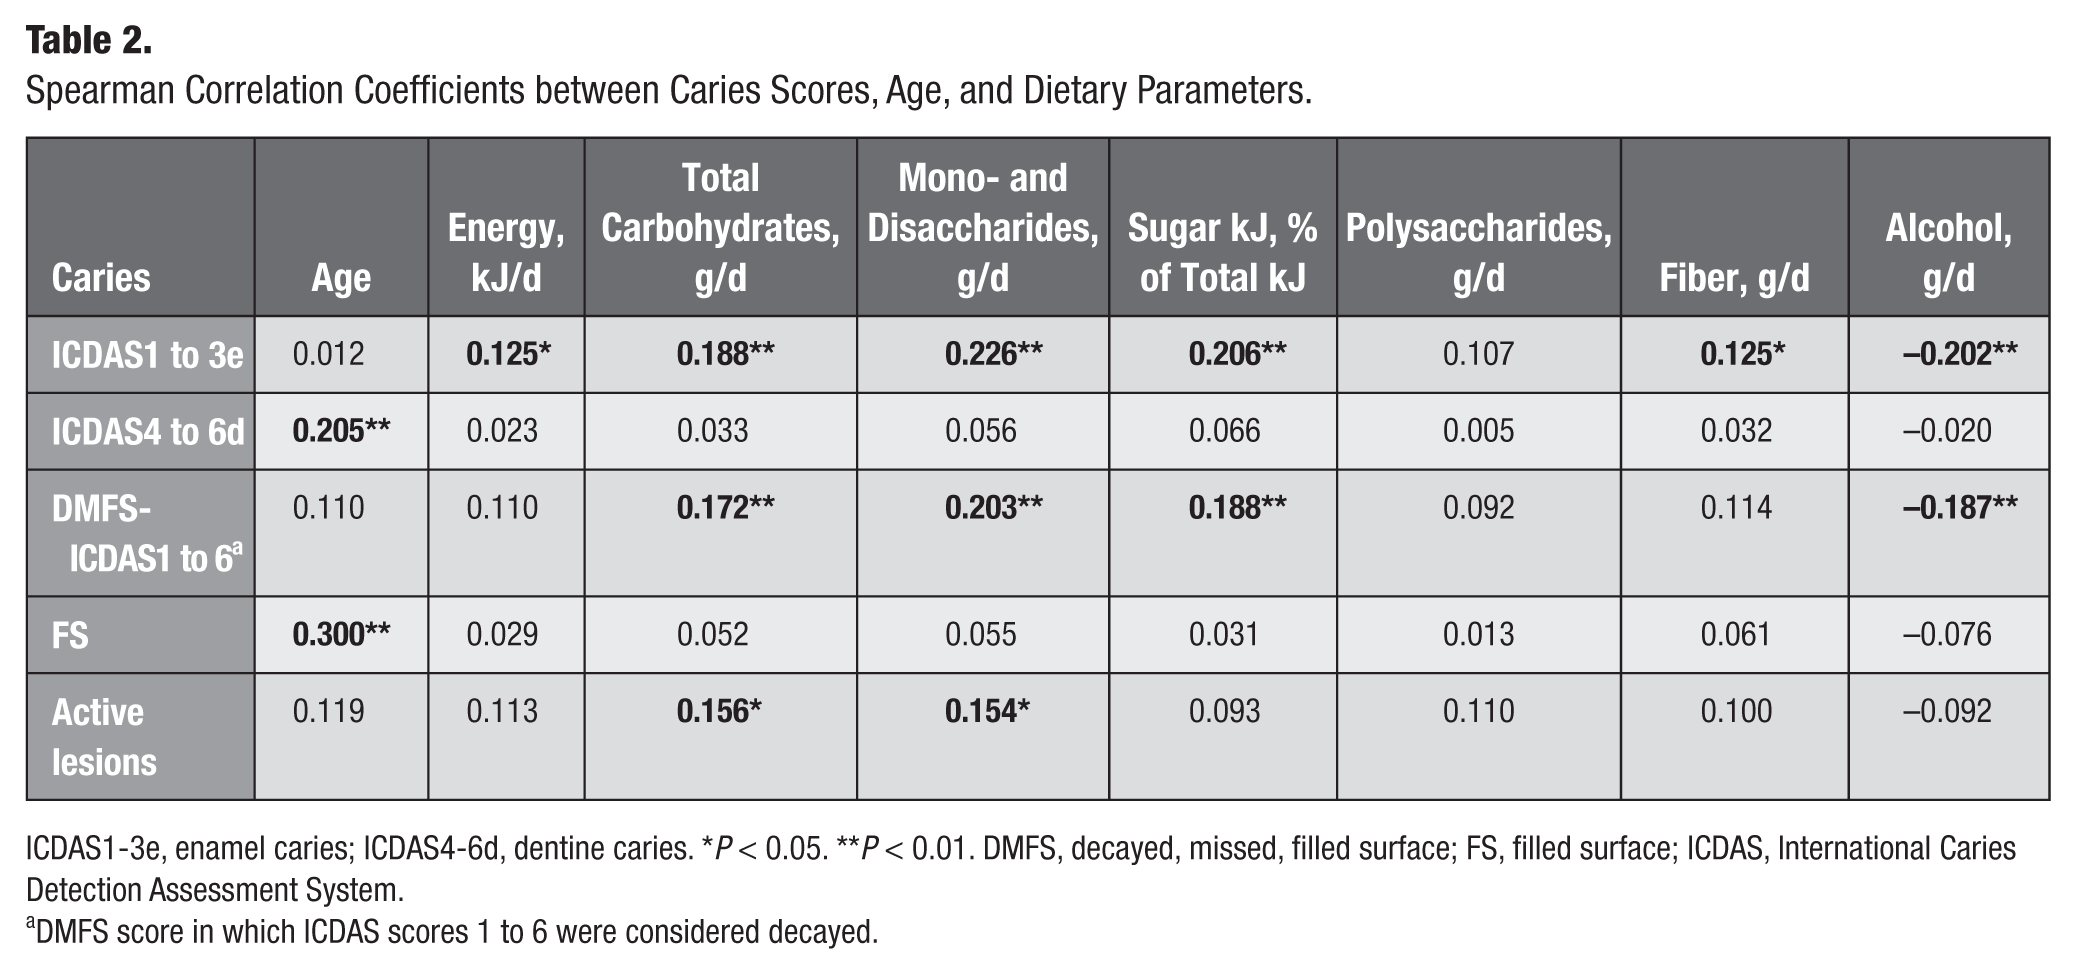
ICDAS1-3e, enamel caries; ICDAS4-6d, dentine caries. *P < 0.05. **P < 0.01. DMFS, decayed, missed, filled surface; FS, filled surface; ICDAS, International Caries Detection Assessment System.
DMFS score in which ICDAS scores 1 to 6 were considered decayed.
Sugar Intake
According to the validated food frequency questionnaire, which was filled out by 255 of the participants (95.6%), the mean (SD) daily energy intake was 12,253 (4,409) kJ/d, and the mean (SD) amount of mono- and disaccharides consumed was 133.3 (57.1) g/d. To calculate the sugar kJ intake, we multiplied the amount of grams of mono- and disaccharides by 16.1 (average kJ in mono- and disaccharides). Then, we divided this by the total kJ intake to calculate the percentage of sugar kJ (Food and Agriculture Organization [FAO] 2007). The average sugar kJ was 17.7% (Appendix Table 2). A significant difference was found between the sugar kJ of men (16.9%; SD, 4.6%) and women (18.7%; SD, 5.0%; P < 0.01).
Only 11 (4%) participants consumed less than 10% sugar kJ (Fig. 2). In these 11 participants, the mean (SD) number of surfaces with enamel lesions (ICDAS 1 to 3) per participant was 8.9 (9.3), while the other 245 participants (≥10% sugar kJ intake) had a mean (SD) of 10 (7.6) enamel lesions. However, this difference was not significant. When moving the threshold to 15% sugar kJ, the difference was significant: a mean (SD) of 8.1 (8.2) enamel caries for <15% sugar kJ vs a mean (SD) of 10.6 (7.3) for ≥15% sugar kJ (P = 0.01). The overall correlation coefficient of enamel caries and sugar kJ was 0.206 (P < 0.01, Table 2), and there was no relationship with body mass index (BMI). In this population, there were no participants who consumed less than 5% sugar kJ.
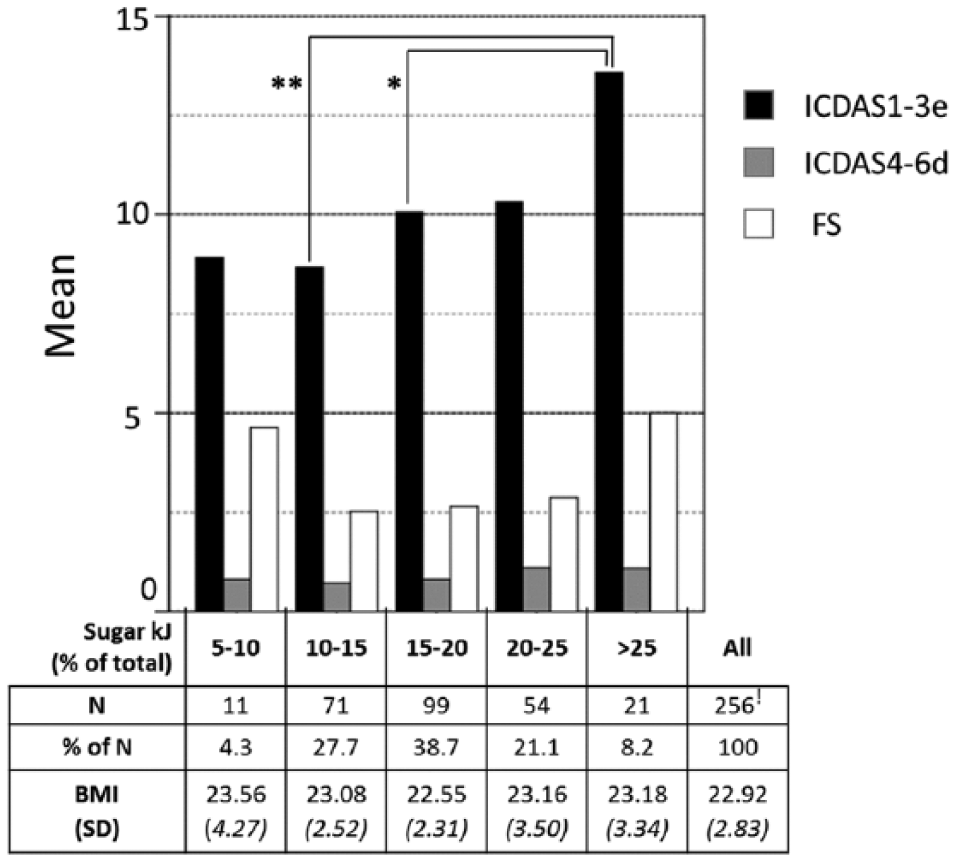
Caries in participants with different percentages of total energy derived from sugar (sugar kJ). Please note 12 of the 268 participants did not complete the Validated Food Frequency Questionnaire. *Mann-Whitney U test P < 0.05; **Mann-Whitney U test P < 0.01. BMI, Body Mass Index; ICDAS1-3e, enamel caries; ICDAS4-6d, dentine caries; FS, filled surfaces.
Oral Hygiene
To evaluate the possible influence of oral hygiene measures on the caries prevalence, the population was split based on their oral hygiene habits (Table 3). Of the participants, 93.3% used fluoride toothpaste at least once a day. Notably, in participants who never flossed, the filled surfaces were twice as low on average as in the daily flossers (P < 0.05). Also, in the group that used an electric toothbrush, more dentin caries and filled surfaces were found than in the group that used a manual toothbrush (P > 0.05).
Groups Based on Oral Hygiene and Their Enamel and Dentine Caries and Filled Surfaces.
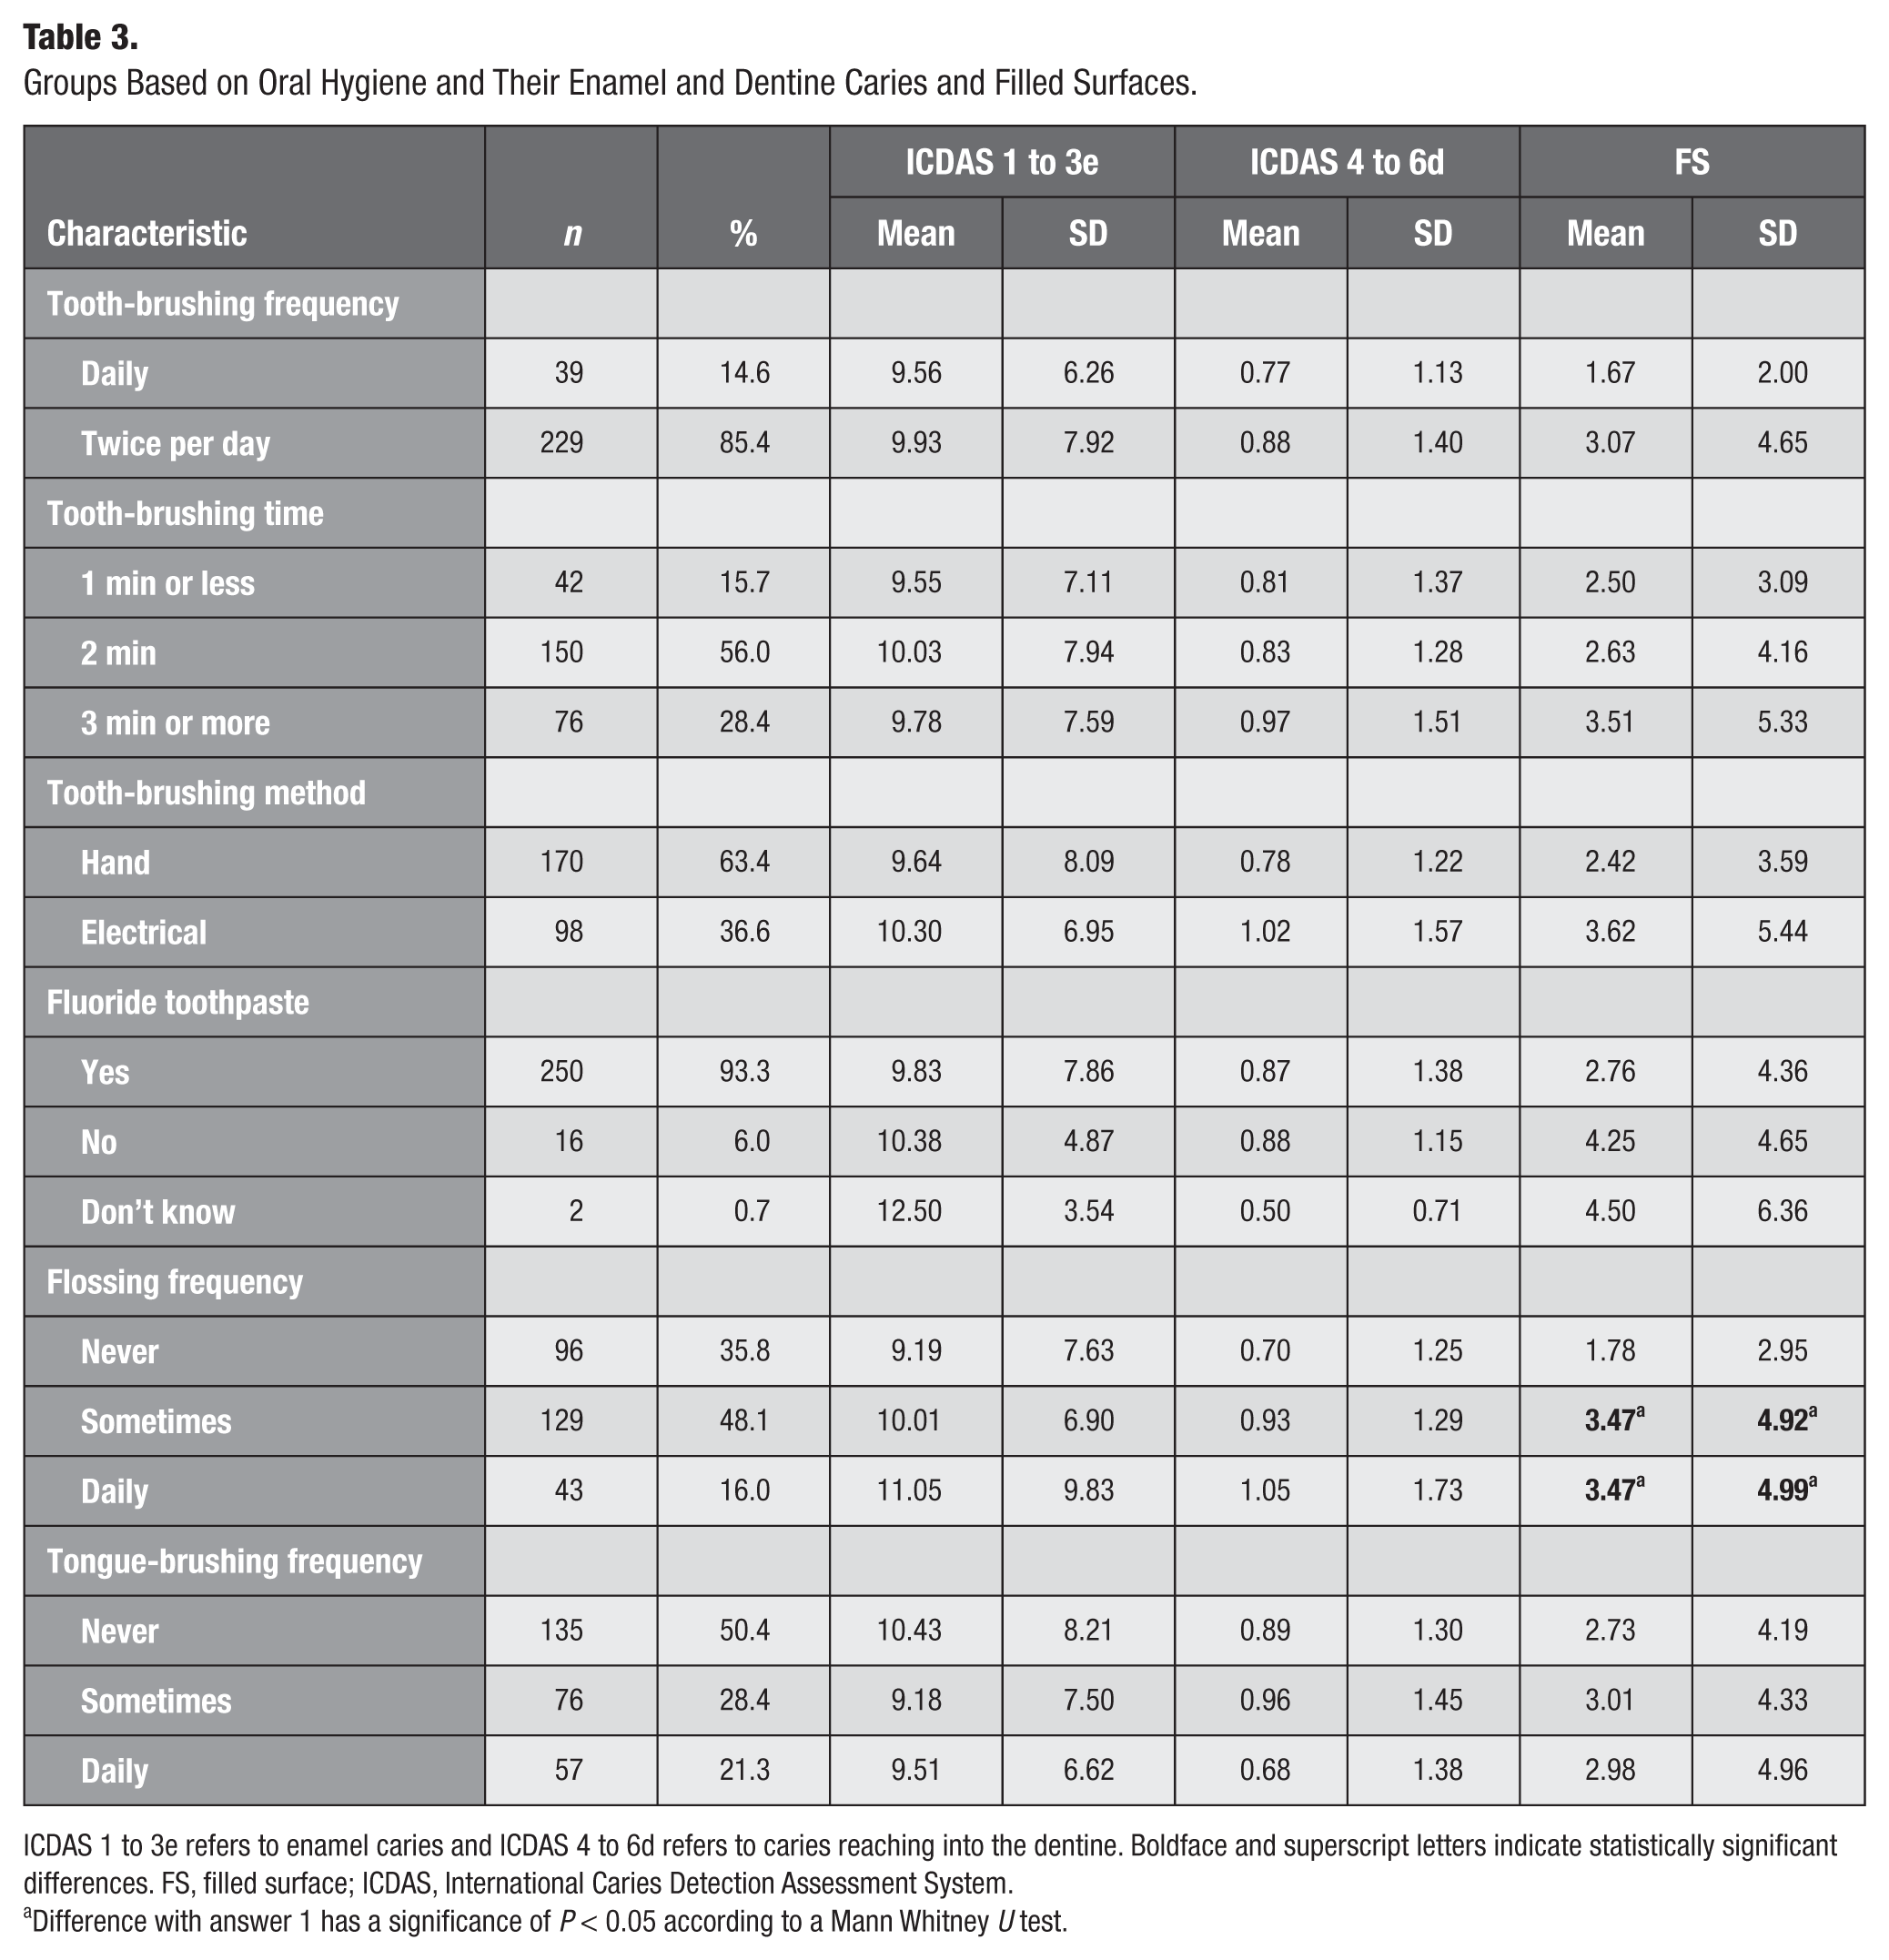
ICDAS 1 to 3e refers to enamel caries and ICDAS 4 to 6d refers to caries reaching into the dentine. Boldface and superscript letters indicate statistically significant differences. FS, filled surface; ICDAS, International Caries Detection Assessment System.
Difference with answer 1 has a significance of P < 0.05 according to a Mann Whitney U test.
Discussion
As far as we know, this is the first large-scale ICDAS study in a healthy population. In this study, we combined clinical and radiographic assessments, allowing the detection of caries in 8.55% of the 33,960 surfaces that were assessed in all 268 participants. Importantly, the radiographic assessment increased the detection of occlusal caries by 13% and approximal caries by 63%, demonstrating the necessity of X-rays for a comprehensive caries assessment even in a healthy population. Enamel caries defined by ICDAS scores 1, 2, and 3 made up 92.01% of all caries (28.5%, 54.0%, and 9.5%, respectively) and correlated significantly with dietary factors.
The surfaces that were most likely to be carious were occlusal (O) > approximal (D/M) > smooth (B/L). This pattern is in accordance with other studies that measured cavitated stages of the disease in general Dutch (Kalsbeek and Poorterman 2003) and other Western (Mejàre et al. 2004; Ferreira Zandoná et al. 2012; Broadbent et al. 2013) populations. In this study in a healthy population, caries was most frequently found on the first and second molars in both the upper and lower jaw. Specifically, the surfaces that contained caries most frequently were maxillary 7O, 6O, 6D, and 6M and mandibular 7O. Mejàre et al. (2004) performed a similar study using only radiographs and found comparable surfaces susceptible to caries in a general Swedish population of young adults aged 26 y. The proportion of DFS occlusal versus approximal was just a little over 0.5 on occlusal surfaces and less than 0.5 on approximal surfaces, which probably resulted from their lack of a visual assessment. In their study, the surface with most caries was the mandibular 6D (Mejàre et al. 2004).
Enamel caries (ICDAS 1 to 3e) correlated with dietary factors, including mono- and disaccharides and carbohydrate intake, while dentin caries (ICDAS 4 to 6d) only correlated with age. The clinical relevance of the correlations was highlighted with a population split based on the median of enamel caries, where the half with an enamel caries above the median consumed on average 33.89 g/d carbohydrates more (P < 0.05), of which 18.97 g/d was from mono- and disaccharides (P < 0.01), than the half with the lowest enamel caries (Appendix Table 1). As a reference, a standard chocolate bar of 36 g contains 20.8 g of sugar, which would be 12% of the average daily sugar intake of this population. When dichotomizing with the dentin caries median, the half with the highest dentin caries was 1.15 y older (P < 0.01), but no significant differences in dietary factors were observed. It is well known that participants tend to underreport their dietary sugar intake. Nevertheless, in this study with healthy participants, correlations between dietary intake and caries were still observed. Therefore, we expect that the correlation may even be stronger when (more) exact measurements of the sugar intake and a wider selection of patients with a broader range of caries experience are used in future studies. Importantly, our population consisted of (nondentistry) university students, while sociodemographic factors, such as ethnicity, education, and income, strongly influence dietary behaviors and caries prevalence (Hugoson et al. 2008; Mobley et al. 2009). Therefore, even though the individuals were selected for systemic and oral health, differences in results may be found in general age-related healthy populations that mostly consist of nonstudents.
In this study, the highest ICDAS score was 5 and detected in 11 participants. Score 5 indicates a cavity reaching dentin. This is close to the definition of an exclusion criterion during the visual intraoral screening: no overt cavities with dentine visible. Even though dentin caries numbers were much lower in this study compared with the general population (on average 0.87 per participant), they correlated with age and so did filled surfaces. This shows how irreversible changes accumulate over time and possibly also reflect behavior in the past. In contrast, the dietary questionnaire that was filled out right before the study reflected present habits and, accordingly, sugar intake correlated with early enamel caries. In accordance with our study, Pereira et al. (2010) found a correlation between noncavitated lesions and sugars in schoolchildren, which disappeared when using a standard DMFS based on cavitated lesions. It is common to use Spearman rank analyses to describe correlations between caries and their modifying factors (van Rossum et al. 2011). However, we expect that the correlations are more complex, and possibly more detailed analyses could reveal more subtle relationships.
Clinical detection of early enamel caries allows preventive therapy and may be a motivating factor to adapt preventive behavior by patients themselves. In light of this, we observed that filled surfaces showed a positive relationship with flossing (P < 0.05) and electrical brushing (P < 0.05). This may have been the result of past experiences or advice of dental professionals that stimulated these behaviors. The detection of early enamel caries could also motivate preventive behavior of the participants, which should be tested in future cohort studies.
The WHO recommends to keep the energy intake from free sugar below 10% of the total kJ, and a further reduction below 5% could provide additional health benefits (Moynihan and Kelly 2014; WHO 2015). Using the validated food frequency questionnaire, the participants reported an average consumption of 12,253 kJ/d and 133.3 g/d of mono- and disaccharides. The energy derived from mono- and disaccharides or sugar kJ intake was 17.7% in the total population, 16.9% for men and 18.7% for women (P < 0.01, see Appendix Table 2). This is slightly lower than National Institute for Public Health and the Environment (RIVM) data, which used the same FFQ and calculations as in our study in Dutch participants from 19 to 69 y, where men had a sugar kJ of 19.2% and women of 21.5% (van Rossum et al. 2011). Importantly, the RIVM age range included older people, while sugar kJ intake was higher in their younger group of participants (i.e., participants from 7 to 18 y consumed 26.8% to 27.2% kJ from sugar) compared with our participants.
We did not find evidence to support the WHO recommendation of keeping the kJ from free sugar below 10% of the total kJ as only 11 participants had a sugar kJ below 10%. However, the WHO based its recommendation on the consumption of “free sugar” (i.e., added sugar and sugar in honey, syrups, and fruit juices and concentrates), while we based our calculations on the total amount of sugar (i.e., free sugar + remaining sugar in diet) obtained with the FFQ. Even though the “free sugar” measurements of the WHO include most mono- and disaccharides, our results of total mono- and disaccharides is likely to be slightly higher (e.g., a difference of 2% of the total kJ in a Dutch population; Sluik et al. 2016) and could explain why only a few participants met the <10% sugar kJ criteria. When moving the threshold to <15% sugar kJ, the difference in enamel caries became obvious. Altogether, there was a positive correlation between sugar kJ and enamel caries. In other words, the correlation with sugar remained significant when normalizing with the total kJ intake of the participants.
In conclusion, in a population that contained almost no cavitated lesions, a clinically relevant difference in mono- and disaccharide intake was observed based on lesions confined to the enamel. After the comprehensive assessment, even in this population selected for health, only 2.2% of the participants were truly caries free (n = 6), and 9.7% of the participants had 1 or 2 surfaces with cavitated caries (n = 32). In light of this, it should be noted that studies referring to participants as “caries free” when applying the WHO criteria (Cypriano et al. 2008) actually refer to “cavitated lesion-free” participants. Some participants have enamel caries that progress to a cavitated stage later in life (Mejàre et al. 2004). Our study indicates that grouping participants with abundant early enamel lesions together with ones who have no or little enamel demineralization can affect the observed correlations of caries with behavioral factors.
Author Contributions
B.T. Rosier, contributed to data acquisition, drafted and critically revised the manuscript; C. van Loveren, contributed to data interpretation, critically revised the manuscript; E. Zaura, contributed to data analysis and interpretation, critically revised the manuscript; B.G. Loos, contributed to design, data acquisition, and interpretation, critically revised the manuscript; B.J.F. Keijser, W. Crielaard, contributed to conception and design, critically revised the manuscript; M.D. Lagerweij, contributed to data acquisition, analysis, and interpretation, drafted and critically revised the manuscript. All authors gave final approval and agree to be accountable for all aspects of the work.
Footnotes
Acknowledgements
We are thankful to Saskia Meijboom (Division of Human Nutrition, Wageningen University) for food frequency questionnaire data collection and analysis. This study was registered at the Dutch Trial Register (NTR3649).
The project is funded by Top Institute Food and Nutrition, a public-private partnership on precompetitive research in food and nutrition. The public partners were responsible for the study design, data collection and analysis, decision to publish, and preparation of the manuscript. The private partners have contributed to the project through regular discussion.
The authors declare no potential conflicts of interest with respect to the authorship and/or publication of this article.
A supplemental appendix to this article is available online.
References
Supplementary Material
Please find the following supplemental material available below.
For Open Access articles published under a Creative Commons License, all supplemental material carries the same license as the article it is associated with.
For non-Open Access articles published, all supplemental material carries a non-exclusive license, and permission requests for re-use of supplemental material or any part of supplemental material shall be sent directly to the copyright owner as specified in the copyright notice associated with the article.