
Abstract
The objective of the study was to assess the effects of medical well baby visits in promoting earlier first dental visits. We analyzed Iowa Medicaid claims data (2000–2013). The sample included 4 cohorts of children born in 2000, 2003, 2007, or 2010 and enrolled in Medicaid from birth (N = 38,211). Children were followed for 3 y. The independent variables were cohort year and medical well baby visit frequency during 3 time periods (birth to age 10 mo, ages 11–19 mo, ages 20–36 mo). We used survival analyses to estimate first dental visit rates. First dental visit rates improved significantly from 2000 to 2013, with children in latter cohorts having significantly earlier first dental visits. Children with more medical well baby visits before age 11 mo had significantly delayed first dental visit rates than children with fewer medical well baby visits. The opposite was observed for children with more medical well baby visits between ages 11 to 19 mo and ages 20 to 36 mo. First dental visit rates for Medicaid-enrolled children have improved, but there continues to be a need for early interventions to improve age 1 dental visits and other preventive oral health behaviors.
Introduction
Tooth decay is the most common pediatric disease in the United States (Tinanoff and Reisine 2009). Untreated tooth decay can lead to pain, systemic infections, hospitalization, and even death (Milsom et al. 2002; Pine et al. 2006; Casamassimo et al. 2009). Tooth decay is also linked to poor school performance and quality of life (Pahel et al. 2007; Jackson et al. 2011). Children from low-income families are at greater risk for tooth decay and poor oral health outcome (Vargas et al. 1998; Edelstein et al. 2000; Kenney et al. 2000; US Department of Health and Human Services 2000). For example, between 1999 and 2004, 47.8% of children ages 2 to 5 y from low-income households experienced tooth decay and 35% had untreated tooth decay (compared to 11.4% and 6% of children from higher-income households, respectively) (Health Indicators Warehouse 2013). Many of these children are eligible for no-cost dental care services, including preventive care, through Medicaid (Hill et al. 2015). Medicaid is an entitlement program in the United States that provides medical and dental insurance to vulnerable children. The program is funded by federal and state dollars and is administered by state governments.
Differential access to preventive dental care is a source of persisting oral health inequalities as highlighted in the Institute of Medicine’s report Improving Access to Oral Health Care for Vulnerable and Underserved Populations (Institute of Medicine and National Research Council 2011). Preventive dental care for young children consists of anticipatory guidance for parents and direct preventive care, including cleanings, dental sealants, and topical fluoride treatments. Preventive care can reduce the need for costly restorative dental care and is cost-effective, especially for young children, but continues to be underused (Savage et al. 2004; Ladrillo et al. 2006; Beil et al. 2012; Sen et al. 2013). A 2007 state-level study indicated that 6% of Medicaid-enrolled children under age 3 y used any dental care (range, 0%–30%) (Hakim et al. 2012). Although published age 1 dental visit rates appear to be slightly higher for publicly insured children (1.4%) than privately insured children (1%), oral health inequalities persist and publicly insured children continue to have poorer outcomes (Centers for Medicaid and Medicare Services 2010; Kolstad et al. 2015).
To encourage preventive dental care use during early childhood, the American Academy of Pediatrics (AAP) and the American Academy of Pediatric Dentistry (AAPD) recommend that children see a dentist by age 1 (American Academy of Pediatrics 2008a, 2008b; American Academy of Pediatric Dentistry 2012). While these recommendations have been in place since the early 2000s, few Medicaid-enrolled children see a dentist by age 1, whereas almost all children see a physician for multiple medical well baby visits (WBVs) (Chi et al. 2013). Previous work using survival analyses reported that compared to children with fewer WBVs, those with more WBVs between ages 1 to 2 y and ages 2 to 3 y were 2.96 and 1.25 times as likely, respectively, to have earlier first dental visits (Chi et al. 2013). However, the number of WBVs before age 1 was not related to the timing of first dental visits. This latter finding is a particular concern because it suggests that high-risk children are not able to benefit from prevention and early treatment.
One strategy to improve age 1 dental visits is to implement interventions during WBVs, which is supported by previous evaluations of North Carolina’s Into the Mouth of Babes Program (Rozier et al. 2010). However, support for WBV-based interventions is based on data from early 2000s, when clinical practice guidelines regarding age 1 dental visits were first implemented. Studies based on more recent data are needed to help guide future interventions and policies.
In the current study, we analyzed Iowa Medicaid data (2000–2013) and tested 3 hypotheses. First, we examined the relationship between cohort and the timing of first dental visits. We hypothesized that children in the most recent cohort (e.g., 2010) would be more likely to have earlier first dental visits than children in earlier cohorts (e.g., 2000, 2003, 2007). This hypothesis provides insight on the extent to which guidelines have diffused into clinical practice. Second, we examined the relationship between WBVs and first dental visits. We hypothesized that more WBVs would be associated with earlier first dental visits. This hypothesis provides a more definitive understanding of the link between early medical and dental care. Third, we examined the interaction between cohort and WBV frequency. This hypothesis allows for a simultaneous assessment of the relationships between WBVs and first dental visits across periods and cohorts.
Methods
Data Source
We obtained Iowa Medicaid enrollment and claims data (2000–2013) from the Iowa Department of Human Services. Enrollment files contained child-level data on birthdate, sex, race, monthly Medicaid eligibility category, zip code, and county code. The claims files contained medical diagnoses and health care services received, including inpatient claims, outpatient claims, prescription drug claims, and dental claims. We used the Area Health Resources Files (AHRFs) from the US Census Bureau to identify dental Health Professional Shortage Areas (HPSAs) corresponding to each cohort year (e.g., 2000, 2003, 2007, 2010). We linked the AHRFs to the Medicaid-enrollment files using county code. This study was approved by the University of Iowa institutional review board and conforms to the STROBE (Strengthening the Reporting of Observational Studies in Epidemiology) guidelines.
Study Population
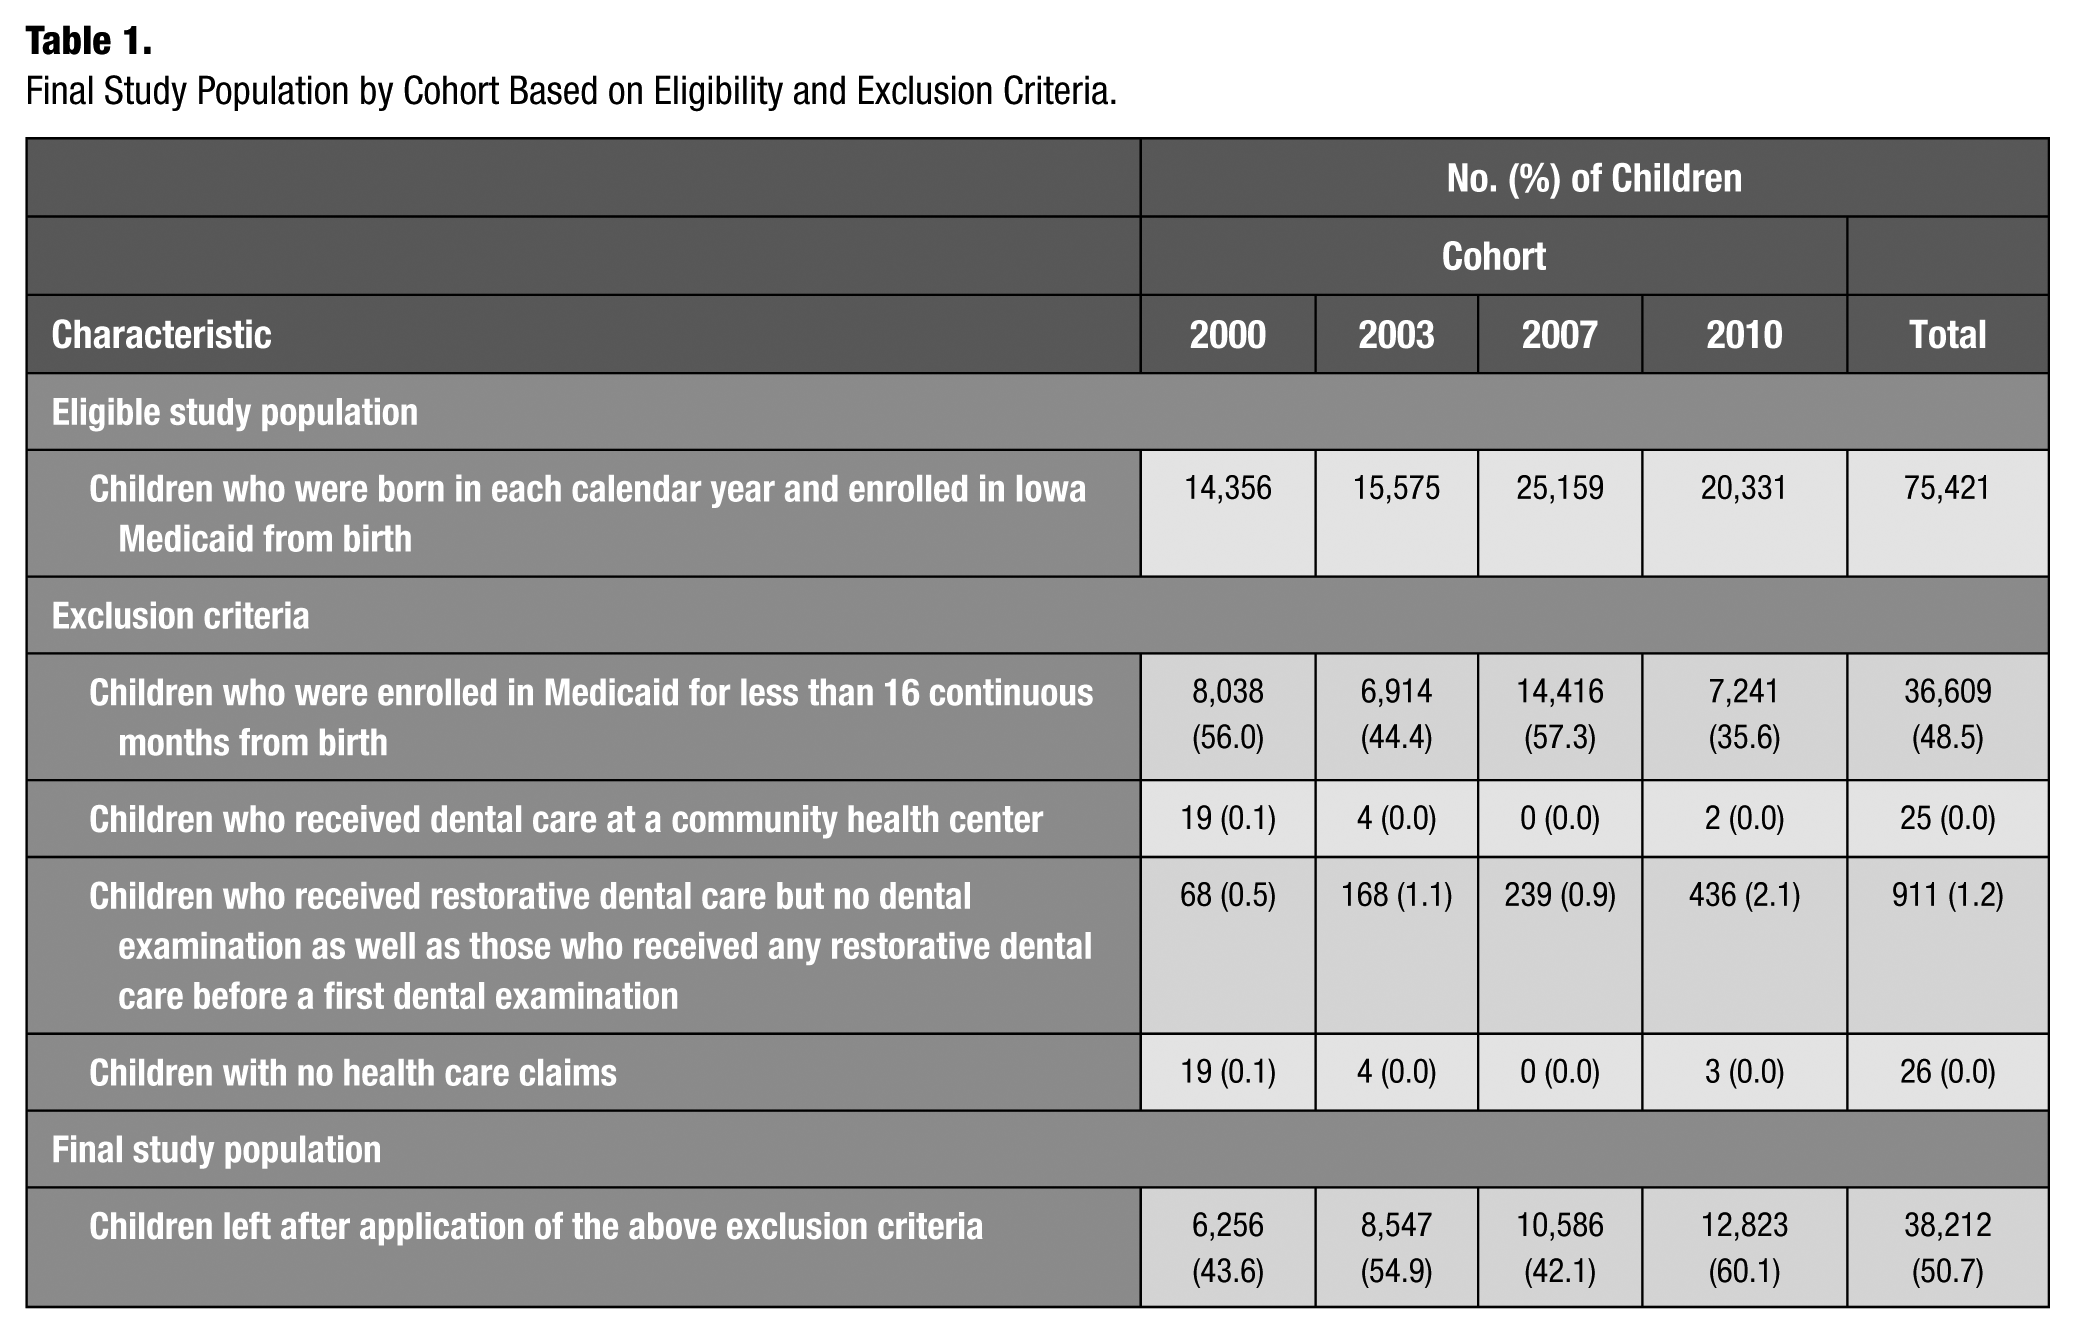
Our study population consisted of 4 mutually exclusive cohorts, each composed of children born in calendar years 2000, 2003, 2007, or 2010 and enrolled in Iowa Medicaid from birth. We applied 4 exclusion criteria (Table 1). Across the 4 cohorts, there were a total of 38,212 children. We excluded children who were enrolled in Medicaid for less than 16 continuous months from birth, to allow for measurement of all model covariates. Few children under age 3 y receive dental care at community health centers (Kuthy et al. 2013), which makes these children different from other children enrolled in Medicaid. Therefore, we limited our study population to children who received dental care in private practice dental clinics. Because the focus of our outcome measure was prevention-oriented visits, we excluded children who received restorative dental care but no preventive dental examination as well as those who received any restorative dental care before a first preventive examination. We also excluded children who were enrolled in Medicaid but had no health care claims data.
Final Study Population by Cohort Based on Eligibility and Exclusion Criteria.
Independent Variables
There were 2 independent variables. The first was cohort, defined as the year in which the child was born. There were 4 mutually exclusive cohorts: 2000, 2003, 2007, and 2010.
The second was WBV frequency, defined as the number of WBVs from birth to age 36 mo. Using criteria from a previous study, we used the following International Classification of Diseases, 9th Revision, Clinical Modification (ICD-9-CM) and Current Procedural Terminology (CPT) codes: V20.2, V70.0, V70.3, V70.5, V70.6, V70.8, V70.9, 99381, 99382, 99391, 99392, and 99432 (Chi et al. 2013). We assessed if a child received any of the following WBVs based on the AAP WBV schedule: 1 mo, 2 mo, 4 mo, 6 mo, 9 mo, 12 mo, 15 mo, 18 mo, 24 mo, and 36 mo (American Academy of Pediatrics, 2008a). We used previously published ranges around each WBV to allow for flexibility in when WBVs took place (Byrd et al. 1999). For instance, we considered a child who received a WBV between age 7 d and 1 mo as having had the 1-mo WBV.
To calculate WBV frequency, we categorized each WBV into one of the following 3 periods and aggregated the number of WBVs by period: 1) period 1 (number of WBVs during the first 10 mo of life when primary incisors begin to erupt; range, 0–5), 2) period 2 (number of WBVs between age 11 and 19 mo, when primary molars begin to erupt; range, 0–3), and 3) period 3 (number of WBVs between age 20 and 36 mo, when all primary teeth have erupted; range, 0–2).
Outcome Variable
Our outcome measure was the first dental visit, operationalized as the age at which the child’s first prevention-oriented dental visit occurred. To identify preventive dental visits, we used the following 2005 American Dental Association Current Dental Terminology Codes: D0120 and D0150 (American Dental Association 2005).
Model Covariates
Based on a previously published conceptual model, we included 8 covariates in our model. There were 4 demographic variables: sex (female or male), race (white, nonwhite, or missing), eligibility for Medicaid through Supplemental Security Income (SSI) for at least 6 mo of the child’s first year of life (yes or no), and health service use or medical diagnoses indicating increased risk for developing a chronic condition (e.g., ventilator, gastrostomy, tracheotomy, premature birth, low birth weight, infantile seizures, and newborn apnea) during the first 16 mo of life (yes or no) (Chi et al. 2013). The SSI measure identifies children with disabilities as evaluated by a medical provider, which is a mechanism through which medically compromised children become eligible for Medicaid. The chronic condition measure identifies children with potential conditions that may not have yet manifested clinically. Furthermore, we measured whether a child had multiple medical providers for WBVs and whether the child’s mother used any preventive dental care in the 12 mo before their child’s birth (yes or no). We measured residential urbanicity (metropolitan, urban adjacent to metropolitan, urban nonadjacent to metropolitan, and rural) and whether the child lived in a dental HPSA in the first month of Medicaid enrollment (yes or no).
Statistical Analyses
Prior to running our models, we calculated 1) baseline descriptive characteristics, 2) the proportion of children with a dental visit during the study period and the mean age at which the first dental visit occurred, and 3) the proportion of children who had a first dental visit by cohort and period.
We used Cox regression models to assess 1) the relationship between cohort and first dental visit rates, 2) the relationship between WBV frequency by period and first dental visit rates, and 3) the interaction between cohort and WBV frequency by period. We reported covariate-adjusted hazard ratios (HRs), 95% confidence intervals (CIs), and P values. HRs above 1.0 indicate greater first dental visit rates. HRs associated with the interaction between WBV frequency by period and cohort measure the extent to which a 1-unit WBV increase for a particular period and cohort affects first dental visit rates. Children remained part of the risk set until their first dental visit. Data for children in the 2000, 2003, 2007, and 2010 cohorts were censored on December 31 of 2002, 2005, 2009, and 2012, respectively, if they did not have a first dental visit. Because WBV frequency could vary over time, we included time-by-variable interactions for all WBV-related variables. All analyses were conducted using SAS version 9.4 (SAS Institute).
Results
Table 2 presents descriptive characteristics for children in the 4 cohorts. About half the children were female (48.8%). About 40% of children were white and 17.1% were nonwhite; 42.2% had missing race data. Over 70% of children were at increased risk for developing a chronic health condition. Almost all children saw multiple medical providers for WBVs (96.1%), and 13.9% of mothers used preventive dental care in the 12 mo before the child was born. Most children lived in a metropolitan area (55.6%) or in a dental HPSA (64.6%).
Characteristics of Children in the Iowa Medicaid Program by Cohort (Not Accounting for Censoring).
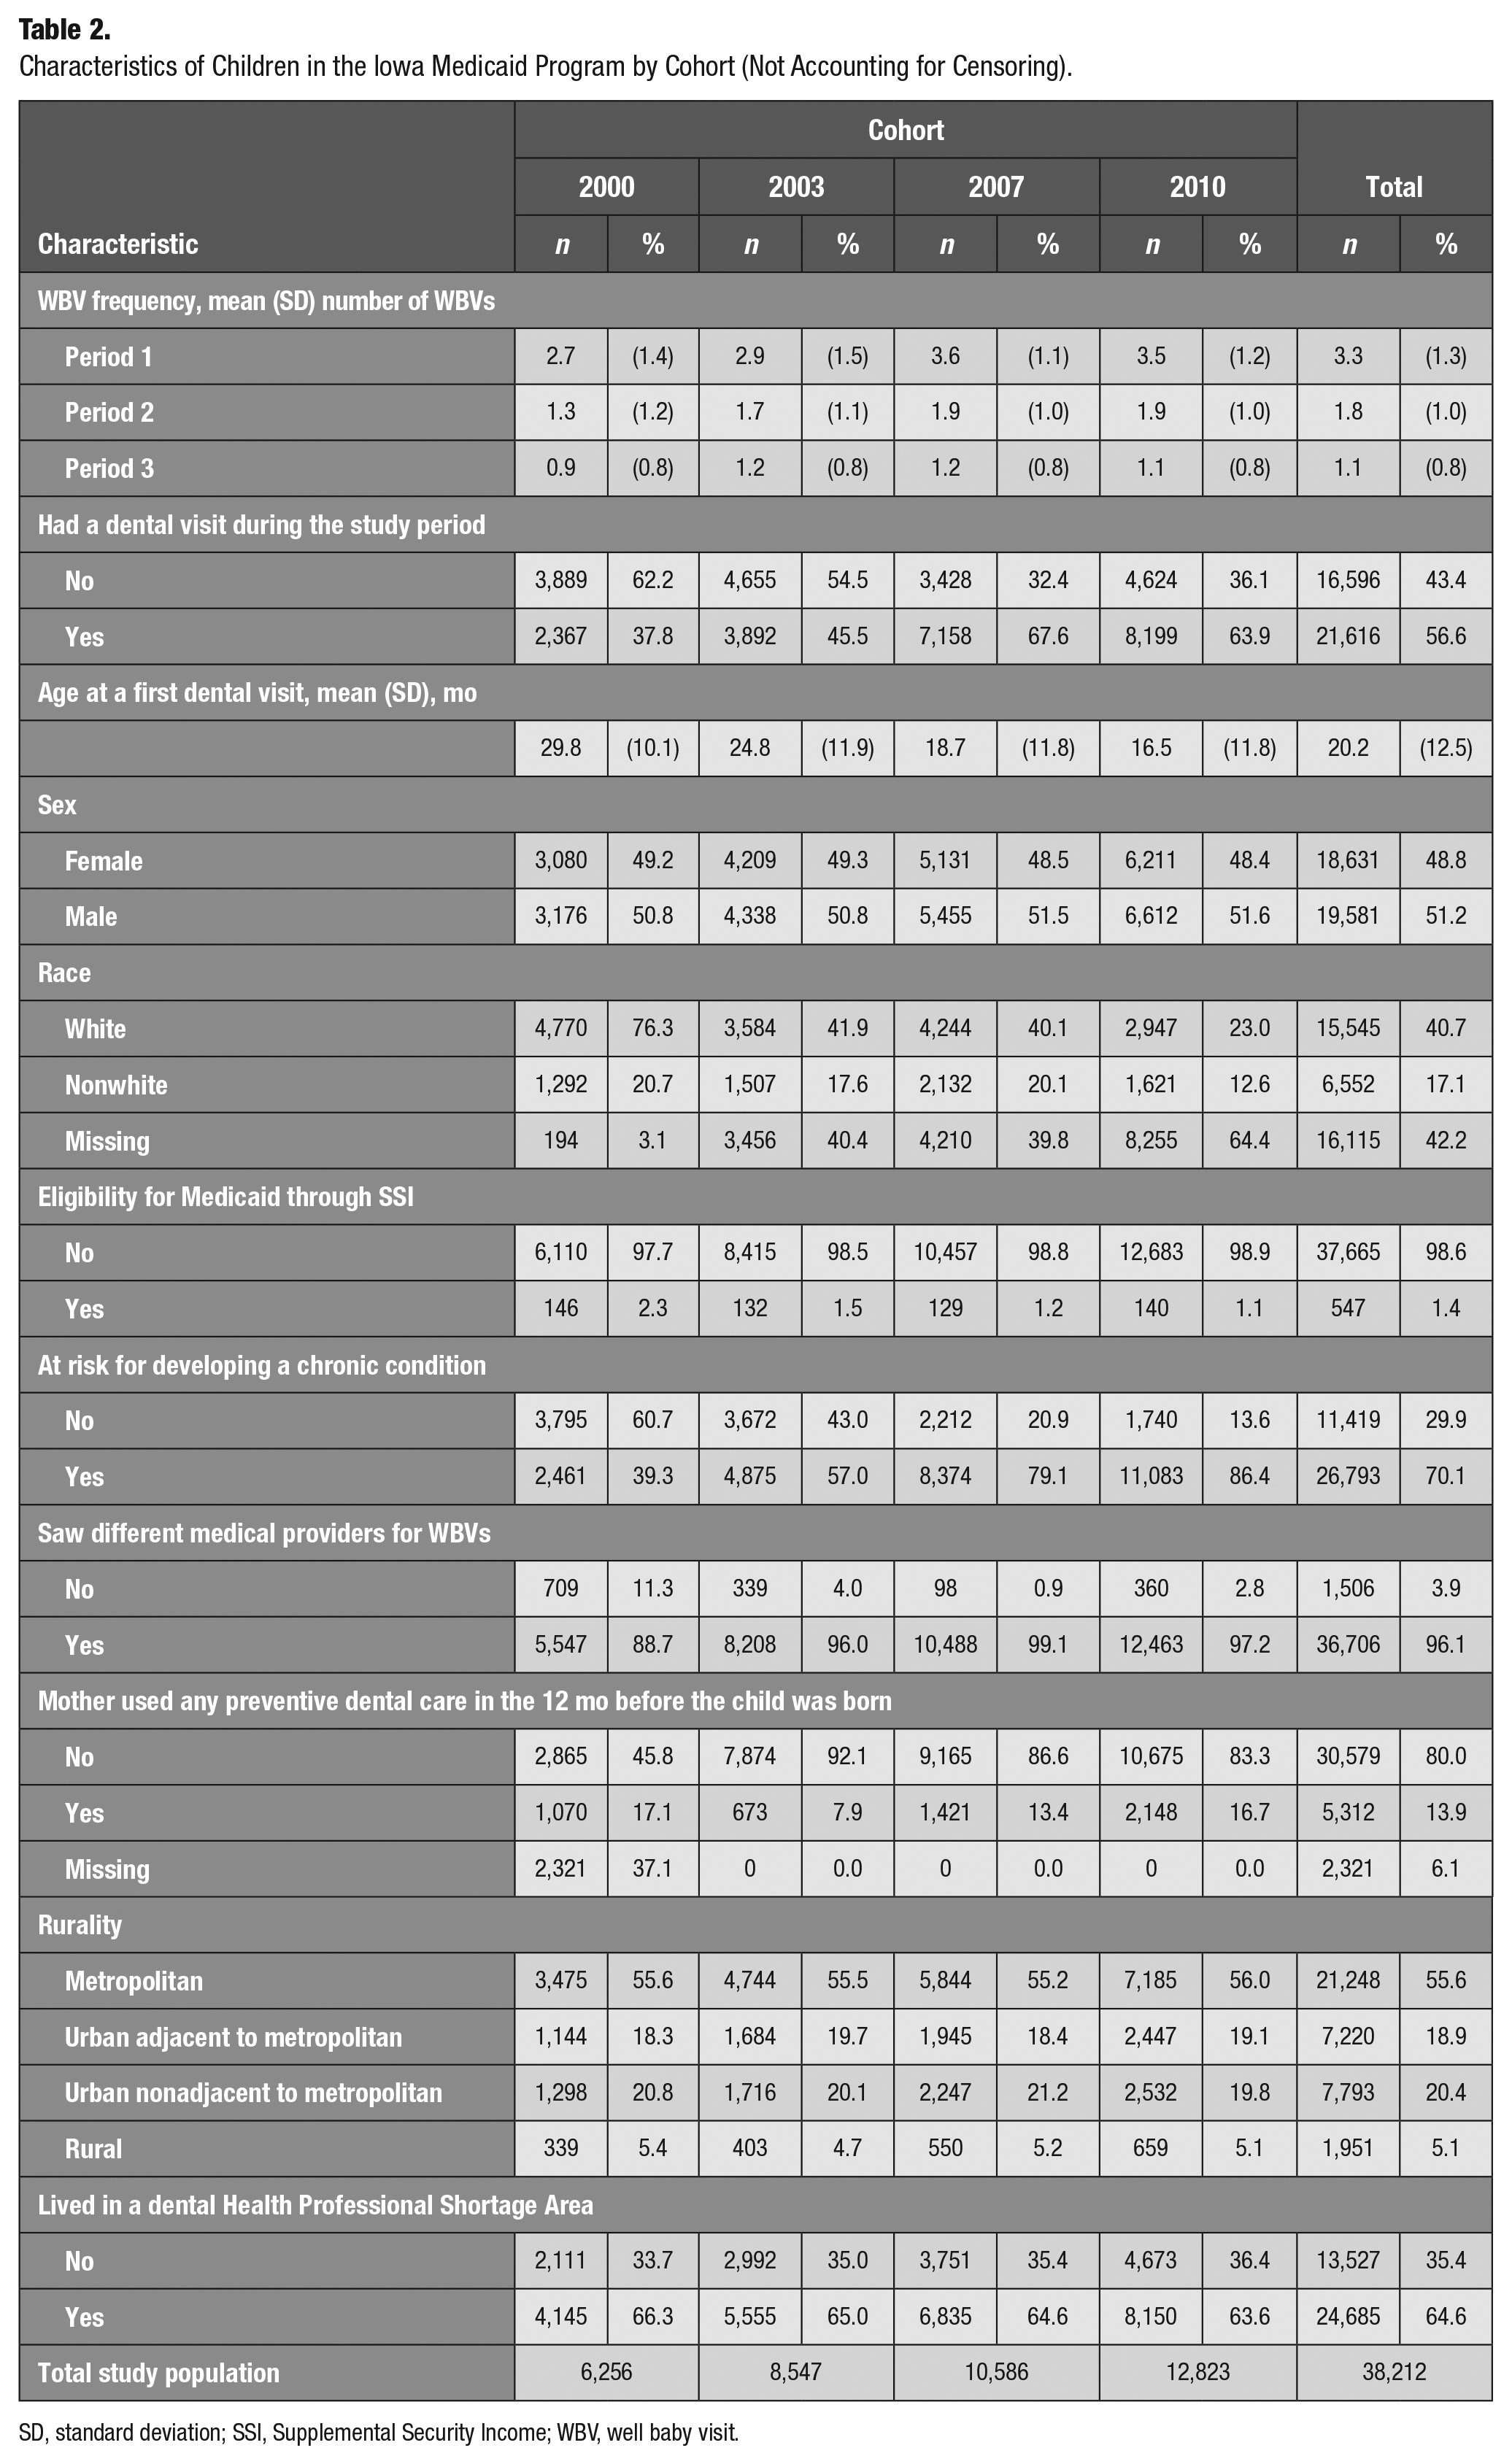
SD, standard deviation; SSI, Supplemental Security Income; WBV, well baby visit.
Overall, 56.6% of children had a dental visit during the study period (Table 2). About 37.8% of children in the 2000 cohort had a dental visit. These rates increased to 45.5% and 67.6% for children in the 2003 and 2007 cohorts, respectively, and then decreased slightly to 63.9% for the 2010 cohort. The mean age at which first preventive dental visits occurred decreased over time (29.8 mo in 2000 to 16.5 mo in 2010).
The mean (standard deviation [SD]) number of WBVs in period 1 was 3.3 (1.3) (Table 2). For period 2, it was 1.8 (1.0) WBVs, and for period 3, it was 1.1 (0.8) WBVs. From 2000 to 2010, the mean number of WBVs within each period increased and peaked in 2007. For example, in period 1, the mean (SD) number of WBVs for children in the 2000 cohort was 2.7 (1.4). This increased to 2.9 (1.5) WBVs for the 2003 cohort, 3.6 (1.1) WBVs for the 2007 cohort, and 3.5 (1.2) WBVs for the 2010 cohort.
In period 1, which indicates the proportion of children with a first dental visit before age 11 mo, the proportions increased 16-fold across cohorts (data not shown). About 1.2% of children in the 2000 cohort had a first dental examination before age 11 mo, compared to 19.8% of children in the 2010 cohort. In period 2, the proportions increased from 6.1% for the 2000 cohort to 27.3% for the 2010 cohort.
Table 3 presents the results from the Cox regression models. For WBV frequency, children with more WBVs in period 1 had significantly lower first dental visit rates than those with fewer WBVs in period 1 (HR, 0.95; 95% CI, 0.92–0.98). In periods 2 and 3, children with more WBVs had greater first dental visit rates than those with fewer WBVs. For example, children with more WBVs in periods 2 and 3 had 1.12 (95% CI, 1.07–1.18) and 1.66 (95% CI, 1.56–1.78) times greater first dental visit rates, respectively, than those with fewer WBVs.
Results from the Cox Regression Model for First Dental Visit Rates for Medicaid-Enrolled Children in Iowa.
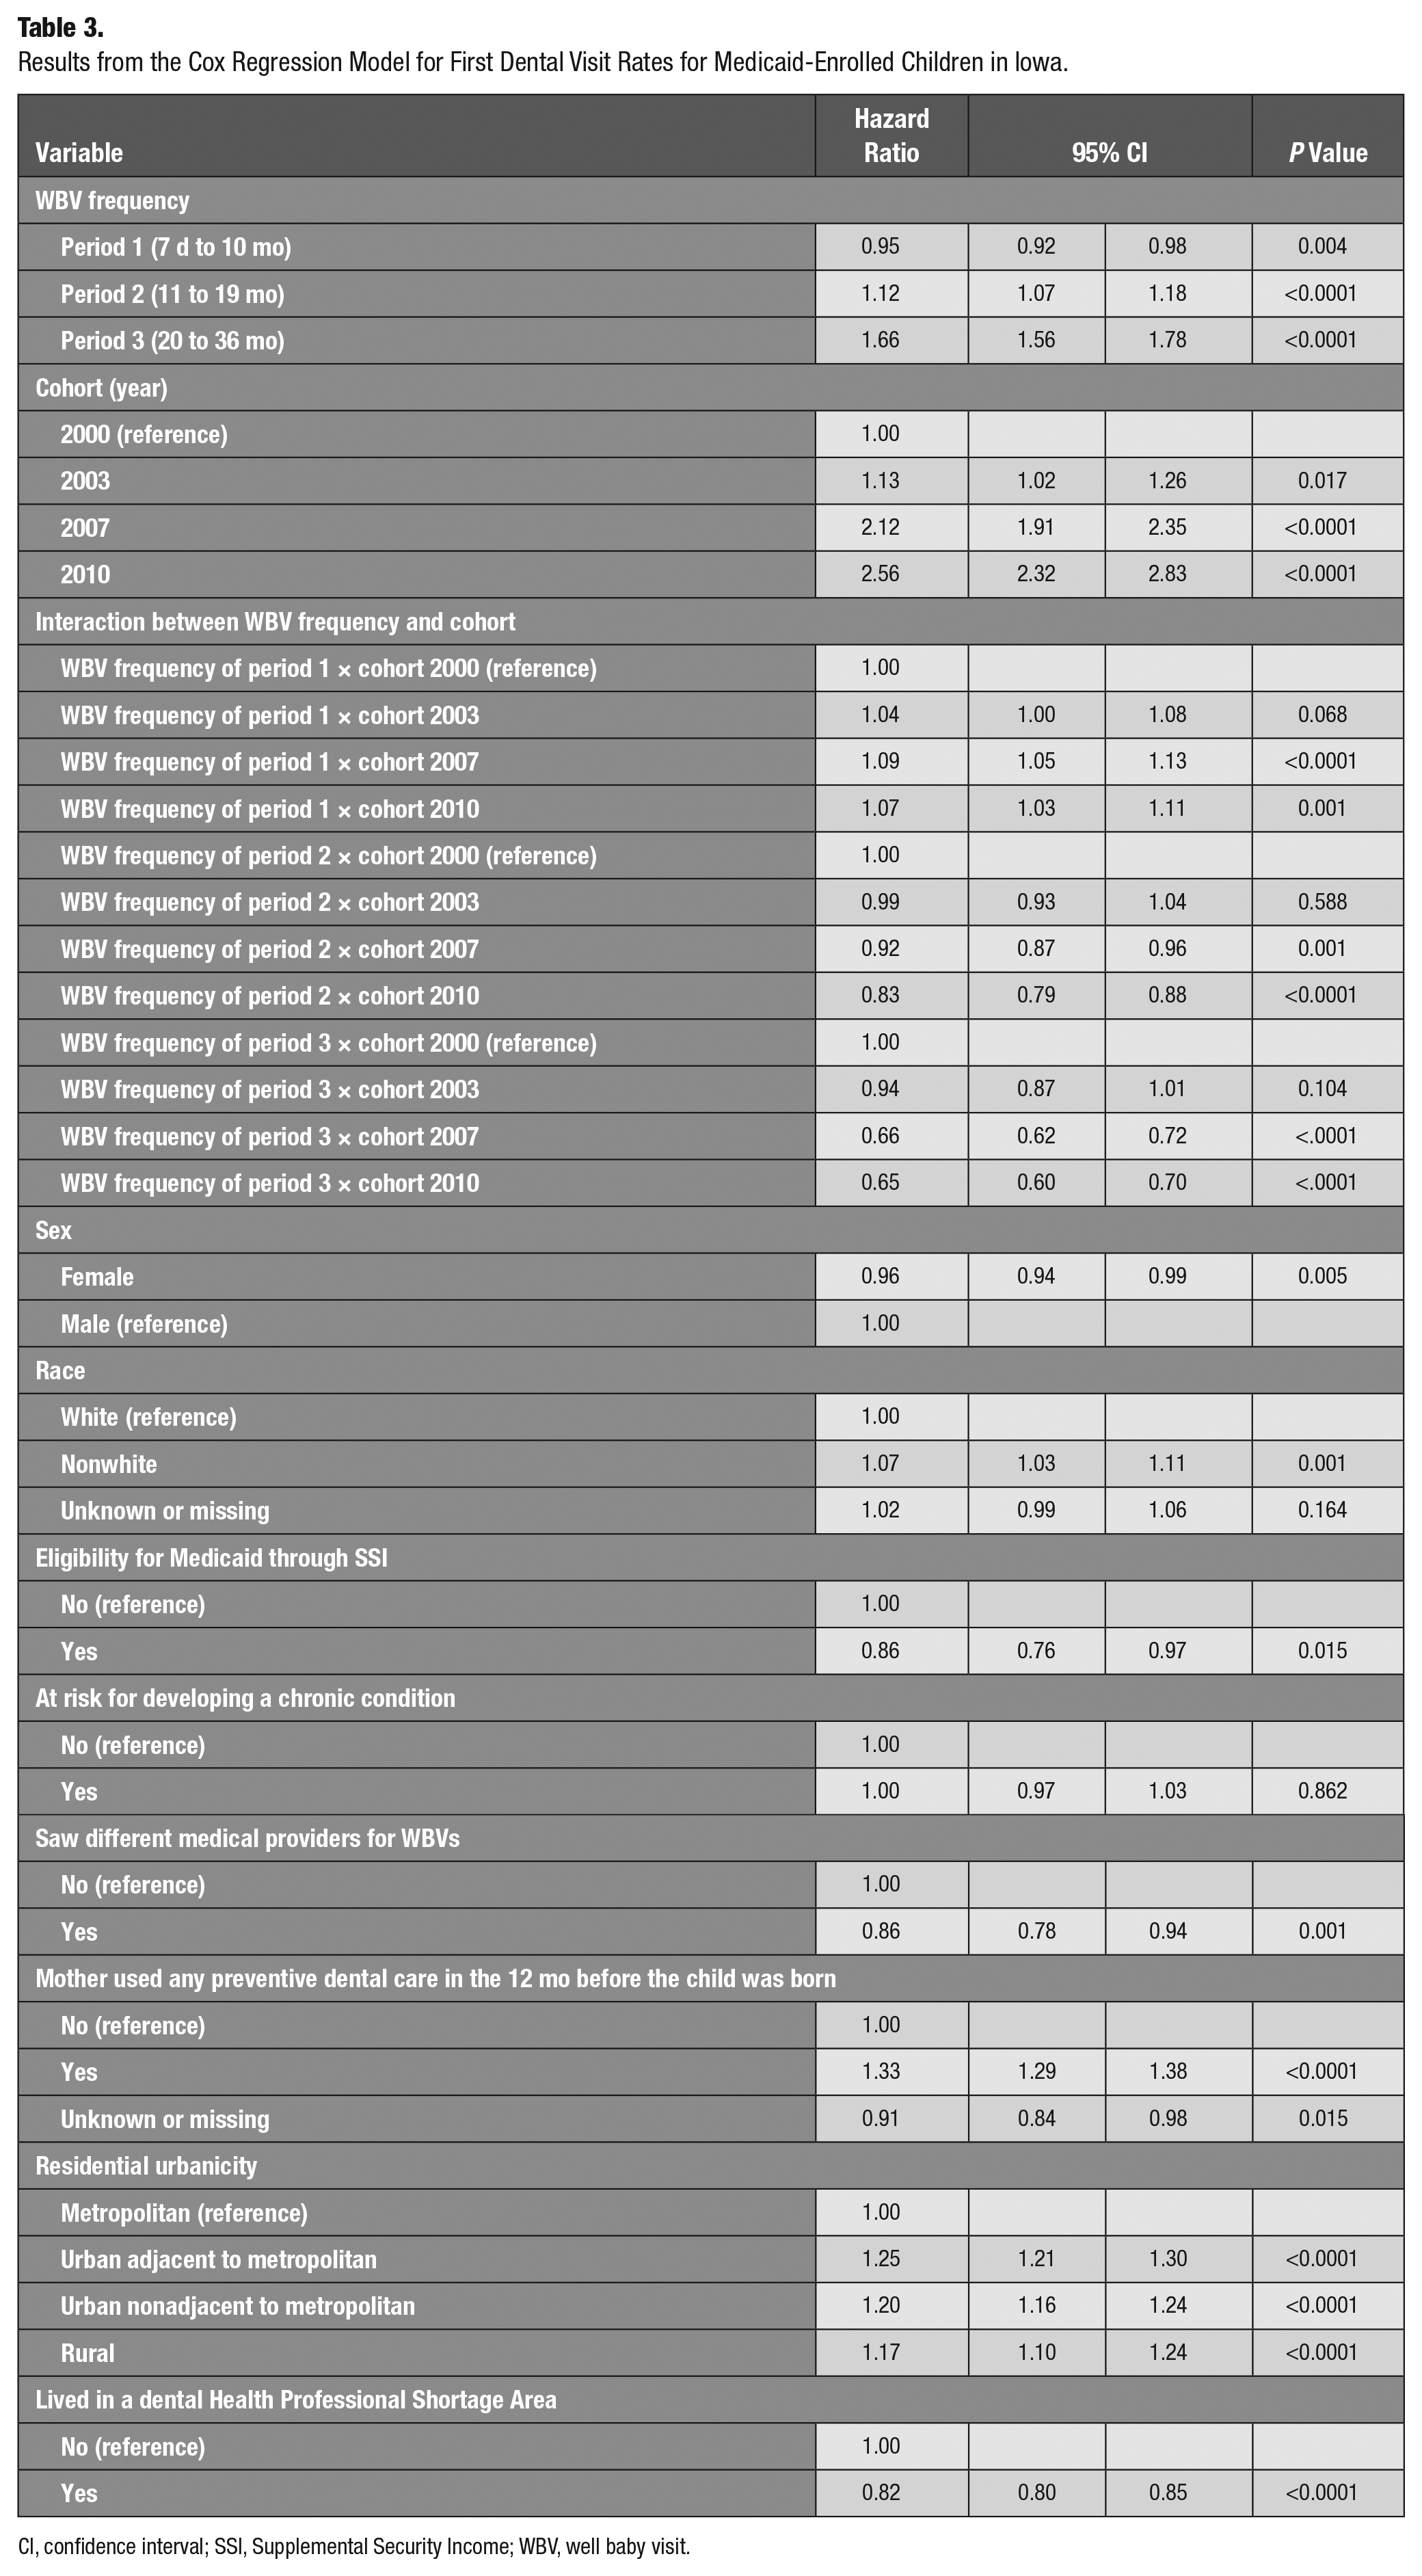
CI, confidence interval; SSI, Supplemental Security Income; WBV, well baby visit.
Children in the latter cohorts had significantly greater first dental visit rates than earlier cohorts. Children in the 2003, 2007, and 2010 cohorts had 1.13 (95% CI, 1.02–1.26), 2.12 (95% CI, 1.91–2.35), and 2.56 (95% CI, 2.32–2.83) greater first dental rates, respectively, than children in the 2000 cohort.
In terms of other covariates from the Cox regression model, females had significantly lower first dental rates and nonwhites had significantly greater rates (Table 3). Children eligible for Medicaid through SSI had lower rates, whereas there was no difference in rates for children by risk for developing a chronic condition. Children who saw different medical providers for WBVs had significantly lower rates, and those whose mothers use preventive dental care had significantly greater rates. Children living in a nonmetropolitan area had significantly greater first dental visit rates, whereas those living in a dental HPSA has lower rates.
Table 4 shows the HRs for first dental visits by period and cohort. An increase of 1 WBV in the 2000 cohort during period 1 was associated with a significantly lower first dental visit rate. In all later cohorts, an increase of 1 WBV during period 1 was associated with greater first dental visit rates, exhibiting an increasing trend with 1.12 in 2003, 2.19 in 2007, and 2.60 in 2010. There was a consistently increasing trend across periods in the 2000 and 2003 cohorts. In the 2007 and 2010 cohorts, there was a dip from period 1 to period 2, but then it increased at period 3. Within each period, the rate of first dental visits increased with each subsequent cohort.
Covariate-Adjusted a Hazard Ratios and 95% CIs for a 1-Unit Increase in WBV Frequency (Assumed Linear) for Cohort by Period in a Time to First Dental Examination Analysis for Medicaid-Enrolled Children in Iowa.
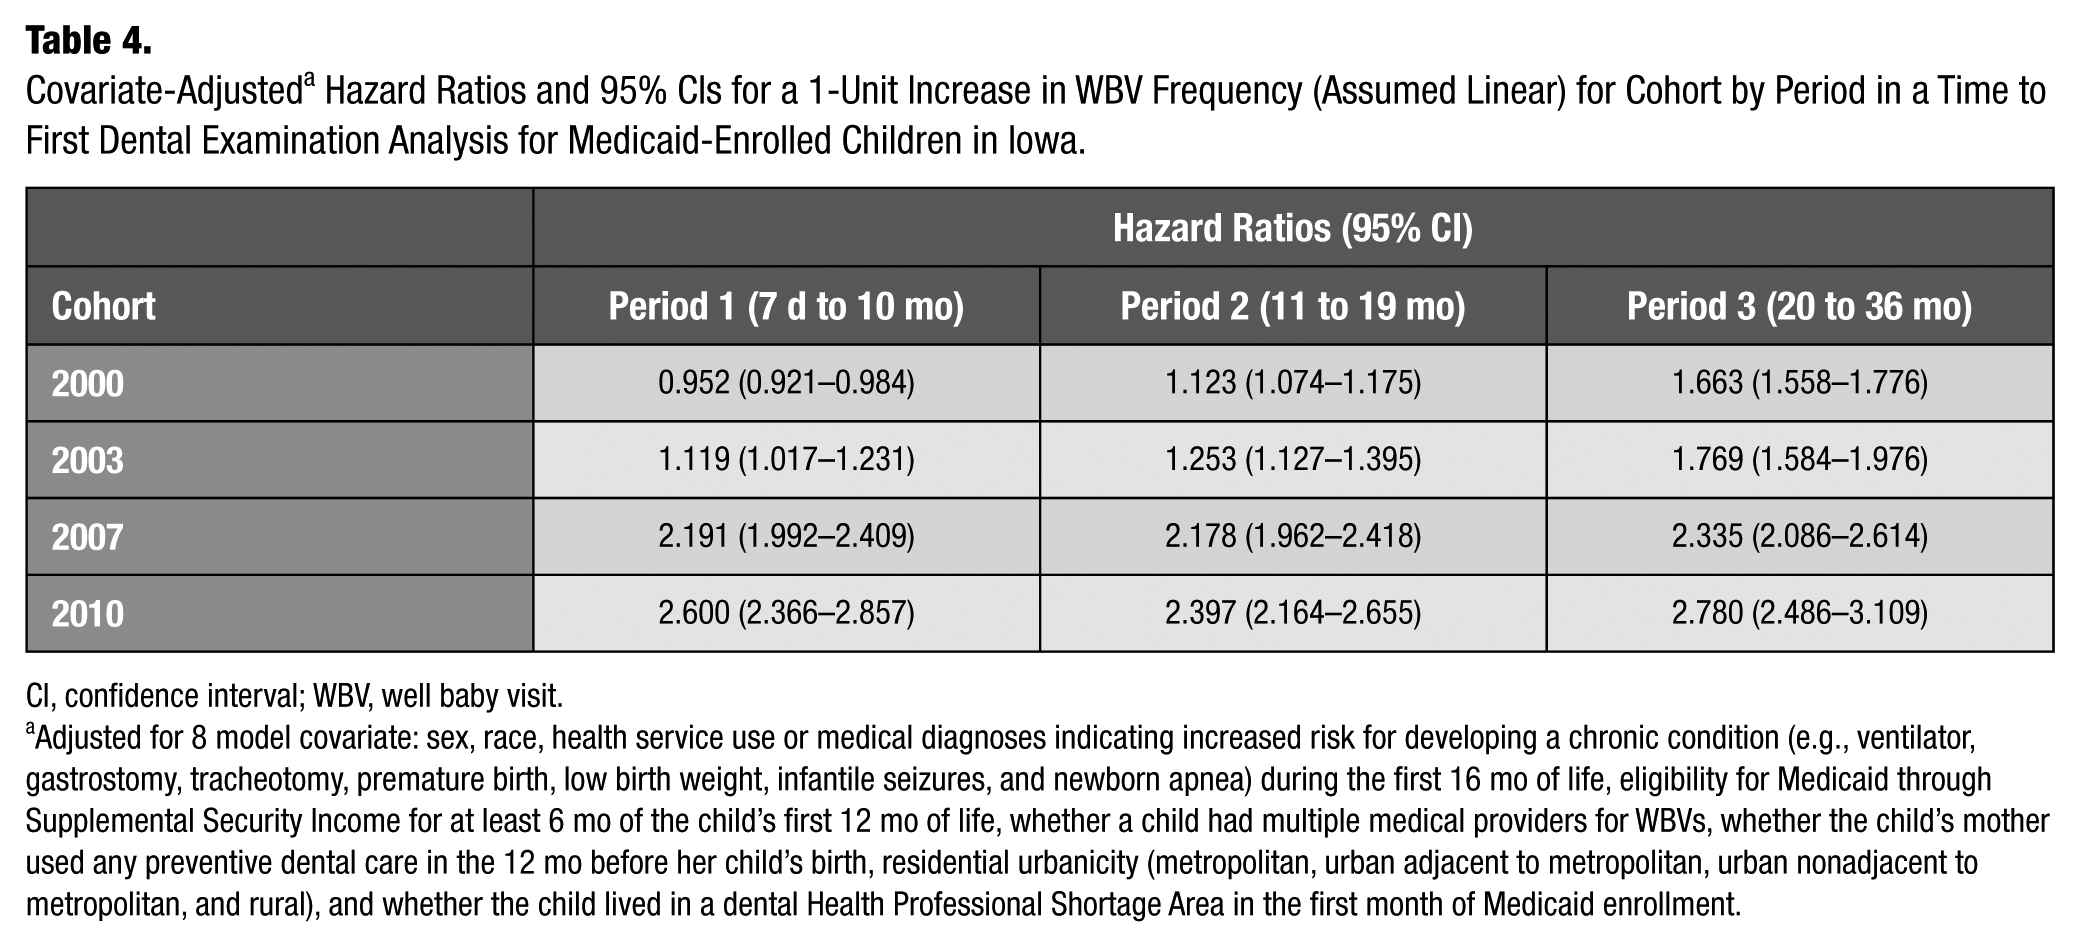
CI, confidence interval; WBV, well baby visit.
Adjusted for 8 model covariate: sex, race, health service use or medical diagnoses indicating increased risk for developing a chronic condition (e.g., ventilator, gastrostomy, tracheotomy, premature birth, low birth weight, infantile seizures, and newborn apnea) during the first 16 mo of life, eligibility for Medicaid through Supplemental Security Income for at least 6 mo of the child’s first 12 mo of life, whether a child had multiple medical providers for WBVs, whether the child’s mother used any preventive dental care in the 12 mo before her child’s birth, residential urbanicity (metropolitan, urban adjacent to metropolitan, urban nonadjacent to metropolitan, and rural), and whether the child lived in a dental Health Professional Shortage Area in the first month of Medicaid enrollment.
Discussion
This is the first study to examine the longitudinal relationship between use of early preventive medical and dental care for Medicaid-enrolled children. We examined the relationships between 1) cohort and first dental visits, 2) WBV frequency and first dental visits, and 3) the interaction between cohort and WBV frequency.
Regarding the first hypothesis, children in more recent cohorts had significantly greater first dental visit rates than those in earlier cohorts. This suggests children in the Iowa Medicaid program are seeing dentists earlier. There are 3 potential explanations. First, physicians’ referral patterns are likely to have improved since the recommendation for age 1 dental visits were codified into the AAP and AAPD clinical guidelines in the early 2000s (American Academy of Pediatrics 2008b; American Academy of Pediatric Dentistry 2012).
Second, caregivers may be more aware of the importance of having cavity-free children with good oral health. Local and national oral health campaigns, including recent educational efforts promulgated by the Ad Council, have reinforced the importance of brushing and seeing a dentist regularly (Ad Council 2013).
Third, Iowa’s I-Smile program may be improving access to dental care for Medicaid-enrolled children (Iowa Department of Human Services 2017). I-Smile is a statewide program implemented in 2006 to address low dental care utilization for younger children enrolled in Medicaid. The patient navigation program is led by local dental hygienists who educate families new to Medicaid about the availability of dental services and coordinate care between families and dental offices. However, previous work indicates that I-Smile has not improved dental care utilization rates for the most vulnerable Medicaid enrollees, including children with autism spectrum disorders (Chi et al. 2016).
In terms of the second hypothesis, we found that between the age of 1 and 3 y, children with more WBVs had significantly greater first dental visit rates than those with fewer WBVs, which is consistent with previous work (Chi et al. 2013). However, before the child’s first birthday, those with more WBVs had significantly lower dental visit rates than those with fewer WBVs.
There are 2 potential explanations for why children with more WBVs before age 1 had significantly lower first dental visit rates. First, physicians who see children for repeat WBVs during the first year of life may view WBVs as a substitute for dental care and may not see a need to refer children to a dentist until later. Care substitution may be sufficient for children at low risk for dental disease, but this depends on an accurate assessment of risk. Physicians may not be able to detect early signs of dental disease at earlier WBVs, at which point primary teeth are just beginning to erupt and lack of cooperation from the child can make it difficult to accurately assess risk. Previous work indicates that physicians are able to identify dental disease, like cavitated lesions, but it is less clear if physicians can accurately detect early signs like bleeding gums and white spot lesions (Long et al. 2012).
Second, Medicaid-enrolled children with more early WBVs may not be at increased risk for dental disease. Parents of these children may be more vigilant about brushing and diet, promoting parents to delay the child’s first dental examination. Parents who take their child in for all the recommended WBVs may also be overwhelmed with medical care, therefore reducing the odds of early dental visits. Future research should examine why children with more early WBVs see a dentist significantly later than children with fewer early WBVs.
In terms of the third hypothesis, it appears that with the exception of children in the 2000 cohort during period 1, a 1-unit increase in WBVs resulted in significantly greater first dental visit rates (Table 4). The data from 2000 could be a vestige of older practice patterns prior to the implementation of age 1 dental visit guidelines. These findings suggest that more contact with physicians improves dental utilization rates for children enrolled in Medicaid. Furthermore, increasing hazard ratios from 2000 to 2010 within each of the 3 periods indicate that the effects of WBVs have improved over time, which is an encouraging trend.
More broadly, the proportion of children with age 1 dental visits improved dramatically. In 2000, only 1.2% of children had an age 1 dental visit. This increased to 5.0% in 2003, 16.5% in 2007, and 19.8% in 2010. Another publication from 2010 indicated that age 1 dental visit rates for publicly insured children in Iowa ranged from 0.4% to 0.5% (Centers for Medicaid and Medicare Services 2010). However, even in the best-case scenario from 2010, nearly 80% of children did not have a first dental visit by age 1 as recommended by the AAP and AAPD. Additional efforts are needed to ensure that all children have a first dental visit by age 1. Future studies should assess the marginal gains (e.g., health outcomes, cost savings) associated with more children having age 1 dental visits.
One way to improve age 1 dental visits is to standardize nuanced clinical guidelines on when children should be referred to a dentist. The AAPD advocates that all children should see a dentist by age 1 (American Academy of Pediatric Dentistry 2012). However, the AAP guidelines support the age 1 dental visit for children at high risk for dental caries (American Academy of Pediatrics 2008a). These nuanced professional guidelines lead to confusion among providers and parents and discretionary physician referrals to dentists. These findings reinforce the importance of additional research on ways young children can be identified within medical practices during early WBVs and referred to a dentist by age 1. Incorporating preventive dental care services into WBVs, especially WBVs that occur between birth and 6 mo, could help to promote oral health during early childhood. Two examples are the Access to Baby and Child Dentistry (ABCD) program in Washington state and North Carolina’s Into the Mouth of Babes (Riter et al. 2008; Rozier et al. 2010). However, early establishment of a dental home is important, and preventive care provided during WBVs should not be viewed as an equal substitute for age 1 dental visits.
Our study had 4 main limitations. First, our findings are generalizable to children in Iowa, which is known to have an effective Medicaid dental program compared to other states. For instance, dental utilization for Iowa Medicaid-enrolled children under age 3 is 20% compared to 6% in other states (Centers for Medicaid and Medicare Services 2010). Second, there is the potential for residual confounding because we could not account for all unobserved characteristics. In addition, some model covariates may be misspecified. Our data indicate that the proportion of children at risk for developing chronic conditions has increased over time, reaching 86.4% in 2010. A possible explanation is that physicians in more recent years are coding diagnoses more intensively, as reported in the Medicare Advantage program that serves US elders (Kronick and Welch 2014). Consequently, our measure for chronic conditions may overestimate a child’s true health risk. Third, we assumed that the log hazard ratio of a first dental examination is linear for WBV frequency. Because the actual relationship may not be linear, future research should continue to explore how WBVs are related to dental visits. Fourth, regardless of the timing, dental visits are not a panacea, especially for children at high risk for dental disease. In fact, previous observational studies indicate that early dental visits are associated with increased rates of subsequent restorative treatment (Blackburn et al. 2017). These observations underscore the importance of ensuring that educational content during medical and dental visits for young children focuses on regular dental care as well as other preventive behaviors such as enforcement of low-sugar diets and adequate exposure to fluorides. Optimizing these preventive oral health behaviors provides the greatest opportunity to prevent disease and reduce inequalities in vulnerable children.
Conclusions
Timely preventive dental care is part of a comprehensive strategy to optimize oral health outcomes for young children. Our data indicate that only 1 in 5 low-income children see a dentist by age 1, as recommended by professional organizations, whereas almost all children see a physician for multiple times during the first year of life. Future researchers should develop population-based strategies to improve age 1 dental visits for low-income children that can be incorporated into early medical WBVs, especially those that take place between birth and age 6 mo. These efforts should focus on improving age 1 dental visits and addressing oral health behaviors related to diet and fluoride exposure that are expected to reduce disparities in oral health that disproportionately affect low-income children.
Author Contributions
S. Park, D.L. Chi, contributed to conception, design, data acquisition, analysis, and interpretation, drafted and critically revised the manuscript; E.T. Momany, contributed to conception, design, data acquisition, and interpretation, drafted and critically revised the manuscript; M.P. Jones, contributed to conception, design, data analysis, and interpretation, drafted and critically revised the manuscript; R.A. Kuthy, N.M. Askelson, G.L. Wehby, P.C. Damiano, contributed to conception, design, and data interpretation, drafted and critically revised the manuscript. All authors gave final approval and agree to be accountable for all aspects of the work.
Footnotes
Acknowledgements
We thank the Iowa Department of Human Services for providing access to the Medicaid data sets.
The study was funded by US National Institutes of Health/National Institute of Dental and Craniofacial Research Grants RC1DE020303 and K08DE020856, the William T. Grant Foundation Scholars Program, and the Center for Advanced Study in the Behavioral Sciences (CASBS) at Stanford University.
The authors declare no potential conflicts of interest with respect to the authorship and/or publication of this article.