
Abstract
Objective:
To identify predictors of unmet dental needs for adults 18 y of age or older in the United States.
Method:
Using the Aday and Andersen framework and data from the 2018 Behavioral Risk Factor Surveillance System (BRFSS), we ran logistic regression to estimate predictors for adults of not having a dental visit within 5 y and having lost any teeth using a national sample of 155,060 survey respondents.
Results:
Results showed that predisposing factors (age, race/ethnicity, gender, and educational attainment) and enabling factors (income and health insurance status) are important predictors for losing teeth due to decay or gum disease. Men, the elderly, and less educated and low-income residents were less likely to have seen a dentist within the past 5 y and more likely to have lost their permanent teeth. Compared to non-Hispanic White adults, Hispanics adults were more likely to have had a dental visit within the past 5 y. Unmet dental needs varied across states. People living in states with extensive Medicaid dental care benefit coverage were less likely to lose their teeth and more likely to have had a dental visit within the past 5 y.
Conclusion:
Efforts to improve oral health should address unmet dental needs of men and adults with low socioeconomic status. Studying the variation between state oral health care programs could further our understanding of how public policy can improve population oral health.
Knowledge Transfer Statement:
Men, non-Hispanic Blacks, mixed and other race minorities, and low socioeconomic status adults are most at risk of unmet dental needs. States can address these needs by expanding Medicaid coverage for adults.
Introduction
Good oral health is critical to maintaining overall health. Yet, its public health importance is often neglected, and millions of Americans continue to lack access to adequate dental care (Comlossy 2013). More than 90% of US adults have had a cavity, 1 in 4 working-age adults and 1 in 6 elderly adults have untreated cavities, and nearly 50% of all adults aged 30 y or older—about 65 million people—have signs of gum disease (Centers for Disease Control and Prevention [CDC] 2019, 2020). Over the past 20 y, while there have been improvements in oral health for children, the problem of untreated cavities for adults has persisted (CDC 2019).
Significant disparities exist in oral health care outcomes and access nationwide (Fischer et al. 2017; CDC 2019). The burden of these disparities, which are understood to be among the most serious public health problems in the United States, is unfairly borne by non-Hispanic Blacks, Mexican Americans, immigrants, rural communities, the poor, persons with low educational attainment, the underinsured, and other groups historically linked to discrimination or exclusion (Cohen et al. 2011; Shelley et al. 2011; Shariff and Edelstein 2016; Singhal et al. 2017; CDC 2019). For example, racial minorities have been found to receive less dental care, even after adjusting for other demographic and socioeconomic factors (Berdahl et al. 2016; Zhang 2016; Bhoopathi et al. 2021). Low-income persons are less likely to receive needed dental care compared to higher-income persons, and this disparity has persisted from 1999 to 2016 (Griffin et al. 2019, 2021). In fact, for the abovementioned groups, the inability to access regular dental care is not only accompanied by an overall worse oral health status, but it is compounded by it—furthering the gap in unmet needs (Lee and Divaris 2014). There is some evidence that expanding Medicaid coverage to adults may improve their access to dental care. One study reports that among states that expanded Medicaid adult dental coverage, dental care utilization for childless low-income adults increased, but utilization for low-income adults with children declined (Singhal et al. 2017). This study seeks to estimate the magnitude of the effects of predictors of unmet dental needs to inform oral health policy makers about which factors to target while adjusting dental care delivery systems to eliminate disparities.
Methods
We used data from the 2018 Behavioral Risk Factor Surveillance System (BRFSS) to explore the predictors of unmet dental needs in the United States. Specifically, we quantified the effects of predictors of unmet dental needs using the Aday and Andersen model of access to care as a conceptual framework. This framework outlines the relationship between health policy, the characteristics of the health delivery system, characteristics of the population of at risk, utilization of health services, and consumer satisfaction. Based on the Aday and Andersen model, we posit that unmet dental needs are determined by predisposing factors (age, gender, race/ethnicity, and educational attainment) and enabling factors (income, insurance status, and availability of dental providers) and health policy (Medicaid coverage) (Aday and Andersen 1974; Millman 1993; Andersen 1995). We then examined the variations in prevalence of unmet need between states. Finally, we analyzed the differences in state Medicaid dental benefit coverage for adults on unmet need. This article is distinguished from previous studies and adds to the literature base because we used different measures to determine unmet dental needs (i.e., losing permanent teeth and not having a dentist visit within the past 5 y). We also used the most up-to-date BRFSS data from 2018’s survey and included an analysis of state variations in unmet dental needs.
Data
We used data from the 2018 BRFSS, data publicly available from the CDC (2020). The CDC reported a 53.3% response rate for the BRFSS’s landline survey in 2018 (BRFSS 2019a). We removed 16,640 participants due to missing data for the dependent variables of interest, for a final analytical sample of 155,060 adults with complete data. For some control variables with more than 5% missing (e.g., income and race/ethnicity), we included dummy variables in the models and reported the regression results if they were statistically significant.
This study was reviewed by the Johns Hopkins Bloomberg School of Public Health Institutional Review Board and was determined to meet the criteria for exemption under 45 CFR 46.101(b).
Technical Information
The dependent variables of interest were derived from the self-reported participants’ responses to questions on the “number of permanent teeth that have been removed because of tooth decay or gum disease” and the “length of time since he/she visited a dentist.” Respondents reported the “number of permanent teeth that have been removed because of tooth decay or gum disease” in 4 categories, including “none,” “1 to 5,” “6 or more but not all,” and “all” (BRFSS 2019b). For the analysis, we created an outcome indicator variable that measured the likelihood of missing 1 or more teeth due to decay or gum disease. We used “none of the teeth removed” as the reference category. Respondents reported the “length of time since he/she visited a dentist” as a categorical variable designating whether they had visited their dentist “within the past year (anytime less than 12 months ago),” “between 1 and 2 years (>1 year but less than 2 years ago),” “between 2 and 5 years (>2 years but less than 5 years ago),” “5 or more years ago,” and “never” (BRFSS 2019b). We created a realized access dichotomous indicator variable that measured whether the respondent reported their last dental visit “5 or more years ago.” Adults who reported they had never seen a dentist (<1%) were dropped from the analysis because preliminary analysis suggested their lack of use may not be associated with unmet need.
The independent variables of interest were gender, race/ethnicity groups, age categories, education, income categories, and having health insurance. We used state fixed effects to control for state variation in dental provider access and state oral health policies.
After the initial analysis was completed, we ran 2 subsequent logistic regressions by including the type of state Medicaid dental benefits coverage for adults as the main independent variable of interest instead of state fixed effects. This allows us to estimate the impact of states’ policy choices in adult Medicaid benefits on the probability of losing teeth and not visiting a dentist within 5 y. Using the Center for Health Care Strategies (CHCS) approach, we classified state Medicaid adult dental benefits coverage into 4 categories: no coverage, emergency only, limited, and extensive coverage using the categories from the CHCS.
Statistics
We used logistic regression to estimate predictors of the dependent variables; because of the frequency of the dependent variables, we present marginal effects instead of odds ratios. The marginal effects of the predisposing and enabling factors on the dependent variables are reported in probability units. To interpret them, we multiplied the marginal effects by 100, which yields the percentage point change associated with a unit change in the dependent variables. We estimated the models using weighted GLM in Stata 15 (StataCorp).
Study Limitations
We used self-reported responses for our analysis, which are subject to recall bias. Some states have not provided data on Medicare/Medicaid or other state programs/TRICARE/Alaska Native, Indian Health Service, Tribal Health Services in the public BRFSS data. Also, we do not know if respondents’ insurance coverage included dental services. Therefore, our insurance variable only compares insured to uninsured adults and does not identify the impact of different types of insurance coverage on dental care utilization. Due to the unavailability of data, we are unable to control for 2 factors in the Aday and Andersen model: dental health needs and consumer satisfaction.
Results
In 2018, about 12% of US adults had not visited their dentist in the past 5 y, and 45% of US adults had lost 1 or more permanent teeth (see Table 1). Men were more likely to have not seen a dentist within 5 y compared to women (14% vs. 11%). A higher percentage of Black non-Hispanic adults were more likely to have not seen a dentist within 5 y and have lost at least 1 permanent tooth (14% and 65%). A higher percentage of elderly adults were more likely to have not seen a dentist within 5 y and have lost at least 1 permanent tooth (15% and 69%). Adults with a high school diploma or less and adults with income less than $50,000 were more likely to have not seen a dentist within 5 y and have lost at least one permanent tooth (see Table 2).
Proportion Having a Dental Visit within 5 y and Losing Any Permanent Teeth among US Adults, Ages 18 y and Older: 2018.
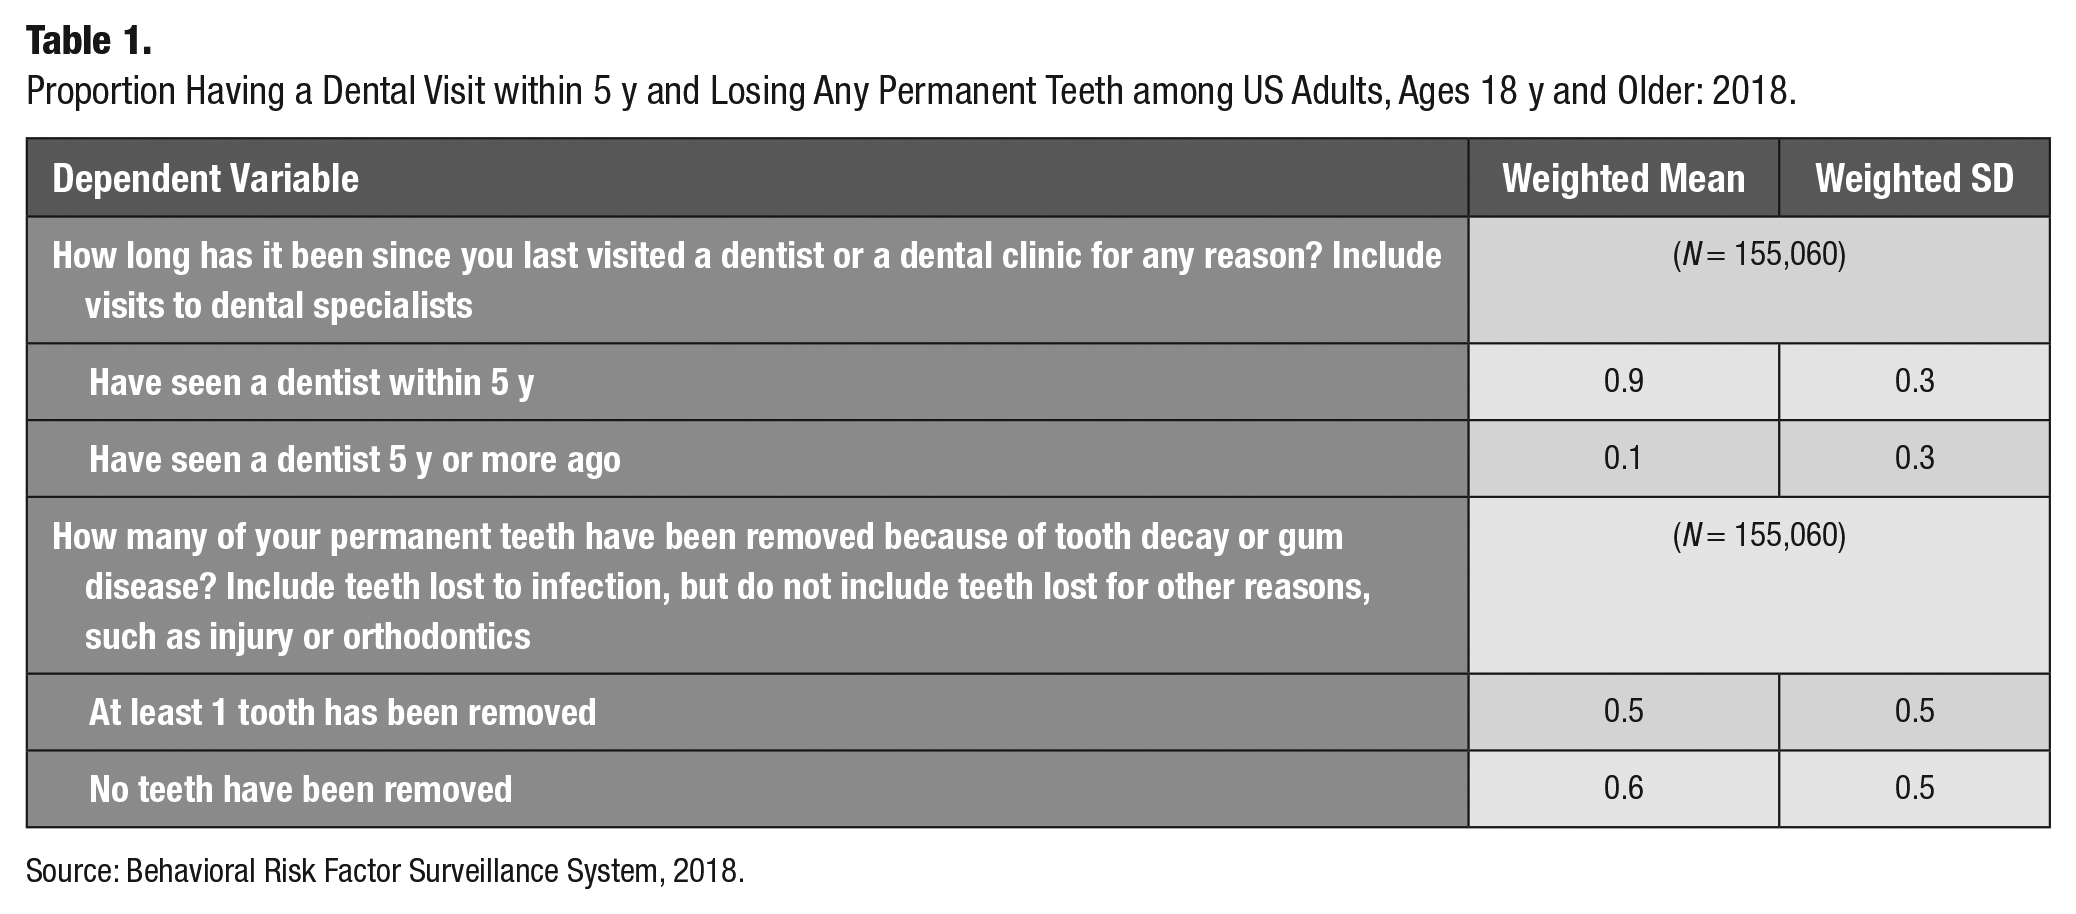
Source: Behavioral Risk Factor Surveillance System, 2018.
Proportion of US Adults Who Have Not Had a Dental Visit within 5 y and Had at Least 1 Permanent Tooth Removed: 2018.
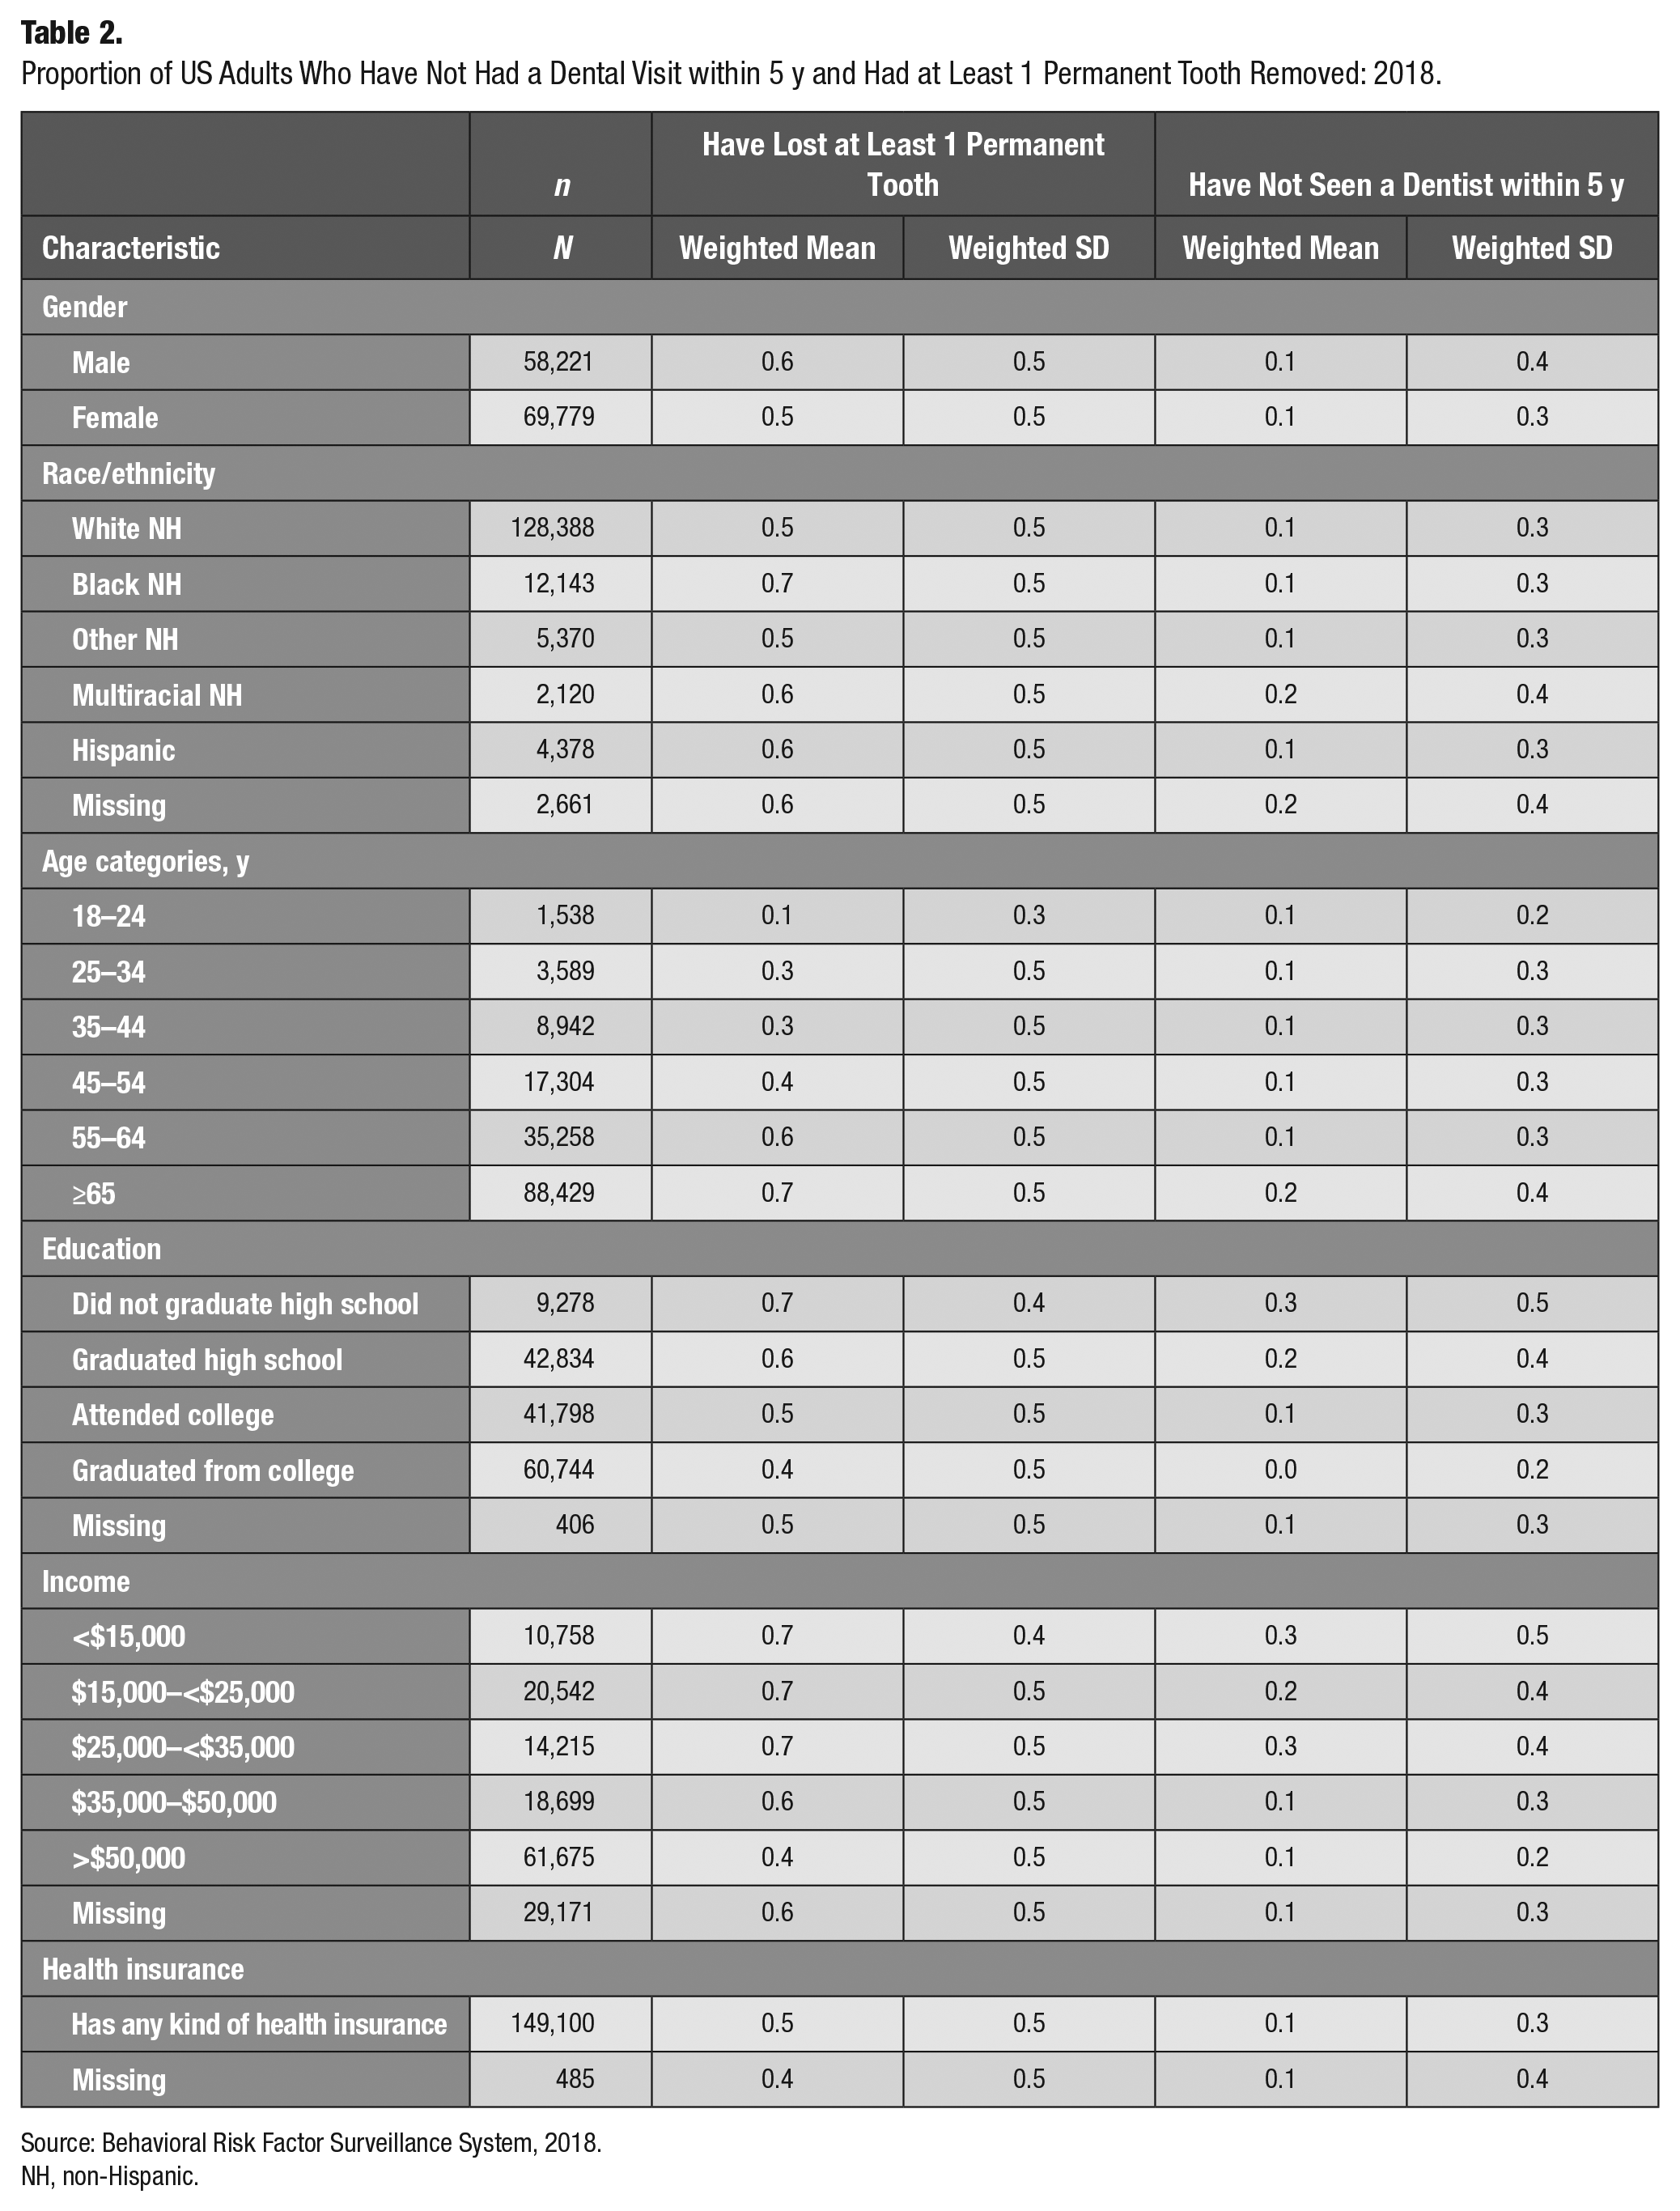
Source: Behavioral Risk Factor Surveillance System, 2018.
NH, non-Hispanic.
Factors Associated with the Loss of Teeth
Among US adults aged 18 y and above, males were 3.5 percentage points (95% CI, 3.2–3.7) more likely to have lost teeth compared to females. This means that while females had a 54.0% mean probability of losing teeth, the same for males was 55.2%. Relative to non-Hispanic White adults, non-Hispanic Black, other race non-Hispanic, and non-Hispanic multiracial adults were 10.4 percentage points (95% CI, 9.6–1.1), 3.2 percentage points (95% CI, 2.0–4.4), and 7.3 percentage points (95% CI, 4.9–9.8) more likely to have lost teeth. Being Hispanic was protective relative to being White non-Hispanic; Hispanics were −0.6 percentage points (95% CI, −1.6% to 0.3%) less likely to have lost teeth compared to White non-Hispanic adults. The likelihood of losing teeth increased with age. Educational attainment was protective, in that the probability of losing teeth declined steadily as an adult’s educational level increased from no high school education to a college degree. The enabling factors, such as higher income and having health insurance, were protective for the likelihood of losing teeth; for example, adults with a household income of more than $50,000 had their likelihood of losing any permanent teeth lowered by −17.2 percentage points (95% CI, −18.2 to −16.2) compared to lower-income populations (income <$15,000). In comparison with the uninsured, people having any type of health insurance had their likelihood of losing any permanent tooth lowered by −5.3 percentage points (see Table 3).
Marginal Effects of Predisposing and Enabling Factors on Likelihood of Losing Any Permanent Teeth Due to Decay or Gum Disease and Not Having a Dental Visit within the Past 5 y: 2018.
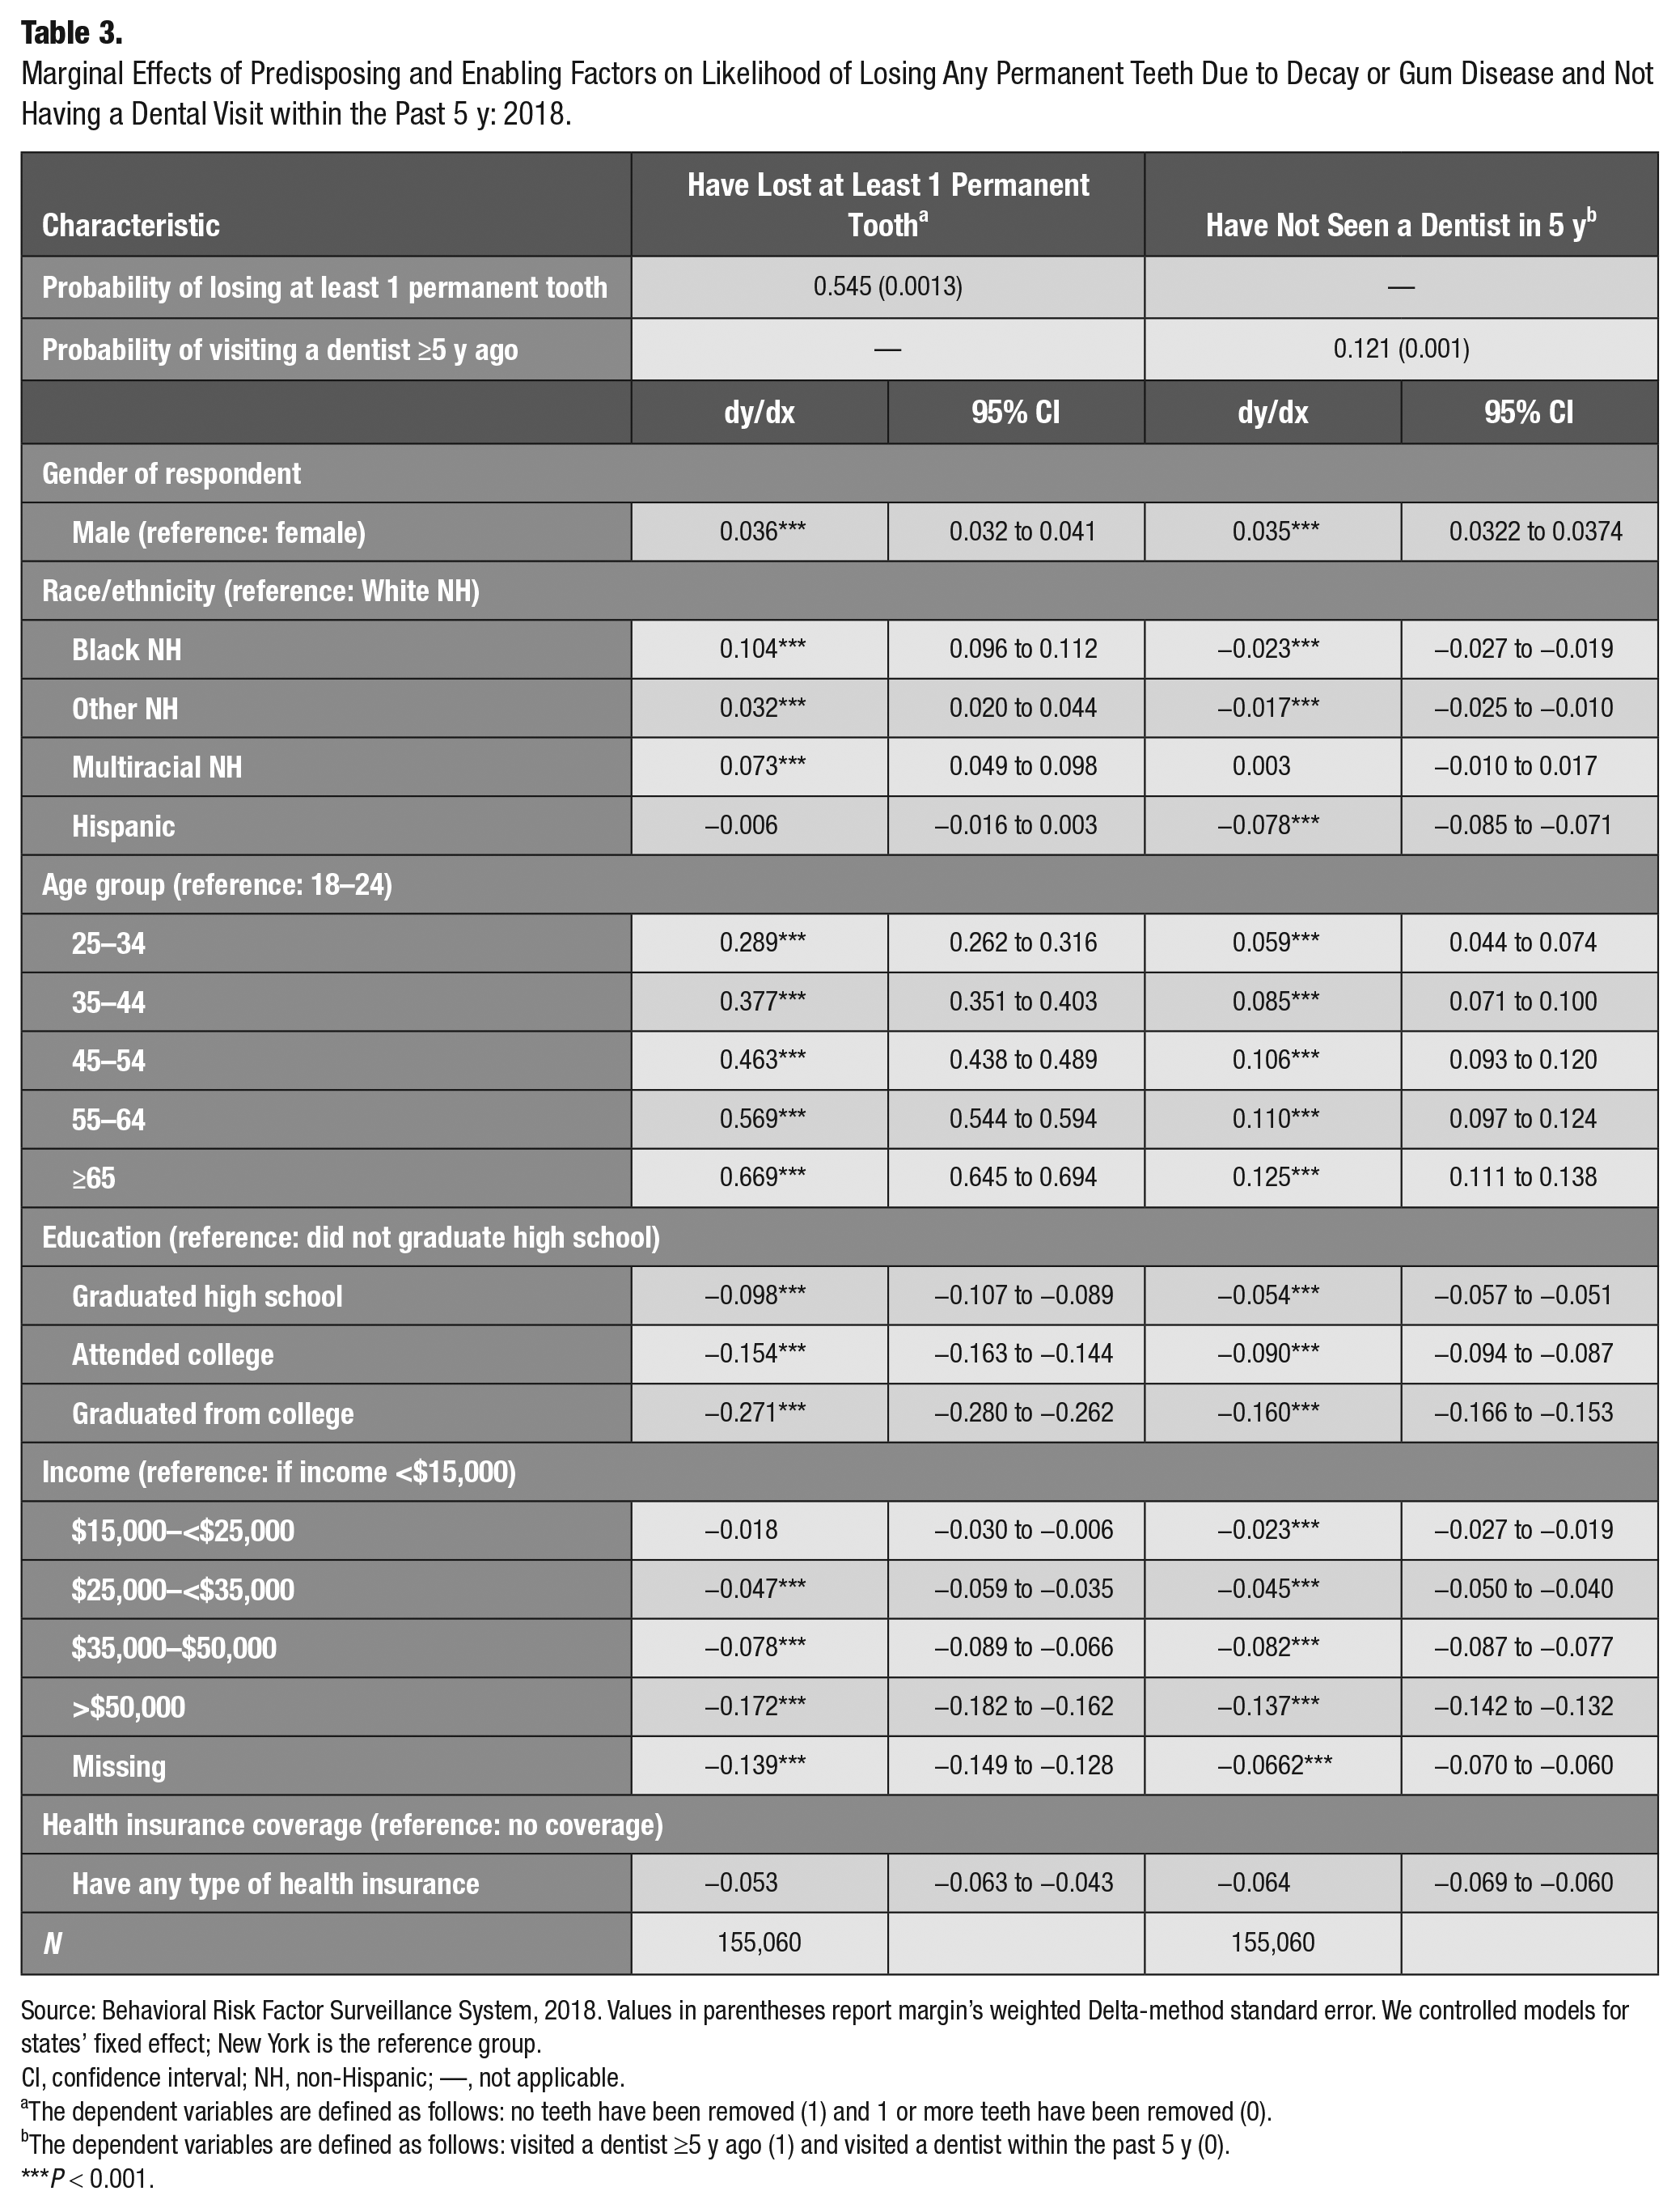
Source: Behavioral Risk Factor Surveillance System, 2018. Values in parentheses report margin’s weighted Delta-method standard error. We controlled models for states’ fixed effect; New York is the reference group.
CI, confidence interval; NH, non-Hispanic; —, not applicable.
The dependent variables are defined as follows: no teeth have been removed (1) and 1 or more teeth have been removed (0).
The dependent variables are defined as follows: visited a dentist ≥5 y ago (1) and visited a dentist within the past 5 y (0).
P < 0.001.
Factors Influencing Not Having a Dental Visit within 5 y
Gender and age are the most notable predictors of reporting whether one’s last dental visit was ≥5 y ago. Men were more likely to report that they had not had a dental visit within the past 5 y. Relative to young adults between 18 and 24 y old, elderly adults were more likely to report they had not had a dental visit within the past 5 y. Hispanic, Black non-Hispanic, and other race non-Hispanic adults were respectively −7.8 percentage points (95% CI, −8.5% to −7.1%), −2.3 percentage points (95% CI, −2.7% to −1.9%), and −1.7 percentage points (95% CI, −2.5% to −1.0%) less likely to report that they had not had a dental visit within 5 y. Increases in educational attainment and income and having insurance coverage are protective against reporting having one’s last dental visit ≥5 y ago (see Table 3).
The Figure shows the marginal effect estimates for losing teeth and not seeing a dentist within the past 5 y among adults 18 y old and above across all states and the District of Columbia in 2018. We used New York as the reference group and adjusted the model for all covariates reported in Table 3. We categorize states in 4 panels. Panel A reports states where adults had a higher probability of losing at least 1 permanent tooth and a lower probability of not seeing a dentist within the past 5 y relative to New York. No states fall into this category.
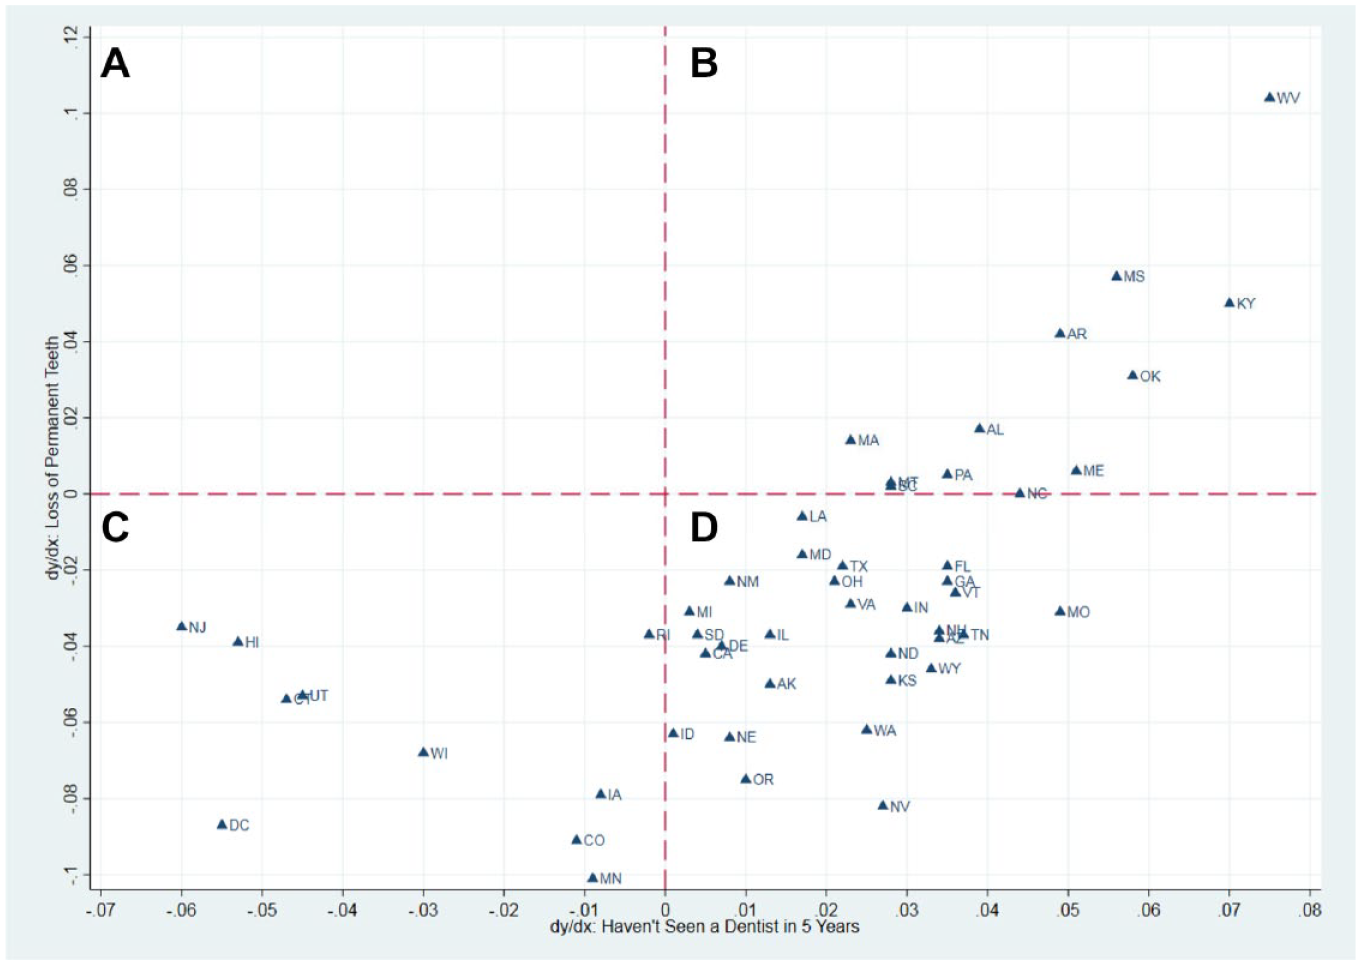
The marginal effects of residing in each state relative to New York of losing any permanent teeth due to decay or gum disease and of not having a dental visit within the past 5 y—2018.
States where adults had a higher probability of not seeing a dentist within the past 5 y and higher probability of losing any permanent teeth are located in panel B. Among the 12 states found in this panel, West Virginia, Kentucky, Mississippi, Arkansas, and Oklahoma had the worst outcomes. For example, compared to New York, adults in West Virginia were 7.4 percentage points (95% CI, 6.4–8.5) more likely to have not seen a dentist within 5 y and 10.4 percentage points (95% CI, 7.8–13.0).
Panel C includes 10 states where adults had a lower probability of not seeing a dentist and lower probability of losing any permanent teeth: District of Columbia, New Jersey, Hawaii, Connecticut, Utah, and Wisconsin had the best outcomes in this regard. Compared to New York, adults in New Jersey were −3.5 percentage points (95% CI, −4.8 to −2.0) less likely to lose a tooth and −6.0 percentage points (95% CI, −7.6 to −4.5) less likely to not seen a dentist within 5 y.
Most states (n = 28) fall within panel D, which includes states where residents are more likely to have not seen a dentist in the past 5 y but also less likely to lose a permanent tooth (see Figure and Appendix 1 for more detailed statewise estimates).
Effects of States’ Medicaid Adult Dental Coverage Policy
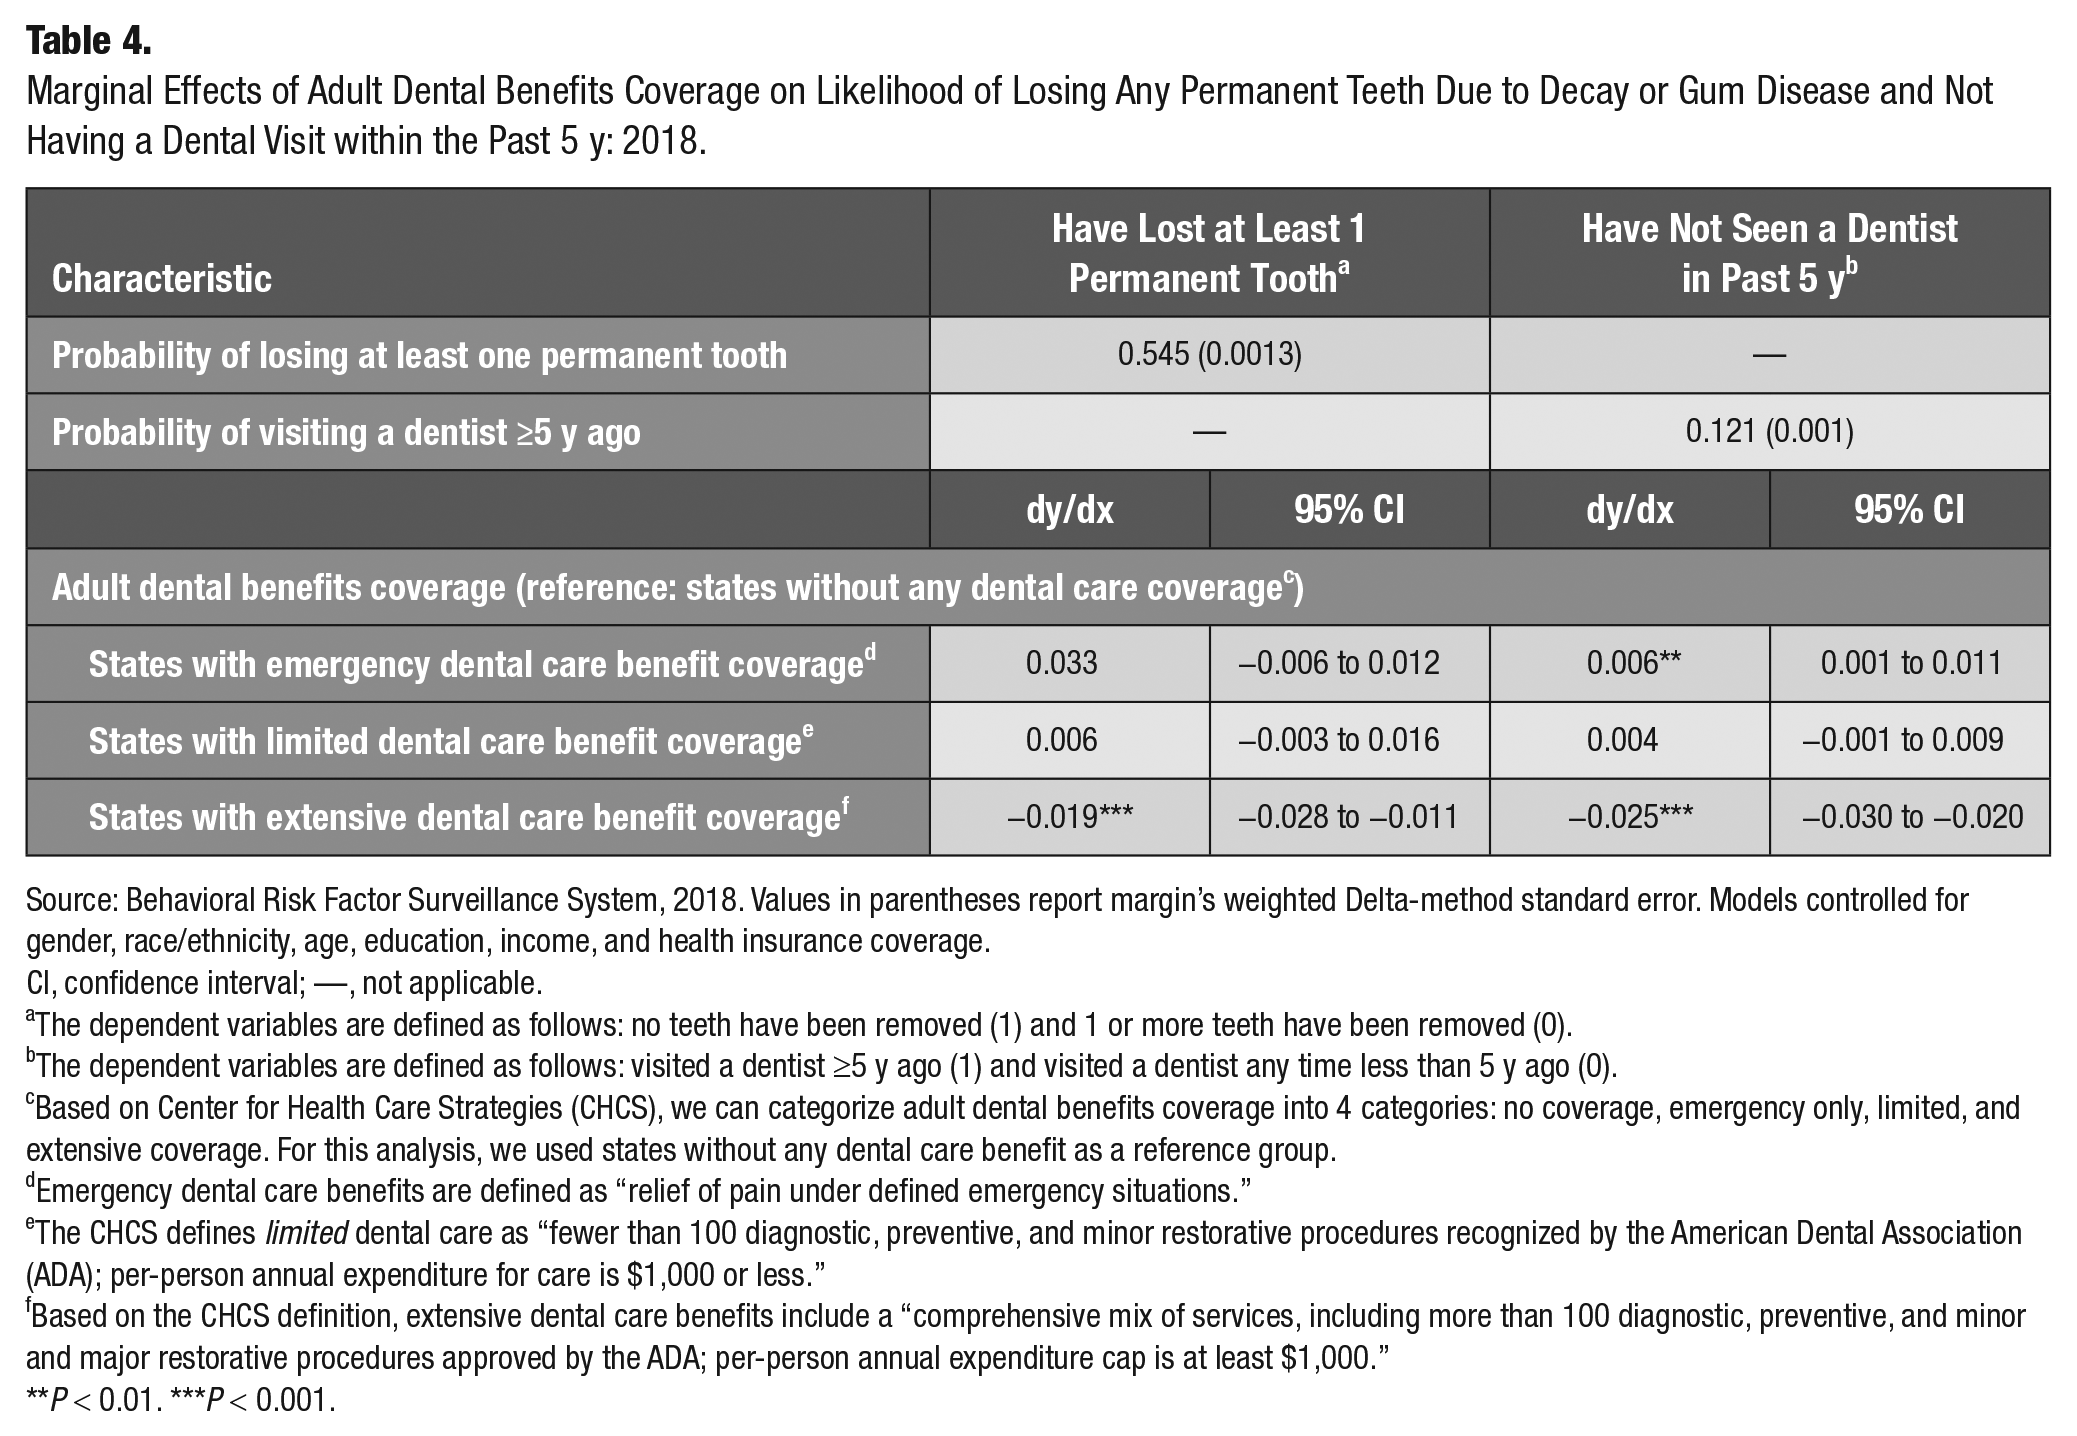
The state variation in dental outcomes and realized access was related to Medicaid state coverage policy for adults. We estimated that, in comparison with states without coverage, residents in states with extensive dental care benefit coverage are less likely to lose at least 1 permanent tooth by −1.9 percentage points (95% CI, −2.8 to −1.1) and less likely to have not visited a dentist within 5 y by − 2.5 percentage points (95% CI, −3.0 to −2.0) (see Table 4).
Marginal Effects of Adult Dental Benefits Coverage on Likelihood of Losing Any Permanent Teeth Due to Decay or Gum Disease and Not Having a Dental Visit within the Past 5 y: 2018.
Source: Behavioral Risk Factor Surveillance System, 2018. Values in parentheses report margin’s weighted Delta-method standard error. Models controlled for gender, race/ethnicity, age, education, income, and health insurance coverage.
CI, confidence interval; —, not applicable.
The dependent variables are defined as follows: no teeth have been removed (1) and 1 or more teeth have been removed (0).
The dependent variables are defined as follows: visited a dentist ≥5 y ago (1) and visited a dentist any time less than 5 y ago (0).
Based on Center for Health Care Strategies (CHCS), we can categorize adult dental benefits coverage into 4 categories: no coverage, emergency only, limited, and extensive coverage. For this analysis, we used states without any dental care benefit as a reference group.
Emergency dental care benefits are defined as “relief of pain under defined emergency situations.”
The CHCS defines limited dental care as “fewer than 100 diagnostic, preventive, and minor restorative procedures recognized by the American Dental Association (ADA); per-person annual expenditure for care is $1,000 or less.”
Based on the CHCS definition, extensive dental care benefits include a “comprehensive mix of services, including more than 100 diagnostic, preventive, and minor and major restorative procedures approved by the ADA; per-person annual expenditure cap is at least $1,000.”
P < 0.01. ***P < 0.001.
Discussion
Nationally, we found disparities in unmet dental needs by gender, race, ethnicity, and socioeconomic status. Men and low socioeconomic status adults were most at risk of having unmet dental needs. In comparison to White non-Hispanic, Hispanic ethnicity was protective on both measures of unmet need while being Black non-Hispanic and other non-Hispanic was protective for dental care use but at higher risk for permanent tooth loss. Our results for socioeconomic status are consistent with other studies that have found disparities in access and use of dental health care. Using data from the BRFSS between 2010 and 2014, a study concluded that low-income adults in states with dental benefits beyond emergency-only coverage used more dental visits in the past year compared to low-income adults in states without such benefits (Singhal et al. 2015); in another study and using National Health and Nutrition Examination Survey data from 2011 through 2016, Williams et al. (2021) showed that low-income adults suffered more from untreated caries than higher-income adults.
Significantly, our results for race and ethnicity differ from other studies. Zhang (2016), using data from the 2012 Medical Expenditure Panel Survey, found that adults who were Black non-Hispanic, Hispanic, and of another minority group were less likely to report having a general dental visit than those who were White non-Hispanic. In a study conducted in Maryland, Chalmers (2017) reported that Blacks in low-income central cities were less likely to have access to dental care than those who were White non-Hispanic. The difference between those studies and ours is that the outcome variable in the prior studies was whether an adult had a visit during the past year, whereas our outcome variable is whether an adult has had a visit within the past 5 y. To explore this discrepancy, we conducted a sensitivity analysis using 2018 BRFSS data where the outcome variable is whether an adult had a visit during the past year (within 12 mo). Consistent with Zhang (2016) and Chalmers (2017), our results showed that Black non-Hispanic adults and other race non-Hispanic adults were less likely to have had a dental visit during the past year compared to White non-Hispanic adults. Considered in conjunction, these findings underscore the importance of ensuring timely access to care for racial minorities. Although minority adults eventually do get to see a dentist, the delay in access, which in some cases may be years, may lead to a loss of permanent teeth.
Our comparison across states indicates that states’ Medicaid policy choices for adult coverage play an important role in dental care outcomes and realized access (i.e., use of services). Apparently, good dental care access is a prerequisite to achieving good oral health outcomes. States with the best outcomes (e.g., District of Columbia, New Jersey, Connecticut, Wisconsin, Iowa, Colorado, and Minnesota) provide dental benefits that include preventive, restorative, and periodontal services, as well as dentures, oral surgery services, and orthodontia. For example, New Jersey FamilyCare’s benefits provide “the nation’s longest-running uninterrupted comprehensive dental benefit” (New Jersey Department of Human Services [NJ-DHS] 2021). This package includes 2 oral evaluations per year, periodontal services, diagnostic services, oral surgical services, 2 prophylaxes per year, medically necessary orthodontics to age 21 y, restorations and crowns, complete and partial dentures, root canals, and medically necessary dental services in an operating room (NJ-DHS 2021).
Most states had moderate outcomes. These states provide either “emergency” or “limited” dental care benefit coverage with benefit-in-cash, benefit-in-kind, or both. Some of these states place a maximum annual cap on allowable benefits. For example, Nevada covers only “emergency dental examinations, extractions, and in some instances false teeth (full and partial dentures to replace missing teeth)” for adults 21 y of age and older (CHCS 2019).
States with the worst outcomes (e.g., West Virginia, Mississippi, Kentucky, Oklahoma, Maine, Alabama) provide emergency-only coverage. Adult dental services in West Virginia, for example, are limited to emergency procedures to treat fractures, reduce pain, or eliminate infection. Prior authorization may be required for some services and/or when service limits have been exceeded (West Virginia Department of Health Human Resources 2021). States with similar levels of minimal coverage should consider expanding benefits to include comprehensive preventive and restorative care.
In addition, policymakers with a goal of improving the oral health safety net should target the unmet dental needs for specific demographic and socioeconomic populations (i.e., men and adults with low levels of income and education attainment). This strategy is supported by current research (Singhal et al. 2017). While “one size will not fit all,” states should use a variety of policy levers to address the needs of these vulnerable populations. Methods include deploying community health workers and patient navigators to connect at-risk populations to available dental care, increasing Medicaid reimbursement rates for dental services to encourage participation in the Medicaid program, expanding covered dental services for Medicaid-enrolled and eligible adults, targeting public education programs to improve oral health literacy among vulnerable populations, and expanding access to care and services through the use of dental therapists.
Although further investigation is needed, our findings suggest that the differences in unmet dental needs observed here are influenced by the strength and robustness of the oral health policy that serves the residents of each state. Future research should explore whether the disparities in outcomes between states are associated with the differences in the dental benefits provided and the services covered under each state’s oral health plan.
Supplemental Material
sj-docx-1-jct-10.1177_23800844211035669 – Supplemental material for Predictors of Unmet Dental Health Needs in US Adults in 2018: A Cross-Sectional Analysis
Supplemental material, sj-docx-1-jct-10.1177_23800844211035669 for Predictors of Unmet Dental Health Needs in US Adults in 2018: A Cross-Sectional Analysis by D.J. Gaskin, H. Zare, R. McCleary, O. Kanwar and A.L. Davis in JDR Clinical & Translational Research
Footnotes
A supplemental appendix to this article is available online.
Author Contributions
D.J. Gaskin, contributed to conception, design, data analysis, and interpretation, drafted and revised the manuscript; H. Zare, contributed to conception, design, data acquisition, analysis and interpretation, drafted and revised the manuscript; R. McCleary, O. Kanwar, contributed to data interpretation, revised the manuscript; A.L. Davis, contributed to conception, design, and data interpretation, revised the manuscript. All authors gave final approval and agree to be accountable for all aspects of the work.
Declaration of Conflicting Interests
The authors declared no potential conflicts of interest with respect to the research, authorship, and/or publication of this article.
Funding
The authors disclosed receipt of the following financial support for the research, authorship, and/or publication of this article: This research was supported by the Pew Charitable Trusts (GR-000002058) and The Abell Foundation. The funders were not involved in the study design; in the collection, analysis, and interpretation of data; in writing this report; or in the decision to submit this paper for publication. The content is solely the responsibility of the authors and does not necessarily represent the official views of the Pew Charitable Trusts and The Abell Foundation.
References
Supplementary Material
Please find the following supplemental material available below.
For Open Access articles published under a Creative Commons License, all supplemental material carries the same license as the article it is associated with.
For non-Open Access articles published, all supplemental material carries a non-exclusive license, and permission requests for re-use of supplemental material or any part of supplemental material shall be sent directly to the copyright owner as specified in the copyright notice associated with the article.