
Abstract
Objective:
The aim of this study is to examine the effect of diet drinks on dental erosion among a representative sample of US adults.
Methods:
Adult dietary and dental data were analyzed from the 2003–2004 cycle of the National Health and Nutrition Examination Survey. Erosion was measured with a modified tooth wear index and was analyzed as a dichotomous variable. Cluster analysis was performed, and the cluster number was based on having a separate diet drink cluster and the R2 values. Survey procedure and sample weights were used.
Results:
Most of the population (80%) had some form of dental erosive lesions. When compared with the total sample, people with erosion were more likely to be male (52.5%) and older. People with no erosive lesions were younger (42.3%) and non-Hispanic Black (21.2%). Cluster analysis resulted in 4 distinct clusters: high water, high diet drinks, high coffee/tea, and high soda. The respective percentage of individuals in each cluster who had erosion was 78.9%, 85%, 83.9%, and 76.2%, where the “high diet drinks” cluster showed the highest erosion (P = 0.28). Logistic regression modeling showed that the “high diet drinks” cluster had increased odds of erosion (odds ratio = 1.27; 95% CI = 0.58 to 2.77) when compared with the “high water” cluster, but the relationship was not statistically significant.
Conclusion:
High diet drinks consumption slightly increased the odds of dental erosion among US adults, although this relationship was not statistically significant. It is thus not yet clear that dentists should recommend diet drinks, as they might be linked to systemic diseases. Further research is needed to explore more about risk factors of erosion.
Knowledge Transfer Statement:
The findings of this study are suggestive, though not significantly, that diet drinks may increase risk for dental erosion. While further research is needed, it is not clear that dentists should recommend these drinks as healthy substitutes for sugary drinks.
Keywords
Introduction
An erosive lesion is a noncarious lesion, defined as the loss of dental hard tissues, which is due to acidic substance exposure (Ganss 2006; Struzycka et al. 2014). These acids might be of intrinsic origin, such as gastroesophageal reflux, or extrinsic origin, such as fruit juices and carbonated beverages (Ganss 2006; Struzycka et al. 2014). If erosion is not treated, it can lead to tooth discoloration and sensitivity (Okunseri et al. 2011).
While there are many researchers studying erosion among children (Alvarez Loureiro et al. 2015; McGuire et al. 2009; Murakami et al. 2011; Salas, Nascimento, Huysmans, et al. 2015; Salas, Nascimento, Vargas-Ferreira, et al. 2015), few studies have researched erosion in adults, and these were mainly conducted in Europe and in low-caries countries. The prevalence of dental erosion among adults showed a wide range among countries, populations, and samples (Bartlett et al. 2013). When erosion prevalence was compared in 7 European countries (Estonia, Latvia, Finland, France, Italy, Spain, and United Kingdom), 57% of the adults aged 18 to 35 y had some form of erosion, with UK participants having the highest prevalence of erosive lesions (Bartlett et al. 2013).
Dietary habits and beverage consumption, especially acidic beverages, are considered important factors in the process of developing dental erosive lesions. Natural fruit juice/drinks and carbonated beverages such as soda are the most studied acidic beverages, and both demonstrate a positive relationship with dental erosion (Salas, Nascimento, Vargas-Ferreira, et al. 2015). A systematic review aimed to assess the influence of diet on dental erosion among children and adolescents concluded that natural fruit juices and soft drinks increase the odds for dental erosion (OR = 1.20, P = 0.03; OR = 1.61, P = 0.001, respectively), while milk showed a protective effect (OR = 0.96, P = 0.008; Salas, Nascimento, Vargas-Ferreira, et al. 2015).
Most of the current studies examined the effect of single beverages on dental erosion. This relationship might be affected by consuming other beverages during the day, resulting in a different outcome than expected. For example, one might consume soda (increase erosion) and milk (protective against erosion) in the same day, and the resulting effect on dental erosion is still unknown.
Another limitation of these studies is that they did not examine the effects of regular and diet drinks separately, although these beverages have different pH levels and in vitro studies showed inconsistent results when comparing the effects of sugar-sweetened and diet drinks on dental erosion (Barac et al. 2015; Ehlen et al. 2008; Gravelle et al. 2015; Lussi and Carvalho 2015; Jameel et al. 2016). When low calorie sweetener (LCS) is added to diet drinks, citric acid is also added to compensate for the decreased sugar content, which might result in different levels of erosion.
The aim of our study is to examine the effect of diet drinks on dental erosion among a representative sample of US adults via cluster analysis.
Methods
This study has complied with the protocol of the STROBE checklist.
Data Source and Sample
Data from the 2003–2004 cycle of the National Health and Nutrition Examination Survey (NHANES) were used. NHANES is a stratified multistage probability survey that is conducted by the National Center for Health Statistics. NHANES includes the civilian noninstitutionalized population residing in the 50 states and the District of Columbia (Centers for Disease Control and Prevention 2011). We used this cycle because it is the only one where erosion measurement is available. The study sample consisted of 2,368 adults aged between 21 and 60 y who completed the dental examination and dietary interview. Individuals aged >60 y were excluded because their beverage consumption was mainly tea, coffee, and water.
Dietary Assessment
Beverage consumption data were obtained from two 24-h recall dietary interviews. Beverages were extracted and grouped manually, and the mean consumption was calculated (g/d). The percentage of each beverage was calculated and used for analysis, instead of absolute amounts, as it is easier to compare and group individuals. Beverages with low percentages were grouped with similar beverages—for example, plain water was grouped whether it was bottled or tap, and drinks with LCS were grouped. The main beverage categories that were used in the cluster analysis were defined as follows:
Milk: Plain nonsweetened milk, buttermilk
Water: Plain nonsweetened, nonflavored tap and bottle water
100% juice: Fresh fruit and vegetable juices with no added sugars
Juice drink: Drinks containing <100% fresh juice; bottled, canned, or powder mix fruit-based drinks
Soda: Regular sugared carbonated soda
Diet drinks: Reduced sugar and diet soda; fruit drinks with reduced sugar or LCS; water, coffee, or tea with LCS; low-calorie sports/energy drinks
Coffee and tea: Nonsweetened coffee and tea
Sports/energy drinks: Regular sugared sports/energy drinks
Sugared drinks: Flavored and sugared milk, sweetened water, sugared and flavored coffee, sugared tea, and nutritional and protein shakes
Other drinks: Soy, almond, and malted milk; coconut and oats beverages
Erosion Measurement
The index used to assess erosion by NHANES was the tooth wear index (TWI) developed by Smith and Knight in 1984 and modified by Millward et al. in 1994. This index was modified by Millward et al. to measure erosion and has been used for measuring and studying erosion (Dye et al. 2008; McGuire et al. 2009). The TWI protocol used in the 2003–2004 NHANES was derived from the 1998 UK Adult Dental Health Survey, which excluded cervical surfaces as they are mainly related to abrasion (Millward et al. 1994; Dye et al. 2008).
NHANES dental examinations were performed by dentists and recorded by a dental recorder. Dentists used a surface-reflecting mirror and an examining light and dried the tooth surface before examination. Only natural permanent tooth surfaces were examined. The TWI was used to measure erosion for the following teeth: central, lateral, canine, and first molar. It also was used for the following surfaces: lingual, facial, and incisal/occlusal. For each surface measured, erosion was classified into 4 stages:
Stage 0: Sound (including any wear restricted to enamel)
Stage 1: Loss of enamel just exposing dentin
Stage 2: Loss of enamel exposing dentin for more than one-third of the surface for buccal/lingual surfaces; on incisal/occlusal surfaces, exposed dentin facets ≥2 mm in dimension buccolingually
Stage 3: Complete loss of enamel and pulp exposure or exposure of secondary dentin
More information regarding the examination and scoring is included in the NHANES dental examiner manual (National Center for Health Statistics 2004).
In this analysis, erosion was dichotomized into no erosion versus at least 1 erosive lesion, as a very small number of the sample had erosion stages 2 and 3.
Covariates
Sociodemographic variables were as follows: gender (male/female), age (≥21 y, defined as 9-y intervals), race/ethnicity, ratio of family income to poverty (categorized per the Medicare eligibility criteria into 4 categories: ≤1.38, >1.38 to ≤2.5, >2.5 to ≤4.0, and >4.0; ObamaCareFacts.com 2014), and education (categorized into high school or less, some college, and college graduate or above). Marital status was used as several researchers suggested a link between marital status and dietary behaviors; specifically, social relationships can influence the variety and types of foods consumed and therefore affect health including oral health (Conklin et al 2014; Vinther et al. 2016). The categorizations are based on partnership and cohabitation. Married and living with partner were combined as 1 group; widowed, divorced, and separated were combined into another group; and singles were the third group. In addition, the percentages of wine and alcoholic beverage intake were used as possible confounders.
Data Analysis
Our research utilized cluster analysis to account for the complexity of beverage consumption and to better understand the effect of different consumption patterns on the dentition. Cluster analysis is a statistical method for grouping data, where objects in the same cluster are more similar to one another than objects in the other clusters. This methodology was previously used to study the effects of beverage consumption patterns on dental caries (Sohn et al. 2006; Samman et al. 2020).
SAS PROC FASTCLUS was used to perform a disjoint cluster analysis, which groups observations according to the Euclidean distance, resulting in every observation being assigned to only 1 cluster (Wirfält and Jeffery 1997; Sohn et al. 2006; Samman et al. 2020).
Cluster analysis was performed by using the percentage of each of the previously defined beverages. Since the literature did not identify the appropriate number of clusters, we evaluated different cluster numbers (from 2 to 10). The final cluster number was based on whether it served the purpose of the study of having a separate diet drink cluster. This number was confirmed by comparing the R2 values across different cluster numbers.
Chi-square tests were used to examine the crude association between erosion and 1) beverage consumption clusters and 2) sociodemographic characteristics. Multiple logistic regression was used to predict erosion from the beverage consumption clusters and the sociodemographic variables. Statistical analysis was performed with SAS Software version 9.4 (SAS Institute Inc.). Survey procedures were used to account for the complex NHANES sampling design. In addition, sample weights were used to generate national level estimates of consumption in the US population.
Results
Eighty percent of the sample had some form of dental erosive lesions. When compared with the total sample, people with erosion were more likely to be male (52.5%) and older. People without erosive lesions were younger (42.3%), non-Hispanic Black (21.2%), and never married (27.8%; Table 1).
Study Sample Characteristics.
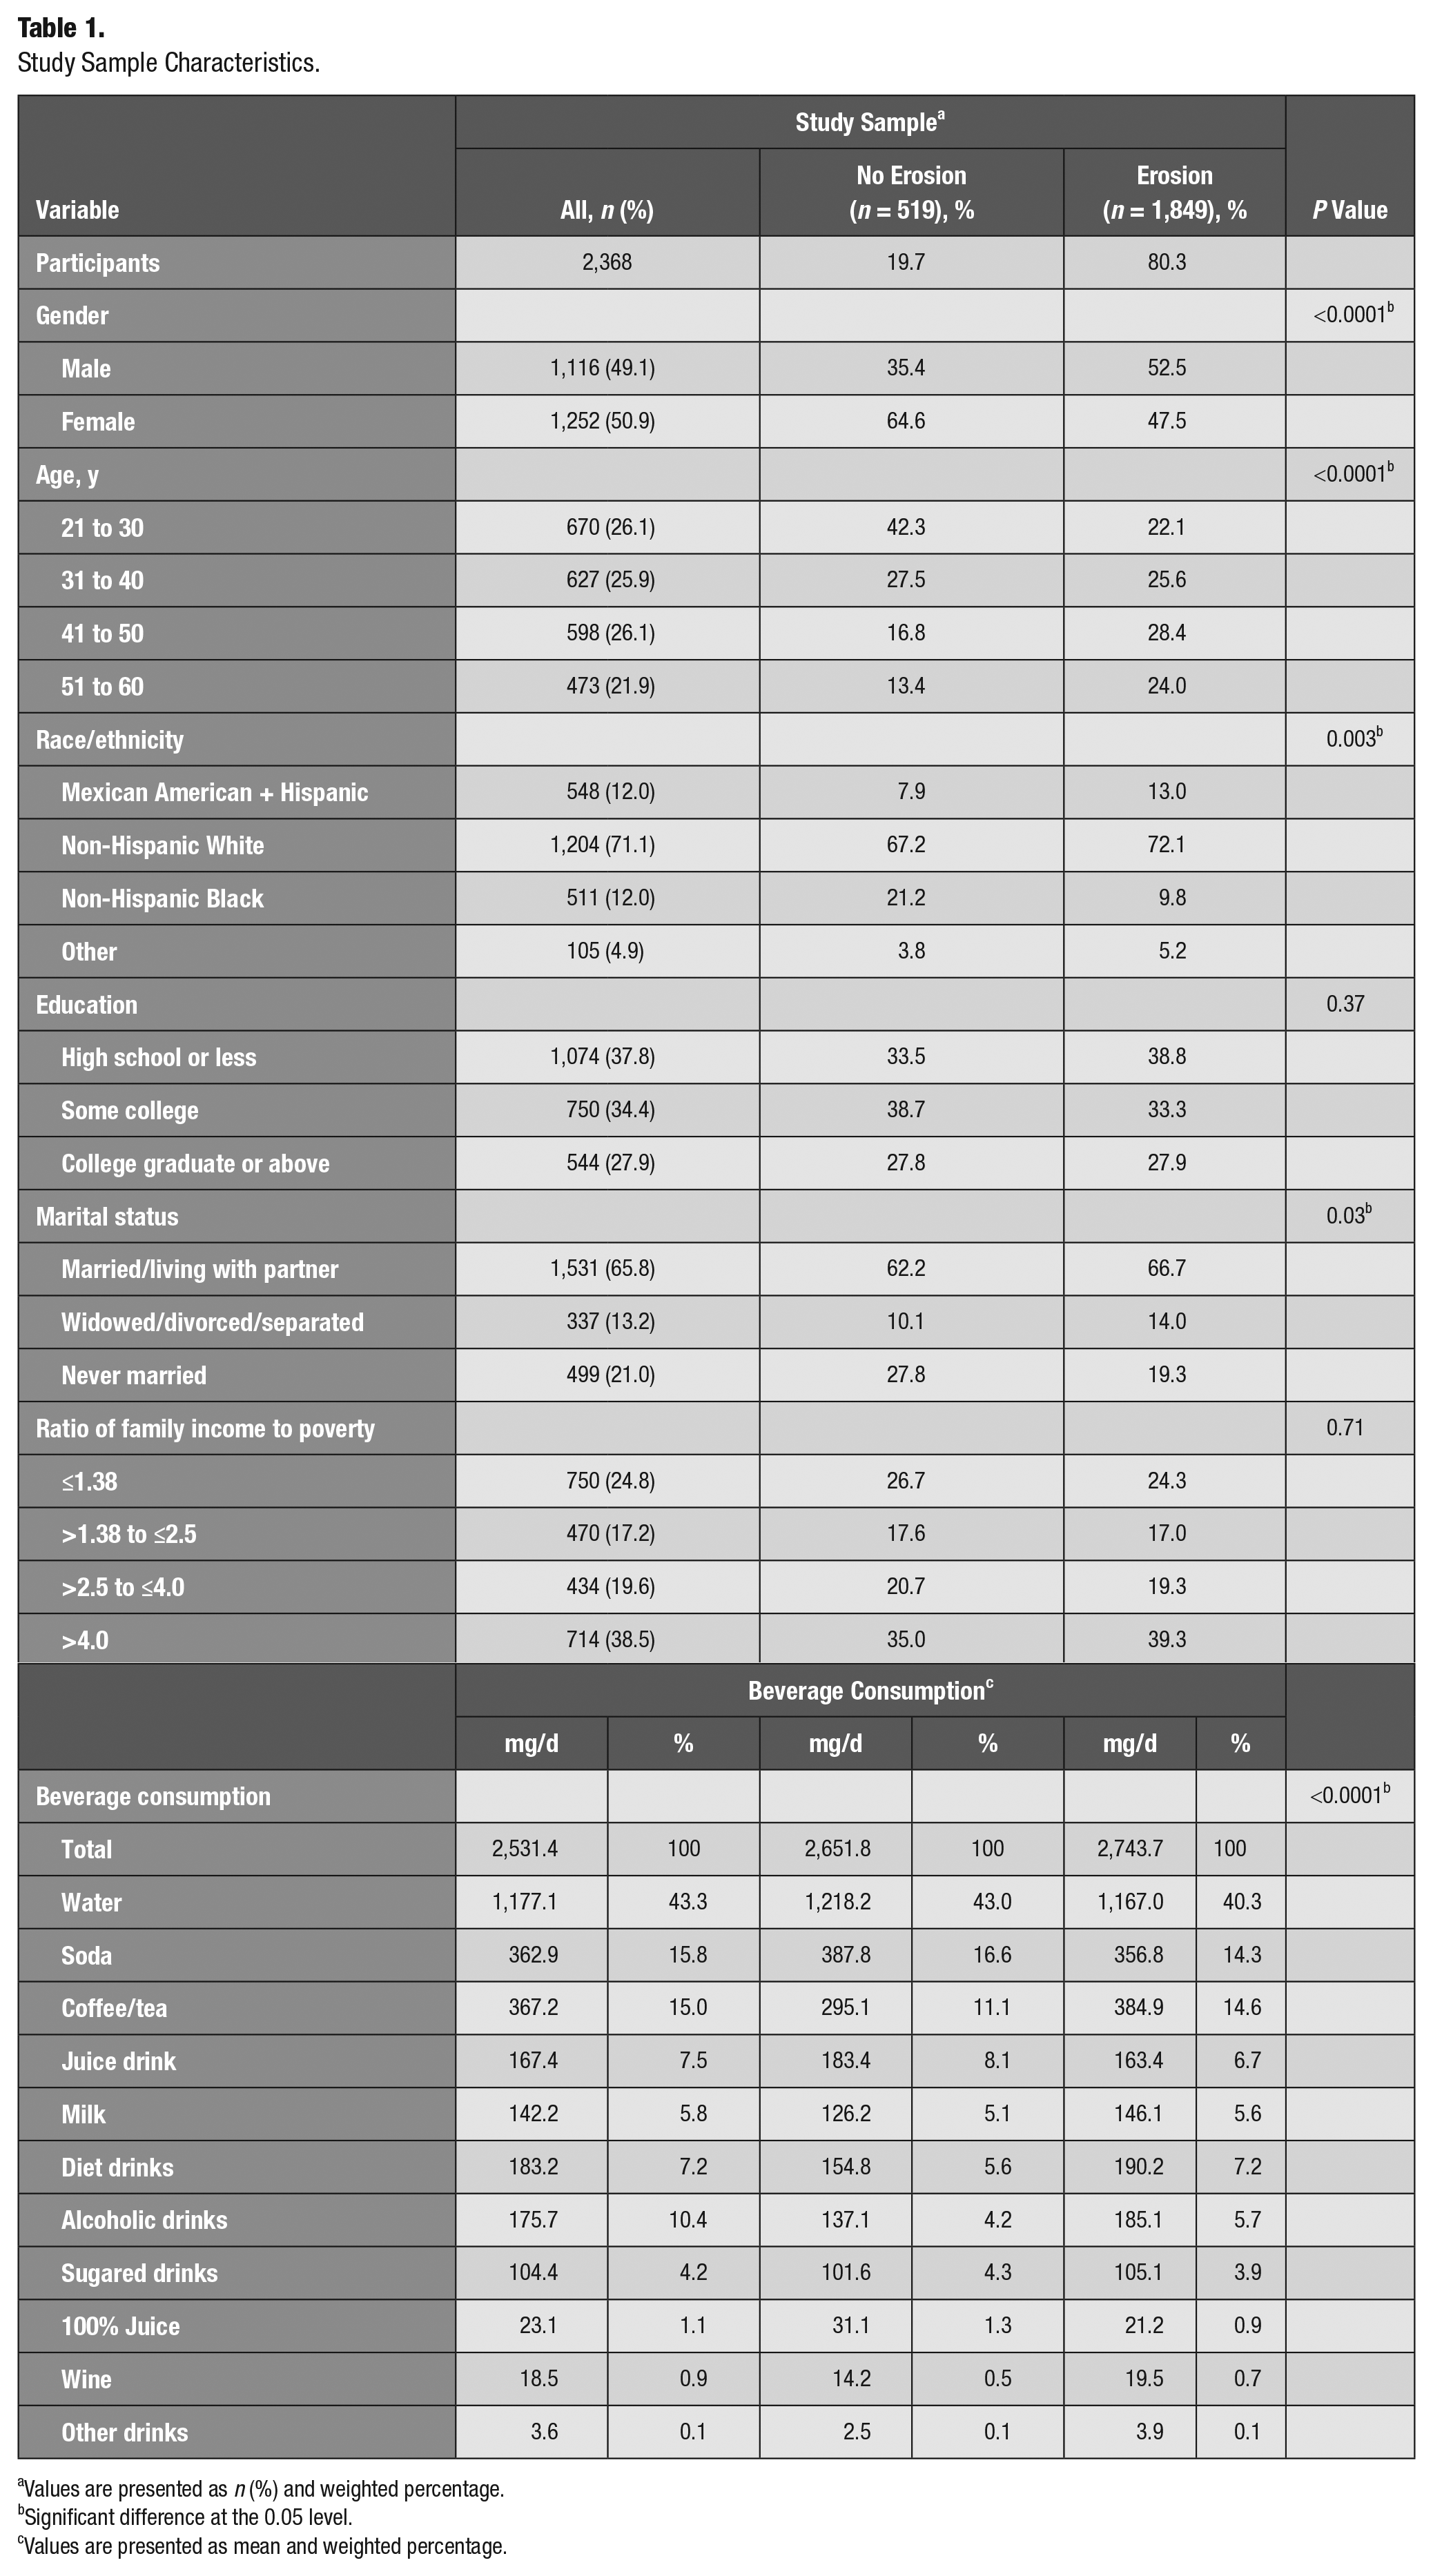
Values are presented as n (%) and weighted percentage.
Significant difference at the 0.05 level.
Values are presented as mean and weighted percentage.
Beverage Consumption Clusters
Total beverage consumption among adults comprised mostly water (43.3%), followed by soda (15.8%). Coffee and tea composed 15%, while juice and diet drinks constituted around 7% each. Although wine is considered an important risk factor for erosion, it constituted <1% of the study sample’s total beverage consumption; thus, it was removed from the cluster analysis and controlled for as a separate confounder.
Cluster analysis resulted in 4 distinct clusters, with each cluster named according to the highest percentage beverage. For example, the first cluster was named “high water” because water constituted of 65.2% of the total beverages consumed in that cluster. Similarly, other groups were named as follows: high diet drinks, high coffee/tea, and high soda. The “high water” cluster had 1,153 adults in it; “high coffee/tea,” 594; “high soda,” 460; and “high diet drinks,” 156 (Table 2).
Beverage Profile and Cluster Distributions.
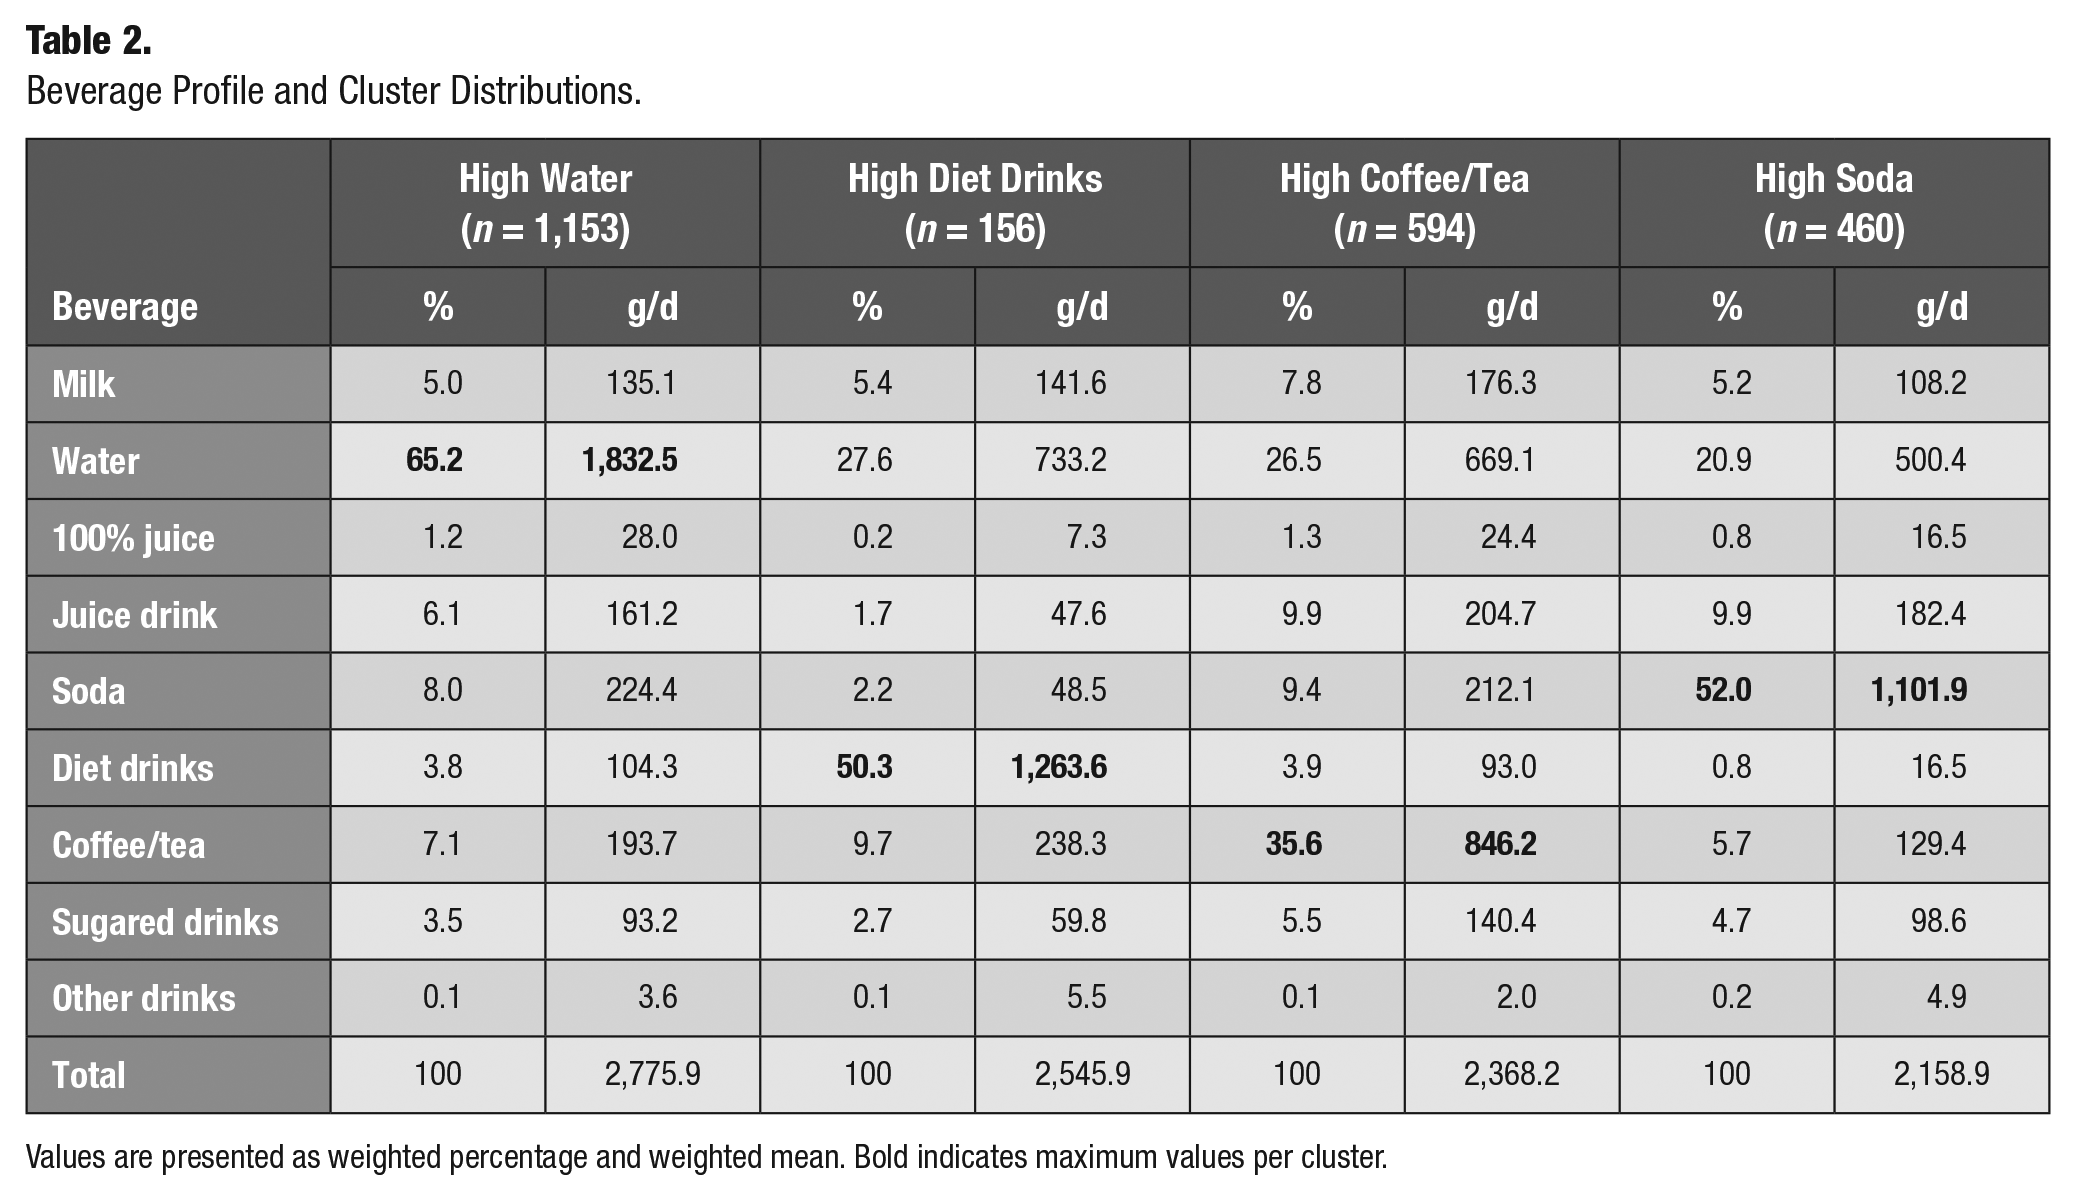
Values are presented as weighted percentage and weighted mean. Bold indicates maximum values per cluster.
Sociodemographic Characteristics of Beverage Clusters
The “high diet drinks” cluster had the highest percentage of females (64%), while the “high soda” and “high coffee/tea” clusters had high percentages of males (58.8% and 56.3% respectivley; Table 3). Young adults were mostly in the “high soda” cluster (44.6%), while “high diet drinks” consisted mostly of older adults (35.6%). “High soda” consumers were mostly non-Hispanic Black (19%), less educated, and never married and had a lower ratio of family income to poverty. In contrast, those in the “high diet drinks” cluster were wealthier and college graduates (41.6%) as compared with other beverage patterns.
Sociodemographic Characteristics of Beverage Clusters.
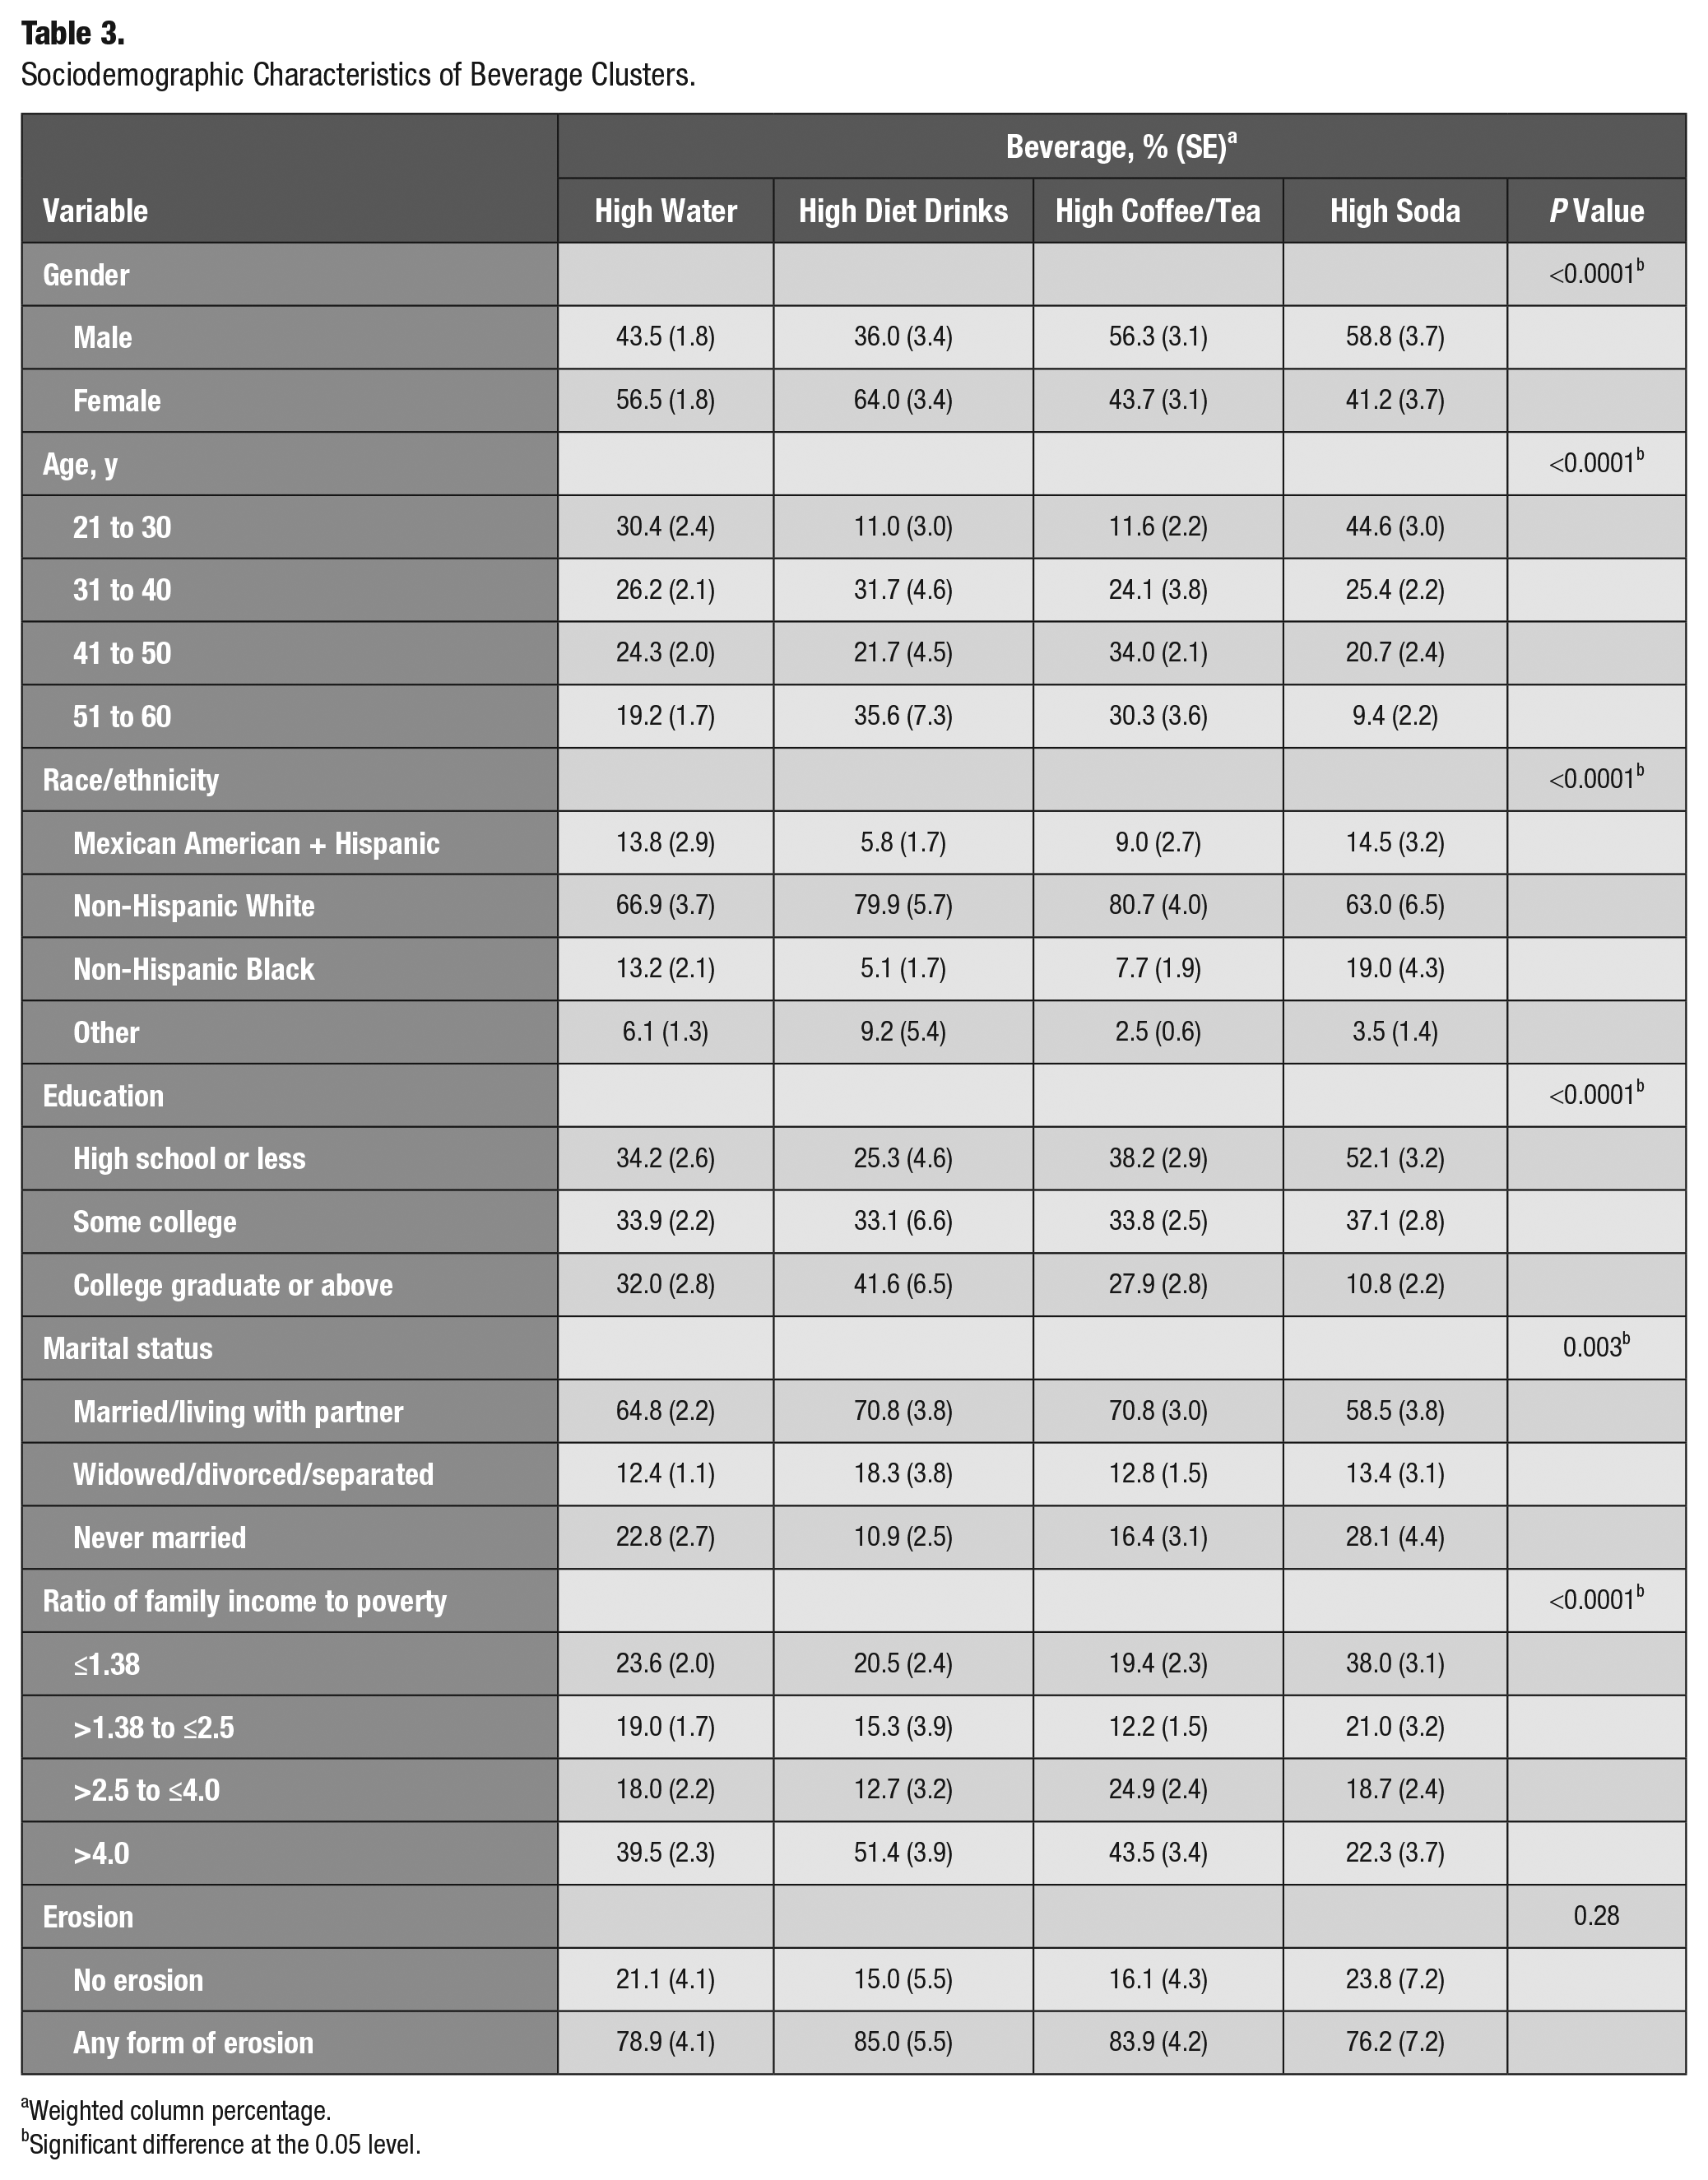
Weighted column percentage.
Significant difference at the 0.05 level.
Erosion and Beverage Clusters
The crude association between erosion and beverage clusters showed no statistically significant differences (P = 0.28), although the “high diet drinks” cluster showed the highest percentage of people with erosion (85%; Table 3). The multivariable logistic regression showed similar results after adjusting for confounders: while the “high diet drinks” cluster increased the odds of erosion to 1.27 when compared with the “high water” cluster, the results were not statistically significant (95% CI = 0.58 to 2.77). The other clusters, “high soda” and “high coffee/tea,” showed virtually no differences versus the “high water” cluster (Table 4).
Adjusted Multiple Logistic Regression Predicting Erosion.
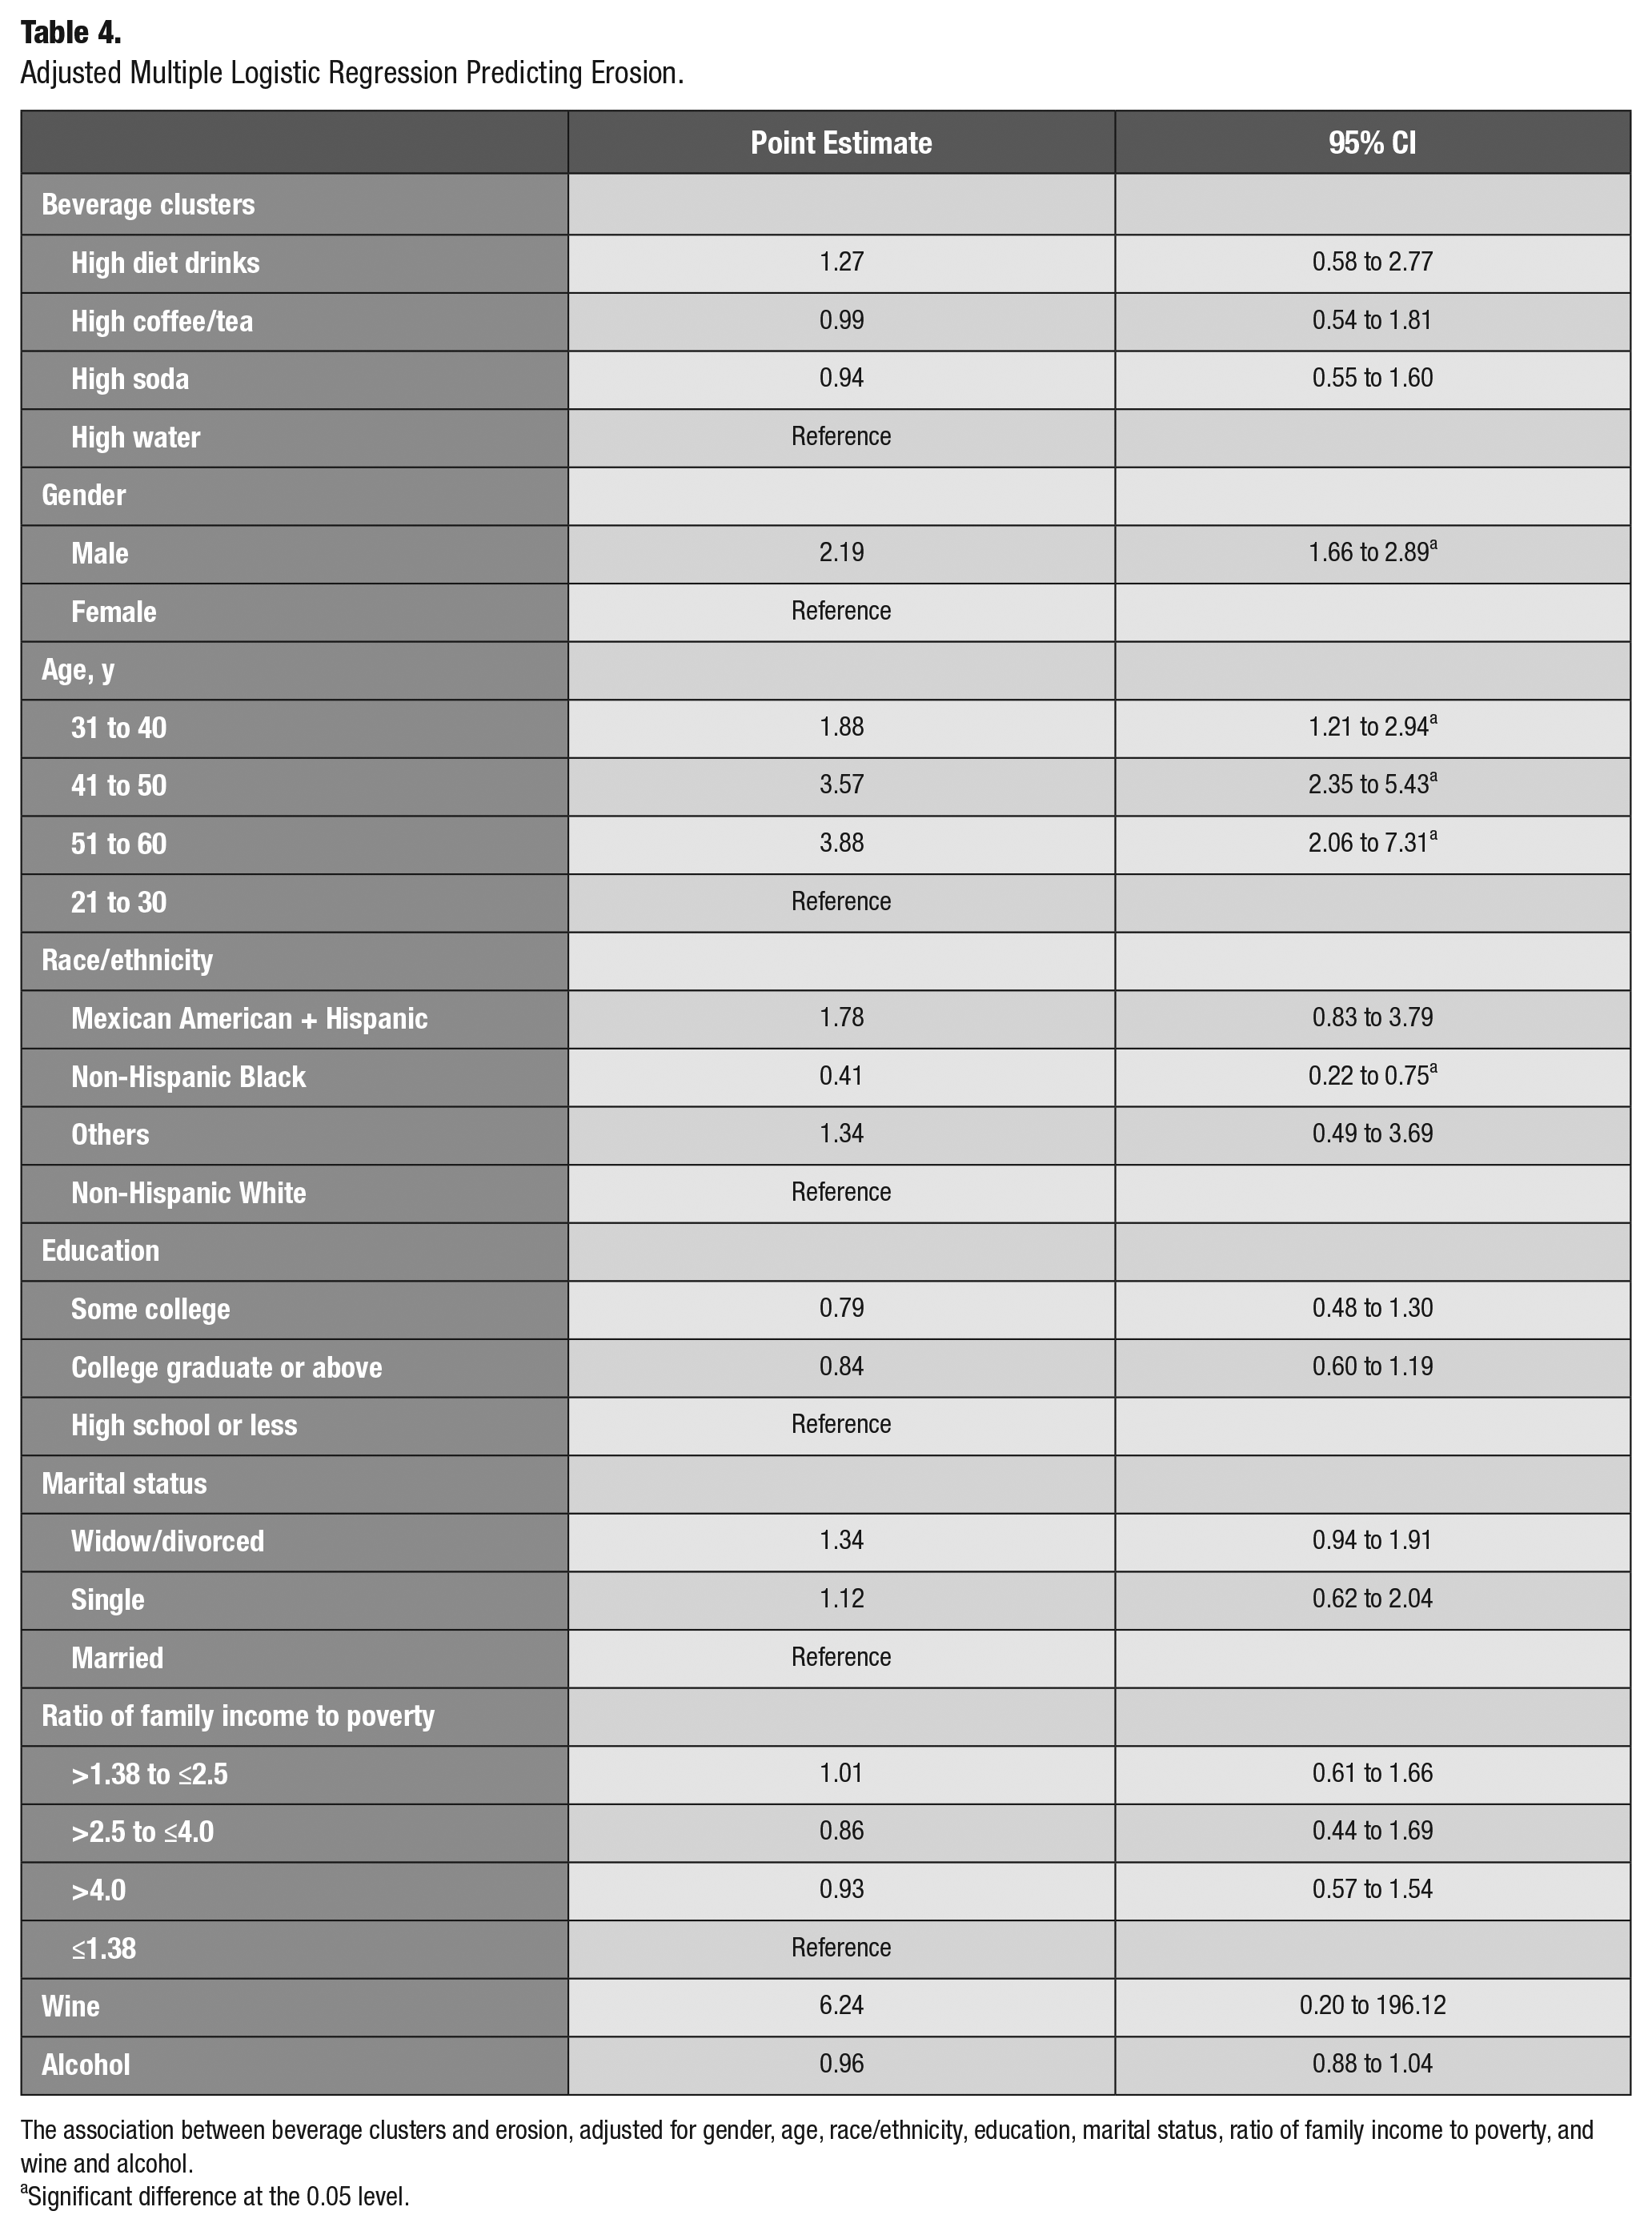
The association between beverage clusters and erosion, adjusted for gender, age, race/ethnicity, education, marital status, ratio of family income to poverty, and wine and alcohol.
Significant difference at the 0.05 level.
Discussion
This study aimed to examine the effect of diet drinks on dental erosion among US adults. Our results revealed that having a “high diet drink” pattern increased the odds of erosion, although this relationship was not statistically significant. This observation is consistent with a previous study examining the association between erosion and dietary factors among adolescents (Sovik et al. 2015). It found that while diet soft drinks increased the odds of developing erosive lesions, they were not statistically associated with erosion (OR = 1.3, 95% CI = 0.6 to 2.7) after adjusting for gender, toothbrushing frequency, sour sweets consumption, and other beverage intake (regular soda, sports drinks, and juice drinks). That study reported that the only beverage significantly affecting erosion was sports drinks (OR = 4.8, 95% CI = 1.3 to 18.4). When these drinks were combined by using the “total intake of erosive drinks” index (based on the combined daily consumption of these drinks in liters), it showed no statistically significant relationship (OR = 2.3, 95% CI = 1.5 to 3.6; Sovik et al. 2015).
In vitro studies that examined the effect of different drinks on erosion in a sample of human teeth had inconsistent results. Some studies concluded that regular sugar-sweetened soda, such as Coca-Cola, was the most erosive agent when compared with other drinks, such as fruit juice, coffee, or tea. Other studies showed the opposite effect and concluded that the low pH of the consumed beverage was the major risk factor and not the sugar contained in it (Ehlen et al. 2008; Khamverdi et al. 2013; Barac et al. 2015; Gravelle et al. 2015; Lussi and Carvalho 2015; Jameel et al. 2016).
Being in a “high diet drinks” group might suggest an attempt to follow a healthy lifestyle and overall diet by avoiding sugary soda drinks. This pattern is seen in Table 2, which shows that harmful sugary drinks, such as soda, juice drinks, and sugared drinks, constitute a very low percentage of that cluster. This suggests that other factors may play a role in the relationship between erosion and diet, such as good oral hygiene practices and frequent dental visits. Another possible explanation for the nonsignificant relationship between diet drink and erosion is the small sample size of the “high diet drinks” cluster, which resulted in a wide confidence interval. In addition, NHANES used the modified TWI as its erosion measurement. To diagnose erosion, the etiology and individual risk factors need to be identified, although this is difficult to accomplish in epidemiologic studies. Because NHANES data measured only the TWI without collecting information on the etiology of the lesion, there may be misclassification, therefore biasing the result toward the null.
Our logistic model showed that being male and middle or older age increased the odds of erosion (not to be interpreted as total effects). These findings agree with some of the previous literature, which found that erosion increases with age among children (Nunn et al. 2003; Ganss 2006; McGuire et al. 2009; Murakami et al. 2011) and adults (Lussi and Schaffner 2000; Bartlett et al. 2013). Males have more erosive lesions, probably due to their different lifestyle and dietary habits, including increased consumption of acidic foods and drinks (McGuire et al. 2009; Mulic et al. 2012; Struzycka et al. 2014; Alvarez Loureiro et al. 2015). One study showed a slight increase in erosive lesion prevalence in females versus males, but this relationship was not statistically significant (OR = 1.65, 95% CI = 0.78 to 3.48, P = 0.58; Kirthiga et al. 2015). Our results also showed an increased odds of erosion among wine consumers, but this relationship had a very wide confidence interval, perhaps due to the very small percentage of individuals who drink wine (<1%). However, regular soda had a neutral effect on erosion. This finding is consistent with a study conducted in Europe, which noted that soft drinks were not highly associated with erosion; nevertheless, it revealed a significant association between erosion and fruit juice and mentioned that this could be due to the low titratable acidity of soft drinks (Bartlett et al. 2013).
There are several strengths in this study. To our knowledge, this is the first study to examine the prevalence of erosion among US adults and its relationship with diet drinks via cluster analysis. Using cluster analysis to analyze the data accounted for the complexity of beverage consumption behavior, as an individual does not exclusively consume single beverages during one’s daily routine. Beverages should be considered in combination and studied as a whole as they may add or counteract one another’s effects on dentition and dental disease. Another strength is analyzing NHANES data, which allowed us to study a large representative sample of the US population. Combining the 2- to 24-h recall dietary assessments is a strength and is considered a reliable measure to use in nationwide data (Lee and Nieman 1996; Ahluwalia et al. 2016).
Our study has some limitations, as it is a cross-sectional study; hence, the reported relationships do not indicate causality. The dietary interview might not capture an individual’s total diet and is subject to recall bias. In an attempt to decrease this bias, interviewers asked about foods consumed the day before the interview, including the portion, the timing, and whether there was any food that the interviewee had forgotten to mention. This dietary interview is a reliable measure for group analysis (Lee and Nieman 1996; Ahluwalia et al. 2016). The data used in this analysis were from the 2003–2004 NHANES, which unfortunately was the only cycle to measure surface-level erosion. Future studies should explore the effects of other possible confounders, such as drinking technique (holding the drink in the mouth), drinking pattern (e.g., with or between meals), type of toothbrush, and type of toothpaste. Another limitation is that NHANES uses the modified TWI as its erosion measurement. As mentioned earlier, the measure could not clearly distinguish erosion from other tooth wear (Ganss and Lussi 2008).
Our study used data collected in 2003 and 2004; hence, the result would be incongruent with the current prevalence of erosion. Since 2004, substantive diet changes have occurred, with more people are becoming vegetarians, vegans, or fruitarians, and these highly acidic diets might contribute to an increased risk of dental erosion. In addition, well-designed longitudinal studies are recommended to confirm the relationship between diet drink consumption and dental erosion. While our results showed no effect of diet drinks on increased erosion, dentists should recommend consuming water and nonacidic beverages instead of diet drinks as a substitute for people who use sugary drinks, as there is a possibility for diet drinks to cause dental erosion. Diet drinks may have additional health consequences since they are also reported to be associated with systemic diseases: dementia, diabetes, vascular disease, metabolic disease, and stroke (Nettleton et al. 2009; Gardener et al. 2012; Suez et al. 2014; Pase et al. 2017). Hence, dentists should continue to educate patients about the potential harmful effects of the excessive consumption of diet drinks as well as sugared beverages.
Conclusion
High consumption of diet drinks seems to increase the odds of dental erosion among US adults, although this relationship was not statistically significant after adjusting for sociodemographic factors. Further research is needed to explore more about risk factors of erosion.
Author Contributions
M. Samman, contributed to conception, design, data analysis, and interpretation, drafted and critically revised the manuscript; E. Kaye, H. Cabral, T. Scott, W. Sohn, contributed to design, data analysis, and interpretation, critically revised the manuscript. All authors gave final approval and agree to be accountable for all aspects of the work.
Footnotes
Declaration of Conflicting Interests
The authors declared no potential conflicts of interest with respect to the research, authorship, and/or publication of this article.
Funding
The authors received no financial support for the research, authorship, and/or publication of this article.