
Abstract
Background/Objective:
Older adults are at higher risk of malnutrition. The aim of this study was to explore associations between nutritional status and dentition status among older adults seeking care in a dental clinic.
Methods:
This was a cross-sectional study of data from older adults (65–89 y) who received care at a northeastern US urban dental school clinic between June 2015 and June 2020 (
Results:
The sample was 53.8% female with a median age of 72.0 y. The median Self-MNA score was 13, reflective of normal nutritional status; 29.5% were at risk of or had malnutrition. Median numbers of teeth and posterior and anterior occluding pairs of teeth (POP, AOP) were 18.0, 2.0, and 5.0, respectively. Those with normal nutritional status had significantly more teeth, POPs, and AOPs than those at risk of or with malnutrition (
Conclusion:
This study demonstrated that older adults who had more teeth, better occlusion, and functional dentition were more likely to be of normal nutritional status than those who had less teeth, had poorer occlusion, and lacked functional dentition. Further research with larger, more diverse samples and varied measures of dentition are needed to better understand the associations between nutritional status and dentition status.
Knowledge Transfer Statement:
The findings from this study suggest that older adults with fewer teeth and therefore less efficient occlusion are at higher risk for malnutrition than those with more teeth and better occlusion. Health care professionals should include screening for dentition and malnutrition as part of their routine practice to identify patients who may have tooth loss and be at risk of malnutrition and refer them accordingly for interventions to optimize oral health and nutritional status.
Introduction
Older adults, aged 65 y and above, are at risk for poor oral health and tooth loss (Dye et al. 2019; Petersen et al. 2010). Approximately 30% of older adults globally are completely edentulous, with many more missing some of their natural teeth (Petersen et al. 2010). In the United States, the prevalence of edentulism is decreasing, with an estimated 17% of adults 65 y and older being completely edentulous (Dye et al. 2019). The mean number of remaining teeth among US older adults is 18.9, and 62% have functional dentition, defined as having 21 or more remaining natural teeth (Dye et al. 2019).
The number and distribution of teeth and occlusal patterns influence masticatory ability, which in turn can affect the ability to consume an adequate diet. Prior research has shown that older adults with tooth loss have significantly lower intake of raw fruits and vegetables, nuts, some sources of proteins, fiber, and certain micronutrients, as well as poorer diet quality, than those who are fully dentate (Papas et al. 1998; Sheiham and Steele 2001; Marshall et al. 2002; Sahyoun et al. 2003; Ervin and Dye 2009; Iwasaki et al. 2016; Yoshida et al. 2011; Zhu and Hollis 2014). The systematic review by Kiesswetter et al. (2018) found that independent of how oral function was evaluated, compromised oral function was significantly associated with negative changes in dietary intake and quality.
These negative changes in diet quality can increase the risk of malnutrition. Older adults are also at higher risk for malnutrition than younger adults (Kaiser et al. 2010). An estimated 46.2% of older adults are at risk for malnutrition, and an additional 22.8% are estimated to have malnutrition (Kaiser et al. 2010). The prevalence varies by setting and is higher in institutionalized older adults than in those living in the community (Kaiser et al. 2010).
The systematic review and meta-analysis by Zelig et al. (2020) found that individuals who were completely edentulous or who lacked functional dentition had a 21% increased likelihood of being at risk of or having malnutrition, as compared with those who were dentulous or had functionally adequate dentition. However, the results of individual studies are conflicting, possibly due to the heterogeneity in samples and measures of both dentition and nutritional status (Gil-Montoya et al. 2008; Kikutani et al. 2013; Lopez-Jornet et al. 2013; Krzyminska-Siemaszko et al. 2016; Saarela et al. 2016; Furuta et al. 2018; Zelig et al. 2018). Dye et al. (2019) and Petersen et al. (2010) identified disparities in dentition across race and socioeconomic status in older adults in the United States and globally. They found that tooth loss was more prevalent in those who were poor and Black, Indigenous, and People of Color (BIPOC) compared to those who were nonpoor and White (Petersen et al. 2010; Dye et al. 2019).
Dentition patterns in relation to nutrition status have been explored using a variety of approaches, including different definitions of functional dentition, posterior and anterior occluding pairs of teeth (POP and AOP), and numbers and categories of remaining teeth (Soini et al. 2005; Gil-Montoya et al. 2008; Starr 2008; Kikutani et al. 2013; Lopez-Jornet et al. 2013; Furuta et al. 2013; Krzyminska-Siemaszko et al. 2016; Saarela et al. 2016; Furuta et al. 2018; Zelig et al. 2018). Given the heterogeneity in this body of research exploring tooth loss measures in relation to nutritional status, the primary aims of this study were to explore associations between multiple measures of dentition status (number of remaining natural teeth, POP, AOP, and functional dentition) and nutritional status (assessed using the Self–Mini Nutritional Assessment [Self-MNA]) in a larger sample of older adults. We hypothesized that those who have fewer teeth, have fewer posterior or anterior occluding pairs of teeth, and lack functional dentition, when compared to those with more teeth, more posterior or anterior occluding pairs of teeth, and functional dentition, would be more likely to be at risk for or have malnutrition.
Methods
This was a cross-sectional study of data from adults aged 65 to 89 y who received care at a single northeastern, urban, dental school clinic from June 1, 2015, to June 1, 2020 (N = 305). Patient records were included if all Self-MNA and odontogram data were available. Measures of dentition status, including the number and location of remaining natural or restored teeth, number of POPs and AOPs, and the pattern(s) and location(s) of dentures, were manually mined from the electronic health record (EHR) (Axium; EXAN) by fourth-year dental students under supervision of a restorative dentist. The number of natural or restored teeth was analyzed continuously (0–28, excluding third molars), as were AOP (0–6) and POP (0–8). Functional dentition was categorized as either present (21 or more teeth) or absent (fewer than 21 teeth) (Dye et al. 2019) using the number of remaining natural or restored teeth. The types and patterns of dentures were described; however, data on use of dentures for eating were not available.
The Mini Nutritional Assessment (MNA) and Short Form (MNA-SF) are validated nutrition screening and assessment tools for use in older adults (Guigoz and Vellas 1997; Vellas et al. 1999; Kaiser et al. 2009). Huhmann et al. (2013) validated a self-administered version of the MNA, the Self-MNA. This 6-part questionnaire is completed by new patients and/or their caregivers when they register for care at the dental school clinic prior to their initial dental evaluation. The first 5 questions of the Self-MNA ask about oral intake, weight change, mobility, illness, and dementia/prolonged sadness. The sixth question allows the patient (or caregiver) to either report their left calf circumference or height and weight to calculate body mass index (BMI). For this study, the height and weight used were those recorded in the EHR by the dental clinic staff. Patients who scored 0 to 7 points were categorized as having malnutrition, 8 to 11 points as at risk of malnutrition, and 12 to 14 points as normal nutritional status. Self-MNA data points, including total and component scores, as well as demographic and clinical data (age, sex, race, ethnicity, and medical history), were provided in a report from the EHR.
This study was approved by the institutional review board (study ID:pro2020001622).
Statistical Analyses
Demographic and clinical data were described using descriptive statistics. Frequency distributions, mean, standard deviation (SD), and range along with median and interquartile range (IQR) for nonnormally distributed data were used. Normality of distribution determination was based on visual inspection of boxplots, Q-Q plots, and the results of Kolmogorov–Smirnov tests. Chi-square or Fisher’s exact tests were used to determine associations between Self-MNA nutritional status categories and functional dentition status. Kruskal–Wallis tests were used to determine the associations between Self-MNA nutritional status categories and numbers of remaining natural or restored teeth, POPs, and AOPs. If the overall Kruskal–Wallis test was significant, it was followed by post hoc pairwise comparisons adjusted for multiple comparisons using the Bonferroni method. Bivariate analyses (analyses of variance for continuous characteristics, χ2 analyses for categorical variables, and unadjusted binomial logistic regression [to obtain comparable effect estimates] for the primary independent variables) were conducted to identify potential confounding variables by examining the associations between demographic and clinical characteristics and nutritional status categories as the study outcomes. For statistically significant post hoc analyses, unadjusted odds ratios are reported.
Unadjusted and adjusted binomial logistic regression models (well nourished vs. at risk for malnutrition or with malnutrition) were constructed, and the strength of association was measured by odds ratios (ORs) and their corresponding 95% confidence intervals (CIs). Separate models were constructed for each of the primary independent variables: number of natural or restored teeth, presence of functional dentition, number of AOPs, and number of POPs. All models were adjusted for age, presence of diabetes (yes/no), and gastroesophageal reflux disease (GERD) or eating disorders (yes/no) as covariates in the models due to their clinically significant relevance to both the independent and dependent variables. Presence of Alzheimer disease or dementia (yes/no) was added as a covariate because of its statistically significant associations (as well as theoretical plausibility) with both the outcome and primary independent variables. Given the small number of participants who had malnutrition, those who were at risk for malnutrition or with malnutrition were combined for analysis and compared to the reference group of those who were of normal nutritional status (Vittinghoff et al. 2007). The purpose of the statistical adjustment was to minimize model error and thus obtain more accurate measures of the association between the primary independent variables and outcome variable. Statistical analyses were conducted using SPSS software (version 27; SPSS). All tests were 2-sided. P values <0.05 were considered statistically significant.
Results
Table 1 presents demographic and clinical characteristics, including dentition status variables, by nutritional status. The median age of this sample was 72.0 y (25th, 75th percentiles = 68, 77); 53.8% of the sample was female (n = 164). Of those who provided data on race (n = 123) and ethnicity (n = 144), the largest proportion of the sample reported themselves as White (n = 58, 47.2%) and as non-Hispanic/Latino (n = 118, 81.9%). No significant associations were found between demographic or clinical characteristics and Self-MNA nutritional status categories with the exception of the presence of Alzheimer disease or dementia, which was most common among those at risk for malnutrition (P = 0.018). Distributions of Self-MNA categories and component scores are listed in Table 2; the sample was primarily of normal nutritional status (n = 215, 70.5%) with a median Self-MNA total score of 13.0 (out of a maximum score of 14; 25th, 75th percentiles = 11, 14), indicative of normal nutritional status.
Selected Demographic and Clinical Characteristics of the Sample by Self-MNA Category.
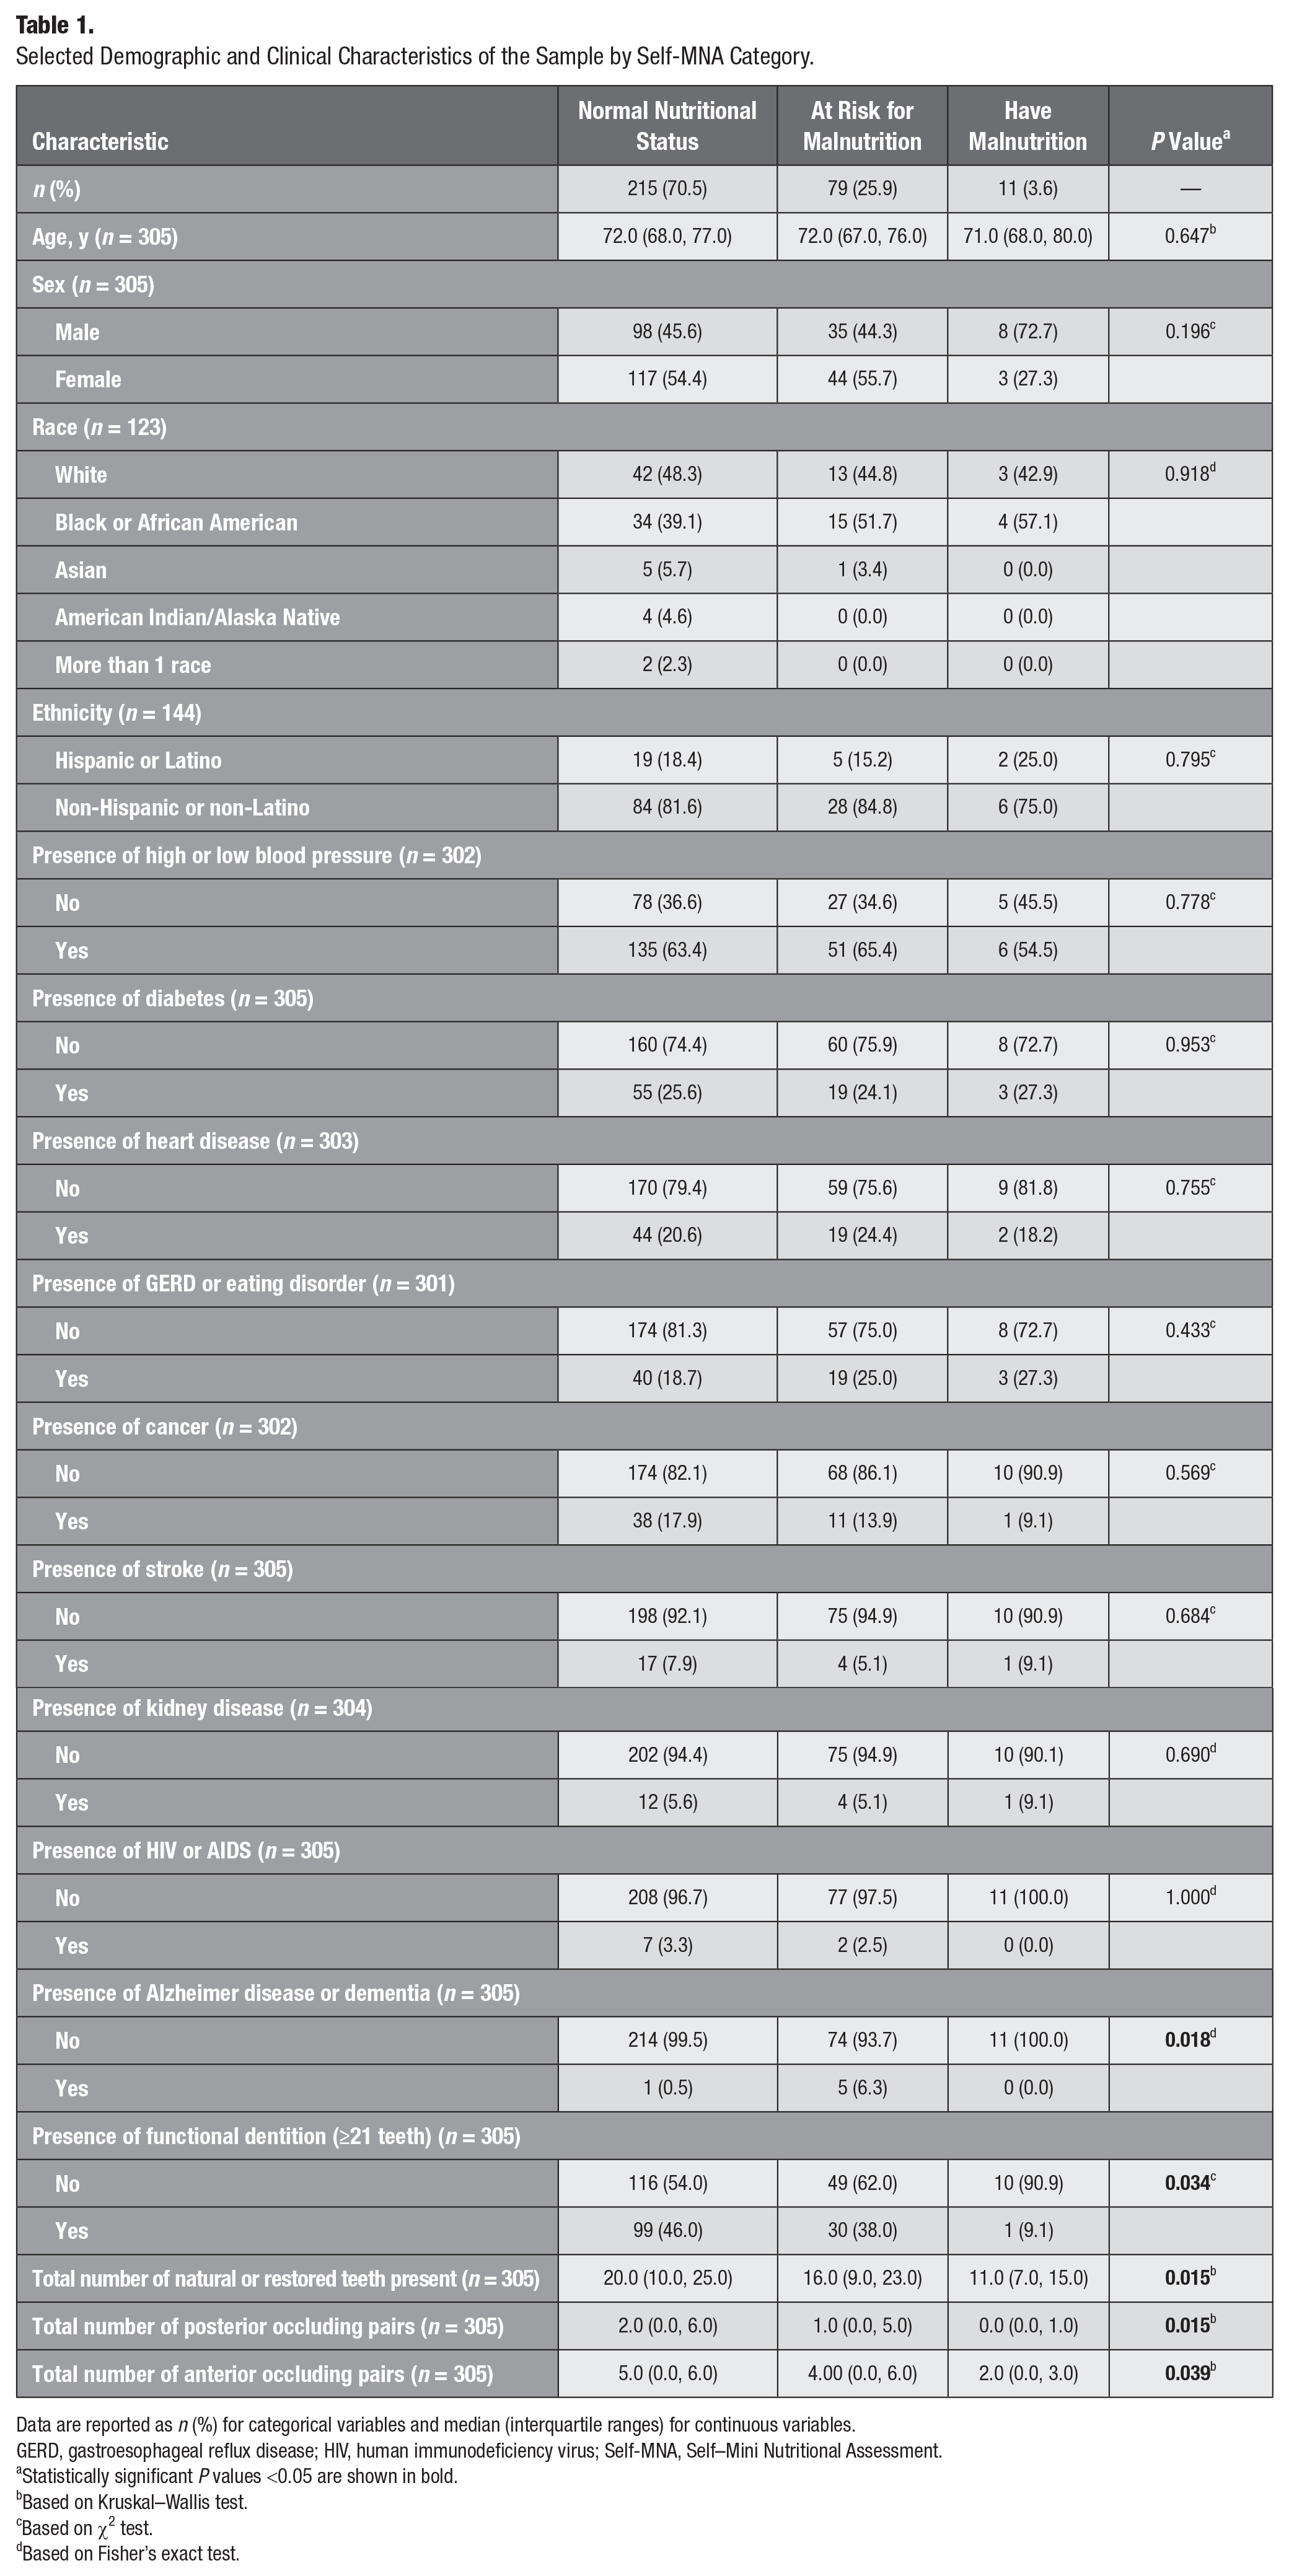
Data are reported as n (%) for categorical variables and median (interquartile ranges) for continuous variables.
GERD, gastroesophageal reflux disease; HIV, human immunodeficiency virus; Self-MNA, Self–Mini Nutritional Assessment.
Statistically significant P values <0.05 are shown in bold.
Based on Kruskal–Wallis test.
Based on χ2 test.
Based on Fisher’s exact test.
Self-MNA Characteristics of the Sample (N = 305).
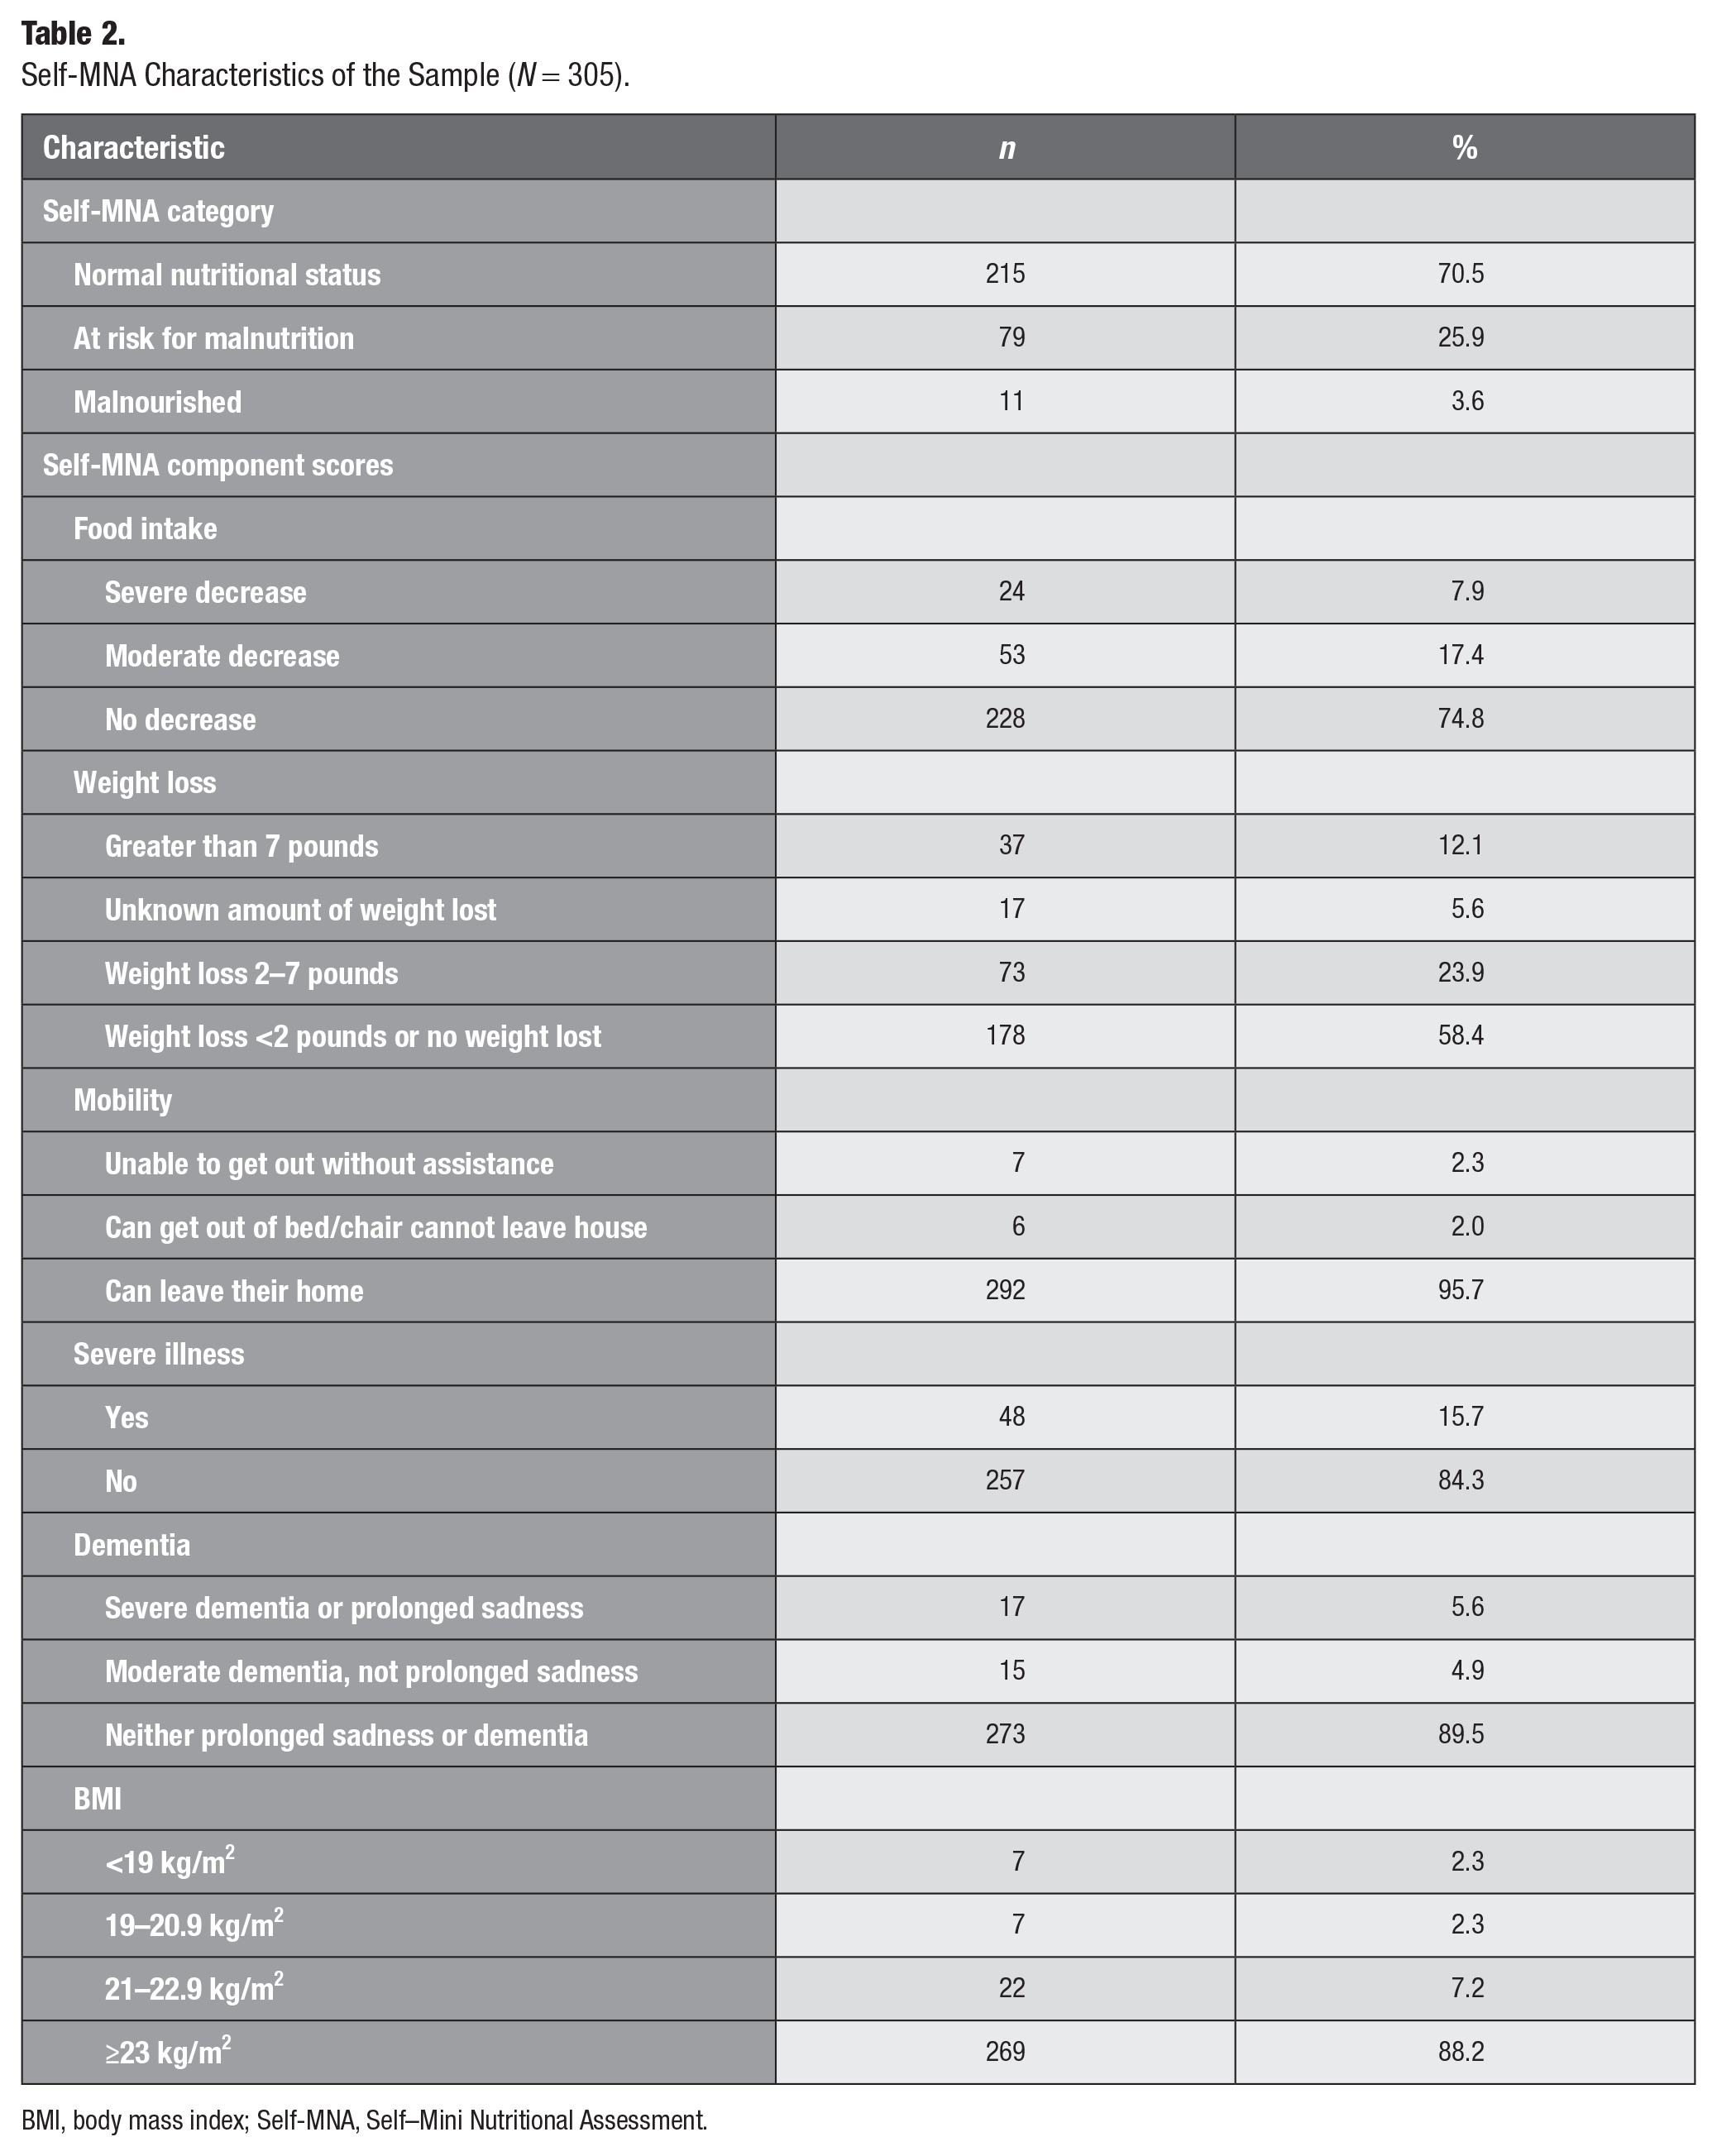
BMI, body mass index; Self-MNA, Self–Mini Nutritional Assessment.
Dentition data were not normally distributed. The median number of remaining teeth was 18 (25th, 75th percentiles = 10, 24) teeth. The majority had some tooth loss (n = 284, 93.1%); 7.9% were completely edentulous (n = 24), and 6.9% had no missing teeth (n = 21). The median numbers of POPs and AOPs were 2.0 (25th, 75th percentiles = 0, 5) and 5.0 (25th, 75th percentiles = 0, 6), respectively; 27.2% (n = 83) had dentures.
Number of Teeth and Functional Dentition
Those with normal nutritional status had a median of 20 natural or restored teeth remaining compared to those at risk of malnutrition or with malnutrition who had 16 and 11 teeth remaining, respectively (P = 0.015) (Appendix Figure 1). Those identified as having malnutrition had significantly fewer natural or restored teeth than those of normal nutritional status based on post hoc pairwise comparison (P = 0.026). For every additional unit increase in the number of remaining natural or restored teeth, the odds of malnutrition (compared to having normal nutritional status) decreased by 7% (OR, 0.93; 95% CI, 0.87, 0.99; P = 0.025) (Appendix Table 1).
Consistent with these findings, those without functional dentition (<21 teeth) were significantly more likely to be at risk of malnutrition or have malnutrition than those with functional dentition (P = 0.034). Having functional dentition was associated with an 88% lower odds of having malnutrition when compared to having normal nutritional status (OR, 0.12; 95% CI, 0.02, 0.93; P = 0.043) (Appendix Table 1).
Posterior and Anterior Opposing Pairs
The number of POPs was significantly different across Self-MNA nutritional status categories (P = 0.015); those with normal nutritional status had a median of 2 POPs, compared to those at risk of malnutrition or with malnutrition who had 1 and 0 POPs, respectively (Appendix Figure 2). Post hoc pairwise comparisons showed that those of normal nutritional status had significantly more POPs than those who had malnutrition (P = 0.025). For every additional number of POPs, the odds of having malnutrition (compared to having normal nutritional status) decreased by 40% (OR, 0.60; 95% CI, 0.38, 0.96; P = 0.032) (Appendix Table 1). Similarly, the number of AOPs was significantly different across Self-MNA nutritional status categories (P = 0.039); those with normal nutritional status had a median of 5 AOPs, compared to those at risk of malnutrition or with malnutrition who had 4 and 2 AOPs, respectively (Appendix Figure 2). While post hoc pairwise comparisons did not show statistically significant differences between groups (after Bonferroni adjustment), every additional unit increase in the number of AOP was associated with 23% lower odds of malnutrition (compared to having normal nutritional status) (OR, 0.77; 95% CI, 0.61, 0.98; P = 0.036) (Appendix Table 1).
There was no significant association between nutritional status category and the presence (P = 0.633) or type(s) and pattern(s) of dentures (P = 0.397).
Binomial Logistic Regression
The associations between dental variables and nutritional status categories were further explored using binomial logistic regression. Unadjusted and adjusted models are presented in Table 3. Normal nutritional status was considered the reference value. In the unadjusted models, only POP was significantly associated with nutritional status, where every additional POP was associated with a 9% lower odds of being at risk for malnutrition or with malnutrition (OR, 0.912; 95% CI, 0.832–1.000; P = 0.049) (Table 3).
Odds Ratios (95% Confidence Intervals) of Being at Risk for Malnutrition or Malnourished Compared to Normal Nutritional Status in Association with Different Measures of Dentition Status (N = 305).
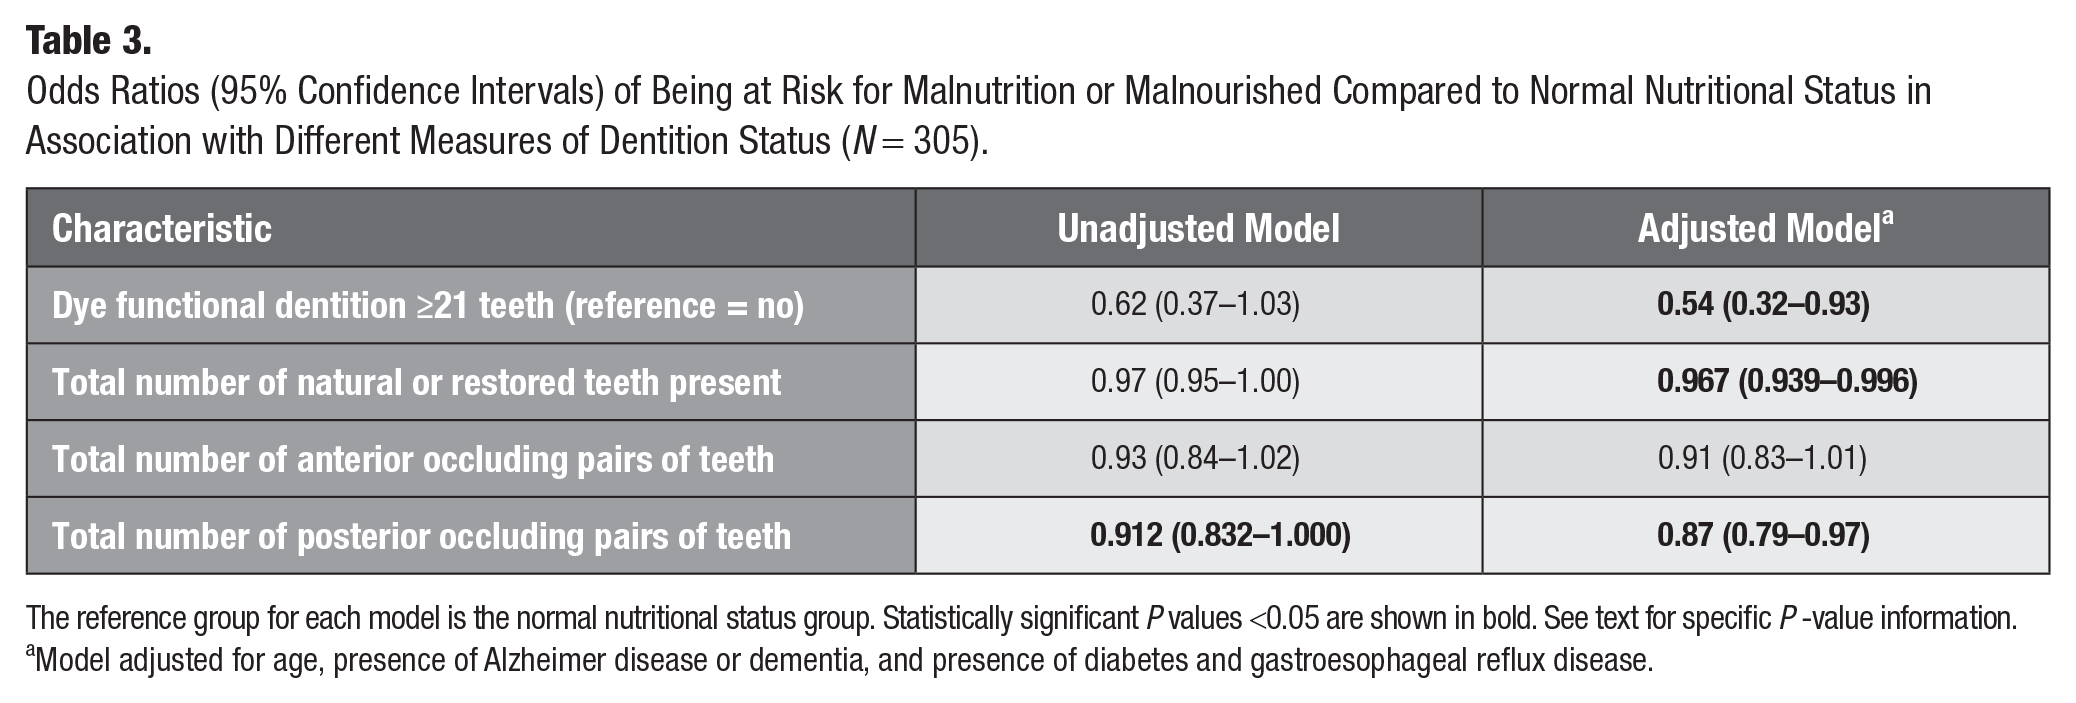
The reference group for each model is the normal nutritional status group. Statistically significant P values <0.05 are shown in bold. See text for specific P -value information.
Model adjusted for age, presence of Alzheimer disease or dementia, and presence of diabetes and gastroesophageal reflux disease.
In the adjusted model, after controlling for Alzheimer disease or dementia, which was the only covariate that was significantly associated with nutritional status, as well as predefined clinically relevant factors including age, presence of diabetes, GERD, and eating disorders, every additional unit increase in the number of natural or restored teeth was associated with 3% lower odds of being at risk for malnutrition or having malnutrition (OR, 0.967; 95% CI, 0.939, 0.996; P = 0.026) (Table 3). Similarly, every additional unit increase in the number of POPs was associated with 13% lower odds of being at risk for malnutrition or having malnutrition (OR, 0.87; 95% CI, 0.79, 0.97; P = 0.008) (Table 3). Having functional dentition (compared to lacking functional dentition) was also associated with 46% lower odds of being at risk for malnutrition or having malnutrition (OR, 0.54; 95% CI, 0.32, 0.93; P = 0.026) after adjusting for potential confounders (Table 3). Among all dental variables, only the number of AOPs was not associated with significantly lower odds of being at risk for malnutrition or having malnutrition in the adjusted models (OR, 0.91; 95% CI, 0.83, 1.01) (Table 3). These findings are largely consistent with the results of our nonparametric analyses.
An a priori power analysis was not completed as this was a retrospective analysis of all available complete data. A post hoc power analysis was completed using a χ2 test in G*power version 3.1.9.7 (Faul et al. 2007). Assuming an α level of 0.05, a medium effect size of 0.25 with 4 degrees of freedom, and an existing sample size of 305, this study had more than 80% statistical power to detect statistically significant associations between nutritional status and the number of remaining natural or restored teeth.
Discussion
The findings from this cross-sectional study revealed that older adults who had fewer natural or restored teeth, had fewer occluding pairs of natural or restored teeth, and lacked functional dentition, when compared with those with more natural or restored teeth, better occlusion, and functional dentition, were significantly more likely to be at risk for or have malnutrition. As such, all hypotheses were accepted.
Given the methodological challenges and gaps identified regarding studies of associations between oral and systemic diseases (Raittio and Farmer 2021) and nutritional status (Moynihan et al. 2009), along with the heterogeneity in studies exploring tooth loss measures in comparison to nutritional status (Soini et al. 2005; Gil-Montoya et al. 2008; Starr et al. 2008; Furuta et al. 2013; Kikutani et al. 2013; Lopez-Jornet et al. 2013; Krzyminska-Siemaszko et al. 2016; Saarela et al. 2016; Furuta et al. 2018; Zelig et al. 2018), this study took an exploratory approach considering different measures of dentition in comparison to nutritional status within a single sample of adults age 65 y and older who came for care to an Northeast urban dental school clinic.
Systematic reviews and meta-analyses have demonstrated that older adults with fewer teeth and poorer occlusion are more likely to be at risk for malnutrition or have malnutrition (Zelig et al. 2016; Toniazzo et al. 2018; Zelig et al. 2020). The findings from the current study are consistent with those from the systematic reviews and meta-analyses evidencing the significant associations between these variables of interest (Zelig et al. 2016; Toniazzo et al. 2018; Zelig et al. 2020).
The findings reported on herein, that those with normal nutritional status had significantly more occluding teeth than those who were at risk for malnutrition or with malnutrition, are consistent with findings from Adiatman et al. (2013), who found that women 60 y or older with normal nutritional status as determined by MNA score had significantly more natural-on-natural occluding pairs of teeth, regardless of position, than those at risk for or with malnutrition. While the associations between nutritional status and functional dentition have not been studied in depth, Kikutani et al. (2013) found that individuals with functionally inadequate occlusion had a 3.19-fold greater malnutrition risk than those with natural dentition with adequate function (P < 0.004).
The nonnormal distribution in nutrition status in our sample merits consideration as 70.5% were of normal nutritional status using the Self-MNA tool. Three quarters (74.8%) of the sample reported no decrease in food intake over the prior 3 mo, 58.4% reported less than 2 pounds of weight loss or no weight loss in the prior 3 mo, 95.7% were able to leave their homes, 84.3% reported no severe illness in the 3 mo prior, 89.5% reported having neither prolonged sadness nor dementia, and 75.8% had a BMI indicative of being overweight or obese.
The use of a validated screening tool, a large sample size with adequate power, and sound methodologies for data collection and analyses are strengths of this investigation. Dentition status was assessed and analyzed by the number of remaining natural or restored teeth, posterior and anterior occluding pairs of teeth, and functional dentition status to help better understand the associations between dentition and nutritional status. Occluding pairs and number of remaining natural or restored teeth were manually extracted from the EHR by fourth-year dental students in collaboration with a restorative dentist by review of radiography and odontogram data.
However, despite the strengths in study design, analyses, and power, there were limitations. The cross-sectional nature of this study limits the ability to infer causality. As a retrospective design, all records with missing data had to be excluded. While the Self-MNA has been validated, the data are self-reported or reported by caregivers, which introduces bias. Patients or caregivers may have been more likely to respond with answers they interpreted as more favorable. This study was also unable to assess the use and functionality of dentures in the study sample. While research supports that replacement of missing teeth with dentures may improve nutritional status (McKenna et al. 2015; Wallace et al. 2018), dentures do not provide the same functional ability as natural teeth (Kiesswetter et al. 2018), and studies suggest that those with removable dentures are at greater risk of malnutrition than those with natural dentition (Cousson et al. 2012).
Implications and Future Directions
Early identification of nutritional risk by dental and other health care professionals provides an opportunity for referral to a registered dietitian or primary care provider for appropriate intervention. The Self-MNA proves to be a feasible tool to use for nutrition screening in a dental clinic setting. It is validated and easy to use for assessment of nutritional status of community-dwelling older adults. As part of the oral examination, oral health professionals can assess for factors that may affect a patient’s ability to adequately consume foods and fluids, as well as intervene accordingly to optimize both oral health and nutritional status.
These findings underscore the associations between various measures of dentition status and nutritional status and the importance of an oral exam as part of the physical examination completed by other health professionals, including registered dietitians and physicians. This exam allows for another opportunity to identify patients at nutritional risk and to provide more specific interventions and referrals to optimize oral health and dentition status. Health professionals, including those in dentistry, nutrition, nursing, and medicine, should consider assessing tooth loss when assessing nutrition status and consider evaluating nutrition status when evaluating tooth loss.
Given the heterogeneity identified, further research in larger, more diverse samples is needed to better understand the associations between dentition status and nutritional status. Future studies should also aim to analyze denture type(s), use, and functionality in order to better portray dentition status and improve our understanding of the associations between dentition and nutritional status.
Conclusions
In this sample of older adults who received care at an urban Northeast US dental school clinic, 30% were at risk for or had malnutrition. Those who were missing more teeth, had fewer occluding pairs of natural or restored teeth, and lacked functional dentition were more likely to be at risk for malnutrition or have malnutrition than those with more natural or restored teeth, more occluding pairs of natural or restored teeth, and functional dentition, who were more likely to have normal nutritional status. Further research in this area, specifically analyses between nutrition status and occlusal patterns that include denture use and function, is needed to promote further understanding of associations between dentition and nutritional status.
Author Contributions
S. Honeywell, contributed to conception, design, data acquisition, analysis, and interpretation, drafted and critically revised the manuscript; H. Samavat, R. Touger-Decker, E. Hoskin, R. Zelig, contributed to conception, design, data acquisition, analysis, or interpretation, critically revised the manuscript; J.S. Parrott, contributed to data acquisition, analysis, or interpretation, critically revised the manuscript. All authors gave final approval and agree to be accountable for all aspects of the work.
Supplemental Material
sj-docx-1-jct-10.1177_23800844211063859 – Supplemental material for Associations between Dentition Status and Nutritional Status in Community-Dwelling Older Adults
Supplemental material, sj-docx-1-jct-10.1177_23800844211063859 for Associations between Dentition Status and Nutritional Status in Community-Dwelling Older Adults by S. Honeywell, H. Samavat, R. Touger-Decker, J.S. Parrott, E. Hoskin and R. Zelig in JDR Clinical & Translational Research
Footnotes
Acknowledgements
We thank the Rutgers School of Dental Medicine and their information technology team for their assistance and support of this research, as well as Tannaz Malekian and Joanna Kostin, fourth-year dental students at the Rutgers School of Dental Medicine, for their assistance in data collection for this research.
A supplemental appendix to this article is available online.
Declaration of Conflicting Interests
The authors declared no potential conflicts of interest with respect to the research, authorship, and/or publication of this article.
Funding
The authors received no financial support for the research, authorship, and/or publication of this article.
References
Supplementary Material
Please find the following supplemental material available below.
For Open Access articles published under a Creative Commons License, all supplemental material carries the same license as the article it is associated with.
For non-Open Access articles published, all supplemental material carries a non-exclusive license, and permission requests for re-use of supplemental material or any part of supplemental material shall be sent directly to the copyright owner as specified in the copyright notice associated with the article.