
Abstract
Highlights
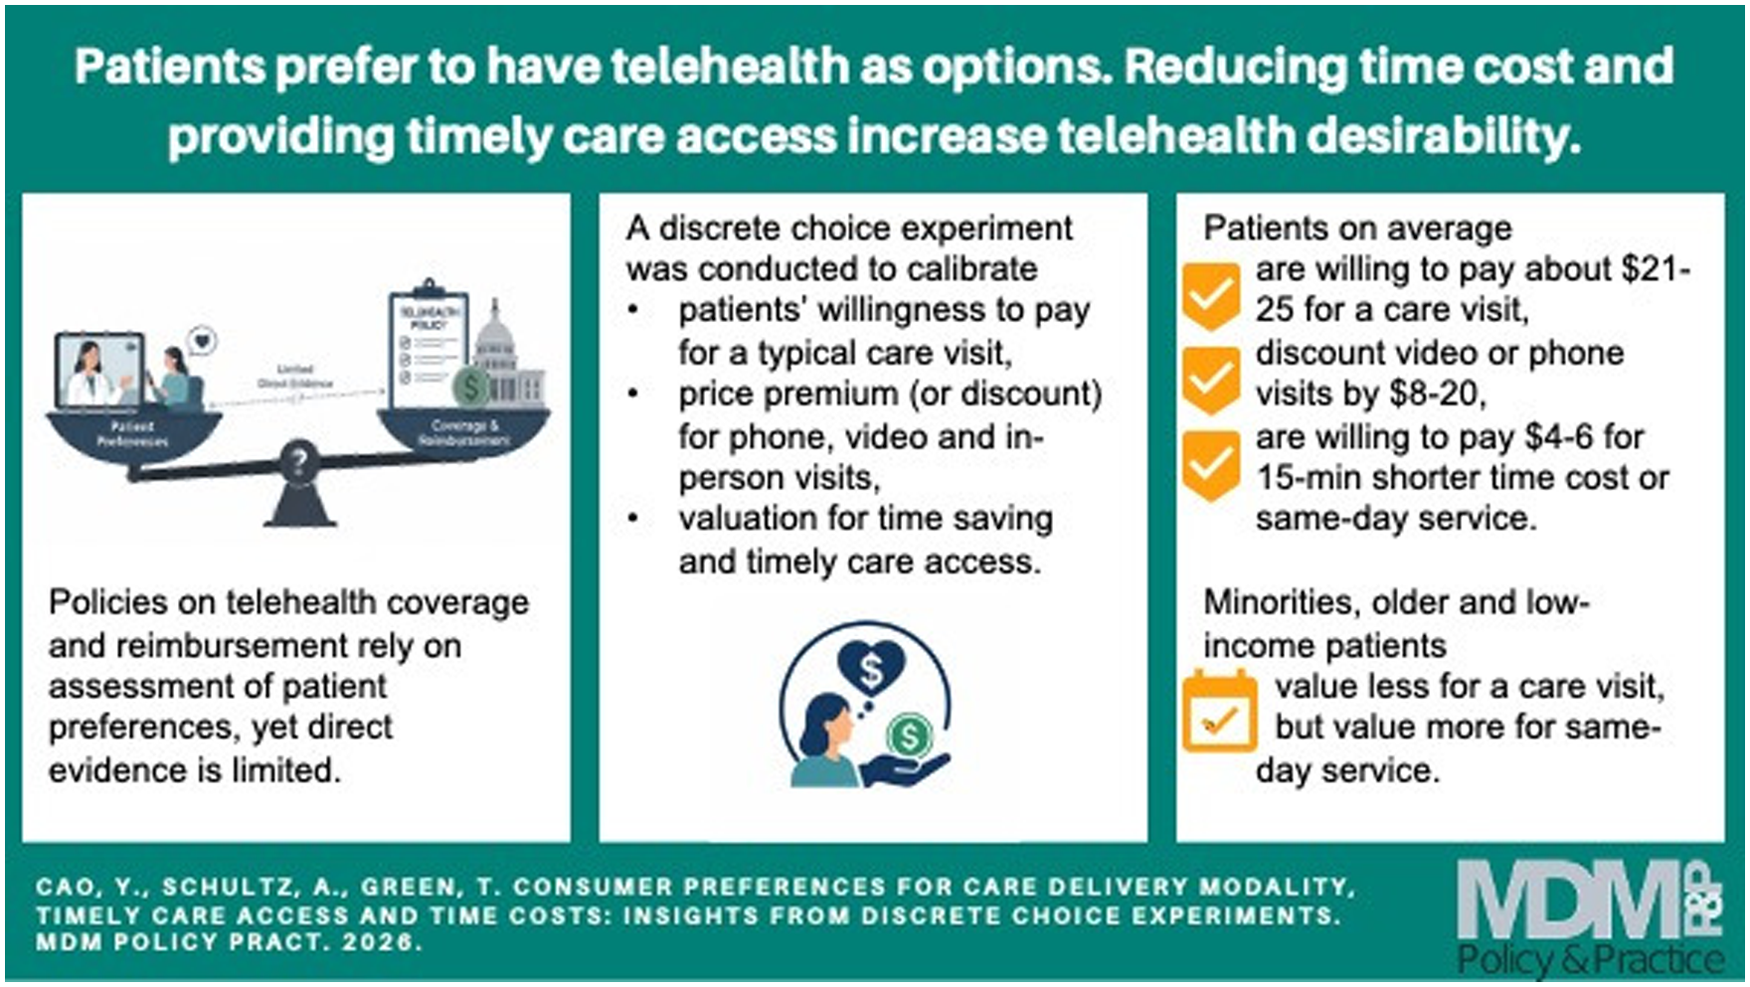
Patients are willing to pay about $23 for a typical primary care visit on prevention and maintenance.
Patients discount video or phone visits by $8 to $20 but prefer to have such options for flexibility and timely access.
Patients are willing to pay $4 to $6 for shorter time cost obtaining care or same-day timely access to care.
Non-White minorities and older and low-income patients have lower valuation for a care visit but a higher price premium for same-day visits than the general population, suggesting high potential of telehealth to help avoid missed or delayed care for these subpopulations.
Telehealth has rapidly expanded within the past few years.1–3 Public programs and private insurers are consistently looking to update the rules and regulations regarding telehealth coverage and payment to keep up with the changing needs in health care delivery.4–7 State laws and insurers across regions also vary in restrictions of telehealth payment parity, covered services, and delivery modalities.8–12 Health care systems and providers follow these policy and regulation changes to adjust care delivery and invest in infrastructure to support long-term needs. While directly observable data from the field such as electronic health records and claims data are good to provide information on telehealth utilization, penetration, costs, and some clinical outcomes,13–17 these data have limited capacity to provide insights on patient preferences for telehealth and their valuations toward the additional attributes that this new care delivery mode could offer.18–20 Patient preferences and valuations are very important to support major telehealth policy decision making and equitable health care access.21,22
Many studies to date have tried to capture patient and provider perspectives on telehealth using surveys, interviews, or narrative or systematic reviews.18–20,23 These studies covered a wide range of patient-centered measures across different domains of health care quality,20,24 for example, measures on care operation such as waiting time until appointment,25,26 waiting time in the clinic,27–30 travel time,31,32 provider specialty/care settings,30,33–36 and price or cost sharing 35 ; measures on care delivery processes such as shared decision making,37–39 physician knowledge or access to patients’ history,30,40 information exchange or treatment explanation,36,41 and length of visit or communication; measures on care service outcomes such as lab or medication ordered, illness cured, (best) treatment selected, or anxiety relieved25,31,32; and measures on patient perceptions such as concerns of a care encounter, patient–provider sex or racial concordance, bonding, and trust and satisfaction.24,26
While these measures are all attributes that could jointly characterize a health care service, there exist some challenges in quantifying how these attributes shape patient preferences and decision-making.42,43 For example, an individual may prioritize only a subset of these attributes when making choices of health care services; when the desirable levels of the considered attributes do not happen within 1 care service option, the individual will need to make tradeoffs; some attributes may interact and work better or worse with other attributes; and the measurements and levels of attributes cannot be self-reported but rather need to be consistent across people to yield a reliable estimate of population preference, to just name a few.
Discrete choice experiment (DCE) is a stated preferences method that can overcome these methodological challenges to elicit patient preferences for health care services. DCE is supported by Lancaster’s theory, 44 which suggests that the utility of goods or services is determined by different attributes that jointly characterize the good or service. Each attribute has its predefined levels or specifications. In a DCE, a good or service alternative is described based on changing combinations of attribute levels, and participants are asked to choose their favorite alternative out of 2 to 4 different alternatives.44,45 The repeated choices over sets of different alternatives can then be analyzed to calculate the relative importance of the attributes and the value that people ascribe to each attribute or attribute level. It is assumed that respondents consider all information provided and then select the alternative that provides the highest utility to them. Changes in the attribute levels can alter the preferred choice alternative of participants, which reveals their (underlying) preferences and valuations of these attributes and levels. 24
There are a few studies that used DCEs or other stated preferences methods to elicit individual preferences on telehealth. Among these studies, Predmore et al. 42 used contingent valuation methods to reveal the differences in patients’ valuation of in-person and video visits against each other. By offering an additional care delivery mode different from a respondent’s initial choice at a lower cost ($10 v. $30), this study found that people generally prefer to use in-person and video visits equally, but those who prefer video visits are more sensitive to out-of-pocket costs. Savira et al. 43 used DCEs to elicit people’s preferences on telehealth and introduced in nonprice attributes such as familiarity with the physician, physician accessibility to medical history, and waiting time. This study implicitly assumed that time to obtain care matters for only in-person visits via travel and video visits come with a risk of distortion. With these assumptions, the results suggested that people discount video visits and in-person visits in a farther location relative to the most ideal case, and the nonprice attributes could add value to mitigate these discounts.
Building on the existing studies in the field, this study aims to make a few additional contributions. First, this study uses DCEs with less restrictive assumptions 43 to elicit patient preferences on alternative care delivery modalities including in-person, phone (audio-only), and video visits.13,14,46 Second, the study isolates patients’ valuation of a care visit relative to no care (i.e., missed or delayed care in reality) regardless of care delivery modality to show a general reference benchmark. 42 Third, the study estimates patients’ marginal willingness to pay (mWTP) for each of the 3 care delivery modalities independently as a price premium or discount on top of the average valuation of a care visit in general.42,43 Fourth, the study estimates patients’ mWTP for the nonprice attributes, such as time cost and timeliness of care access, to show the tradeoffs they are making when selecting a health care service.24,47 These measures show the potential that telehealth can help improve care delivery and care quality. Findings from the study jointly support critical decision making on telehealth policy and regulation changes with the ultimate goals to improve care quality and equitable health care use and access.21,22
Methods
Study Design
DCEs were designed to elicit patient preferences on a typical primary care visits in outpatient settings focusing on 1 price attribute and 3 most considered nonprice attributes. The price represented patient cost sharing or co-payment: $50, $25, or $ 0. Three nonprice attributes were 1) care delivery modality (in-person, phone [audio only], or video [audio + video]) visits; 2) time cost to obtain care, which included time used for travel to the clinic, device setting up, waiting in the clinic/virtual waiting room, and so forth (45, 30, or 15 min); and 3) timeliness of care access, that is, wait until a care visit (wait for 7 d, 3 d, or on the same day) (Appendix Table 1). The selection of attributes and levels was based on the existing literature, using the most prioritized attributes when people were making decisions on care services, as well as using the appropriate intervals of levels to allow adequate variation and avoid anchoring effects.24,42,43
By the study design of care visits with 4 attributes and 3 levels for each attribute, it yielded a total of 81 (=34) possible choice alternatives, each representing a unique care visit jointly characterized by the 4 attributes. A partial factorial design randomly selected 18 choice alternatives after excluding dominated alternatives (e.g., a care visit of any given delivery modality with higher time costs and longer waiting time but at a higher price). These alternatives were then randomly sorted into 9 blocks of 2 (alternatives). A choice task in the DCE was to choose the most favorable care visit out of a block of 2 choice alternatives and 1 opt-out option (i.e., no care visit) (Appendix Figure 1). Having an opt-out option allowed a respondent to have flexibility of not choosing any given choice alternatives when needed. 48 In the study, a respondent was asked to make (up to) 9 choice tasks. 49 The SAS 9.3 macro %Mktex program was used to generate the choice blocks. 50 This design had a D-efficiency score of 75% which passed the threshold needed for reliable preference identification. 51
Study Sample and Respondents
Respondents in this study were recruited from the Survey of the Health of Wisconsin (SHOW) cohorts in the 2022 longitudinal follow-up (WAVE V) as an ancillary study. 52 The SHOW program began in 2008 and uses an address-based area probability sampling without replacement (PPSWOR) to recruit statewide representative samples (N = 5,742 adults and 980 minors). The SHOW is modeled after the National Health and Nutrition Examination Survey (NHANES) and has conducted a series of cross-sectional and longitudinal surveys on individual health status and social determinants of health. Its cohorts include WAVE I, 5 annual samples from 2008 to 2012 (N = 3,380 adults); WAVE II, 1 triannual sample from 2014 to 2016 (N = 1,957 adults and 645 minors); and WAVE IV, focused underrepresented population in Milwaukee, Wisconsin, from 2018 to 2019 (N = 413 adults and 101 minors). In addition, longitudinal follow-ups were conducted in 2017 (N = 725 from WAVE I, referred to as WAVE III) and 2022 (N = 354 from WAVE II and IV, referred to as WAVE V).53,54
A total of n = 110 respondents out of all 354 who were followed up by the SHOW chose to participate in the Telehealth Preference ancillary study and responded to at least 1 DCE choice task question in the survey. Ninety respondents completed all 9 DEC choice tasks. The original data for the SHOW follow-up were collected in 2022 to 2023. Data extraction, cleaning, and merging were conducted in 2023. Data analysis was conducted in 2024 to 2025. The study was reviewed and approved by the Institutional Review Board of the University of Wisconsin-Madison.
Analytical Approach
The mixed logistic choice models, also referred to as mixed logit models, were used to predict individuals’ choices in the study. The mixed logic model is most frequently used to model the probability that an individual chooses one from a finite set of several unordered alternatives. It is also known as the mixed multinomial logistic model 55 and the random-parameters logistic model. 56 The mixed logit model is an extension of McFadden’s choice model using conditional logistic regression. The conditional logistic model carries the most straightforward formulation in the choice setting and treats the coefficients on alternative-specific variables that predict individuals’ choices as fixed terms. However, conditional logistic model requires Independence of Irrelevant Alternatives (IIA) assumptions. 57 The IIA assumption states that the relative probability of selecting 1 alternative should not change with the introduction or elimination of another alternative. The mixed logistic model, instead, allows random coefficients on 1 or more of the alternative-specific predictors. This means that the coefficients on these variables are allowed to vary across individuals through random terms, and the model accounts for correlation across alternatives and thereby relaxes the IIA assumption.
The predictors of mixed logistic models included 1 price variable, 3 sets of indicator variables for the 3 nonprice attributes (care delivery modality, time cost, and timeliness of care access), and 1 alternative-specific constant (ASC). The price (or patient cost sharing) was treated as a numeric variable. The nonprice attribute levels used effect coding within each attribute category.58,59 In effect coding, (K-1) indicator variables are needed for K levels of the attribute, leaving 1 (level) as the default. The indicator variable of a nondefault level is coded as 1 for the that level, 0 for other nondefault levels, and −1 for the default level. In the study, phone visit, 45-min time cost and wait for 7 d (to be seen by a physician) were chosen as the default levels. The indicator variable for video visit, for example, was assigned 1 if a (care service) alternative is delivered by video, 0 if in-person visit, and −1 if phone visit. Effect coding allowed separate estimation of the coefficient for each attribute level as the deviation from the sample mean, independent from the selection of default levels. ASC in the model captured the sample mean, representing an overall utility or valuation of a care visit relative to no care service (i.e., opt-out option) regardless of care delivery modality.
To interpret the model-estimated results, the average WTP for a care visit and mWTP for each nonprice attribute level were calculated. mWTP for a non–default-level attribute (or WTP for a care visit) was defined as the negative ratio of the estimated coefficient of the attribute-level indicator variable (or ASC) to the estimated coefficient of the price variable. The mWTP for the default level attribute (e.g., phone visit, 45-min time cost, or 7-d wait) was defined as the (positive) ratio of the sum of the estimated coefficients of all non–default-level indicator variables within the same attribute category to the estimated coefficient of the price variable. In general, the estimated coefficient for the price variable is negative, consistent with the law of demand indicating that an alternative with higher price is less likely to be chosen holding all other attributes equal. A positive estimated WTP/mWTP indicates a price premium for a desirable attribute or attribute level, whereas a negative estimated mWTP indicates a price discount for a certain attribute or level.
In addition, the analyses of model prediction and WTP/mWTP estimation were conducted separately by patient subgroups to reveal the variation in patient preferences across subgroups. These subgroups included sex (male v. female), race/ethnicity (White v. non-White), age (64 y or younger v. 65 y or older), internet access at home (yes v. no), home ownership (owner v. renter), and health insurance type (commercial, Medicare, or Medicaid/uninsured).
Sensitivity analyses were performed by excluding participants who did not respond to all 9 choice tasks; testing of IIA assumption by omitting 1 alternative, attribute, or attribute level at a time; using dummy coding instead of effect coding; and using a conditional logit model or mixed logit model without correlation or robustness options. All analyses were performed using STATA 17.0.
Results
Completion Rate and Respondent Demographics
A total of 354 former SHOW participants were invited to do the health care preferences survey. A total of 110 (31.07% = 110/354) respondents participated to respond to at least 1 out of 9 choice tasks. On average, each respondent completed 8.25 choice tasks. Ninety of 110 respondents completed all 9 choice tasks.
For the study sample of 110 survey participants, the average age was 58.6 y old with 63 respondents (56.3%) being 64 y or younger; 73 (66.4%) females; 51 (46.4%) White, 55 (50.0%) Black, and 4 (3.7%) others. Average years of education was 15.1 y, with 29.1% of the sample having an educational level at high school or below and 33.7% having a bachelor or higher degree. Of the respondents, 48.2% were married or living with a partner, 25.4% were single or never married, and 26.4% were widowed, divorced, or separated. Eighteen respondents (16.4%) indicated they had no Internet at home, and 44 (40.0%) were living in a rental property. Forty-one (37.3%) of the participants were covered by commercial insurance plans, 23 (20.2%) were Medicare beneficiaries, 39 (35.5%) were Medicaid enrollees, and 7 (6.4%) had no insurance or unknown status (Table 1).
Summary Statistics
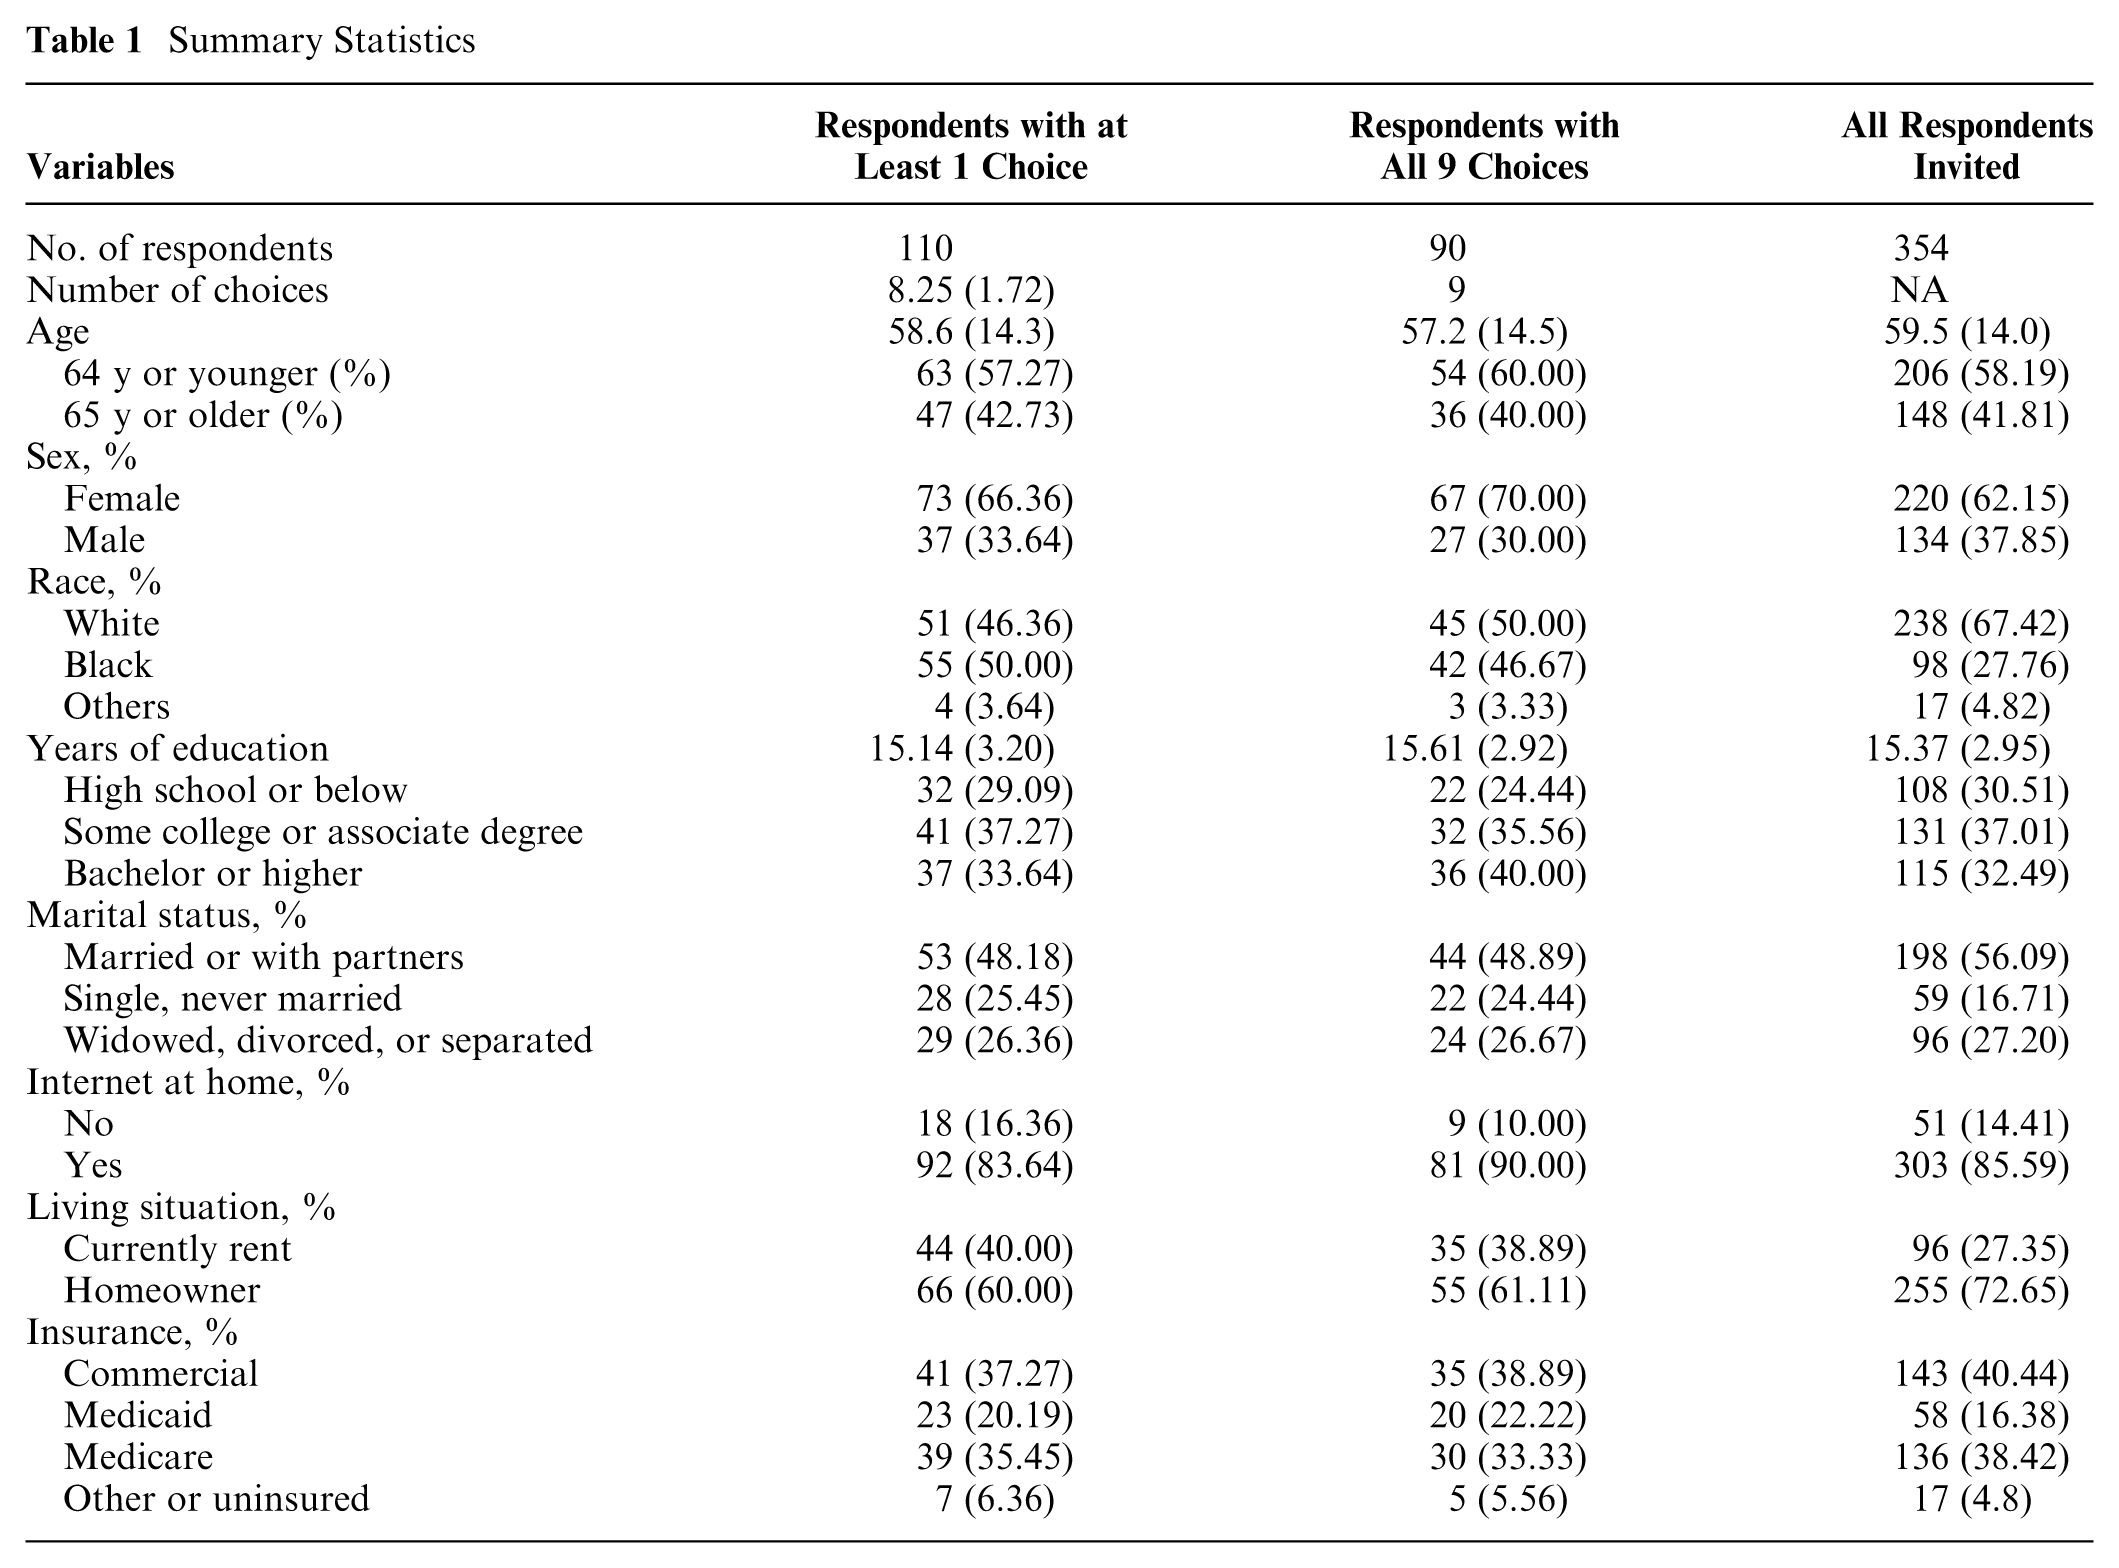
Compared with the overall sample of 345 SHOW participants who were invited for the survey, those who were male, White, married, or living with partners were less likely to participate in the health care preference survey than their counterparts. Those who were female, Black, single or never married, had no Internet at home, were living in a rental property, or were covered by Medicaid insurance programs were more likely to participate. Conditional on participation, those who were female, White, or had a bachelor’s or higher degree were more likely to complete all 9 choice tasks, while those who were Black, had lower than a high school educational level, or had no Internet at home were less likely to complete all 9 choice tasks (Table 1).
WTP for Care Delivery Mode and mWTP for Time Costs and Timely Care Access
On average, participants were willing to pay $23.2 (95% CI 13.3, 37.9) for a care visit regardless of delivery modality, which was significantly different from no care visit (i.e., opt-out option). The predicted likelihood of a care visit option being chosen had a significantly negative coefficient on care price (or cost sharing) (−0.07 [SE 0.01]), suggesting that higher cost sharing reduced the likelihood of a participant choosing any care visit option. Participants significantly differentiated care delivery modalities and were willing to pay up to $53.5 (=23.2 + 30.3) for an in-person visit with a price premium of $30.3 (95% CI 21.1, 44.0). They were willing to pay $14.5 (=23.2 + [−8.7]) for a video visit with a price discount of $8.7 (−10.7, −5.7) and were willing to pay only $1.6 (=23.2 − [−8.7] − 30.3) for a phone (audio-only) visit with a price discount of $21.6 (=− [−8.7] − 30.3) (Table 2).
Patient Preferences on Care Delivery Attributes and Marginal Willingness to Pay
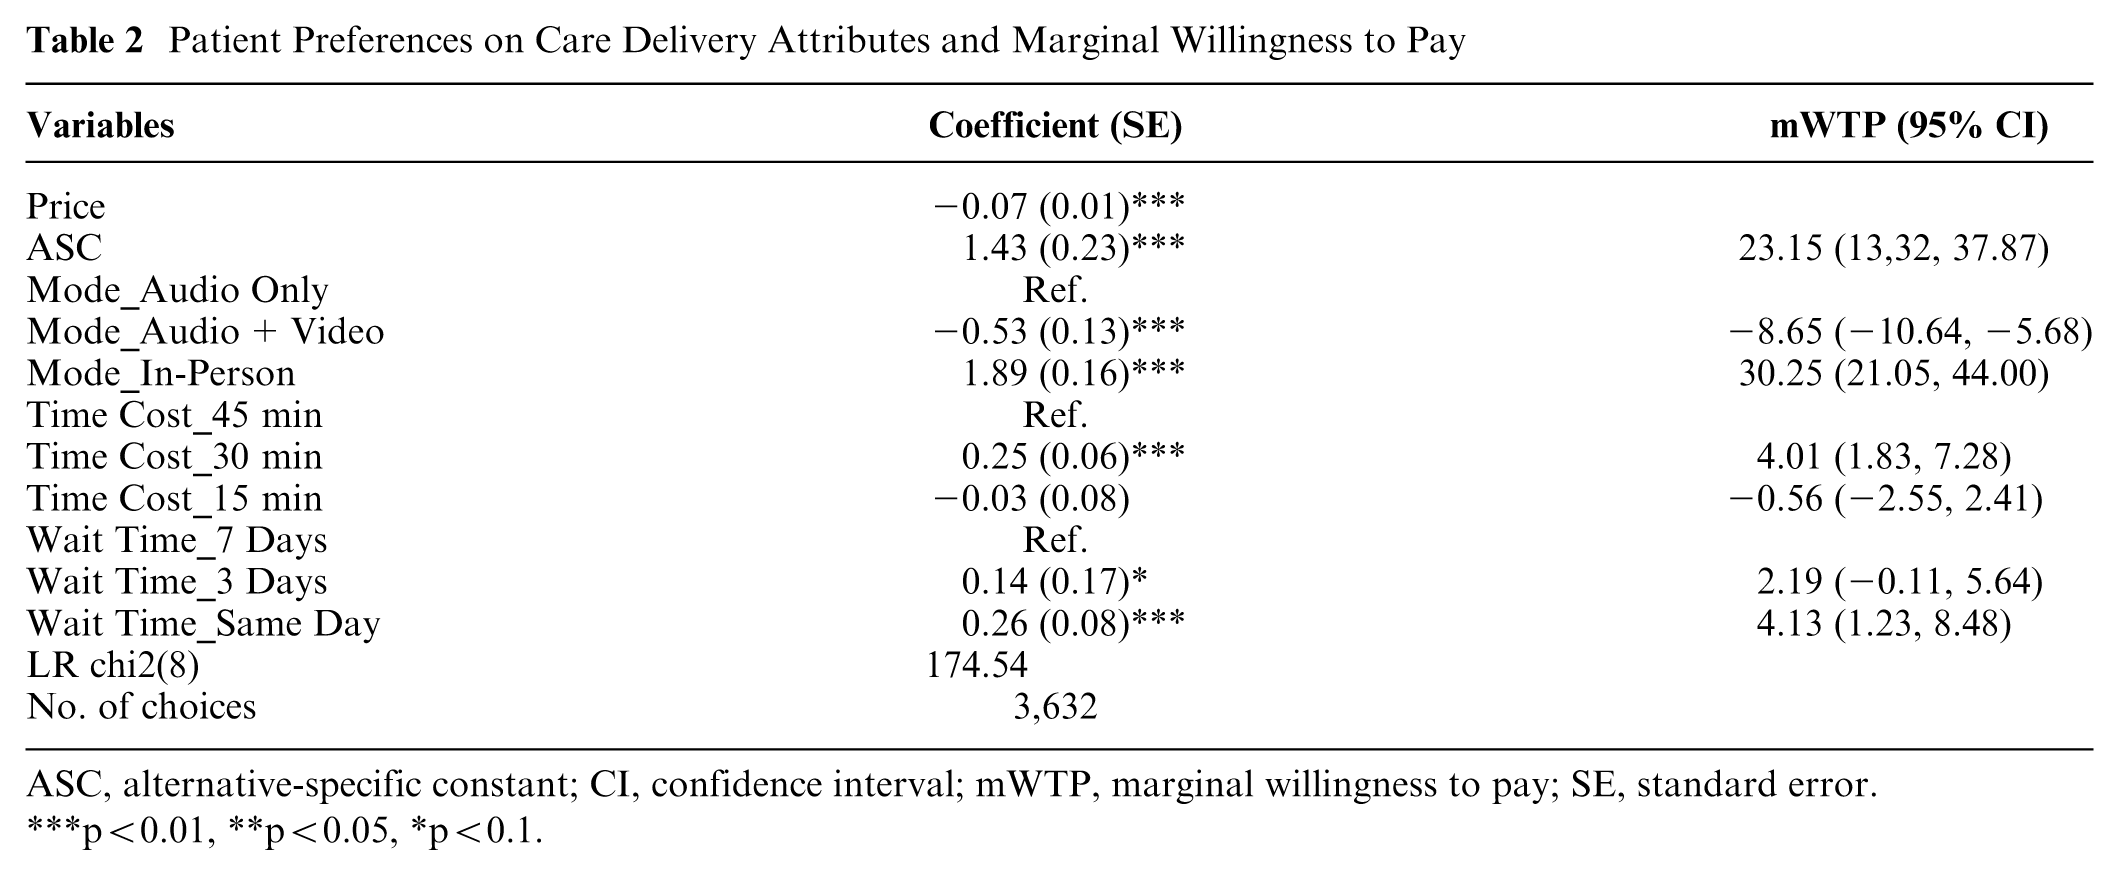
ASC, alternative-specific constant; CI, confidence interval; mWTP, marginal willingness to pay; SE, standard error. ***p<0.01, **p<0.05, *p<0.1.
The mWTP to reduce the time (cost) obtaining care from the default level 45 min to 30 min was $4.0 (1.8, 7.3), which was significantly different from 0 at the 99% significance level. However, reducing the time obtaining care from 45 min to 15 min did not significantly increase the WTP, suggesting that patients were willing to spend at least 30 min to conduct a care visit. Reducing the number of days waiting to be seen by a doctor from 7 d to 3 d increased the WTP for a care visit by $2.2 (−0.11, 5.64), but this mWTP was only marginally significant at the 90% significance level. Removing the waiting time overall by offering a same-day visit significantly increased the WTP by $4.1 (1.23, 8.48) at the 99% significance level (Table 2).
Differences in WTP for Care Delivery Mode by Patient Subgroup
The WTP for in-person visits varied with different driving factors across patient subgroups. The WTP for in-person visits was significantly higher (than the general average) among White patients or commercial insurance beneficiaries ($58–$60 v. $53.4), moderately lower among Medicare enrollees or those who were 65 y or older ($48–$49), and significantly lower among those patients who were non-White (Black or others, $42), currently renting ($46), had Medicaid or no health insurance ($43), or had no Internet at home ($24). Driving factors for these variations were different across subgroups. For White patients or commercial insurance beneficiaries, the higher WTP was driven by the higher valuation of a care visit overall (i.e., the ASC term, $29 v. $23.2) rather than a price premium for the in-person mode. Medicare enrollees or those who were 65 y or older, in comparison, had lower-than-average valuation of a care visit ($15–$16 v. $23.2) but a higher price premium (mWTP) for the in-person delivery mode than the general population ($33.4 v. $30). Non-White patients or renters had significantly lower valuation of a care visit overall ($11–$13 v. 23.2) but comparable price premiums for the in-person mode ($31–$32 v. $30). Medicaid enrollees and the noninsured had both lower valuation of care overall ($18 v. $23.2) and price premium for in-person visits ($25 v. $30). Respondents with no Internet at home showed even negative valuation of a care visit overall (−$9.42), which drove the (net) WTP for an in-person visit being the lowest among all subgroups (Figure 1 and Table 3).

Willingness to pay for care delivery modality by subgroup.
Patient Preferences and Marginal Willingness to Pay by Subgroup
(a) Subgroups by Sex, Race, and Age
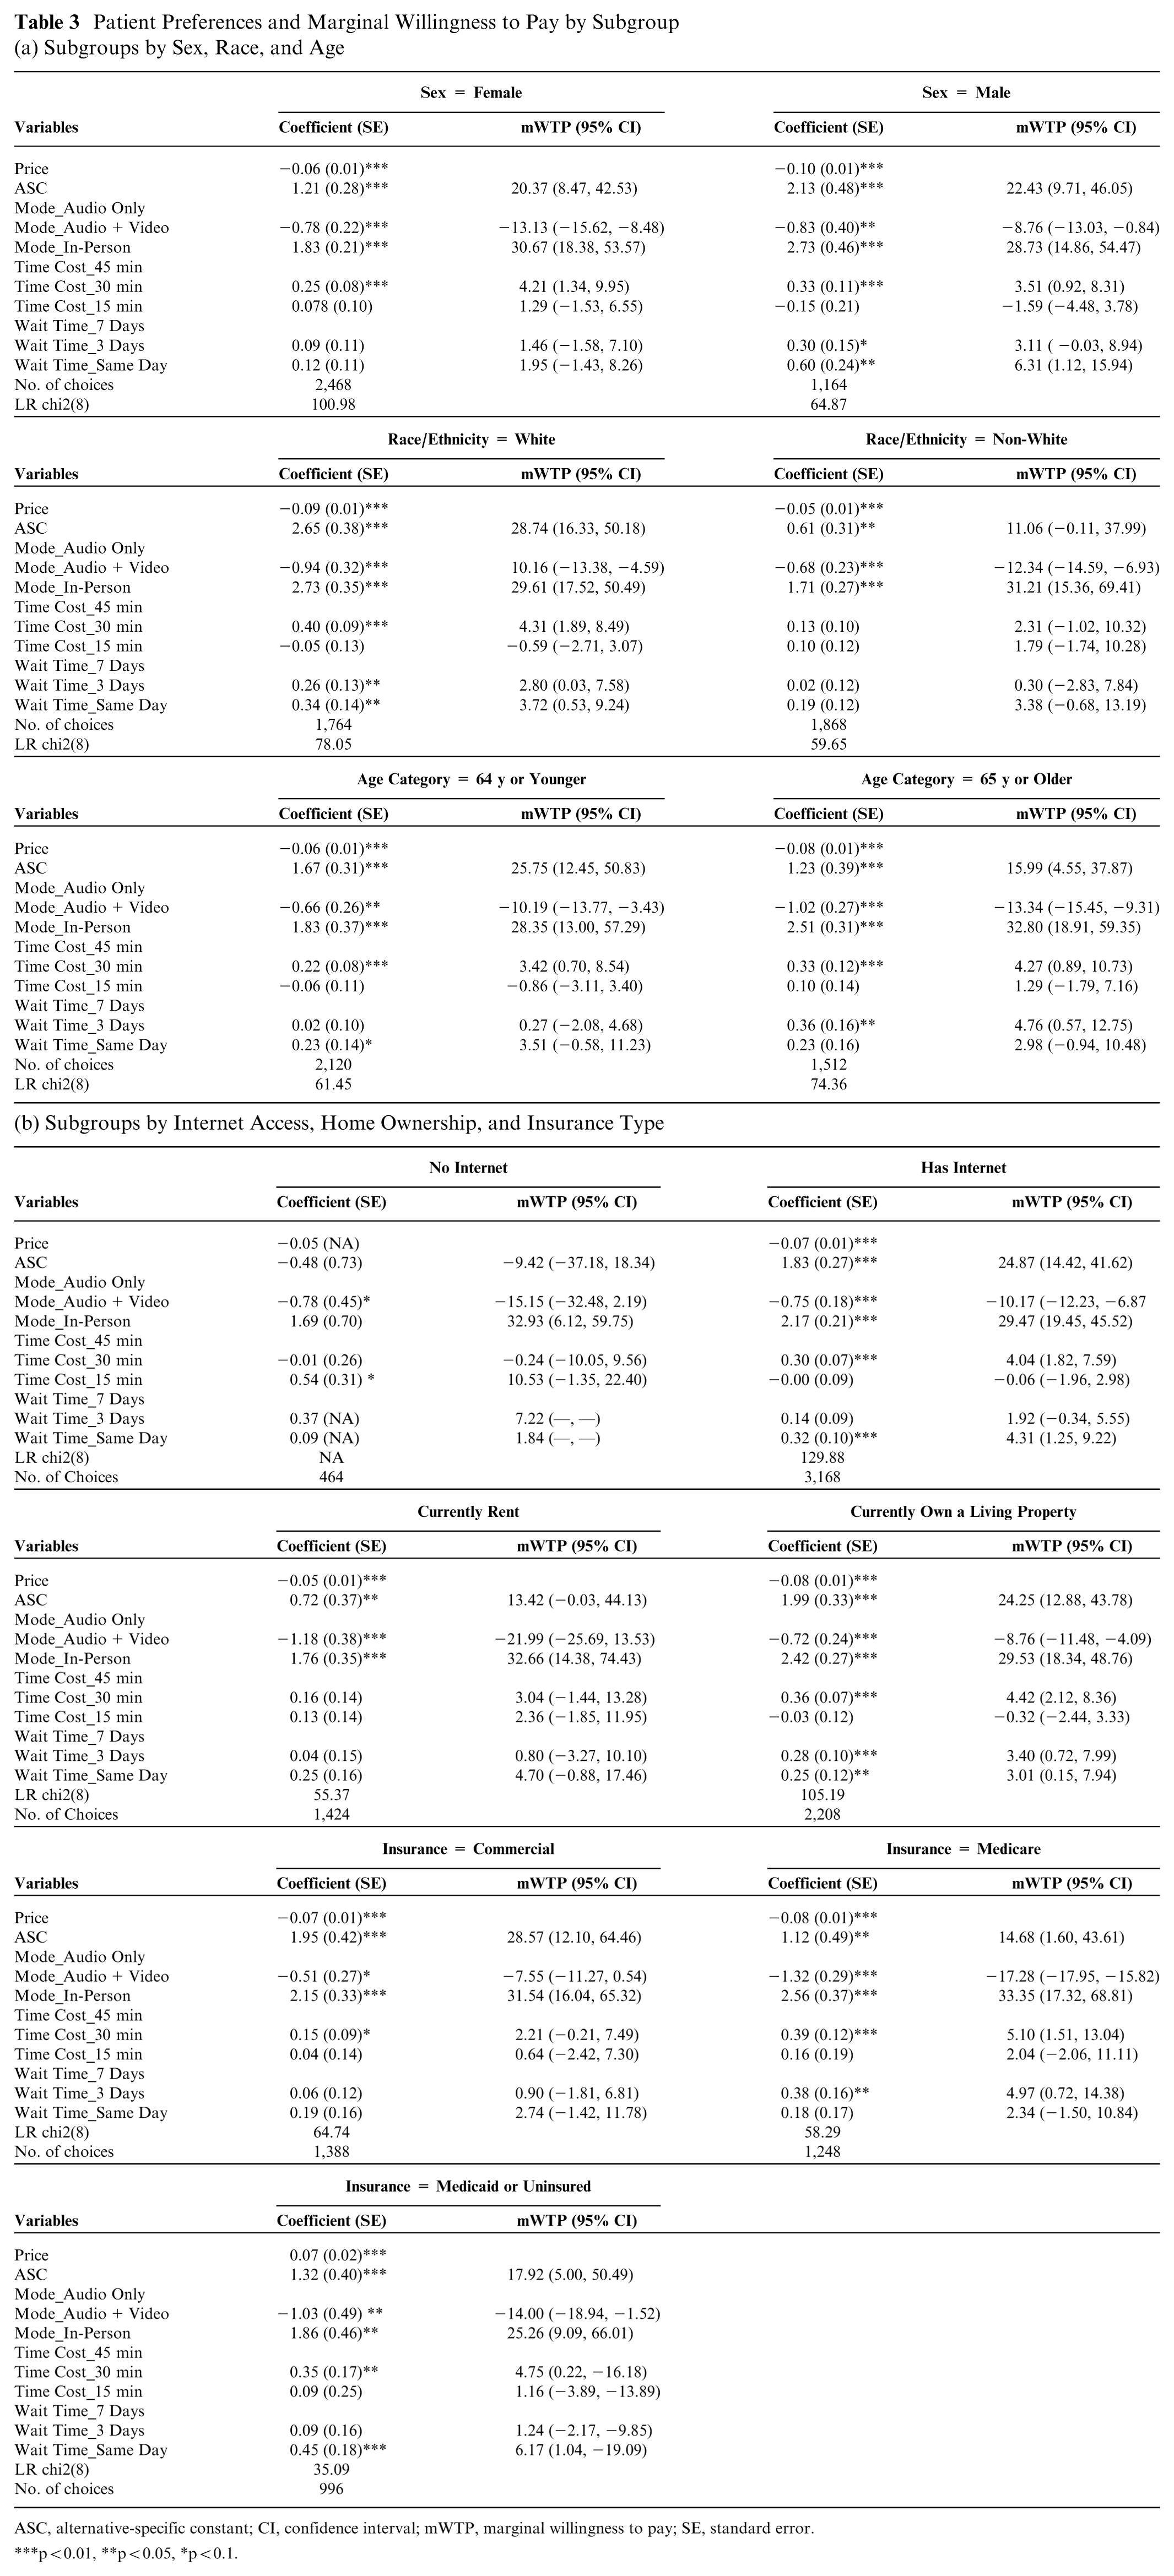
ASC, alternative-specific constant; CI, confidence interval; mWTP, marginal willingness to pay; SE, standard error. ***p<0.01, **p<0.05, *p<0.1.
Respondents also discounted the prices they were willing to pay for phone or video visits differently across subgroups. For the video visit type, patients who were female, non-White, renters, 65 y or older, Medicare or Medicaid beneficiaries, or had no Internet at home discounted video visits more than the general population (−$13 to $22 v. −$8.7) (Table 3). Combining with the valuations on a care visit overall (i.e., ASC) for respective subgroups, those who had no Internet, were renters, or were Medicare beneficiaries ascribed negative net valuations on video visits (−$25, −$9, and −$3, respectively), suggesting that these patient subgroups were willing to pay to avoid such care services (Figure 1).
For phone visits, those patients with no Internet at home, who were non-White, or who were 65 y or older ascribed significant negative (net) valuations (−$27, −$8, −$5, and −$1.6) (Figure 1), suggesting these patients would rather avoid such service type. However, these negative net valuations were mainly due to lower (than average) valuation of care visit overall (i.e., ASC) rather than a higher price discount for phone visits. Decomposing the net valuations to isolate out the ASC effects, renters, Medicaid or Uninsured, and Medicare patients discounted phone visits significantly less than the general population (−$12, −$11, −$16 v. −$21.9), implying that they are more willing to accept a phone visit than the general population if no other care delivery mode were available. These patient subgroups also revealed a higher willingness to choose phone visits over video visits if both virtual options were available (Table 3).
Differences in mWTP for Time Costs and Timely Access to Care by Patient Subgroups
The mWTP for reducing the time costs of obtaining care from 45 min to 30 min were lower among patients who were non-White, renters, or had commercial insurance than the general population ($2.2–$3 v. $4) (Figure 2). The lower mWTP was due to lower (than average) estimated coefficients on the 30-min time cost attribute level (the numerator of mWTP). The estimated coefficients on care service price (the denominator of mWTP) for these subgroups were comparable to the general population. The differences in estimated coefficient patterns suggested that while these subgroups appreciated dollar values (price sensitivity) similarly to the general population, they valued time savings much less (Table 3).
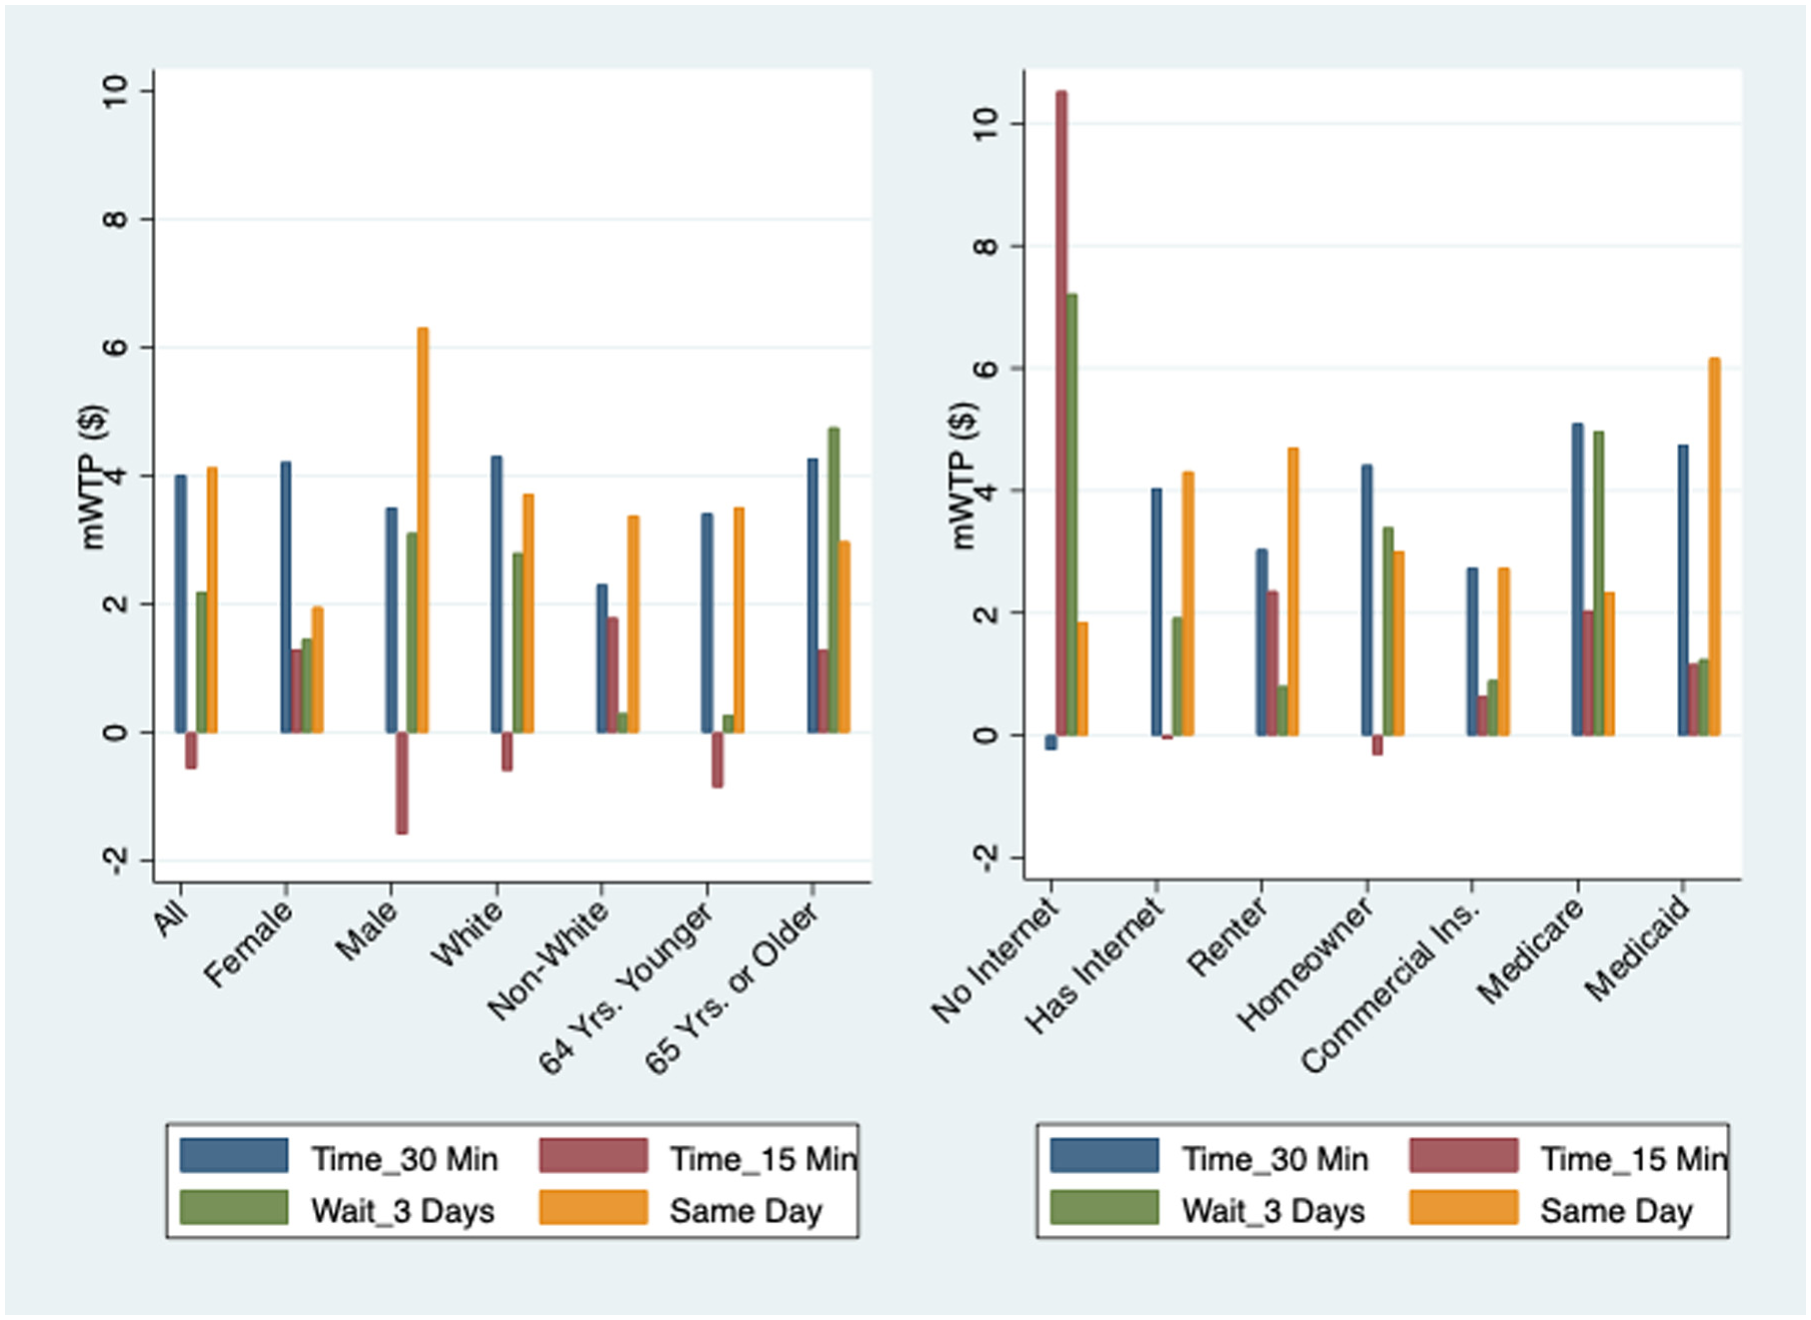
Marginal willingness to pay for timely care access and time costs.
The mWTPs for reducing the time costs further from 30 min to 15 min were not significant among any subgroup, suggesting that patients in general did not ascribe additional value for another 15 min of time saving. Patients who were male, White, or 64 y or younger even had negative (though insignificant) mWTP. One possible explanation for the negative valuation is that too short of time spent obtaining care (time commitment) cannot justify the needs of care seeking for these patients (Table 3).
The mWTP for the same-day visits (i.e., the shortest waiting time or the timeliest care access) were significantly higher among males, Medicaid beneficiaries, or those uninsured ($6.2–$6.3 v. $4.1) (Table 3). Females, homeowners, or Medicare beneficiaries had relatively lower mWTP for same-day visits ($2–$3 v. $4.1). Different valuations for the same-day visits reflected different inpatient levels or time preferences to some extent (Figure 2).
Positive mWTPs for a waiting period of 3 d relative to 7 d were significant only among White individuals, males, Medicare beneficiaries, or those who were 65 y or older. All other subgroups did not ascribe (significantly) positive value on the shorter waiting period when the waiting was longer than a day (Table 3). Medicare beneficiaries and patients who were 65 y or older were the only subgroup whose marginal valuations for 3-d visits was higher than those of same-day visits ($5 v. $2–$3).
Discussion
This study used DCEs to elicit patient preferences of alternative care delivery modalities and the monetary tradeoffs among nonprice attributes of care services such as delivery modality, time cost, and timeliness of care access. A few themes relevant to the current policy and community background emerged from the quantitative findings.
First, the perceived value that an average person had for a care visit (regardless of the delivery mode) was lower for those were non-White minorities, older than 65 y, Medicaid beneficiaries, or uninsured than for the general population ($11–$18 v. $23). A lower perceived value of care will reduce the willingness or likelihood of a person actively seeking care. According to the Grossman model of health demand, 60 people view health as a durable capital stock, or human capital, that they would invest in to enhance their well-being and productivity. This model suggests that people make decisions on health or care-seeking behaviors based on the expected return of this “investment,” considering factors such as income, education, and time. 61 By this theory, an individual will seek care only when he or she believes that the value of getting care exceeds the cost. 24 To incentivize these subpopulations with lower perceived value to seek appropriate care, it is essential to keep the cost of obtaining care low enough.23,42,62
Second, respondents in our study generally added price premiums (i.e., willing to pay higher prices) to care delivered in person and imposed different levels of price discounts (i.e., willing to pay lower prices) to phone or video visits. These findings generated policy-relevant discussion on telehealth payment parity (i.e., regulations that require insurance companies pay health care providers the same amount for telehealth services as they would for in-person care).9–11
While some people may perceive less value of telehealth than in-person care, the clinical efforts that are needed to administer and deliver telehealth are not less than those for in-person care.3,18,24,43 With the emerging evidence of telehealth’s benefits of overcoming geographic barriers and providing timely access to care, it is very essential for laws and regulations to support reasonable payments for telehealth and in-person care. These requirements will help alleviate the financial discouragement of telehealth provision on the supply side and ultimately ensure that telehealth is accessible and affordable for all patients. 11 As of January 2025, 22 states in the United States have implemented payment parity, 7 states have payment parity with caveats, and 21 states have no payment parity requirement. 7
Another aspect of telehealth payment parity refers to variations of these restrictions on certain service areas and delivery modalities, especially for audio-only services (i.e., phone visits). State laws and regulations vary substantially in detailed implementation.10,11 Some states require full parity, while others have limited parity on certain specialties, services, or delivery modality. Some states also allow private contracts between providers and insurers, which result in different reimbursement rates than those required by parity laws. Findings from our study showed that Medicaid beneficiaries and the uninsured discounted telehealth less than the general population did. They also valued audio-only visits more than audio–video visits. These findings are consistent to the evidence from the directly observed care utilization data that Medicaid beneficiaries, individuals with low income, or racial/ethnical minorities are more likely to use audio-only visits.46,62 Even if not full payment parity, some tiered payment incentives across care modalities that are proportional to cover care delivery costs on the provider’s side, especially for audio-only services, will be very important for these subpopulations to access care with less barriers.
Third, the unique benefits of telehealth in reducing the time costs obtaining care and improving timely care access can rebalance the scale of “value and cost” for individual decision making on health and health care. Telehealth can reduce the time needed to obtain care by eliminating the need for travel to a physical clinic or hospital.31,32,63 For individuals living in remote or underserved areas, telehealth can also overcome the geographic barriers of provider shortage to increase access to specialized care that would otherwise be unavailable. 64 With more flexible scheduling and efficient coordination, telehealth can facilitate earlier and quicker access to care by enabling patients to consult with specialists or other providers more readily, potentially avoiding missed or delayed care and leading to faster diagnoses and treatment.25,26 In our study, these benefits or the nonprice attributes of care services each valued about $2 to $6 per visit and were fully additive to a care service overall. While the initial implementation of telehealth may require investment, the cumulative benefits of telehealth will lead to long-term cost savings in health care.65,66
Last but not the least, patient preferences and WTP can depends on the patients’ income levels. While the study did not directly measure income effects, results using variables that are indicative of low-income status (e.g., Medicaid coverage) to control and adjust the model provided insights. In theory, income can affect WTP through 3 mechanisms: price sensitivity, reservation value for a care visit overall, and additional price premiums attached to any care service attributes (e.g., video or audio). These mechanisms can be reflected, respectively, by the estimated values of the price coefficient, the ASC, and the coefficients of care service attributes in the model. Our results showed that patients with Medicaid or no insurance coverage had comparable price sensitivity, lower reservation value for a care visit overall, and lower valuation for video services but higher valuation (or lower discount) for audio services than their counterparts did. These low-income patients also had higher WTP for timely visits and visits that require a lower cost of obtaining care, implying less patience in personality and more sensitivity to costs of care. These findings altogether showed the variation in WTP across care delivery modalities due to income status and highlighted the importance of designing and using appropriate telehealth delivery regulation and reimbursement policy to improve equity in care access.
Limitations
The study has a few limitations. First, we did not differentiate survey participants by their areas of residence. While telehealth can overcome transportation barriers on care access, individuals from certain disadvantaged rural or urban areas may face larger barriers on digital, internet, and technology literacy that prevent them from accessing telehealth.63,67 Second, the choice experiments did not differentiate care service attributes such as purpose of care (e.g., urgent care, nonurgent new care issue, follow-up, or care maintenance) nor include patient–physician relationships (e.g., gender, race/ethnic concordance, new v. established provider, local v. out-of-town/state provider), and so forth.30,33–36,68,69 These are also important nonprice attributes that influence patients’ preferences and decision making. Third, the choice experiment design treated each care option as a stand-alone care encounter and did not capture or suggest complement or substitute relationships among alternative care delivery modes.13,70 Instead, the literature on care delivery sequence and follow-up patterns answers these questions better.14,15 Fourth, the study sample was drawn from a single state with a relatively small sample size and hence may not be fully representative of the national population. The small study sample size also prohibited the possibility of reliably categorizing patient preferences by latent class or cluster analysis. 43
Conclusion
This study used DCEs to elicit patient preferences over alternative care delivery modes and value of time. Results suggested that people generally discounted care delivered by phone or video visits but preferred to have such options for flexibility and timely access. Patients valued in-person, phone, and video visits differently, with those receiving Medicare or patients 65 y or older valuing telehealth (both phone and video visits) the least among all subpopulations, and Medicaid beneficiaries or the uninsured valuing phone visits higher than video visits. The unique benefits of telehealth such as reducing the time needed to obtain care and providing timely care access increased its desirability and the potential to avoid missed or delayed care and to improve equal care assess among subpopulations.
Supplemental Material
sj-docx-1-mpp-10.1177_23814683261456736 – Supplemental material for Consumer Preferences for Care Delivery Modality, Timely Care Access, and Time Costs: Insights from Discrete Choice Experiments
Supplemental material, sj-docx-1-mpp-10.1177_23814683261456736 for Consumer Preferences for Care Delivery Modality, Timely Care Access, and Time Costs: Insights from Discrete Choice Experiments by Ying (Jessica) Cao, Amy Schultz and Tiffany Green in MDM Policy & Practice
Footnotes
Acknowledgements
This work was presented at the 2025 Academy Health Annual Research Meeting and the 2025 American Society of Health Economists annual conference.
The authors declared no potential conflicts of interest with respect to the research, authorship, and/or publication of this article. The authors disclosed receipt of the following financial support for the research, authorship, and/or publication of this article: Financial support for this study was provided in part by grants 5U24AG076462 (Cao) from the National Institute on Aging, #827350 (Cao) from the Michigan Department of Health and Human Services, and AAL6359 (Cao and Green) from an anonymous philanthropic foundation. The funding agreement ensured the authors’ independence in designing the study, interpreting the data, writing, and publishing the report.
Author Contributions
All authors certify that they meet the ICMJE criteria for authorship.
Ethical Considerations
The study was reviewed and approved by the Institutional Review Board of the University of Wisconsin–Madison.
Consent to Participate
Informed consent to participate was written or online depending on participants’ choice of response in the parent survey, the Survey of the Health of Wisconsin (SHOW).
Patient Consent
Not applicable.
Consent for Publication
Not applicable.
References
Supplementary Material
Please find the following supplemental material available below.
For Open Access articles published under a Creative Commons License, all supplemental material carries the same license as the article it is associated with.
For non-Open Access articles published, all supplemental material carries a non-exclusive license, and permission requests for re-use of supplemental material or any part of supplemental material shall be sent directly to the copyright owner as specified in the copyright notice associated with the article.