
Abstract
Introduction:
Previously, we discovered similar esophageal gene expression patterns in patients with systemic sclerosis and eosinophilic esophagitis where eosinophil/mast cell–targeted therapies are beneficial. Because systemic sclerosis and eosinophilic esophagitis patients experience similar esophageal symptoms, we hypothesized that eosinophil/mast cell–directed therapy may potentially benefit systemic sclerosis patients. Herein, we determine the association between esophageal mast cell quantities, gene expression, and clinical parameters in order to identify systemic sclerosis patients who may benefit from eosinophil/mast cell–directed therapy.
Methods:
Esophageal biopsies from systemic sclerosis patients and healthy participants were stained for tryptase, a mast cell marker, and associations with relevant clinical parameters including 24-h esophageal pH testing were assessed. Intra-epithelial mast cell density was quantified by semi-automated microscopy. Microarray data were utilized for functional and gene set enrichment analyses and to identify intrinsic subset assignment, a systemic sclerosis molecular classification system that includes inflammatory, proliferative, limited, and normal-like subsets.
Results:
Esophageal biopsies from 40 systemic sclerosis patients (39 receiving proton pump inhibition) and eleven healthy participants were studied. Mast cell numbers in both the upper esophagus (rs = 0.638, p = 0.004) and the entire (upper + lower) esophagus (rs = 0.562, p = 0.019) significantly correlated with acid exposure time percentage. The inflammatory, fibroproliferative, and normal-like intrinsic subset originally defined in skin biopsies were identified in esophageal biopsies. Although esophageal mast cell numbers in systemic sclerosis patients and healthy participants were similar, gene expression for mast cell–related pathways showed significant upregulation in the inflammatory intrinsic subset of systemic sclerosis patients compared to patients classified as proliferative or normal-like.
Discussion:
Esophageal mast cell numbers are heterogeneous in systemic sclerosis patients and may correlate with acid exposure. Patients with inflammatory intrinsic subset profiles in the esophagus demonstrate more tryptase staining. Mast cell–targeted therapy may be a useful therapeutic approach in systemic sclerosis patients belonging to the inflammatory intrinsic subset, but additional studies are warranted.
Keywords
Introduction
Systemic sclerosis (SSc/scleroderma) is a rare multisystem connective tissue disease that involves internal organs including the gastrointestinal (GI) tract. Upward of 90% of SSc patients report esophageal symptoms including reflux and dysphagia, making the esophagus the second most commonly involved organ after skin.1,2 Esophageal involvement in SSc patients shares similar symptomatology to patients with eosinophilic esophagitis (EoE), an allergic inflammatory condition thought to be due, in part, to mast cell degranulation. Mast cell–targeted therapy has proven beneficial in EoE patients, yet no specific disease-modifying treatments for SSc esophageal disease have been identified to date. 3
Mast cells appear to be more numerous in the skin and lung tissue from patients and various scleroderma animal models including the tight skin (TSK) and chronic graft-versus-host disease (GVHD) mouse models, and intratracheal bleomycin-induced pulmonary fibrosis rat model compared to controls.4–7 Systemic sclerosis pathogenesis is thought to involve many mediators produced by mast cells, including histamine, proteases, heparin, endothelin-1 (ET-1), and transforming growth factor-beta (TGF-β). 8 This study was undertaken to explore a potential role of mast cells in SSc esophageal disease.
In addition, a new molecular SSc classification has been proposed based upon differences in skin gene expression between clinically involved and clinically uninvolved skin that consists of four “intrinsic subsets” (IS): inflammatory, fibroproliferative, limited, and normal-like. 9 Results of our previous studies demonstrated unique inflammatory, proliferative, and non-inflammatory IS in SSc esophageal biopsy gene expression studies and also demonstrated an association between specific skin gene expression signatures and clinical improvement during mycophenolate mofetil or imatinib mesylate treatment.10–14 We hypothesized that a subset of SSc patients might demonstrate more mast cells and/or an activated mast cell gene expression signature in the esophagus. To begin addressing this question, we quantified esophageal mast cells and global gene expression and assessed the association with esophageal functional studies and relevant patient data.
Methods
Patients
The Northwestern Institutional Review Board (STU198726 and STU00096856) approved this study. 15 Patient participants were recruited from the Divisions of Gastroenterology and Rheumatology at the Northwestern University Feinberg School of Medicine and provided informed consent. Eleven healthy controls were also recruited, who provided informed consent.
Esophagogastroduodenoscopy, high-resolution manometry, and 24-h pH monitoring
Esophagogastroduodenoscopy examinations, high-resolution manometry (HRM) including basal esophagogastric junction (EGJ) pressure measurement, and acid exposure time (AET) were collected as described.15,16 HRM motility diagnoses were defined for each participant using the four-class Chicago Classification system. 17 Esophageal biopsies were obtained as previously described. 15 Two upper (within 10 cm of esophageal inlet) and two lower (5 cm proximal to squamocolumnar junction) esophageal biopsies were obtained from SSc patients. One upper/lower pair was formalin-fixed and paraffin-embedded, and 4 µm sections were obtained. The other pair was placed in RNA later and used for gene expression studies. 15
Immunohistochemistry
Paraffin-embedded esophageal tissue sections were dehydrated, quenched with 3% hydrogen peroxide/methanol for 10 min at room temperature, blocked in 5% horse serum for 30 min at room temperature, and then incubated with mouse monoclonal antitryptase (Neomarkers, Fremont, CA; 1:10,000 in PBS/0.3% Tween 20/5% horse serum) overnight at 4°C. Sections were incubated in biotinylated horse anti-mouse secondary antibody (Vector Labs, Burlingame, CA; 1:500 in PBS/0.3% Tween 20/5% horse serum) for 1h at room temperature, followed by rehydration and counterstaining with hematoxylin.
Mast cell quantification and analysis
Two upper and lower esophageal biopsy sections per participant were individually stained for tryptase. One pair was selected randomly for analysis. Images were captured using a Nikon 80i microscope (Nikon, Melville, NY) with a DS-Ri2 color camera and stitched together with a 40× objective (400× total magnification) with NIS-Elements v.5 (Nikon) and mechanized with Prior ProScan III (Prior ProScan, Rockland, MA) 8-slide stage, which allows capture of the entire tissue biopsy to a single image. Mast cell quantification was calculated with a thresholding algorithm on RGB (red, green, blue) images using the NIS-elements AR v.5 software. The same algorithm was utilized for all specimens, and the investigator who performed the quantification (L.O.) was blinded to disease classification. Mast cell density was expressed as mast cells divided by tissue surface area (mm2).
DNA microarray hybridization and data analysis
RNA was isolated from esophageal biopsies from two patients and four healthy participants who were subsequently recruited, yielding data from 18 SSc patients and four healthy participants. 15 Probes with >20% missing data were excluded. The statistical significance of batch bias before (p < 0.002) and after (p = 0.756) adjustment with ComBat was assessed with guided principal component analysis (gPCA; Supplementary Figure 1). 18
IS gene analysis
Intrinsic gene selection was performed using a custom MATLAB script. 12 The intrinsic gene analysis identifies genes with the most similar expression between upper and lower biopsies of the same individual but with the most dissimilar expression between different individuals. Genes with a false discovery rate (FDR) <1.1% were selected and hierarchically clustered to identify groups of patients according to the IS classification. We compared IS results to our previous findings. 15
Gene set enrichment analysis
Gene set enrichment analysis (GSEA) was run as a Gene Pattern module using the gene set permutation option. The gene set database file used was C5 (Gene Ontology) from the Molecular Signatures Database (v6.1 MSigDB).19,20 GSEA was performed on post-ComBat data to assess whether there was enrichment in mast cell–related genes. Core enrichment genes from mast cell–related pathways which contributed the most to the significant enrichment were visualized using Java TreeView. The gene expression value for the core enrichment genes was averaged per patient and plotted against their IS.
Statistical analyses
Descriptive statistics were calculated. Categorical measures were summarized using counts and percentages, while continuous measures were summarized by mean and standard deviation (SD). Spearman’s correlations were calculated to measure associations between total mast cells and relevant SSc clinical characteristics. Student’s t-test or Wilcoxon/Mann-Whitney test (continuous variables) and chi-square test or Fisher’s exact test (categorical variables) were used as appropriate. The significance level was defined as p < 0.05. The data were analyzed using SAS v9.4 (SAS Institute, Inc, Cary, NC). See Supplementary Methods for further details.
Results
Forty SSc patients (40% with dcSSc) and 11 healthy participants, mean age (±SD) of 54 (±11.4) and 30 (±6.0) years, respectively, were included. Three upper and three lower esophageal biopsies from SSc patients were excluded due to insufficient tissue. All eleven upper and lower esophageal biopsies from healthy participants were included in mast cell quantification analysis. However, only four upper esophageal biopsies from healthy participants were included in gene expression analyses. Among the patients, 33 (83%) were White, 36 (90%) were women, and the mean ± SD body mass index (BMI) was 25.5 ± 5.3 kg/m2. Among the healthy participants, ten (91%) were White, eight (73%) were women, and the mean ± SD BMI was 23.5 ± 3.0 kg/m2. Healthy participants were younger than SSc patients (p < 0.001) (Table 1).
Baseline characteristics of study subjects..
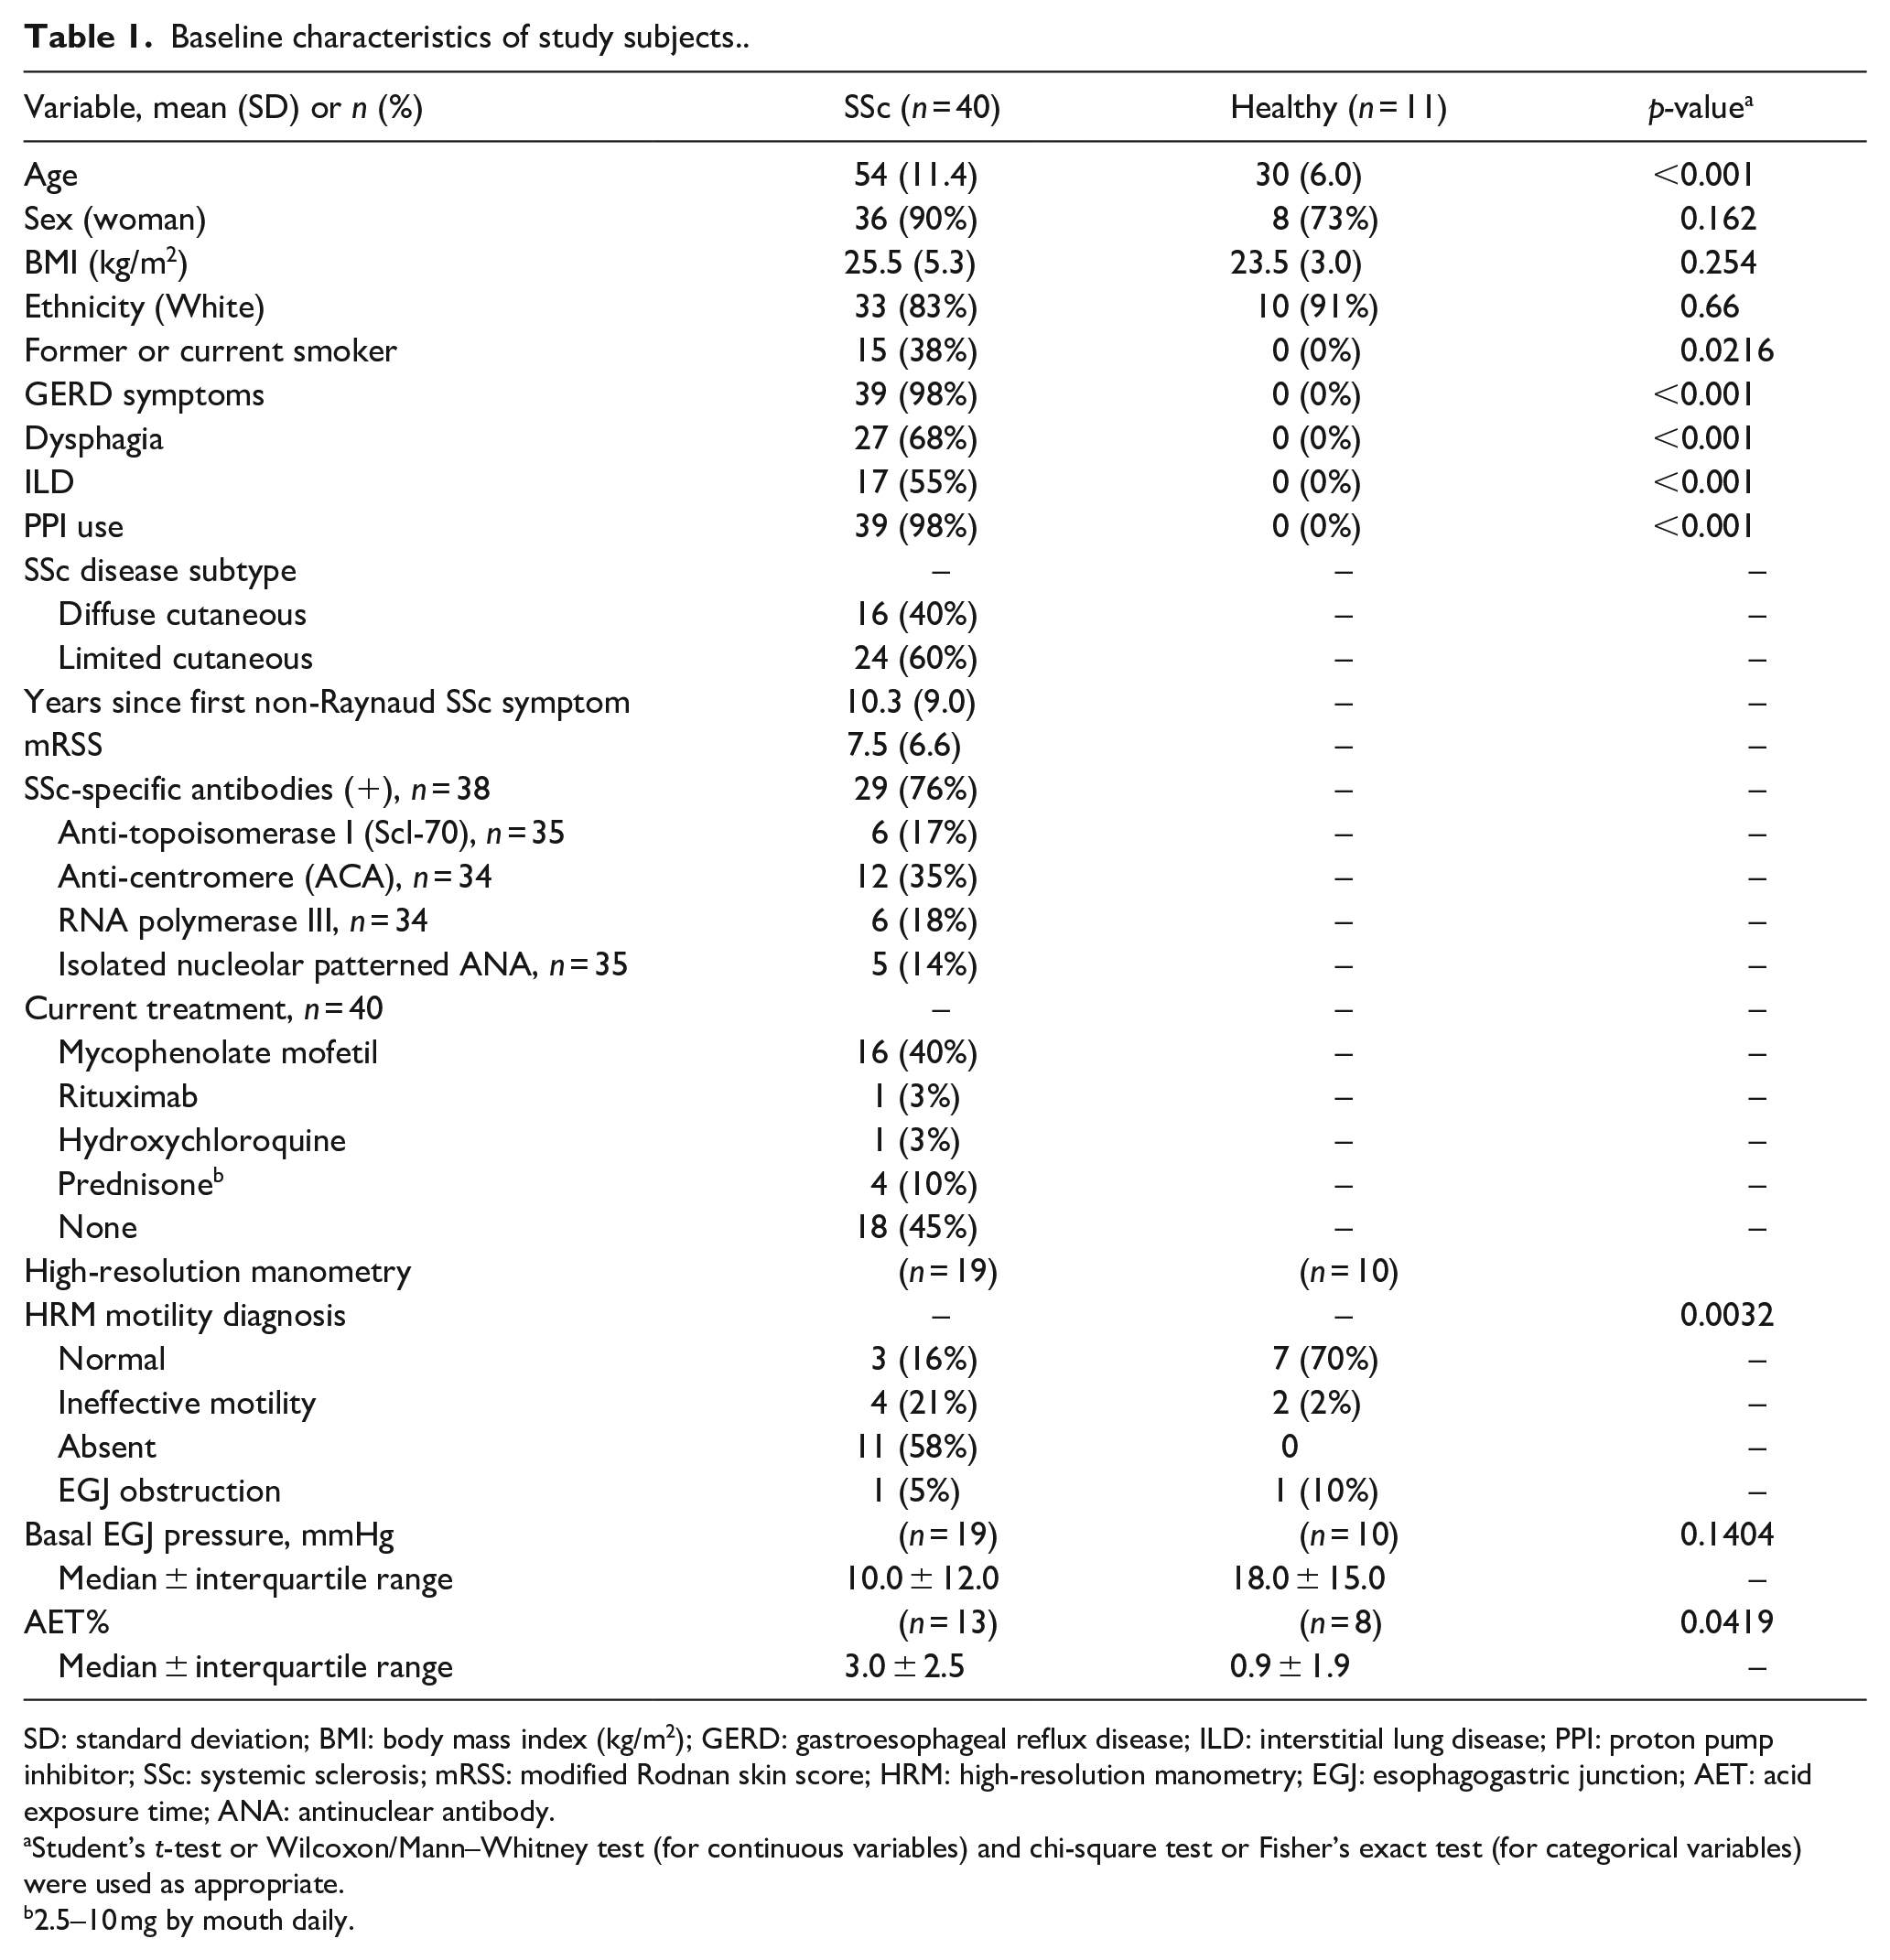
SD: standard deviation; BMI: body mass index (kg/m2); GERD: gastroesophageal reflux disease; ILD: interstitial lung disease; PPI: proton pump inhibitor; SSc: systemic sclerosis; mRSS: modified Rodnan skin score; HRM: high-resolution manometry; EGJ: esophagogastric junction; AET: acid exposure time; ANA: antinuclear antibody.
Student’s t-test or Wilcoxon/Mann–Whitney test (for continuous variables) and chi-square test or Fisher’s exact test (for categorical variables) were used as appropriate.
2.5–10 mg by mouth daily.
To identify SSc patients with low versus high mast cell counts, we performed semi-automated microscopy using software to capture whole biopsy images and quantify mast cells (Figure 1). The median number of proximal and distal esophageal biopsy mast cells/mm2 for SSc versus healthy participants was 18.3 and 18.5 versus 10.6 and 12.6 (p = 0.08 and 0.18, respectively) (Table 2 and Supplementary Figure 2). For SSc patients, no significant associations were identified between esophageal mast cell numbers and SSc disease duration, BMI, age, or basal EGJ pressure (Table 3). However, AET% on 24-h esophageal pH testing was significantly correlated with mast cell numbers in both the upper esophagus (rs = 0.638, p = 0.004) and the entire (upper + lower) esophagus (rs = 0.562, p = 0.019) (Table 3).
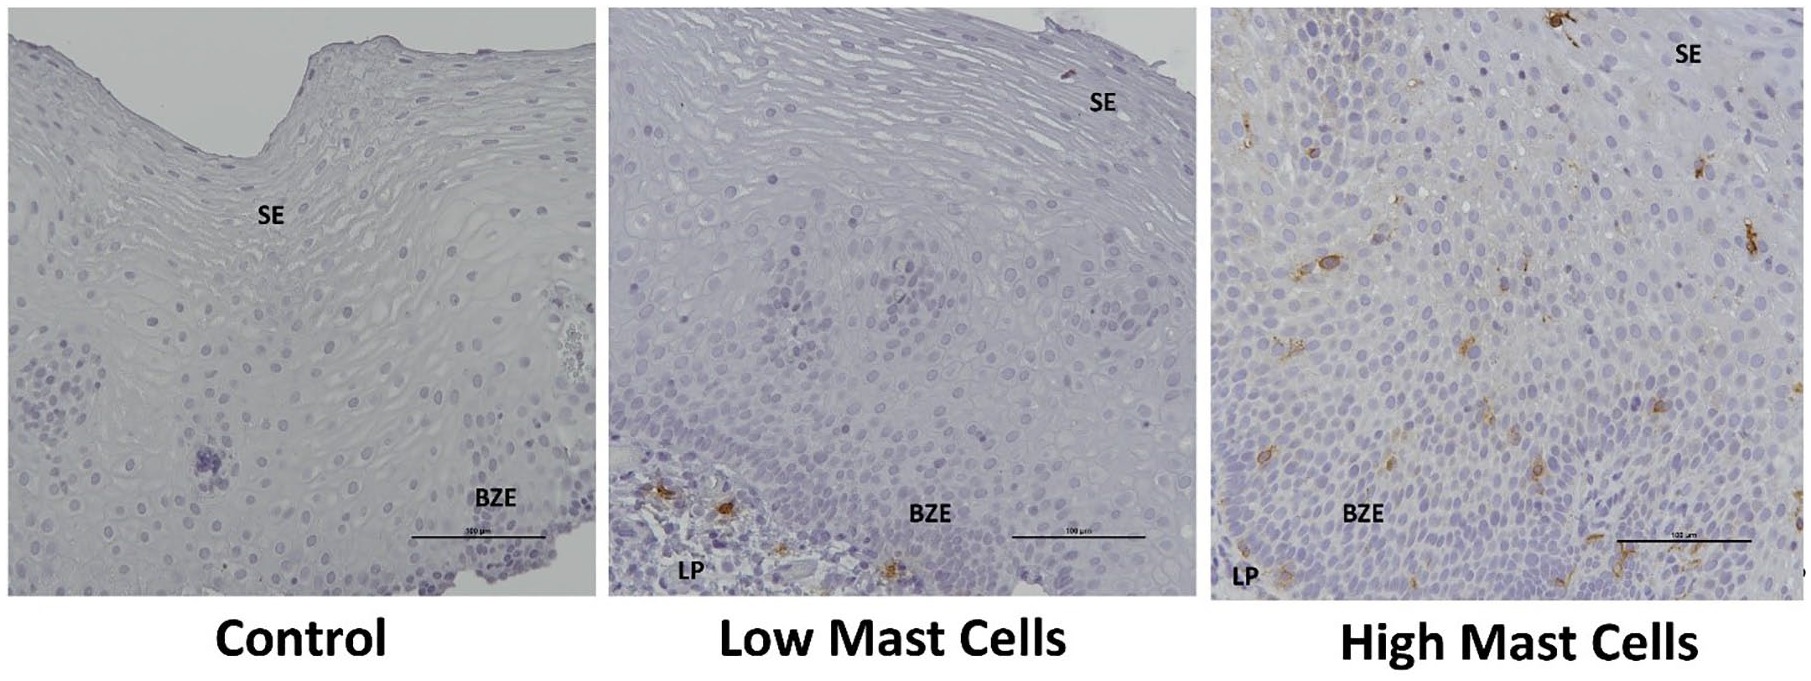
Observed tryptase-positive mast cell staining gradient in SSc esophageal biopsies (400× magnification).
Esophageal mast cell number/mm2.
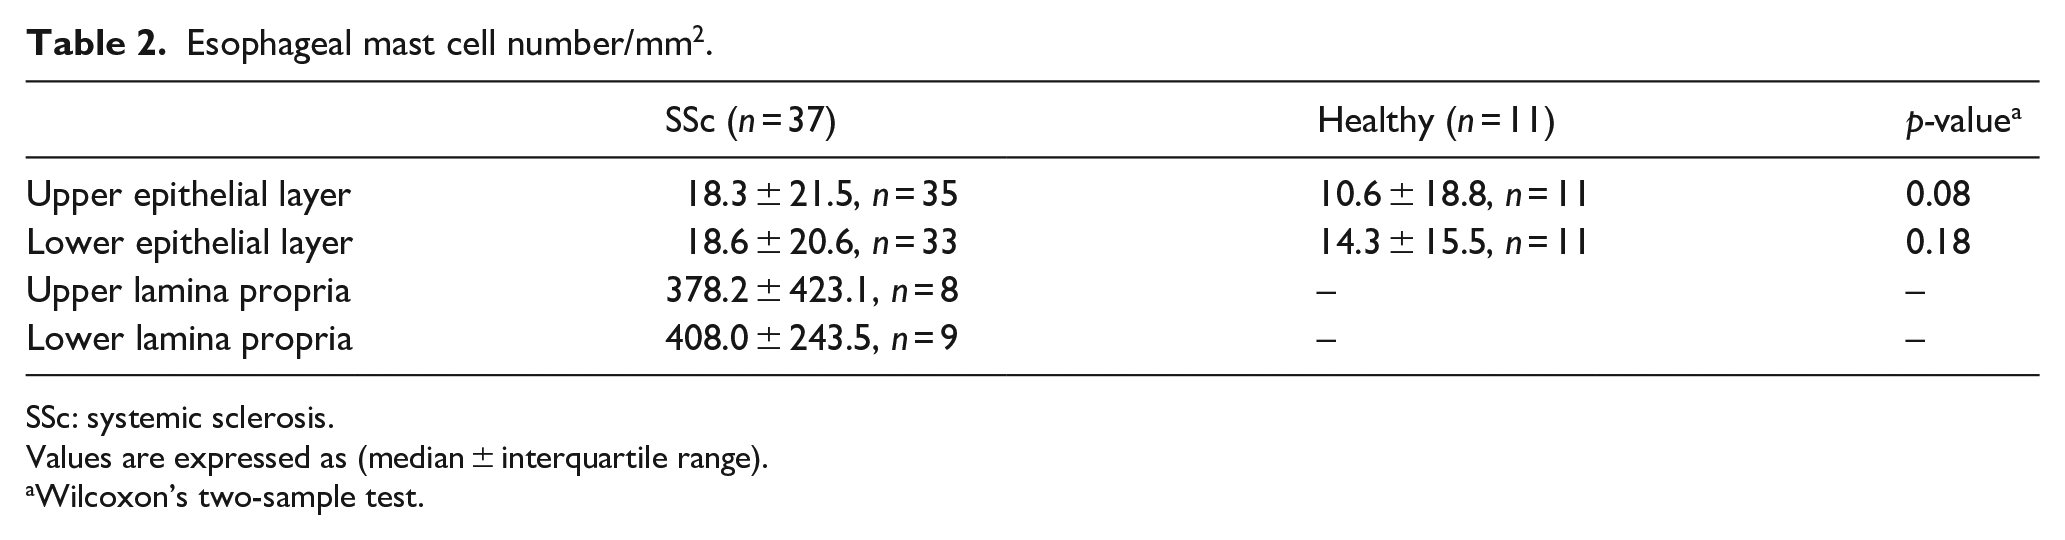
SSc: systemic sclerosis.
Values are expressed as (median ± interquartile range).
Wilcoxon’s two-sample test.
Correlation between esophageal mast cells and SSc clinical characteristics.
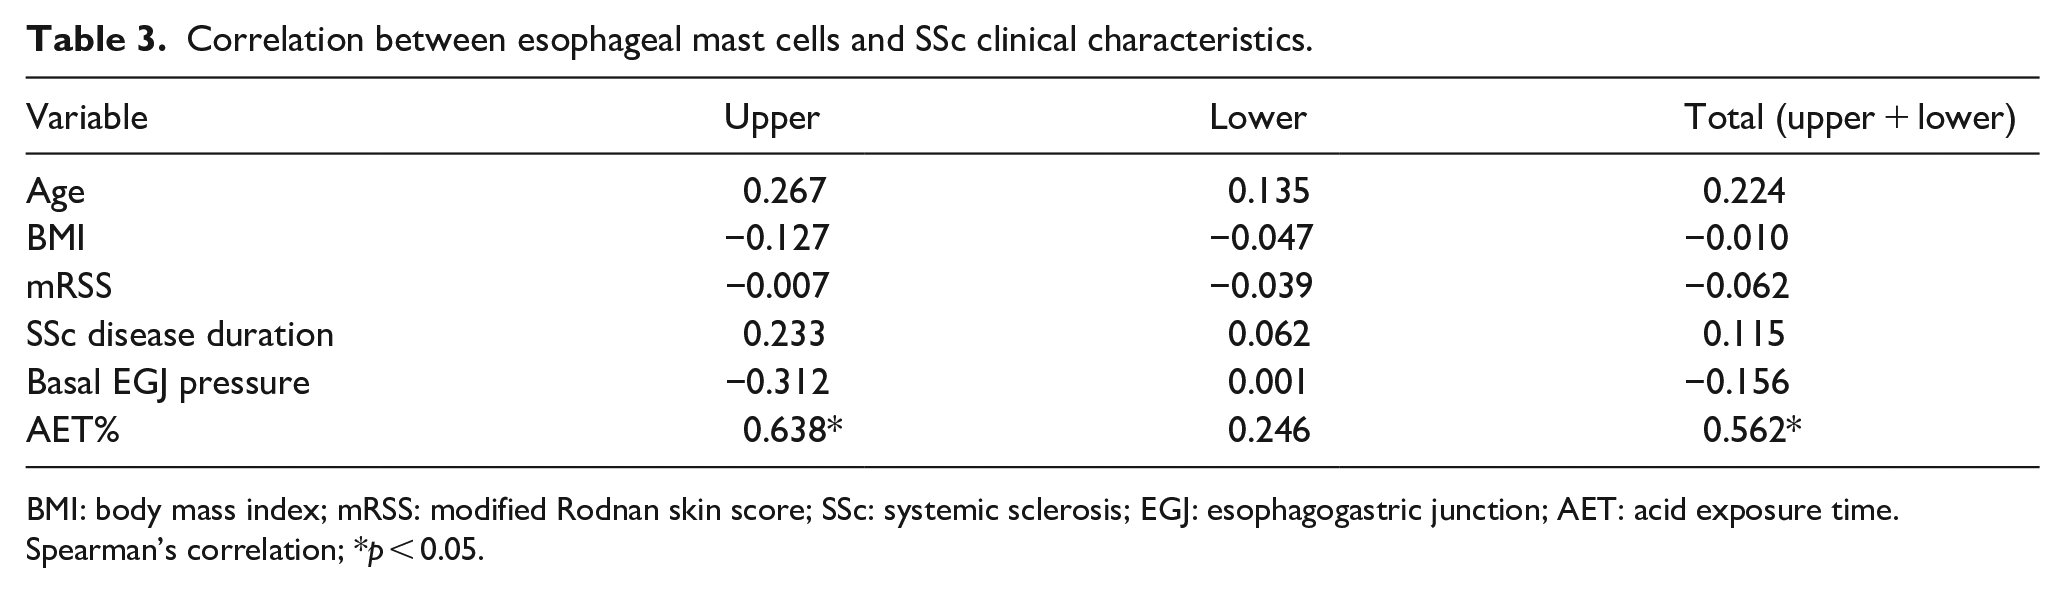
BMI: body mass index; mRSS: modified Rodnan skin score; SSc: systemic sclerosis; EGJ: esophagogastric junction; AET: acid exposure time.
Spearman’s correlation; *p < 0.05.
High-resolution esophageal manometry data for 19 SSc patients and 10 healthy participants were available. Eleven (58%) had absent contractility, four (21%) had ineffective esophageal motility and three (16%) had normal motility as defined by the Chicago Classification consistent with our prior study results.16,21 Patients had more abnormal peristalsis (p = 0.003) and higher AET% at the distal esophagus (p = 0.042) compared to healthy participants (Table 1). However, the basal EGJ pressure was not significantly different between groups (p = 0.140).
Next, we determined the IS for each esophageal biopsy pair. 15 We identified 1371 intrinsic genes (FDR <1.1%) and used them to hierarchically cluster the batch-corrected dataset.15,18 Gene expression for upper and lower biopsies from the same individual was highly concordant with 100% paired upper and lower biopsies clustering together (Supplementary Table 1). Similar to skin, esophageal biopsies show clear inflammatory, proliferative, and normal-like subsets (Figure 2). Reassuringly, there was 100% concordance between IS assignment for individual esophageal biopsies from our prior, and the current, study. 15 With the larger sample size herein, we were able to more precisely characterize twelve biopsies from five patients as “normal-like,” which were previously classified as “non-inflammatory.”
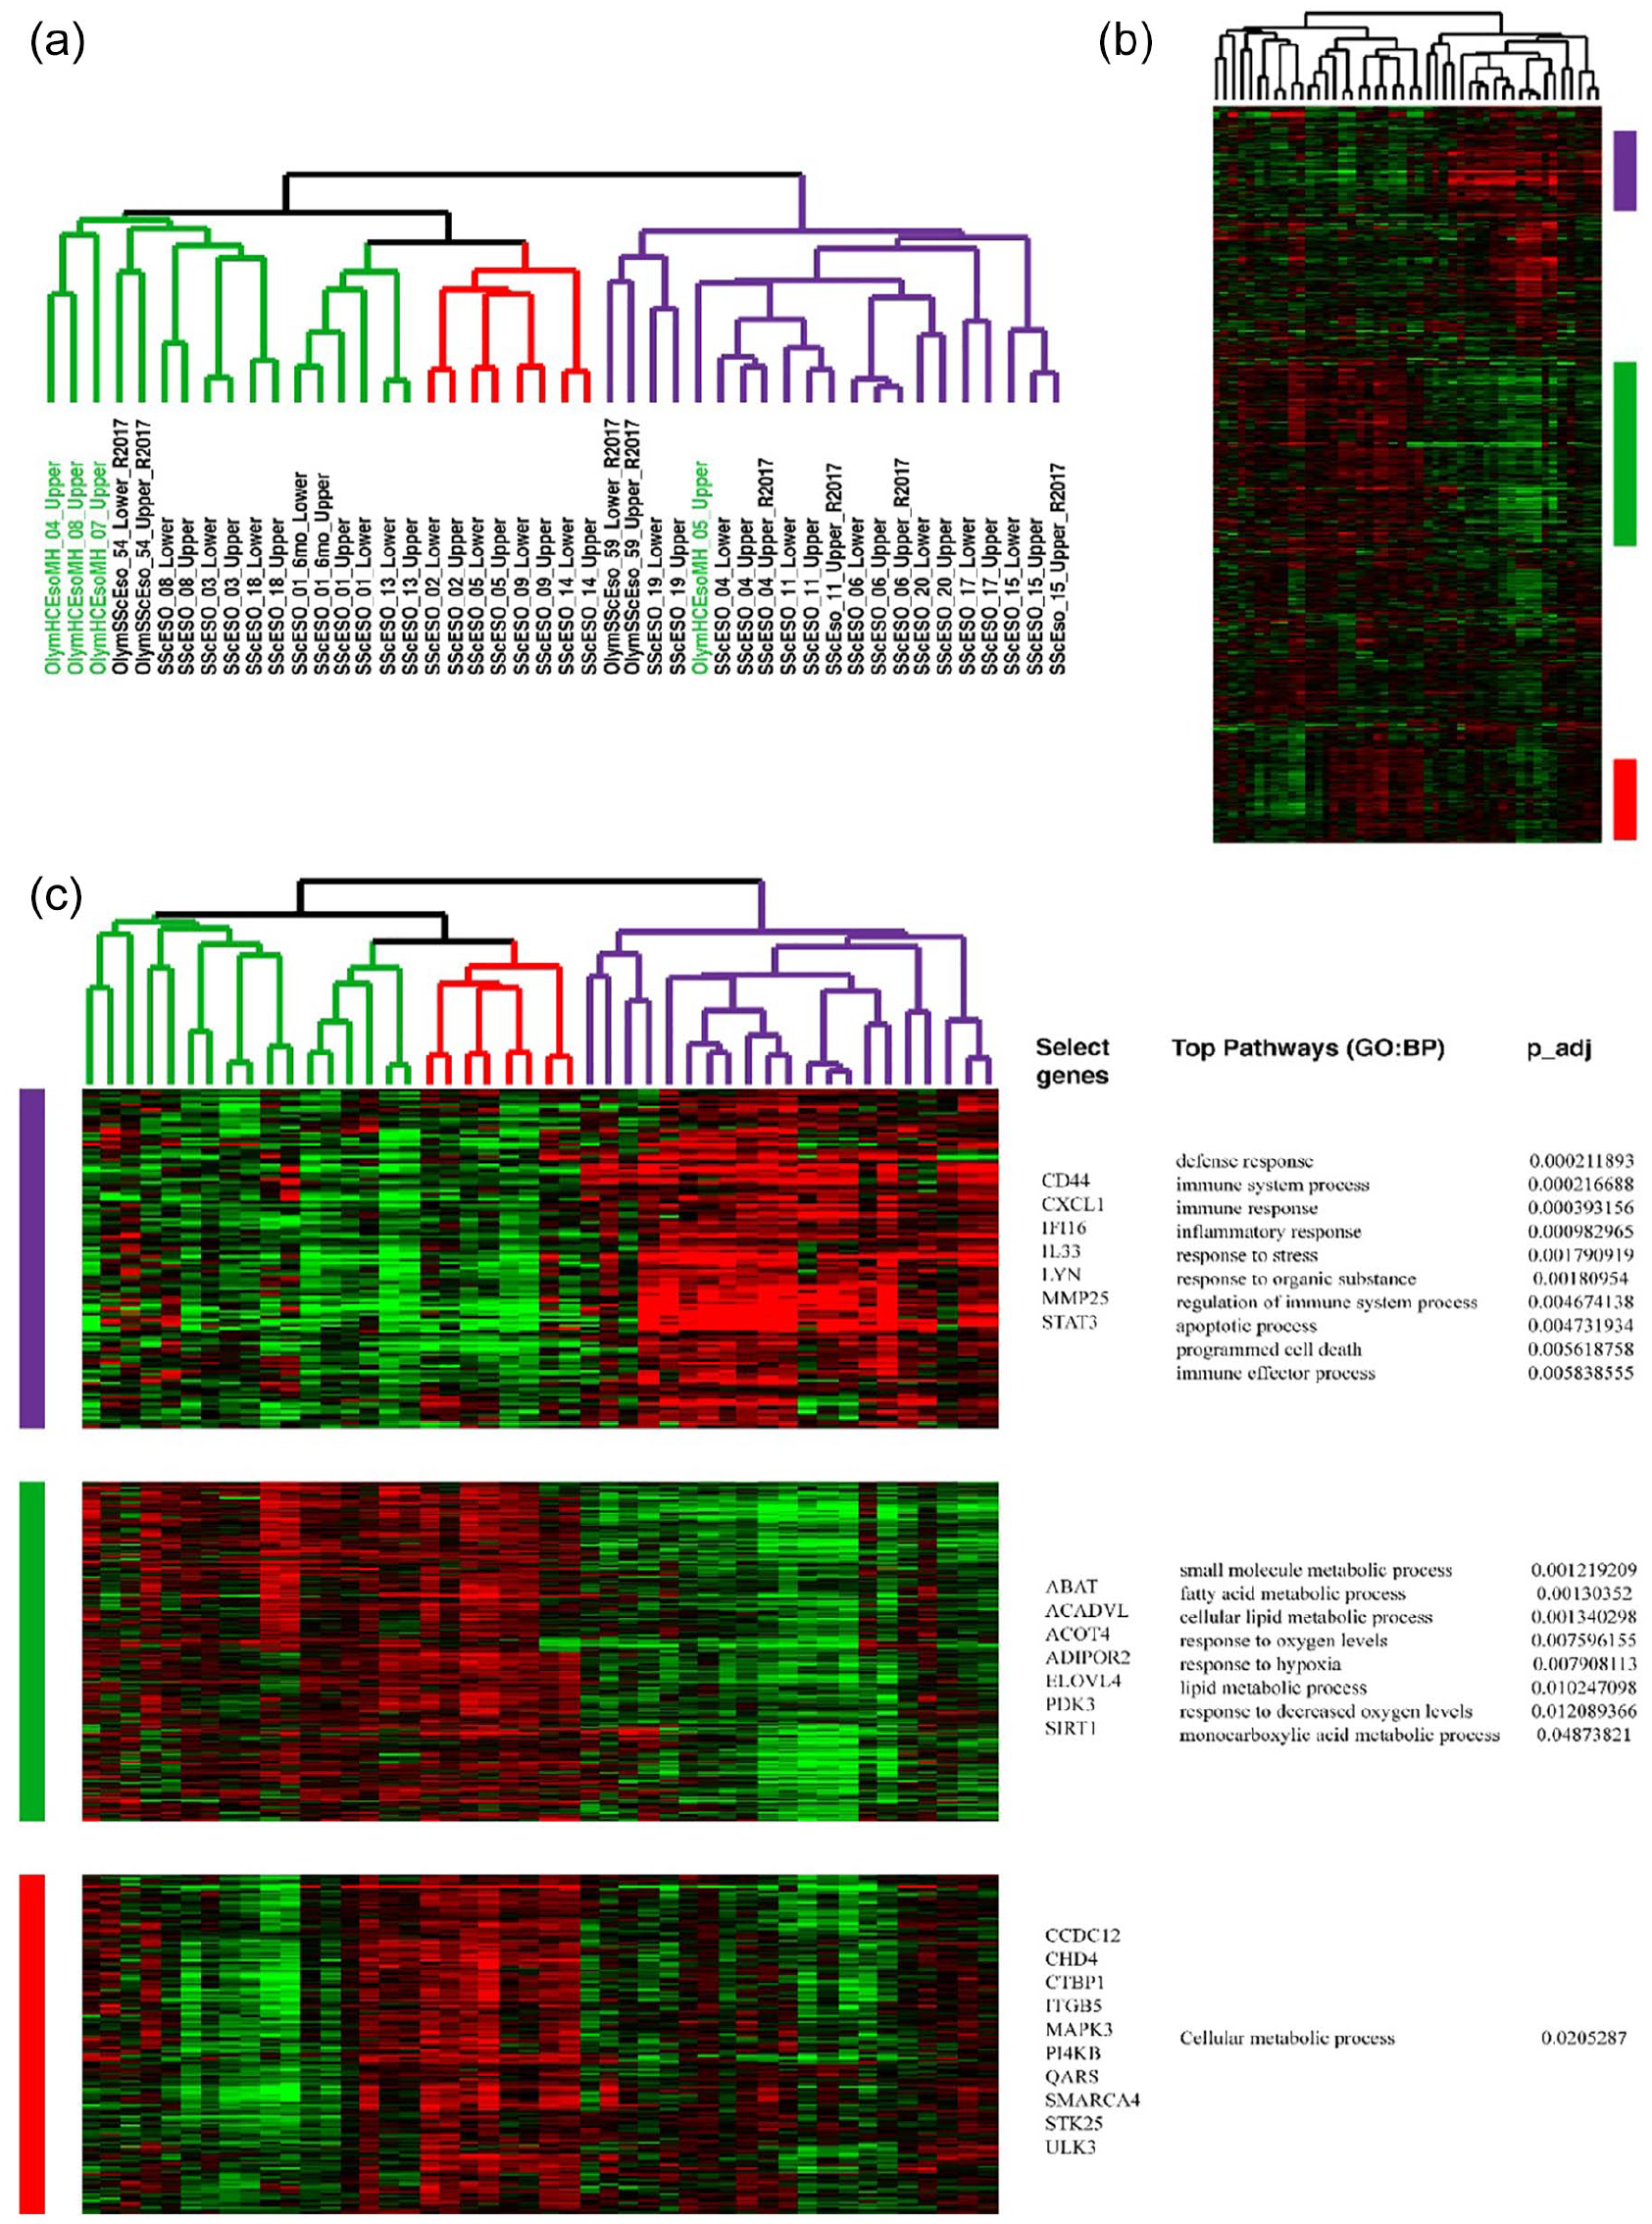
Intrinsic gene set analysis of esophageal biopsies from patients with SSc and healthy participants. A total of 1371 genes (FDR <1.1%) that were most similar between participants with paired biopsies and most dissimilar between participants were termed “intrinsic.” (a) Dendrogram with patient subsets labeled. Purple—inflammatory, red—proliferative, green—normal-like. Participant sample names are indicated in black under dendrogram. Samples from healthy participants are indicated in green under dendrogram. (b) An overview of all 1371 genes that are hierarchically clustered. (c) Selected gene clusters that are representative of the identified subsets. Inflammatory intrinsic subset (IS) (purple color) is characterized by increased expression of genes and pathways involved in immune system signaling. Proliferative IS (red color) is associated with enrichment in cell cycle–related processes. Normal-like IS (green color) is generally displays upregulation of lipid metabolism. Functional terms shown are from g:Profiler. 15
GSEA was used to determine the enrichment of mast cell gene expression signatures in the microarray data. Using the C5 pathway database, GSEA analysis yielded significantly enriched mast cell–related pathways between patients classified in the inflammatory compared to those classified in the non-inflammatory (proliferative and normal-like combined) SSc esophageal IS (Supplementary Table 2).
Three mast cell–related pathways upregulated in biopsies that were classified as belonging to the inflammatory IS were identified using GSEA. The core enrichment genes from each pathway were selected and their overlap is shown in Figure 3(a), where two terms had identical core enrichment genes. The union of the core enrichment from all three pathways was visualized as a heatmap (Figure 3(b)), illustrating that inflammatory IS patients seem to have an elevated expression of mast cell–related genes. Formally testing this notion, we demonstrate that inflammatory biospecimens show significantly higher expression of mast– related genes relative to healthy (p = 0.0076), normal-like (p < 0.0001), and proliferative individuals (p < 0.0001) (Figure 3(c)). To assess the potential function of these core enrichment genes in mast cells, the genes were visualized in the context of a mast cell–specific network (Figure 3(d)); functional enrichment in cell activation, proteasome assembly, and regulation of endopeptidase activity are enriched in these genes.
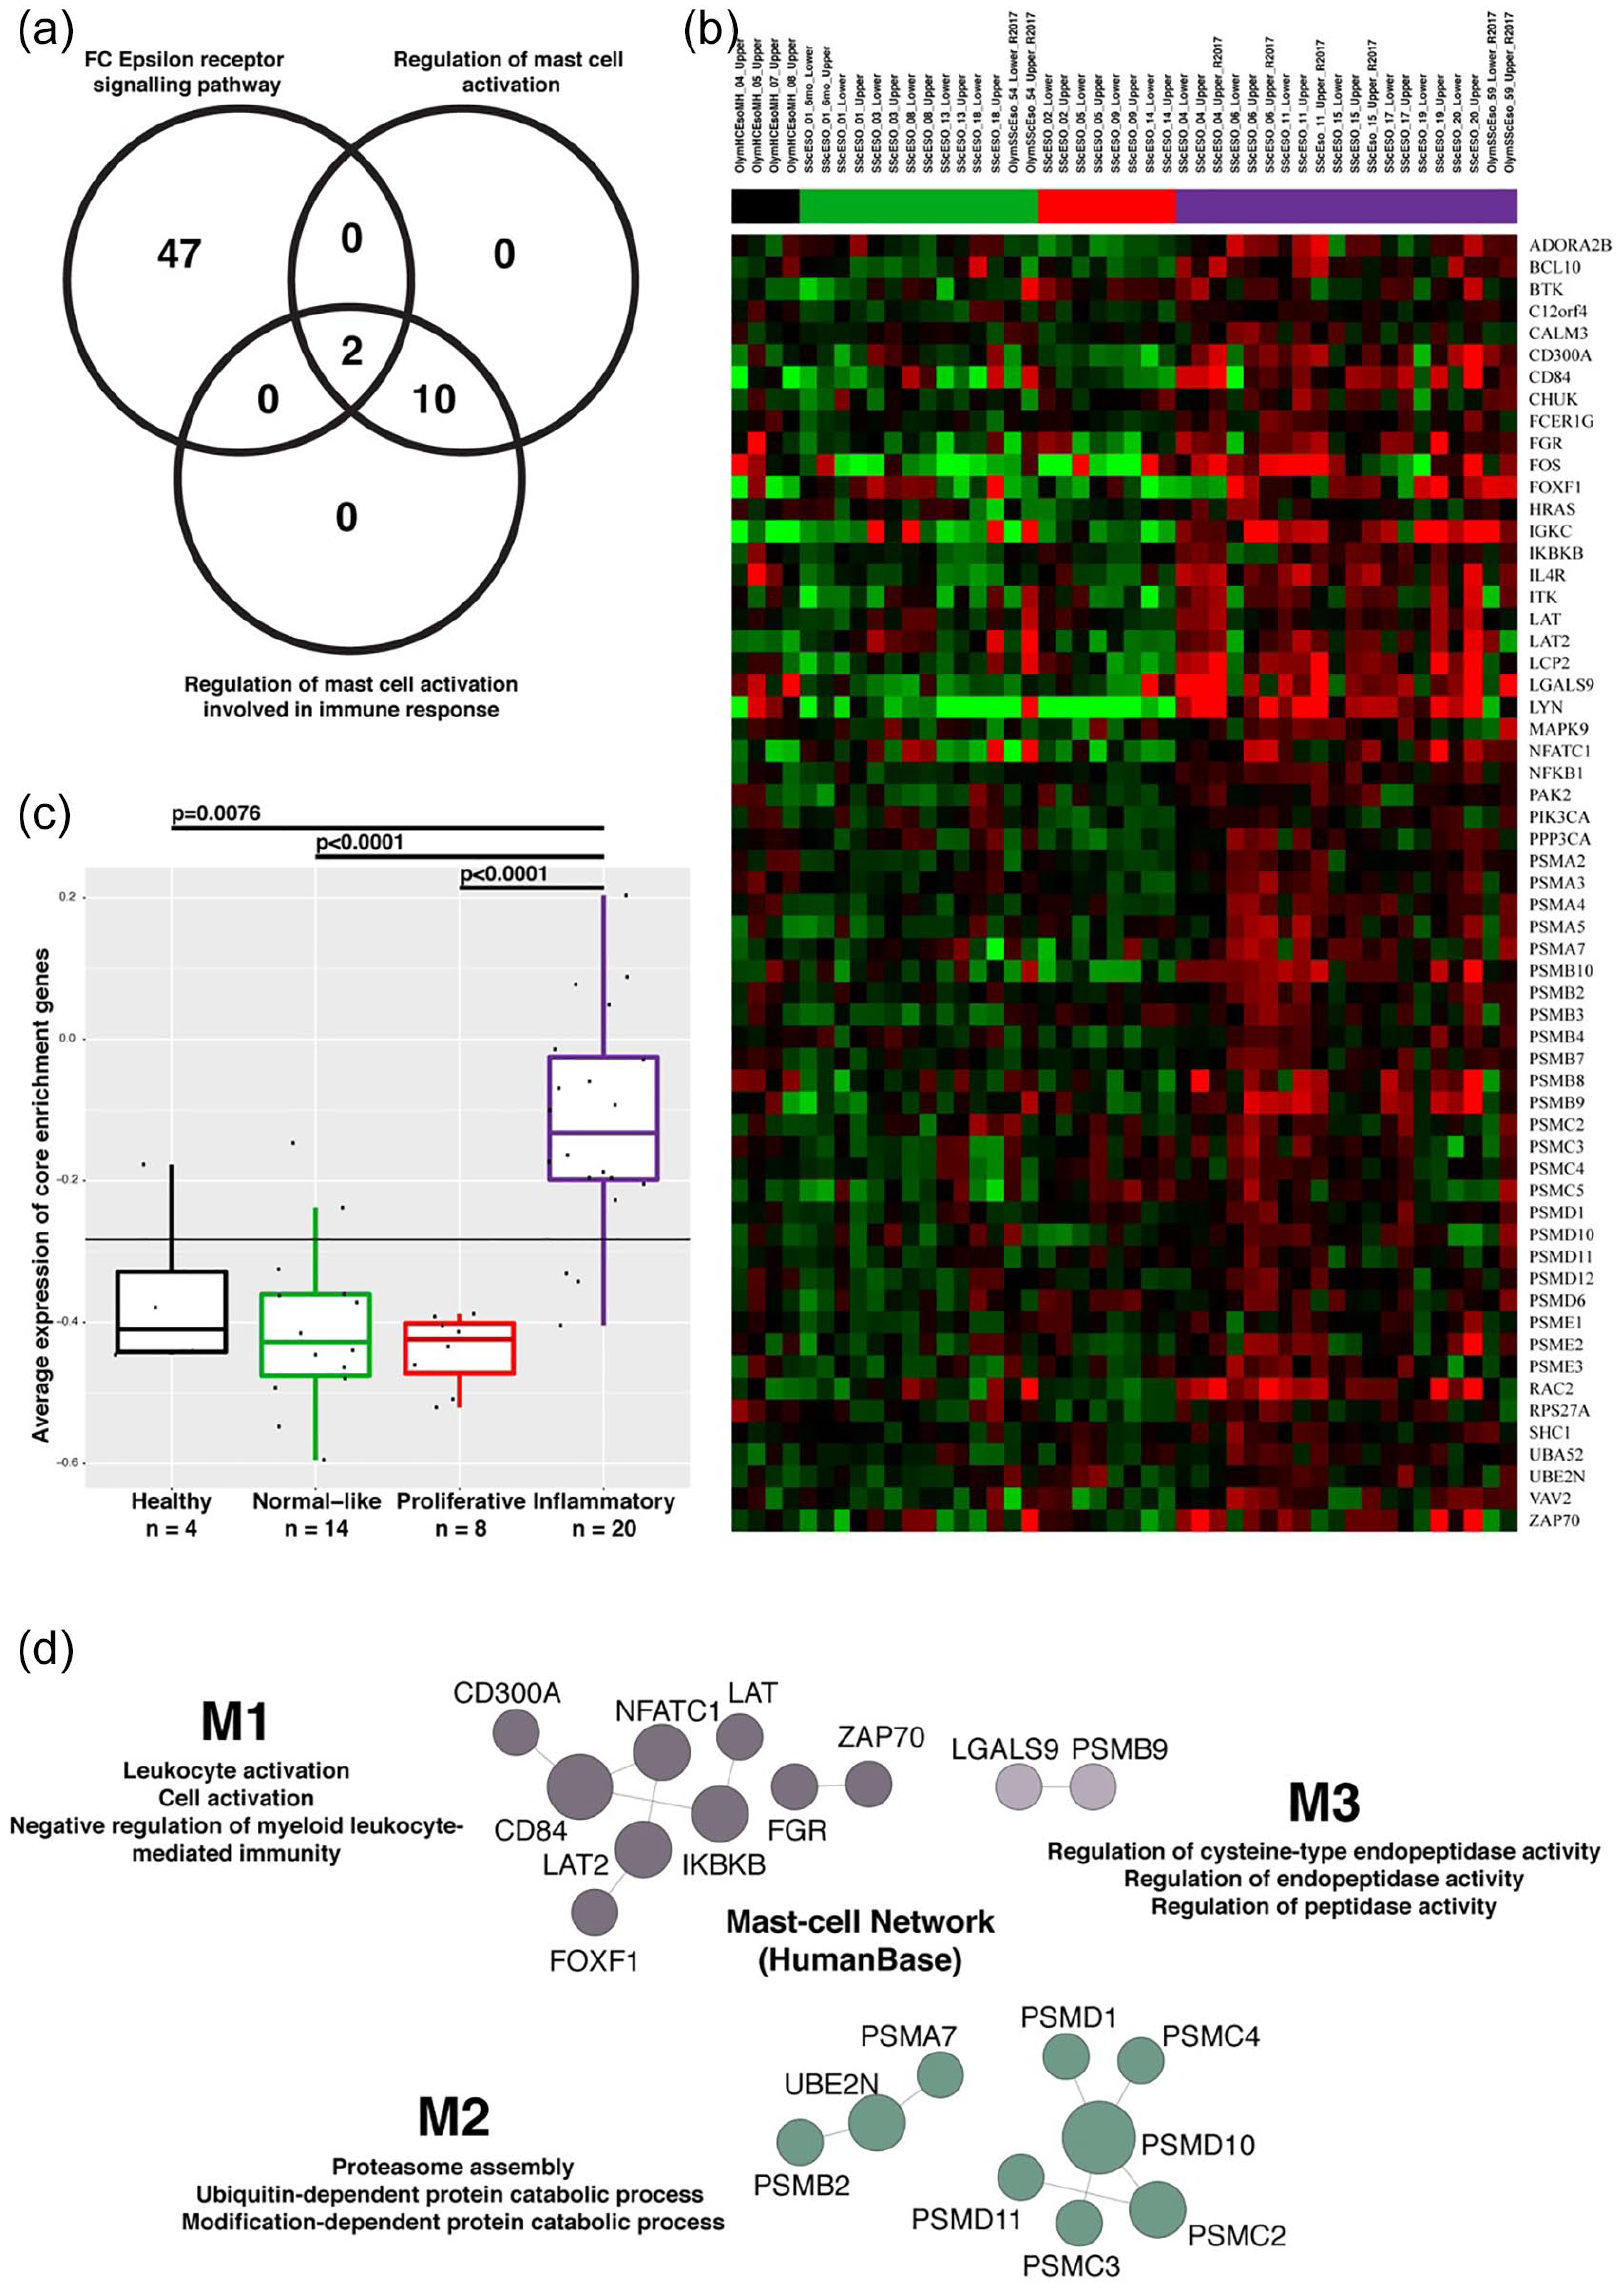
Core enrichment genes from the three mast cell–related pathways are enriched in inflammatory intrinsic subset (IS) patients. (a) Venn diagram illustrating the overlap of core enrichment genes from the three pathways. (b) Median-centered average expression of core enrichment genes that were present in mast cell–related significant pathways visualized as heatmap. (c) Expression of core enrichment genes was averaged per patient and plotted by intrinsic subset. A one-way ANOVA found that the means were different (p < 0.0001) between the four groups, and Tukey’s multiple comparisons test found that the expression of mast cell–related genes was significantly higher in the inflammatory IS compared to healthy participants (p = 0.0076) as well as in patients with SSc from normal-like (p < 0.0001) and proliferative (p < 0.0001) IS. (d) Core enrichment genes were visualized in the context of a mast cell network using HumanBase. M=module.
Discussion
Treatment options for SSc esophageal disease are limited and include proton pump inhibitors (PPIs); histamine receptor type 2 antagonists and alginates; lifestyle modifications, including avoidance of late meals and head of bed elevation; procedures such as esophageal dilation; and surgical intervention in rare cases.22–24 Our inability to prescribe agents that target SSc esophageal pathophysiology stems from our lack of understanding of the cell types and pathways underlying dysfunction. Herein, we quantified mast cells in proximal and distal esophageal mucosal biopsies from SSc patients and healthy participants and found similar mast cell numbers. However, we found a significant association between higher mast cell counts in both the upper esophagus and entire (upper + lower) esophagus and higher AET% on 24-h pH testing in SSc patients. We found that the expression of CD300A, FOXF1, LGALS9, PSMB9, PSMB2, PSMD1, and PSMC2, among many others involved in mast cell–related pathways, showed significant upregulation in the SSc patients classified in the inflammatory IS compared to normal-like and proliferative individuals. Specifically, cell activation, proteasome assembly, and regulation of endopeptidase activity were enriched in this mast cell–specific network. These results support additional research to determine whether mast cell–targeted treatments may be appropriate for a subset of SSc patients with treatment-resistant esophageal symptoms.
Mast cells are implicated in the disease pathogenesis of numerous autoimmune disease such as mast cell activation syndrome, mastocytosis, asthma, and EoE. Mast cells in EoE patients are of particular interest due to their role in producing cytokines (interleukin (IL)-4, IL-9, IL-13, TGF-β) that activate eosinophils and molecules (TGF-β, ET-1, IL-1β, IL-13, IL-17) that are important in tissue remodeling and fibrosis.25–27 In 2013, Niranjan et al. demonstrated a significant parallel increase in esophageal mast cells and eosinophils with associated colocalization in the lamina propria, quantified using toluidine blue staining and anti-major basic protein serum, respectively, 18–20 h after administration of various doses of intranasal Aspergillus fumigatus or normal saline. 28 Results of a recent study showed that in treated patients with histologically inactive EoE (defined as <15 eosinophils per high-power field), persistent esophageal dysmotility and endoscopic abnormalities were associated with increased mast cell numbers—further supporting a potential role for mast cells in esophageal diseases. 29
Results of several studies demonstrate more mast cells in skin biopsies from patients with SSc compared to healthy control participants, but mast cell quantities may vary with disease duration.6,8,30–32 Hawkins et al. 32 found increased mast cells only in clinically involved, but not in clinically uninvolved, skin of patients with early SSc (<3 years’ duration) compared to healthy participants, whereas patients with late-stage SSc (>3 years) demonstrated similar numbers of mast cells in both involved and uninvolved skin, comparable to healthy control skin. In contrast, Seibold et al. (1990) showed greater mast cell numbers in both the clinically involved and the “not-yet-involved” skin from eleven early- and eight late-stage SSc patients (mean ± SEM disease duration of 2.0 ± 0.23 and 6.6 ± 1.2, years, respectively) compared to seven healthy participants. 6 They suggested that increased mast cell numbers and degranulation may precede clinically apparent SSc dermal fibrosis, yet no association between mast cell numbers and severity of local SSc skin fibrosis or edema at the biopsy site was found. 6 A study by Hugle et al. with seven SSc patients (mean ± SD disease duration of 5.3 ± 4.0 years) showed that skin mast cells positively correlated with higher modified Rodnan skin score (mRSS) and more progressive disease (defined as increasing skin fibrosis and/or internal organ dysfunction in the year preceding skin biopsy) and SSc disease duration <3 years. 30 Thus, mast cells may be a marker of active SSc skin disease, but small sample sizes and the use of less specific stains for mast cells preclude a conclusive determination.33,34
Our study utilized the more modern tryptase staining method for mast cell identification. Tryptase granules comprise between 30%–40% of total protein content in the mast cell, enabling accurate histological identification.33,34 In addition, we applied semi-automated microscopy to the entire biopsy to quantify mast cell density as a measure of the diffuseness of inflammation compared to other SSc studies that used peak counts to quantify maximal severity. 6 With these methods, we did not identify a significant difference in mast cell numbers between SSc patients and healthy participants. Moreover, we did not find an association between esophageal mast cells and SSc disease duration nor mRSS, although our numbers are small. It is possible that only a subset of SSc patients have mast cell activation in the skin and/or esophagus, and it is these patients who might derive benefit from mast cell–targeted treatments.
Between 50% and 90% of SSc patients are shown to have esophageal abnormalities on HRM, which consists of 36 sensors placed 1 cm apart from the hypopharynx to the stomach. Insufficient clearance of esophageal contents and hypotensive lower esophageal sphincter pressure are characteristic of SSc patients. 35 We identified a significant correlation between mast cells counts and AET% in the proximal, but not distal, esophagus on 24-h esophageal pH testing. Given the propensity of gastroesophageal reflux disease (GERD) to affect the distal > proximal esophagus, we hypothesize that this finding may relate to referral bias (only 13/40 (33%) of SSc patients underwent pH testing), with only patients refractory to PPI and lifestyle modifications referred for testing. Another possibility is that PPIs may possibly affect distal > proximal esophageal histology, thereby lessening mast cell infiltration in the superficial mucosa we biopsied. A third possibility is that other inflammatory cell types (e.g. macrophages and lymphocytes), which were not stained for, are more responsive to increased AET% in the distal esophagus. Additional studies are needed to explain this finding.
We demonstrate for the first time a bonafide normal-like esophageal IS in SSc. In 2015, Taroni et al. identified inflammatory and proliferative gene expression signatures in 16 patients with SSc and 7 patients without SSc. 15 SSc patients demonstrated distinct inflammatory and proliferation gene expression signatures that were similar to the IS signatures that we previously identified in skin, but the small sample size precluded further characterization of the esophageal IS in five patients (12 biopsies), which we called the non-inflammatory group. 15 Of note, these gene expression signatures were shown to be independent of numerous traditional SSc markers including disease subtype, disease duration, serum autoantibodies, and mRSS. 15 Presently, our larger sample size enabled further characterization of the non-inflammatory SSc esophageal IS and identification of the normal-like group. It remains to be determined whether IS classification in skin and the esophagus is the same in an individual patient as we did not collect esophageal and skin biopsies simultaneously.
Our gene expression data show that esophageal biopsies from SSc patients have heterogeneous gene expression that can be attributed to a particular IS and deregulation of specific molecular pathways. Patients who are molecularly classified as belonging to the inflammatory IS showed a significantly upregulated mast cell signature when compared to either healthy participants or patients classified in the proliferative or normal-like IS. We were unable to determine whether esophageal mucosal mast cells are more numerous in patients classified in the inflammatory IS due to low numbers. However, inflammatory patients have been shown to have heightened immune response pathways, and this elevation likely involves an array of immune cells acting in unison—one of which, we have shown, is the mast cell.
With such far-reaching implications, investigating the role of mast cells in SSc disease pathogenesis is becoming more important. While we did not find a significant increase in mast cell numbers in esophageal mucosal sections, we identified an increased inflammatory gene expression signature that contains mast cell–related genes. It may be that increased mast cells are present in a subset of SSc patients, and flow cytometry, single-cell RNA-seq, or tissue CyTOF is required for precise quantification. Mast cell–targeting therapies have been explored in SSc patients. Various drugs including ketotifen, cromoglycate, and chymase inhibitors have demonstrated varying degrees of success in preventing and reversing effects of skin fibrosis in SSc patients; however, these drugs simply inhibit a specific mast cell receptor or stabilize skin mast cells.2,30,36,37 With mast cells becoming a greater subject of interest in SSc, mast cell–specific drugs for treatment of skin and/or esophageal disease should be contemplated.
Supplemental Material
Supplementary_Methods – Supplemental material for Mast cell activation in the systemic sclerosis esophagus
Supplemental material, Supplementary_Methods for Mast cell activation in the systemic sclerosis esophagus by Kevin Tom, Bhaven K Mehta, Aileen Hoffmann, Kathleen Aren, Mary Carns, Jungwha Lee, Viktor Martyanov, Dillon Popovich, Noelle Kosarek, Tammara A. Wood, Darren Brenner, Dustin A Carlson, Lorena Ostilla, Emma Willcocks, Paul Bryce, Joshua B Wechsler, Michael L Whitfield and Monique Hinchcliff in Journal of Scleroderma and Related Disorders
Supplemental Material
Supplementary_Tables_and_Figures – Supplemental material for Mast cell activation in the systemic sclerosis esophagus
Supplemental material, Supplementary_Tables_and_Figures for Mast cell activation in the systemic sclerosis esophagus by Kevin Tom, Bhaven K Mehta, Aileen Hoffmann, Kathleen Aren, Mary Carns, Jungwha Lee, Viktor Martyanov, Dillon Popovich, Noelle Kosarek, Tammara A. Wood, Darren Brenner, Dustin A Carlson, Lorena Ostilla, Emma Willcocks, Paul Bryce, Joshua B Wechsler, Michael L Whitfield and Monique Hinchcliff in Journal of Scleroderma and Related Disorders
Footnotes
Acknowledgements
The Editor/Editorial Board Member of JSRD is an author of this paper, therefore, the peer review process was managed by alternative members of the Board and the submitting Editor/Board member had no involvement in the decision-making process.
Declaration of conflicting interests
The author(s) declared the following potential conflicts of interest with respect to the research, authorship, and/or publication of this article: Paul Bryce is currently an employee of Sanofi-Regeneron, but his involvement in this study is exclusively related to his prior employment at Northwestern University. The remaining authors report no conflicts of interest.
Funding
The author(s) disclosed receipt of the following financial support for the research, authorship, and/or publication of this article: Research was supported by the National Institute of Arthritis and Musculoskeletal and Skin Diseases of the National Institutes of Health under Award Numbers K23 AR059763 (M.H.), R01 AR073270 (M.H.), P60 AR064464 (J.L.), and P30 AR072579 (J.L.), and National Center for Advancing Translational Sciences‘ Clinical and Translational Science Award Number UL1 TR000150 (J.L.). The content is solely the responsibility of the authors and does not necessarily represent the official views of the National Institutes of Health. The Scleroderma Research Foundation (M.H.) also supported this work.
Supplemental material
Supplemental material for this article is available online.
References
Supplementary Material
Please find the following supplemental material available below.
For Open Access articles published under a Creative Commons License, all supplemental material carries the same license as the article it is associated with.
For non-Open Access articles published, all supplemental material carries a non-exclusive license, and permission requests for re-use of supplemental material or any part of supplemental material shall be sent directly to the copyright owner as specified in the copyright notice associated with the article.