






Abstract
Studies of socio-spatial segregation in recent decades have shifted the focus from residential areas to people’s workplaces and other activity places. This study attempts to elucidate workplace segregation using cellular network data and to examine urban China with a special focus on the segregation of rural migrants, using residents living in the migrant enclaves of urban villages as a proxy. Furthermore, this study identifies factors that affect the variations of workplace segregation. The study shows that rural migrants who work in manufacturing industries and live in suburban areas suffer from higher workplace segregation from other social groups compared with those who work in service jobs and reside in the central-city areas, indicating that migrant enclaves in central-city areas play a significant role in housing rural migrants. It provides them with considerable access to service jobs and, thus, alleviates workplace segregation. Our results show that the use of big data can effectively capture the dynamics of population composition in activity places and provide a useful perspective for a deeper understanding of socio-spatial segregation.
Introduction
Socio-spatial segregation has been examined extensively in terms of people’s residential locations, mostly based on population census data. Recent studies have suggested that people experience segregation not only in residential locations but also in other activity places, such as workplaces (Ellis et al., 2004; Wang and Li, 2016). These studies generally conceptualize segregation based on residents’ exposure to different social groups in their activity places using activity or travel data sets. Because of the limited availability of large-quantity and widespread activity-travel data, these studies only use residential population as a proxy for the socio-economic composition in activity places (Wang and Li, 2016). This study aims to fill this research gap by using cellular network data, which can effectively capture the dynamics of the population composition in activity places at a finer spatial resolution. This study focuses on the segregation of workplaces between rural migrants and other social groups in urban China. Comprising that a considerable part of the urban population lives in Chinese cities (Chan, 2010), rural migrants’ experiences of segregation have evoked interest among researchers (e.g. He et al., 2010; Wu, 2016; Wu et al., 2013). Most of them have focused on the residential side, whereas the segregation of other out-of-home activity places, such as workplaces, remains to be explored.
In Chinese cities, most rural migrants are employed in manufacturing jobs or low-paid and low-skilled service jobs. There is a concern that the rural migrants may experience segregation in their workplaces and be deprived of opportunities of cross-group social interactions. Accordingly, this study examines the workplace segregation of rural migrants (employing residents in urban villages as a proxy) based on the cellular network data in Shenzhen. We examine to what extent rural migrants, who are already at risk of residential segregation, experience segregation from other social groups at their workplaces. We combine the cellular network data and built environment data to identify the migrant enclaves and the location of rural migrants as well as to measure their exposure to other social groups in their workplaces. In addition, this study attempts to identify the spatial variations and factors influencing workplace segregation.
Literature review
Segregation in activity places
Socio-spatial segregation in cities is a critical policy issue in many countries and has been examined for decades (Massey and Denton, 1988; Wong, 1993, 2003). In most studies, socio-spatial segregation has been conceptualized in terms of residential locations (the extent to which members of different social groups live apart) and operationalized by analyzing population distribution using census data. However, this conventional residential-based perspective of segregation may ignore the fact that people experience segregation not only in residential neighborhoods but also in other places of their daily activities, such as workplaces (Järv et al., 2015; Silm and Ahas, 2014; Tan et al., 2017). The residence locations of one group commonly become the employment locations of others, so workplace mixing need not track residential mixing because of commuting (Ellis et al., 2004).
Recently, residents’ exposure to different social groups in their activity places beyond residences has received scholarly attention. The underlying assumption is that the opportunities or probability of cross-group interactions and integration depend on the presence of people who belong to a different group in one’s activity space. A high exposure is associated with profound potential social interaction and minimal socio-spatial segregation. For example, Wong and Shaw (2011) proposed a measure of segregation that reflects the exposure of individuals to the populations of other groups that are found within the activity spaces of individuals. Krivo et al. (2013) measured and compared the exposure with the social environment in the activity spaces of different ethnic and income groups. Using travel diary data, Wang and Li (2016) examined the segregation between public and private housing residents in terms of activity space and exposure to people in their daily lives and affirmed that the public housing residents are more likely to be exposed to people similar to themselves compared with their private housing counterparts.
The aforementioned studies mostly used residential population as a proxy for the socio-economic composition in the activity places. The social environment that individuals are exposed to would be best characterized by the socio-economic composition of people who are present at one’s activity places, including people who are living, working, visiting, and performing other activities there (Wang and Li, 2016). However, most studies, to date, do not address the dynamics of the population composition in activity places, i.e. the population composition of the places that individuals are exposed to also varies from time to time.
Segregation of rural migrants in Chinese cities
In the past few decades, stratification in Chinese cities has been reinforced by market transition, leading to a wide range of marginal groups including laid-off workers, retired workers who could not benefit from the increasing provision of in-kind welfare, rural migrants, etc. (Wu, 2004). Among different groups of urban underclasses, rural migrants are considered to be most marginalized due to the persistence of hukou delineation in Chinese society. In China, all citizens’ personal hukou was categorized according to two related classifications: one by hukou type (agriculture or nonagriculture) and the other by residential location (local or nonlocal). This distinction between agricultural and nonagricultural status (equivalent to rural or urban residents) defined one’s relationship with the state and eligibility for an array of state-provided welfare, e.g. state-provided housing, employment, education, access to medical care, etc. (Chan, 2009). A person with nonagriculture hukou status was entitled to these benefits, making nonagricultural status highly desirable while agricultural status is relatively marginalized. In addition to the hukou type above, each person was also distinguished by whether he or she had or lacked a local hukou. The local hukou registration defines one’s eligibility for services in a specific locality, which excludes migrants from these benefits (Chan, 2009). In this context, the hukou delineation in Chinese society forms a structural source of discrimination against rural migrants who neither own nonagriculture hukou status nor are registered with a local hukou in their residing cities.
Rural migrant workers have been playing a significant role in the rapid urbanization of Chinese cities over the past three decades (Wu and Logan, 2016). Comprising a considerable part of urban population in Chinese cities (Chan, 2010), rural migrants create a high demand for housing. However, having been denied access to the housing, rural migrants have to seek shelters outside the formal rental market. Therefore, most rural migrants reside in so-called urban villages developed on the rural land encroached by urban built-up areas (Song and Zenou, 2012). The embeddedness of urban villages among the urban land has resulted from the city government’s partial expropriation of rural land for urban expansion and avoidance of the costly relocation of village settlements. The exemption of urban villages from urban development regulations allows local villagers to easily develop urban villages into extremely high-density settlements and to lease rooms to rural migrants who are denied access to urban housing (He, 2013). Therefore, urban villages have emerged as migrant enclaves that house many rural migrants who seek a new life in cities (Song and Zenou, 2012).
The rural migrants’ experiences of segregation associated with such migrant enclaves have evoked interest among researchers (Li and Wu, 2008; He et al., 2010; Liu et al., 2010; Wu, 2016; Wu et al., 2013; Zhao and Webster, 2011). While most extant studies focus on the residential side of urban villages and how they reinforce segregation, this study will take a step further by exploring whether rural migrants are also isolated in their workplaces. Most rural migrants in urban China are employed in low-paid and low-skilled service jobs (e.g. restaurants, cleaning, and hairdressing) or manufacturing jobs. Meanwhile, local residents or migrants with high socio-economic status tend to be employed in producer service jobs with higher pay. In most Chinese cities, low-paid and low-skilled manufacturing jobs tend to be located in suburban areas (especially the outer suburban areas). In addition, low-paid and low-skilled service jobs are distributed across the suburban and central-city areas (generally neighboring residential areas), and producer service jobs are concentrated in central-city areas. There is a concern that the rural migrants may experience segregation in their workplaces, which may be very crucial in assessing social inclusion since a large proportion of the social interactions (especially the cross-group interaction) takes place in the residents’ workplaces.
Analytical framework
To fill the gaps in the existing literature as discussed above, this study attempts to apply cellphone big data to investigate workplace segregation of rural migrants in urban China, focusing on how individuals are exposed to different social groups. The following sections will discuss the rationale and methodology for measuring workplace exposure using cellphone big data.
Rationale of using cellphone big data in measuring workplace segregation
The exposure to social groups in residential places (Figure 1(a)) has been studied extensively (e.g. Wong, 1993), but it ignores the fact that people also experience segregation in other activity places, such as workplaces. Recently, researchers, such as Wang and Li (2016), explored exposure in workplaces using activity-travel diaries (to measure activity space) and the population census (to measure the social context). Nonetheless, studies to date mostly conceptualize the social environment that individuals are exposed to in terms of residential population based on census data, and they do not address the dynamics of the population composition (Figure 1(b)). For example, further examination of residents’ exposure to different social groups during working time in their workplaces is necessary.
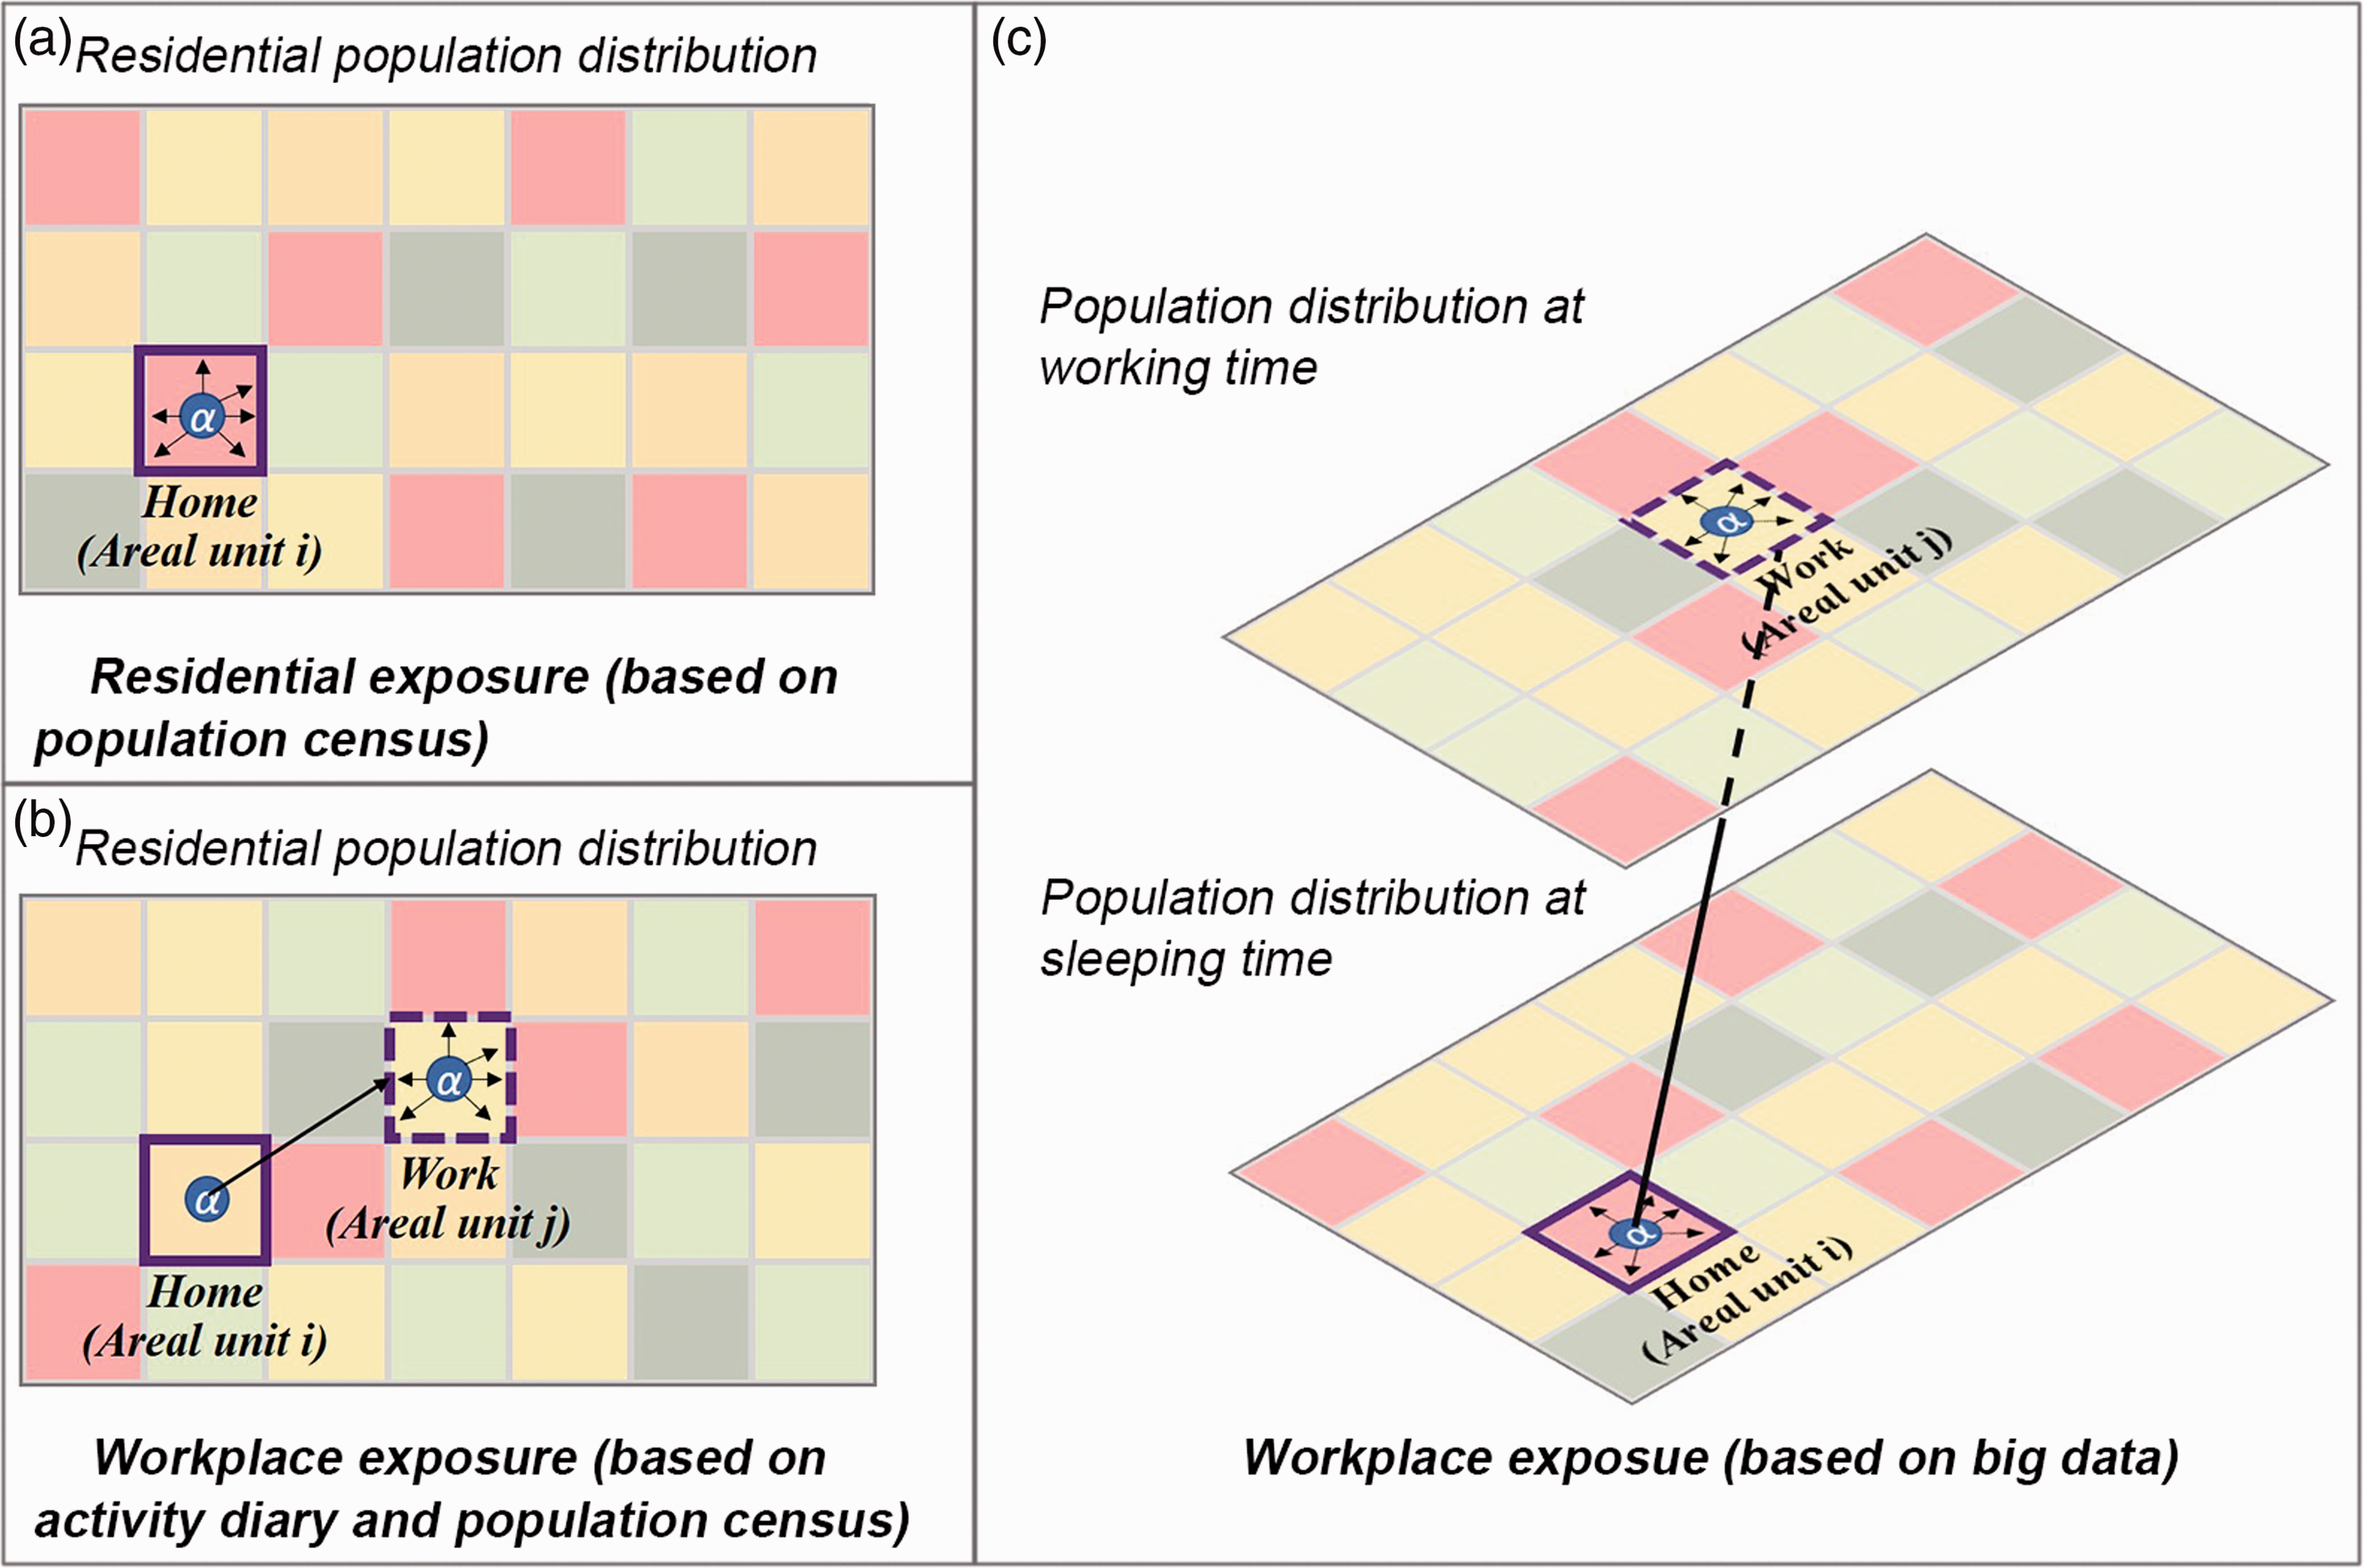
Conceptual diagram of residential and workplace segregation.
The use of big data can characterize the social environment that individuals are exposed to using the socio-economic composition of people who are present at one’s activity places, including people who are living, working, visiting, and performing other activities. The usage of big data represents the population distribution at different time and captures the dynamics of the population composition in a social context. For example, activities during sleeping time are associated with residential population, whereas those during working time are associated with employment population (Figure 1(c)).
Methodology of measuring exposure
This section illustrates the methods of measuring the residential and workplace exposure. For illustration purposes, only two groups are assumed to be present in the study area. These two groups are denoted as groups x and y, respectively. Initially, we calculate the group proportion in each areal unit as the residential place and workplace to measure the aggregated spatial manifestation of social groups. The proportion of social group x and group y in areal unit i as the residential place (Figure 1(c)) is denoted as follows, respectively
As for the workplace exposure, individuals in an areal unit may commute to many different areal units with different social group compositions. Therefore, the workplace exposure of an areal unit is represented by the average individual workplace exposure of residents living in this areal unit.
Let there be an individual α who belongs to group x, lives in areal unit i, and works in areal unit
Similarly, let there be an individual β who belongs to group y, lives in areal unit i, and works in areal unit
Case study
Research area and data
The research area of this study is Shenzhen, a rapidly urbanizing city located in the southern part of China (Figure 2). In Shenzhen, the ratio of local residents to migrants is approximately 1:3 (Shenzhen Statistics Bureau, 2012). Urban villages are located in the central-city and suburban areas of the city (Figure 2).
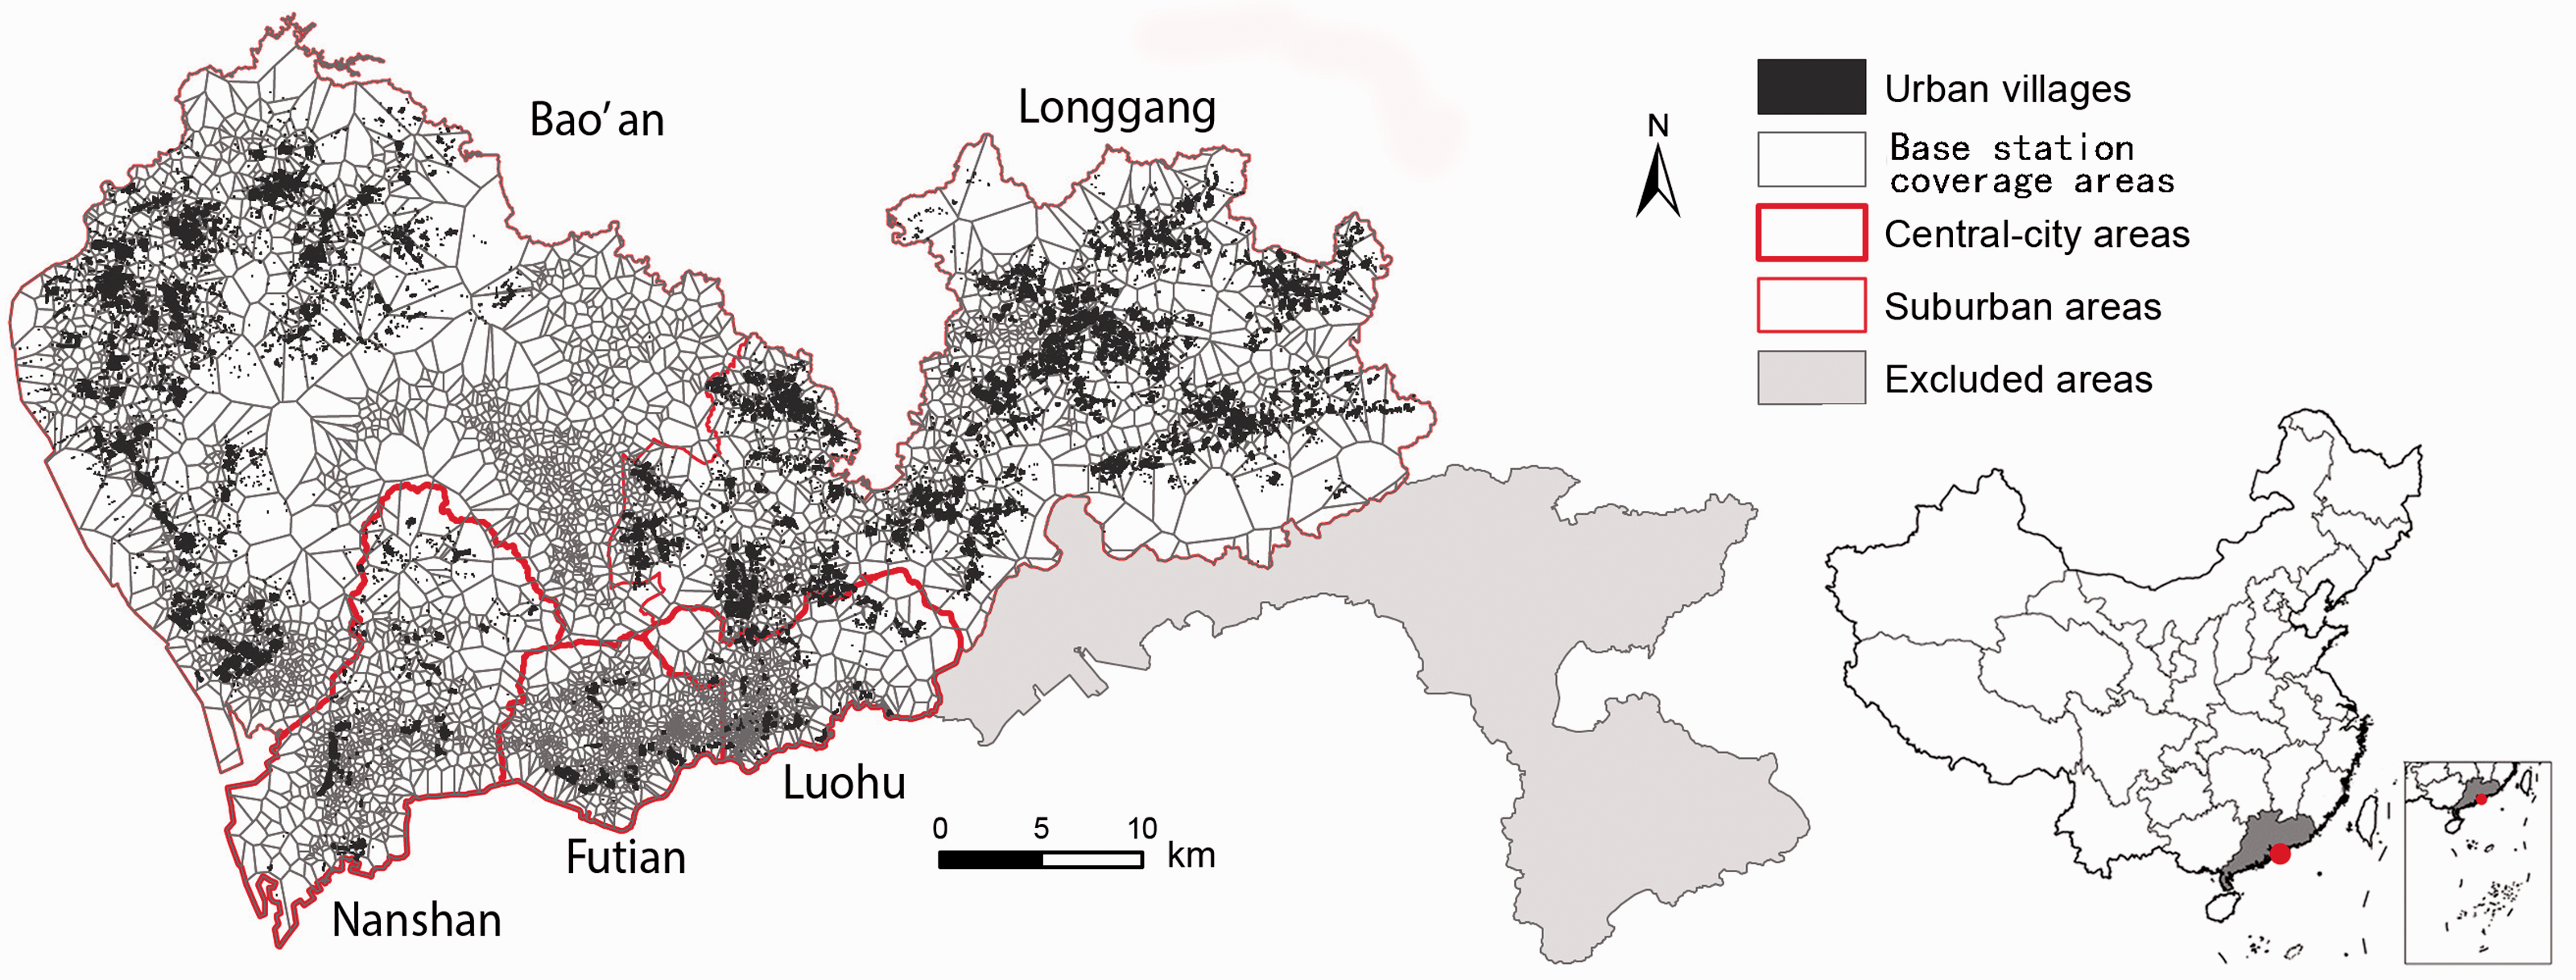
Study area.
The cellular network data include more than 12.4 million residents in Shenzhen. The data were recorded on Friday 23 March 2012 by a major cellphone operator with around 76.8% share of Shenzhen’s cellphone market. Consequently, cellphone users represent a large proportion of the entire population in Shenzhen. The cellular network data included an anonymized ID of each cellphone user, the timestamp, and coordinates of the base transceiver stations that provided the cellular network service. The locations of cellphone users were recorded to detect the locations of the cellphones.
Urban-village residents as a proxy for rural migrants
In this study, we identify rural migrants as those living in urban villages. To justify that the urban-village residents are a good proxy for rural migrants, we provide statistical evidence of the proportion of migrants and agriculture hukou holders (equivalent to rural residents) within urban villages as well as other residential neighborhoods.
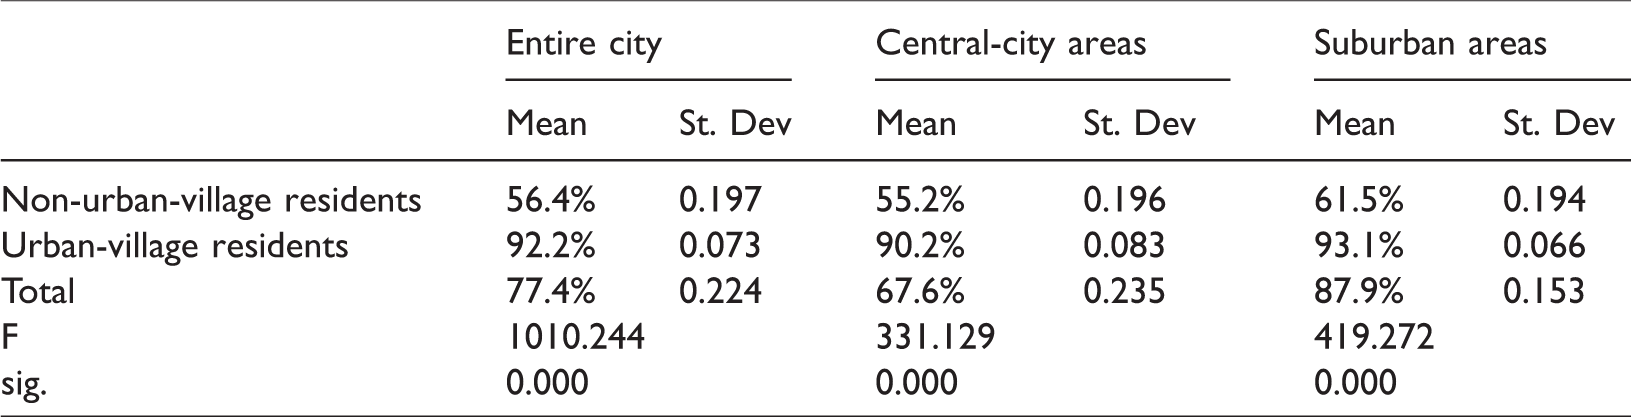
We first make use of the 2010 census data to summarize the average percentage of migrants within each residential committee (equivalent to neighborhood) in Shenzhen. As shown in Table 1, migrants constitute 77.4% of the total population on average. Among the non-urban-village and urban-village residents, migrants account for 56.4 and 92.2%, respectively. The ANOVA test shows that the average migrant percentage among urban-village residents is significantly larger than its non-urban-village counterpart at a 99% confidence level. In light of the difference between central-city and suburban areas, the results show that the average migrant percentage among urban-village residents is 90.2% in central-city areas and 93.1% in suburban areas, both of which are significantly larger than their non-urban-village counterparts at a 99% confidence level. This statistical finding indicates that migrants form the overwhelming majority in urban villages of Shenzhen.
Percentage of migrants according to 2010 census.
Due to the limited availability of residential-committee level census data, we turn to open data from China Family Panel Studies (CFPS), a nationwide survey conducted in 2010 by Peking University (Xie and Hu, 2014), to summarize the proportion of agriculture hukou holders within urban villages and other residential neighborhoods. The CFPS used multistage probability proportional to size sampling with implicit stratification as a better representation of Chinese society at a lower cost (Xie and Hu, 2014). We utilize the subsample from urban areas of Guangdong province (where Shenzhen is located) to examine the proportion of agriculture hukou holders. As shown in Table 2, agriculture hukou holders constitute 50.1% of all respondents. For the respondents living in urban villages and other urban neighborhoods, agriculture hukou holders account for 87.2 and 26.8%, respectively, indicating that rural residents constitute the overwhelming majority in urban villages, while they are much less likely to reside in other urban neighborhoods. A Chi-square test shows a significant and strong association between urban-village residents and agriculture hukou holders.
Percentage of agriculture hukou holders according to CFPS-2010 data.
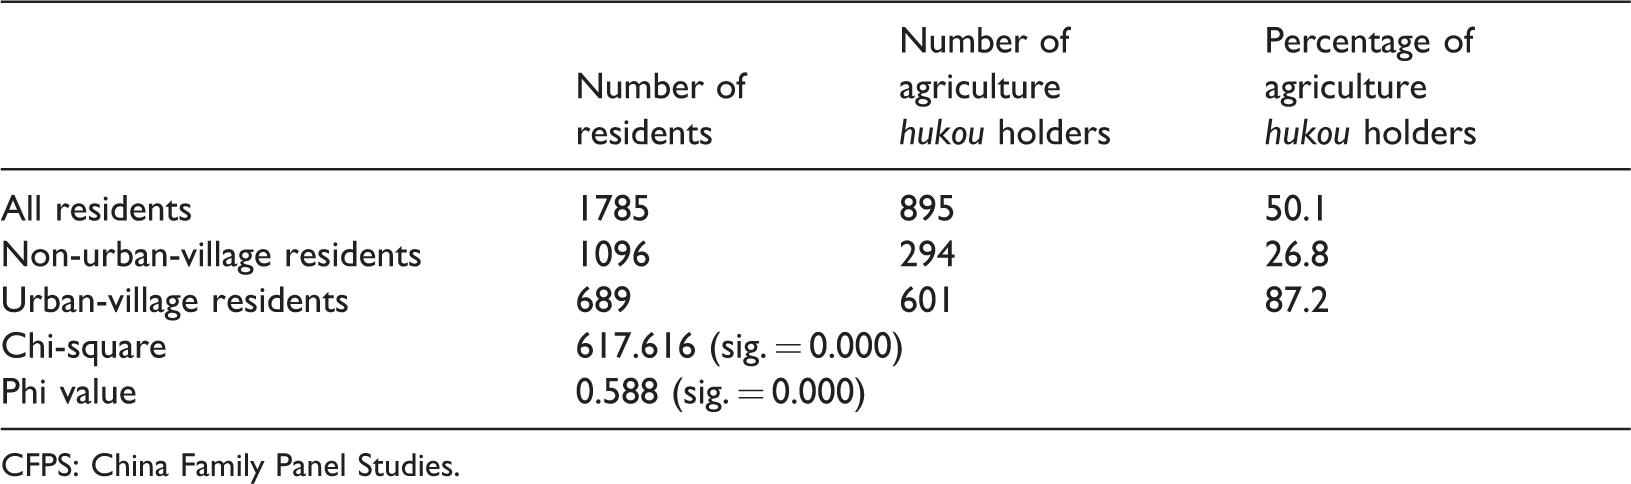
CFPS: China Family Panel Studies.
These results verify the observation that urban villages are overwhelmingly populated by rural residents as well as migrants. Therefore, there is a very high probability that urban-village residents are rural-to-urban migrants, while residents living in other urban neighborhoods should belong to other social groups. Although there are also some newly graduated college students, white-collar employees, and employees of service sectors living in urban villages in Shenzhen and other Chinese cities as suggested by previous studies (e.g. Hao et al., 2009; Liu et al., 2010), we still consider urban-village residents as a good proxy of rural migrants due to the dominating proportion of rural migrants in urban villages evidenced by the census and CFPS data.
Identification of rural migrants and other social groups from the cellular network data
The original cellphone location records of one cellphone user were represented by a spatio-temporal sequence of triples (
In this study, we identify rural migrants based on whether a cellphone user lives in one of the urban villages. The residences of cellphone users are inferred from the cellular network data. If one cellphone user stayed at one base station coverage area with a duration longer than the threshold during sleeping time, then that base station coverage area was inferred as the residence of that cellphone user. The average size of the base station coverage areas was 0.28 square kilometers (standard deviation = 0.58 square kilometers). The base station coverage areas were classified into urban villages and other neighborhoods according to the building information data. If more than 80% of the residential floor area belonged to urban villages, then that base station coverage area was classified into urban villages. If more than 80% of the residential floor area belonged to neighborhoods other than urban villages, then this coverage area was classified as “other neighborhoods.” Residents residing in urban villages and other neighborhoods were then inferred as rural migrants and other social groups (i.e. local residents or migrants with high socio-economic status), respectively.
Similarly, the workplaces of the cellphone users were identified. If a cellphone user had the cellular network records stay in one base station service area with a duration of not less than the threshold during typical working time, then that base station service area was identified as the workplace of that cellphone user. The workers with residences and workplaces in the same base station service area were excluded because they might be retirees, housewives, or students. In this manner, the workplaces of the resident workers were identified.
The residences and workplaces of 296,796 rural migrants and 581,731 residents of other groups were identified from the cellular network data. The number of identifiable workers was smaller than the statistical data because this study mainly focused on the workers with certain identifiable residences and workplaces in the main built-up areas. The total number of rural migrants and other social groups inferred from the cellular network data was about 77.5% of all the identifiable workers given that this study mainly focused on the identifiable rural migrants and other social groups with 80% confidence.
Linear regression analysis
Linear regression analysis was employed to examine the influencing factors of segregation between rural migrants and other social groups in the working activity places. The sample for linear regression analysis is the areal unit, which is defined as a 1 kilometer grid cell. There are 350 grids in total in the study area, and therefore the number of observations for the regression model is 350. The dependent variable of the model is the workplace exposure, whereas the independent variables include Indu% in the workplaces and locations of the workplaces. Indu% represents the proportion of the industrial floor area to the total employment use floor area calculated by the building information data, which includes the function and floor area of each building (Figure 3). The Indu% in the workplaces for a certain grid is calculated based on equations (10) and (11).
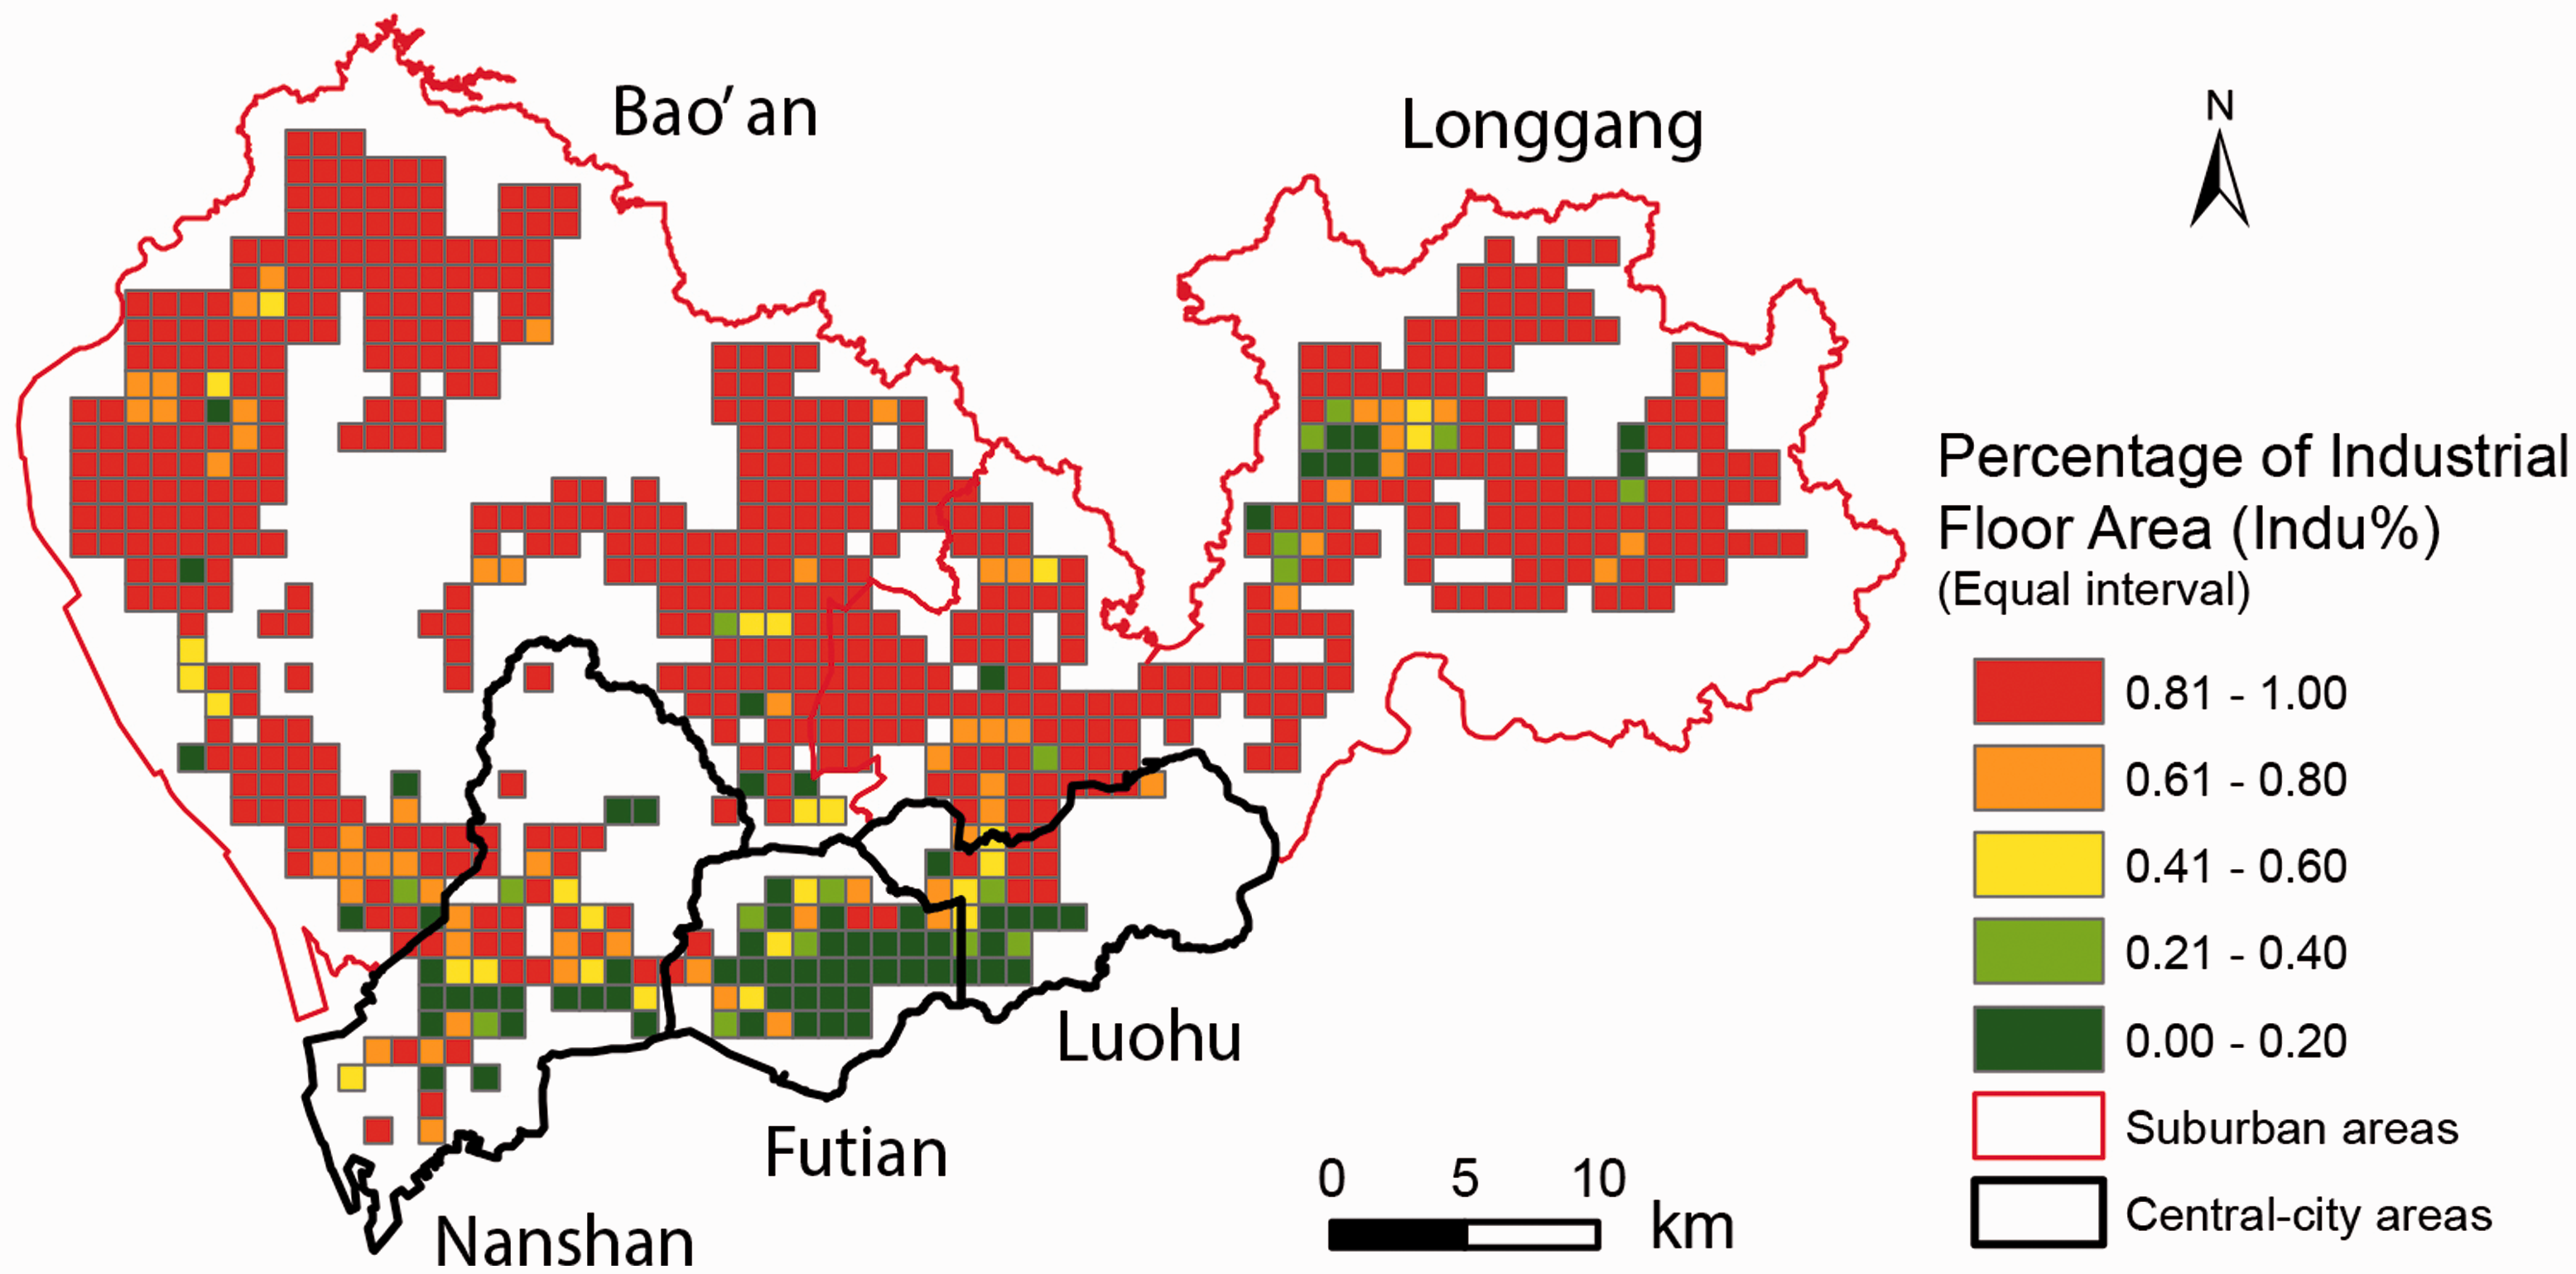
Percentage of the industrial floor area out of the total employment use floor area (Indu%).
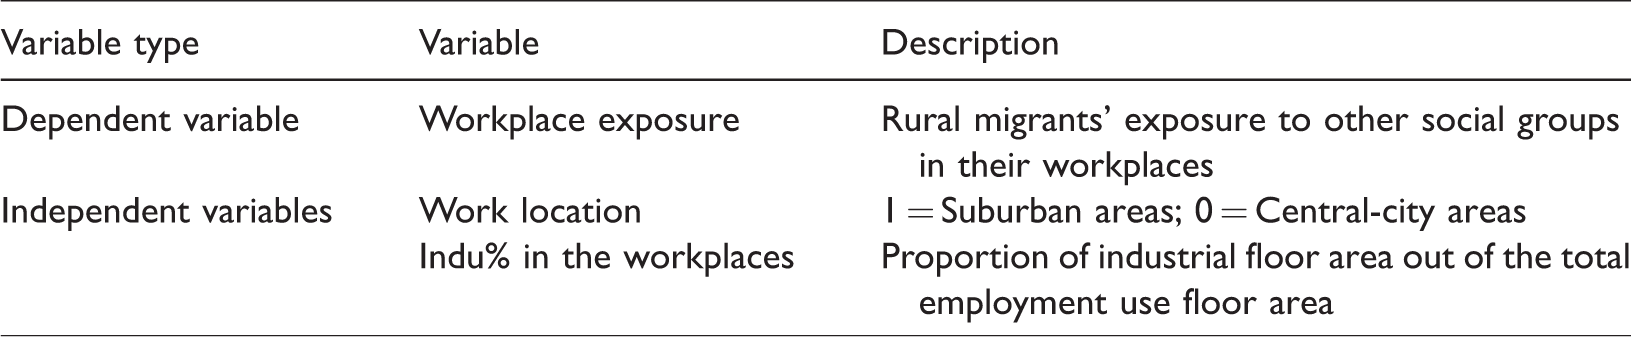
We assume that Indu% in the workplaces is associated with the workplace exposure due to the differentiation in the labor market for rural migrants and other groups, as well as the geographic distribution of job opportunities. Buildings with industrial function were classified as the workplaces of industrial-sector workers. If rural migrants are employed in manufacturing jobs in suburban areas, they are less likely to be exposed to local residents or migrants with high socio-economic status mostly employed in high-pay and high-skill service jobs in central-city areas, and vice versa. Our need for another variable to address the different effects of suburban service jobs and central-city service jobs on workplace exposure is worthy of note. During the working hours, the local residents and the migrants with high socio-economic status tend to be agglomerated in the central-city areas (as their jobs are mostly located in the central-city areas) whereas the suburban areas tend to be dominated by rural migrants. Consequently, rural migrants employed in suburban service jobs may experience lower workplace exposure to other groups than those in the central-city service jobs. Therefore, we incorporate the variable of work location in the model and assume that, among the service-sector employees, those working in suburban areas may experience low workplace exposure. For a certain grid, residents can either work in central-city areas or suburban areas. In this study, we found that among the 350 grids, there are 328 grids where residents are mostly (i.e. greater than 95%) employed in the suburban areas, and 20 grids where residents are mostly (i.e. greater than 95%) employed in the central-city areas, while there were only 2 grids with a mixed composition (i.e. 50.0 and 52.6% of the residents in these grids are employed in the suburban areas, respectively). This can be explained by the fact that an overwhelming proportion of residents in the central-city areas of Shenzhen work within the central-city areas, and, similarly, a dominating proportion of residents in the suburban areas of Shenzhen work within the suburban areas (as revealed by the cellular network data, see Table 3). Therefore, a binary variable is appropriate to determine residents’ work locations, with 1 representing suburban areas and 0 representing central-city areas. Table 4 lists the variables in the linear regression models.
The percentages of outgoing work trips among the five districts in Shenzhen.
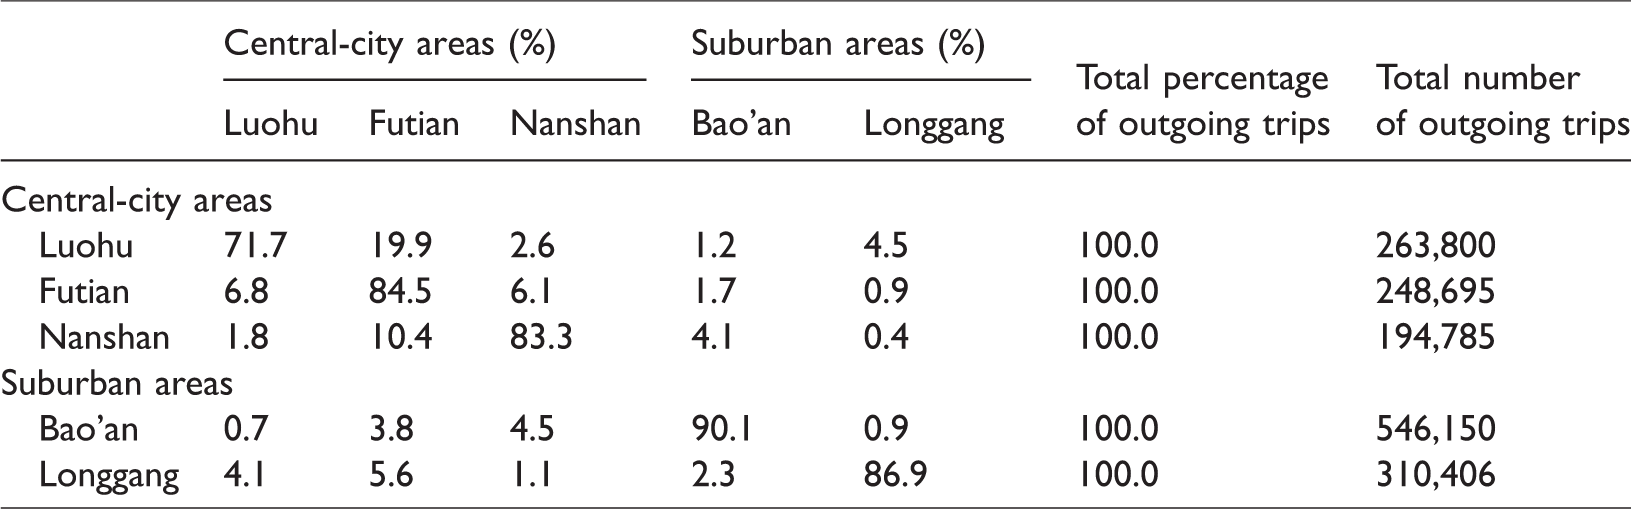
The variables in the linear regression model.
Statistics of the Quadrant-I and Quadrant-IX grids in the central-city and suburban areas.

Results
Residential and workplace exposure of rural migrants
We define the areal unit as a 1 kilometer grid cell because 1 kilometer is recognized as an acceptable walking distance (Van den Berg et al., 2015), and therefore, more likely to facilitate social interaction. The rural migrants’ residential exposure to other social groups such as local residents in each grid is calculated based on equation (5) (by denoting rural migrants as group x). Figures 4(a) displays the residential exposure of rural migrants, which shows that the residences of rural migrants are largely located in the suburban areas with others in the central-city areas. Similarly, rural migrants’ workplace exposure to other social groups from each grid is calculated based on equation (8), and displayed in Figure 4(b). Rural migrants’ exposure to other social groups in residences and workplaces is significantly higher in the central-city areas and certain parts of the inner-suburb areas than in other locations, especially for workplace exposure.
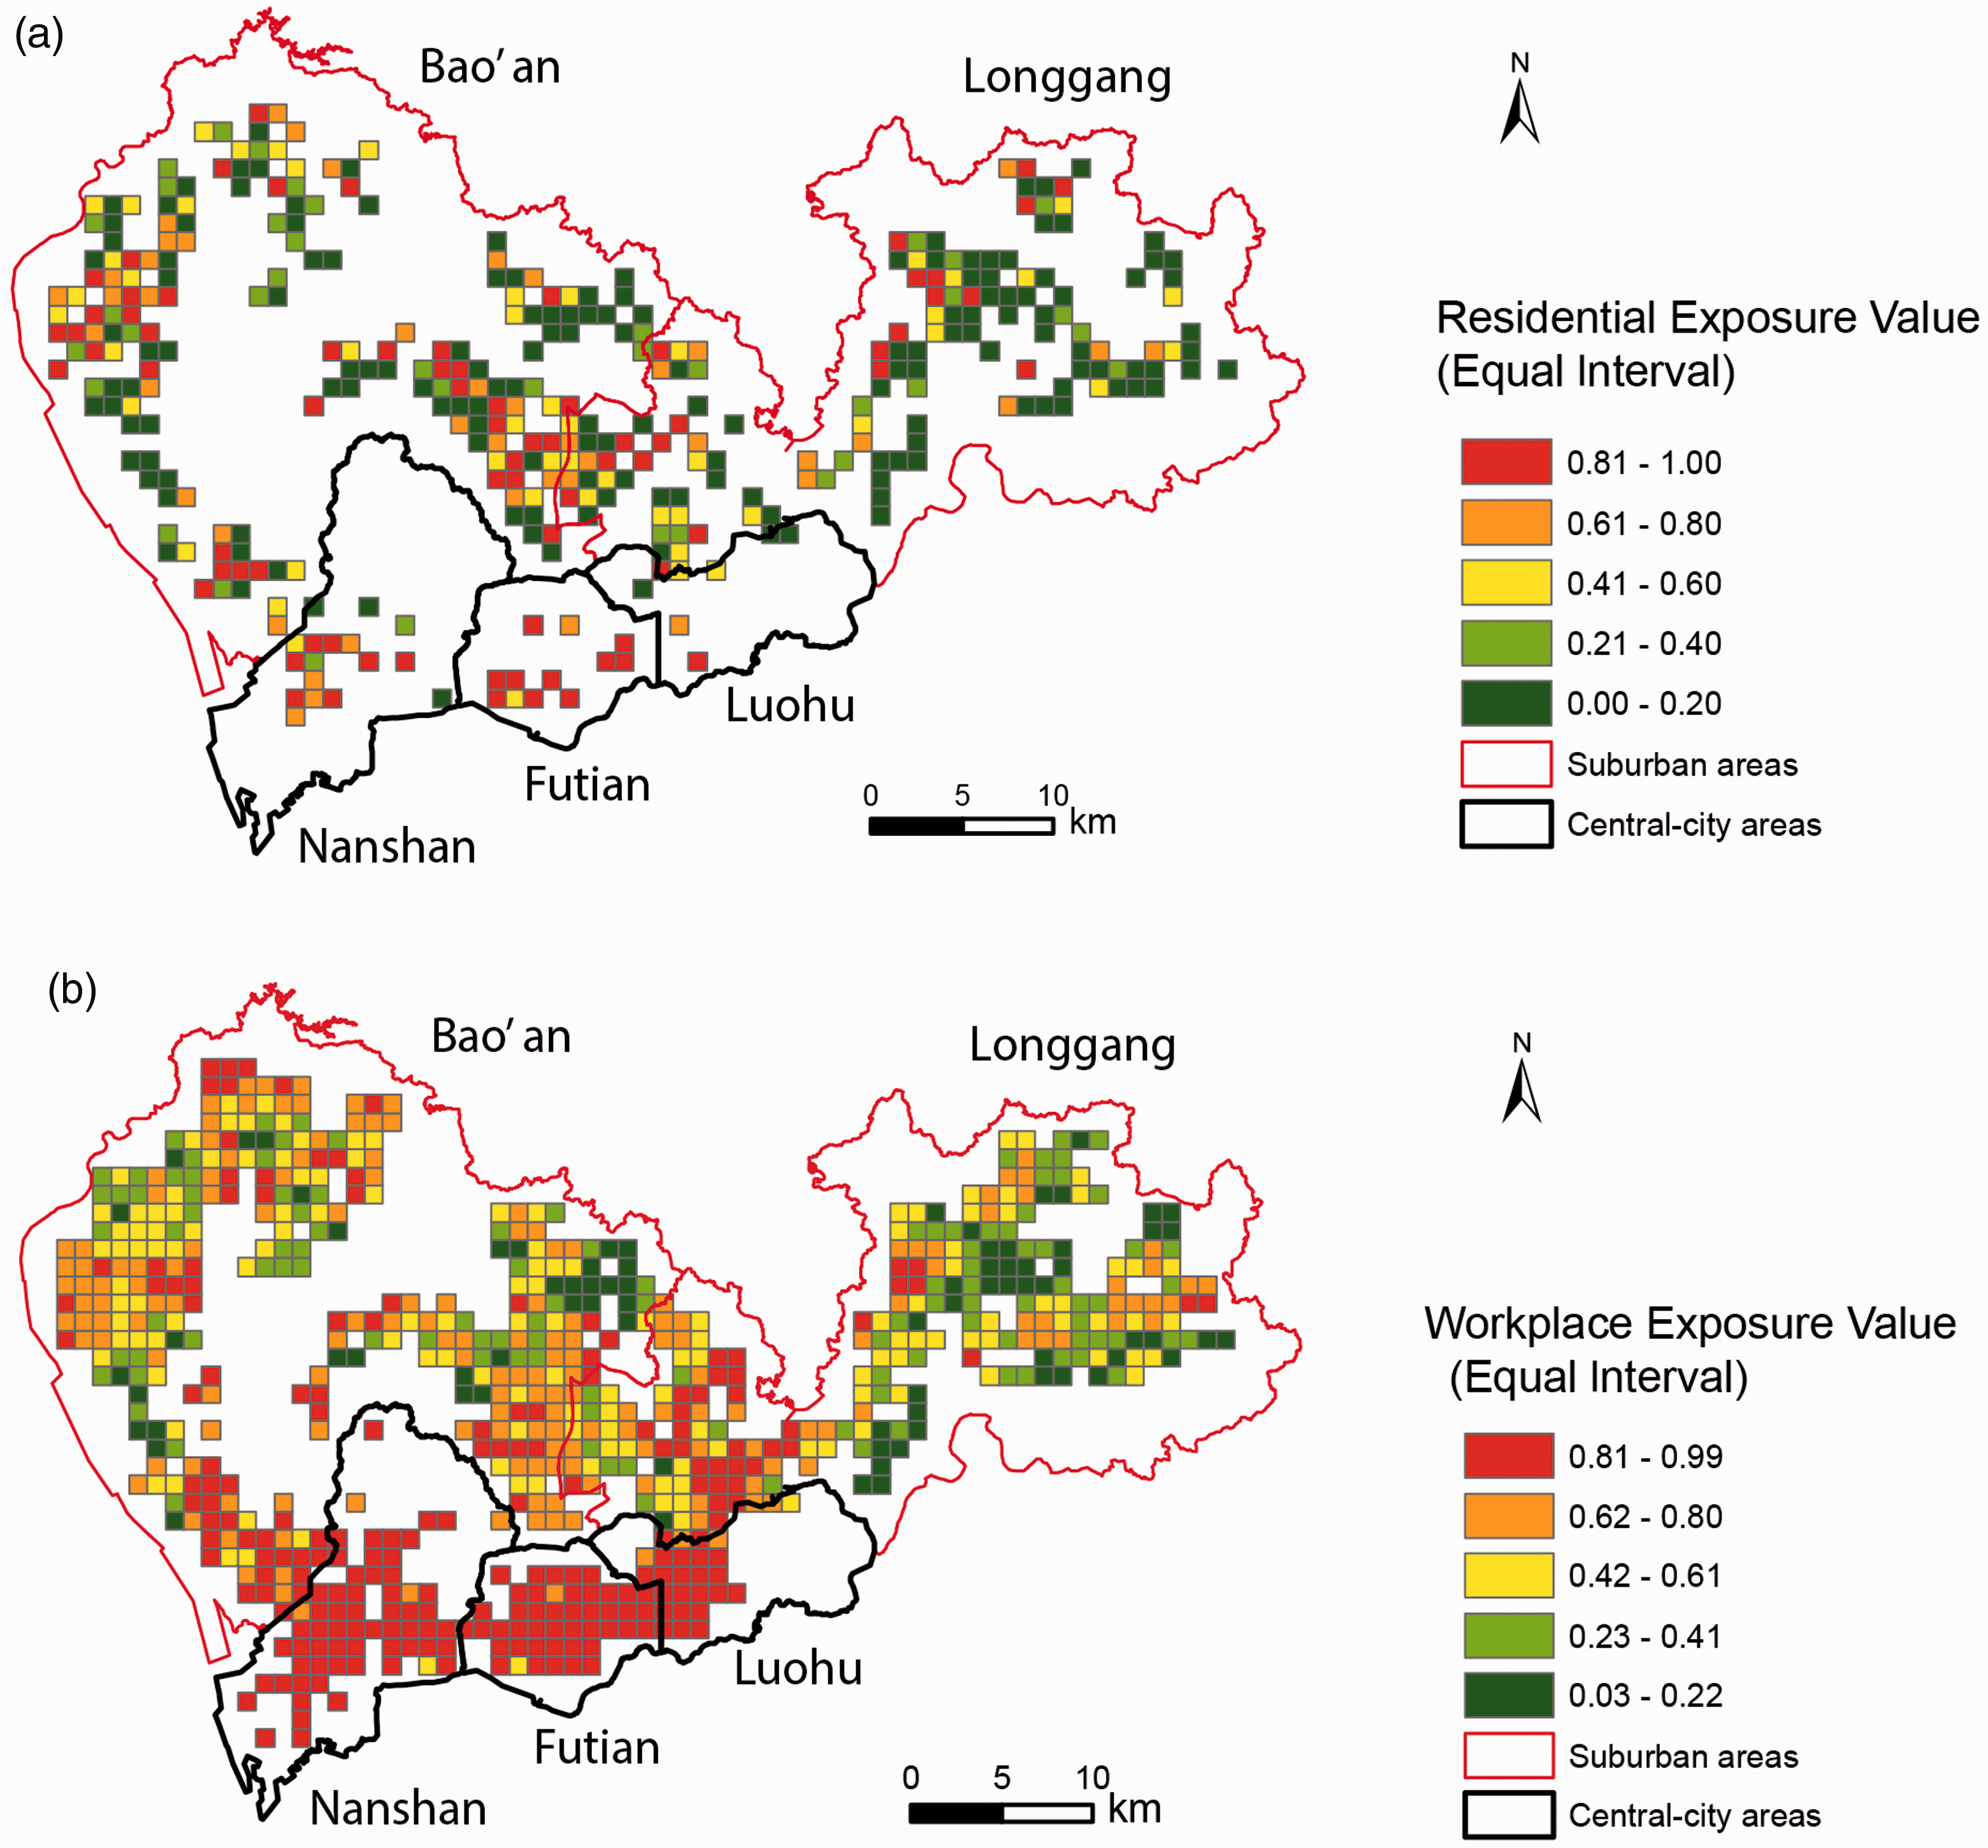
Residential exposure (a) and workplace exposure (b) of rural migrants to other social groups.
Figure 5(a) illustrates the distribution of residential and workplace exposure. For residential exposure, a large number of urban-village residents have nearly no exposure to the formal-housing residents, which is consistent with our hypothesis that the urban-village residents are at high risk of isolation at their residential places. Compared with residential exposure, the frequency distribution of workplace exposure seems to be more dispersed without the concentration on the zero value.
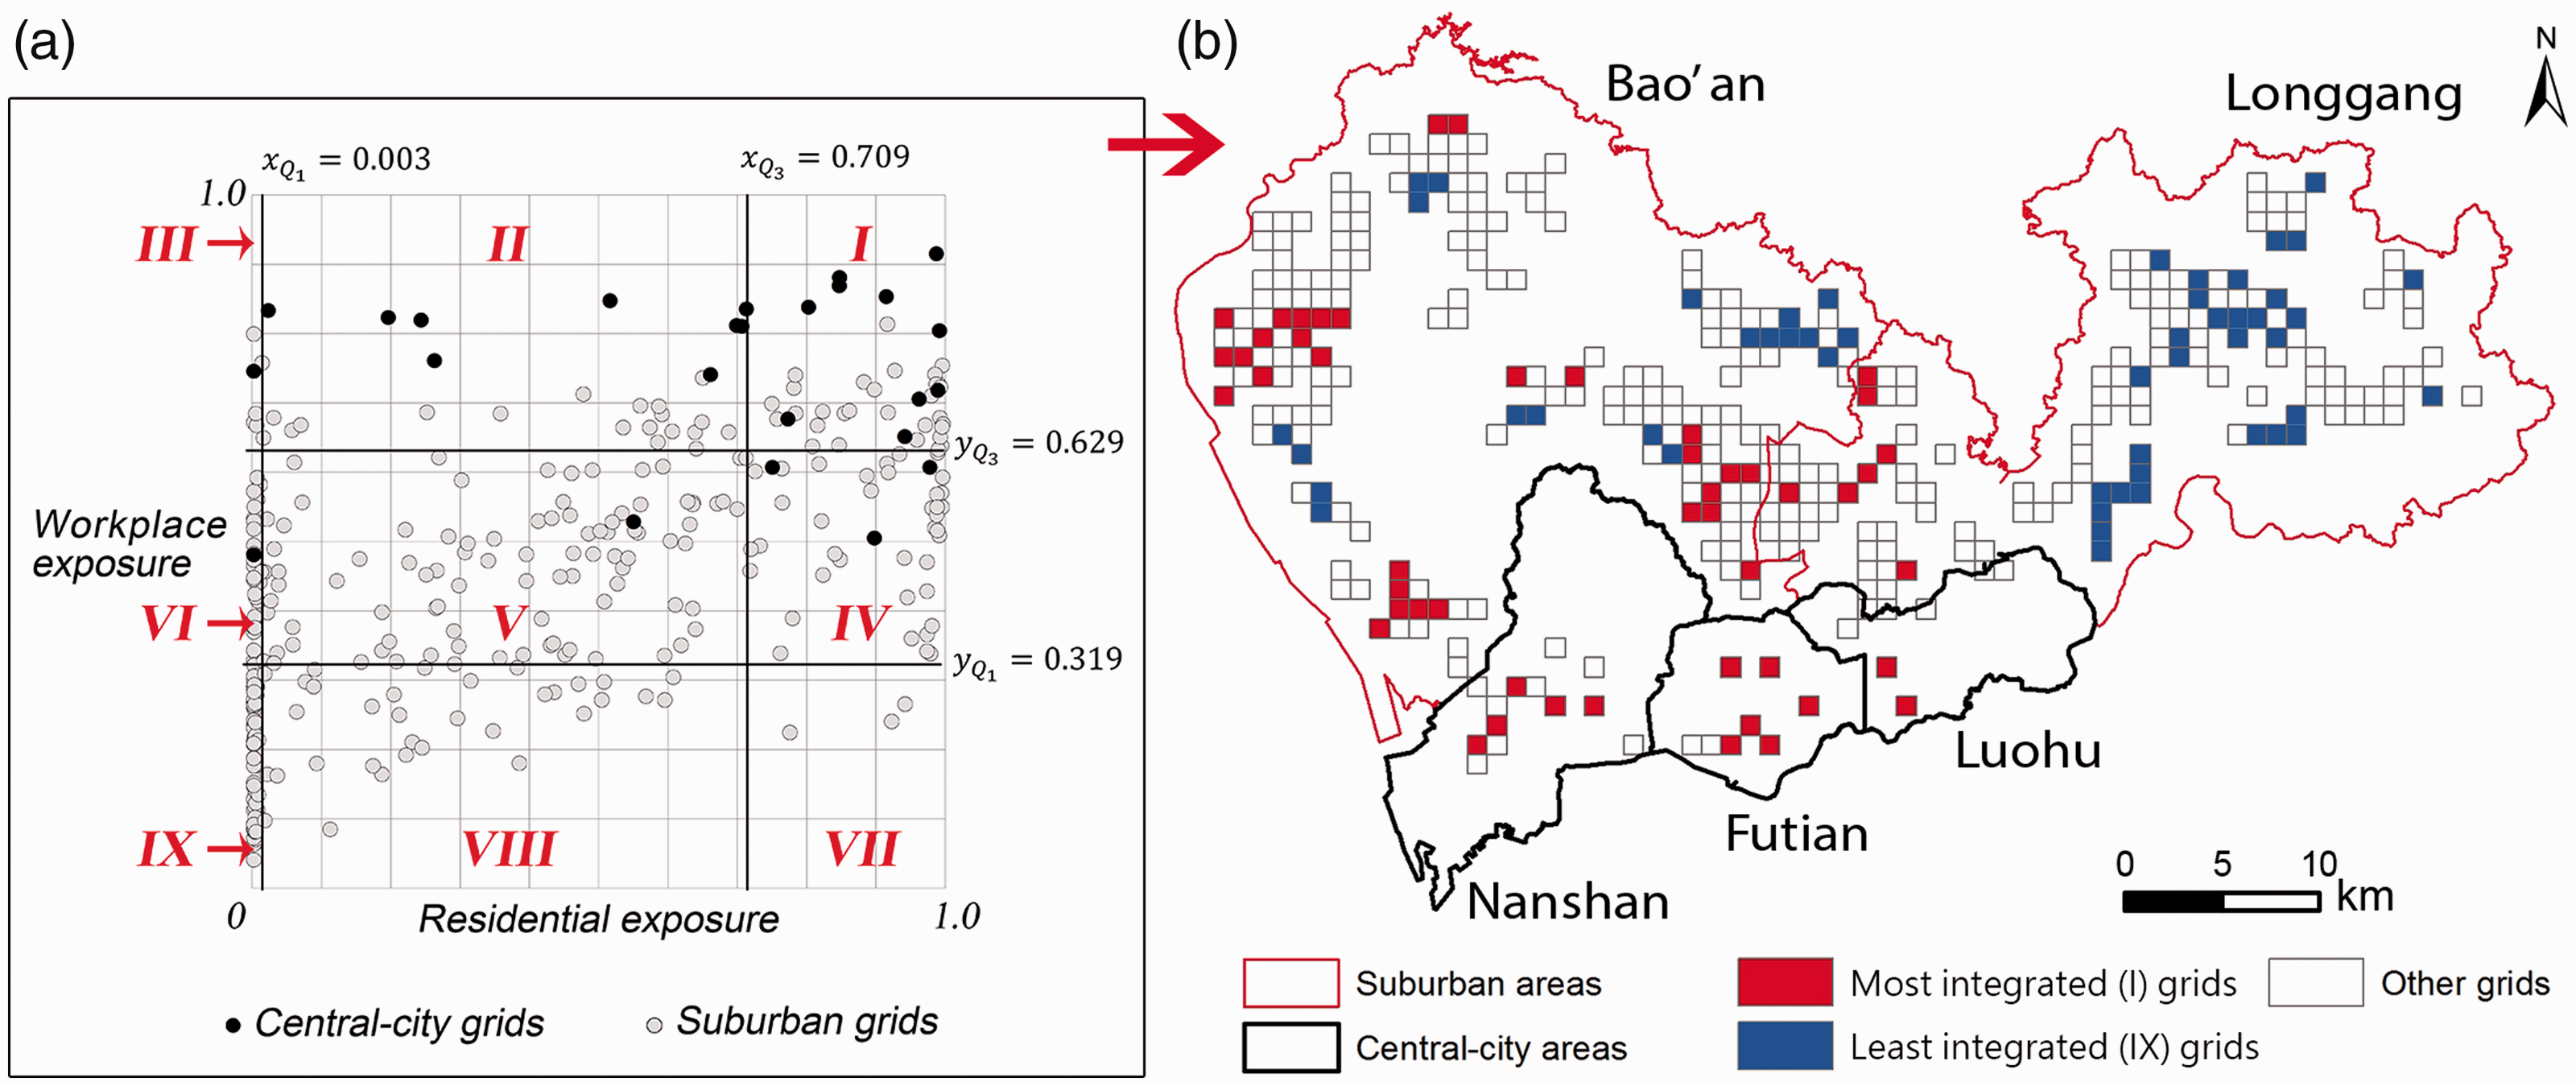
(a) Distribution of residential and workplace exposure and (b) spatial distribution of the most integrated grids and the least integrated grids.
The aforementioned findings suggest the presence of a certain group of rural migrants who experience fairly severe residential and workplace segregation from the other groups. To identify the group of rural migrants at high risk of residential and workplace segregation, we further categorize Figure 4 into nine quadrants by the quartile values of rural migrants’ residential and workplace exposures. Specifically, if the residential and workplace exposures of a rural migrant are both higher than the third quartile of all the samples, then she/he will be identified as belonging to the most advantaged group and will be categorized in the first quadrant (I). Similarly, if their residential and workplace exposures are both lower than the first quartile of all the samples, then they will be identified as belonging to the most disadvantaged group and will be categorized into the ninth quadrant (IX). Figure 5(a) depicts the classification of these nine quadrants, whereas Table 5 lists the statistical distribution of the quadrants.
The spatial distribution of the most integrated (Quadrant-I) and least integrated (Quadrant-IX) groups is shown in Figure 5(b). Most of the integrated grids (Quadrant-I) are in the central-city areas and some suburban neighborhoods adjacent to the central-city areas. The least integrated grids (Quadrant-IX) are all in the suburban areas, especially the northeast part of the city that is geographically distant from the central-city areas. These findings suggest that rural migrants living in the outer suburban areas have a high probability of being isolated from the local residents in residential neighborhoods and workplaces. Given that the opportunities of encountering other social groups (especially in the workplace) are essential in fostering social interaction and building a diverse social network (Pettigrew and Tropp, 2008), these segments of rural migrants are largely deprived of the opportunities of integration with other social groups compared with those living in the central-city areas.
Influencing factors of workplace exposure
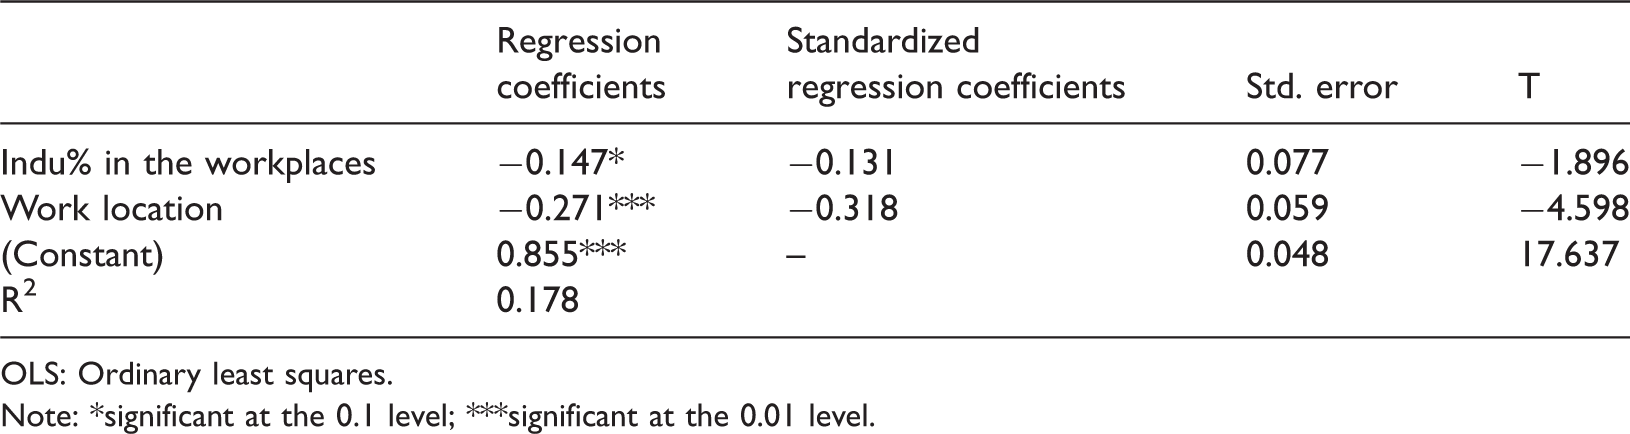
The OLS linear regression model is used to examine the influencing factors of rural migrant workplace exposure on the basis of the assumption that the workplace exposure is mainly affected by the job types that can be represented by Indu% in the workplace as well as the work location.
Table 6 shows that the hypothetical correlations are statistically significant in the model. Indu% in the workplace has a negative influence on workplace exposure, whereas work location has a negative impact on workplace exposure. This scenario suggests that being employed in manufacturing jobs may lead to less exposure to other social groups in their workplaces. The significant correlation between the job type and workplace segregation is consistent with our hypothesis. Meanwhile, the variable of work location may help us to distinguish the different effects of suburban and central service jobs. Among all the service-sector employees, those working in the suburban areas may experience lower workplace exposure.
Results of the OLS linear regression model.
OLS: Ordinary least squares.
Note: *significant at the 0.1 level; ***significant at the 0.01 level.
Discussion
The analysis based on the cellular network data validated most of our theoretical hypotheses. The percentage of the industrial floor area out of the total employment use floor area is positively correlated with workplace exposure. Therefore, rural migrants who work in manufacturing industries are less likely to be exposed to other social groups and are substantially segregated, whereas those employed in service jobs (especially producer service jobs) are likely to be exposed to highly privileged groups.
Moreover, rural migrants living or working in central-city areas experience higher workplace exposure than those in suburban areas. This can be explained in the following ways. (1) Rural migrants who live in central-city areas may be employed in service jobs that are not far from their residential neighborhoods to save housing and commuting costs. Living in central-city areas contributes to less workplace segregation through the mediator of employment in service sectors. (2) According to the results of the regression analysis, with job types (i.e. Indu%) being controlled, work locations still have significant effects on workplace exposure. This is mainly because, during working hours, local residents and migrants with high socio-economic status tend to be agglomerated in central-city areas, whereas suburban areas tend to be dominated by rural migrants. Accordingly, rural migrants who work in suburban areas may experience lower workplace exposure to other groups than those in central-city areas even though both groups are employed in service sectors.
Based on the findings and interpretations, we may argue that compared with rural migrants’ residences in suburban areas (especially the least integrated Quadrant-IX grids as revealed in Figure 5(b)), the migrant enclaves embedded in the central-city areas may play a positive role in alleviating the risk of segregation in workplaces. Specifically, the migrant enclaves in these areas allow rural migrants to get access to job opportunities (mostly service jobs) in the central-city areas with low commuting costs and allow for significant possibilities for exposure to highly privileged groups in their workplaces. The existence of migrant enclaves in the central-city areas is one of the main reasons why low-income residents in Chinese cities find getting access to jobs easier compared with those in the central cities in the West.
Conclusions
This study aims to examine workplace segregation of rural migrants living in urban villages using cellular network data in Shenzhen, China. We find that rural migrants who work in manufacturing industries in suburban areas are less likely to be exposed to other social groups and are more segregated, whereas those employed in service jobs (especially the producer service jobs in the central-city areas) are more likely to be exposed to higher social classes. Moreover, compared with suburban areas, rural migrants living or working in the enclaves of urban villages in the central-city areas may experience less segregation in workplaces. Urban villages in these areas do not only enable rural migrants to live close to higher social classes but also allows them access to job opportunities in the central-city areas (most of which are service jobs) with low commuting cost. Thus, they have profound chances to be exposed to other social groups in their workplaces and benefit from cross-group encounters. Hence, we argue that faster, more convenient, and affordable travel modes should be provided in urban villages that have low to least residential and workplace exposure (Quadrant-IX grids in Figure 5(b)) to enhance those residents’ accessibility to central-city areas for better social integration with other groups (e.g. to increase the density of transit routes connecting these neighborhoods to the central-city areas). In addition, urban villages that have high residential and workplace exposure (Quadrant-I in Figure 5(b)) should not be relocated. Upgrading these urban villages (i.e. improving the residential environment) is preferable to demolishing these enclaves to preserve the opportunities for low-income rural migrants to enjoy good accessibility and build social capital. However, such a policy option is also debatable as it may cause gentrification and these urban villages could be priced out of the market for rural migrants. In future studies, longitudinal observation or quasi-experiments, combined with in-depth questionnaire surveys, should be performed to verify whether the changes of accessibility in low-exposure areas (Quadrant-IX grids in Figure 5(b)) can help to enhance rural migrants’ social integration with local residents, as well as whether the opportunities of social integration of rural migrants are still preserved when the residential environment in the high-exposure areas (Quadrant-I in Figure 5(b)) is improved.
These findings affirm that shifting the analytical focus from residential places to workplaces may help us to achieve deeper insight into the socio-spatial segregation of an urban form through addressing the potential encounters outside residential neighborhoods. Urban villages, as migrant enclaves, play a significant role in shaping the unique patterns of socio-spatial segregation in Chinese cities compared with their Western counterparts, especially in the way that low-income rural migrants may benefit from the urban form of urban villages in central-city areas in terms of job accessibility and cross-group encounters.
In addition to providing new insights into rural migrants’ segregation in urban China, this study also presents new ways of applying big data to measure socio-spatial exposures. Big data, such as cellular network data, have a larger sample size than travel survey data and GPS data as well as provide workers’ journey-to-work trips from individuals’ perspective. Consequently, they can supplement the existing understanding about socio-spatial segregation primarily based on traditional data sets, such as travel survey data or GPS data. While studies with traditional data sets only used residential population as a proxy of the socio-economic composition in the activity places, this study has shown that the use of big data can effectively capture the dynamics of the population composition in the social context by knowing the location of the population in different time periods.
We need to address that higher exposure of rural migrants to other social groups does not necessarily lead to better social inclusion, as people from different social groups may co-exist and share the same public spaces without interacting with the other group in any meaningful way (Holland et al., 2007). However, physical co-presence with other groups does foster more opportunities of encounters and cross-group interaction, which has been found associated with positive attitudes toward migrants from local residents (Pettigrew and Tropp, 2008). Further studies will be undertaken in the future to confirm whether higher exposure to other social groups, through enhancing the opportunities of encounters and cross-group contact, contributes to better assimilation and integration into the mainstream society for rural migrants.
Another limitation is using only the cellular network data to measure and interpret segregation when such a data set does not contain information on residents’ socioeconomic attributes. This approach may limit the explanation of residential and workplace segregation. The present study relies on the residential locations (which are available from the cellular network data) to identify social groups. Although urban-village residents serve as a good proxy for rural migrants, as the latter constitute an overwhelming proportion of the former according to the 2010 census and CFPS-2010 data, there are still a few urban-village residents who do not belong to the rural-migrant group. Also, other socioeconomic attributes (e.g. income) that might also shape the variations of individual exposure are not considered in the present study due to the limited availability of such information. Moreover, the residences and workplaces of rural migrants and other social groups inferred from cellular network data are difficult to validate because obtaining their commuting trip information on that day is difficult. Future research should examine ways in which rural migrants and other social groups inferred from the cellular network data could be disaggregated accurately.
Footnotes
Declaration of conflicting interests
The author(s) declared no potential conflicts of interest with respect to the research, authorship, and/or publication of this article.
Funding
The author(s) disclosed receipt of the following financial support for the research, authorship, and/or publication of this article: The study is supported by National Natural Science Foundation of China (NSFC 41471378, 41801147), and Faculty of Architecture Research Output Prize Award, Chan To-Haan Endowed Professorship Fund, and Distinguished Research Achievement Award of the University of Hong Kong.